agent-based modeling and simulation in the dilemma zone · agent-based modeling and simulation in...
TRANSCRIPT

VASTO – Evolutionary Agent System for Transportation Outlook
Agent-Based Modeling and Simulation in
the Dilemma Zone
Federal Highway Administration
Publication No.: FHWA-HRT-15-082
Research, Development, and Technology Turner-Fairbank Highway Research Center
6300 Georgetown Pike McLean, VA 22101-2296
Exploratory Advanced Research Program

Foreword
Gaining an indepth understanding of drivers’ decisions and behaviors in dilemma zone situations will help State, county, and city transportation agencies to develop and deploy effective countermeasures to improve safety and reduce potential crashes at signalized intersections. This study’s objective is to develop a dilemma zone behavior model that considers the effects on drivers of certain factors found at signalized intersections, such as the presence of a pedestrian countdown signal, the presence of a red-light photo enforcement camera, and the actions of an adjacent vehicle. Federal Highway Administration’s (FHWA’s) Highway Driving Simulator was used to collect drivers’ responses as a function of speed limit and whether the driver was in a hurry. A dilemma zone behavior model was developed based on data collected in the driving simulation experiments via agent-based modeling and simulation. Results from the experiments suggested that sufficient external information, such as the presence of a red-light photo enforcement camera, can accurately predict the drivers’ decisions when they were confronted with the dilemma zone. The dilemma zone behavior model also takes into account the interactions between vehicles and provides realistic predictions of driver behaviors under various traffic conditions.
Monique R. Evans
Director, Office of Safety Research and Development
Notice
This document is disseminated under the sponsorship of the U.S. Department of Transportation in the interest of information exchange. The U.S. Government assumes no liability for the use of the information contained in this document.
The U.S. Government does not endorse products or manufacturers. Trademarks or manufacturers’ names appear in this report only because they are considered essential to the objective of the document.
Quality Assurance Statement
The FHWA provides high-quality information to serve Government, industry, and the public in a manner that promotes public understanding. Standards and policies are used to ensure and maximize the quality, objectivity, utility, and integrity of its information. FHWA periodically reviews quality issues and adjusts its programs and processes to ensure continuous quality improvement.

i
Technical Report Documentation Page
1. Report No.
FHWA-HRT-15-082
2. Government Accession No.
3. Recipient’s Catalog No.
4. Title and Subtitle
Agent-Based Modeling and Simulation in the Dilemma Zone
5. Report Date
December 2015
6. Performing Organization Code:
7. Author(s)
Sojung Kim, Young-Jun Son, Mary Anne Jeffers, Jason Williams, Yi-Chang Chiu
8. Performing Organization Report No.
9. Performing Organization Name and Address
University of Arizona, Tucson, AZ 85721 George Mason University, Fairfax, VA 22030 Leidos, Reston, VA 20190
Textron Systems/AAI Corporation, Hunt Valley, MD, 21030
10. Work Unit No.
11. Contract or Grant No.
12. Sponsoring Agency Name and Address
Federal Highway Administration Office of Safety Research and Development 6300 Georgetown Pike
McLean, VA 22101
13. Type of Report and Period Covered
Final Report
14. Sponsoring Agency Code
HRDS-30
15. Supplementary Notes
FHWA Contracting Officer’s Representative (COR): Dr. C. Y. David Yang
16. Abstract
The goal of this study is to develop a realistic dilemma zone (DZ) model that considers the effects of factors surrounding vehicles at an intersection, particularly focusing on driver decisionmaking behavior, such as the presence of a pedestrian countdown signal, a red-light photo enforcement camera, and the actions of an adjacent vehicle. The Federal Highway Administration’s Highway Driving Simulator (HDS) was used to collect drivers’ responses as a function of facility speed limit and whether the driver was in a hurry. From these responses, a DZ model was developed via agent-based modeling and simulation (ABMS) under the extended belief-desire-intention (E-BDI) framework. This framework represents uncertain perception and decision behaviors of humans in a probabilistic manner. To demonstrate and validate the proposed approach, the drivers’ actions under two circumstances were compared: (1) drivers only knew the approach speed and distance to the stop (i.e., internal information); and (2) drivers knew the internal information as well as external information, such as presence of a pedestrian countdown signal or presence of a red-light photo enforcement camera, and the behavior of an adjacent vehicle. The experiments indicate that sufficient external information could accurately predict the decisions of drivers and thus reduce the number of red-light violations that could potentially cause accidents at an intersection. In addition, the proposed E-BDI-based DZ model allowed us to consider the physical interactions between vehicles such that it provides realistic prediction results of drivers under various traffic conditions.
17. Key Words
dilemma zone, driving simulator, time pressure, driving in a hurry, red light photo enforcement camera, pedestrian countdown signal, adjacent vehicle, red-light running
18. Distribution Statement
No restrictions. This document is available to the public through the National Technical Information Service, Springfield, VA 22161.
19. Security Classif. (of this report)
Unclassified
20. Security Classif. (of this page)
Unclassified
21. No. of Pages
48
22. Price
N/A
Form DOT F 1700.7 (8-72) Reproduction of completed page authorized

ii
Table of Contents
1 Executive Summary .................................................................................................................. 1
2 Introduction.............................................................................................................................. 3
3 Overview of Research Methodology ........................................................................................ 5
4 DZ Data Collection Using a Highway Driving Simulator ........................................................... 7
4.1 Method ............................................................................................................................. 7
4.1.1 Experimental Design ................................................................................................. 7
4.1.2 Simulation ................................................................................................................. 8
4.1.3 Highway Driving Simulator ..................................................................................... 16
4.1.4 Participants ............................................................................................................. 17
4.1.5 Procedures .............................................................................................................. 17
4.1.6 Instructions ............................................................................................................. 18
4.2 Results ............................................................................................................................ 19
4.2.1 Influence of Motion Base ........................................................................................ 19
4.2.2 Driver Performance Measures ................................................................................ 19
4.2.3 Post-Participation Questionnaire ........................................................................... 23
5 Analysis Results ...................................................................................................................... 27
5.1 ABMS Scenario ............................................................................................................... 27
5.1.1 DZ Model ................................................................................................................. 27
5.1.2 E-BDI Framework .................................................................................................... 27
5.2 ABMS Model Calibration and Validation ........................................................................ 28
5.2.1 Calibration of BBN ................................................................................................... 28
5.2.2 Calibration of EDFT ................................................................................................. 30
5.3 Modeling Experiments ................................................................................................... 31
5.3.1 Low-Facility Speed Limit ......................................................................................... 32
5.3.2 High-Facility Speed Limit ......................................................................................... 34

iii
5.4 Discussions ..................................................................................................................... 37
6 Concluding Remarks ............................................................................................................... 39
7 References .............................................................................................................................. 41
Appendix A. Post-Participation Survey ......................................................................................... 43

iv
List of Figures
Figure 4-1: Image. Intersection indicating where pedestrians crossed.......................................... 9
Figure 4-2: Photograph. Driving simulator used for the study. .................................................... 16
Figure 4-3: Chart. Predicted probability of proceeding through a DZ intersection by degree of driving in a hurry and drive number. ............................................................................................ 21
Figure 4-4: Chart. Predicted probability of proceeding through a DZ intersection by presence of a red-light photo enforcement camera and drive number. ......................................................... 22
Figure 4-5: Chart. Percentage of participants who selected each factor that affected their decisions to run a red light in the real world. ............................................................................... 26
Figure 5-1: Image. Screenshot of simulation. ............................................................................... 27
Figure 5-2: Chart. Path model in SEM analysis. (9) ......................................................................... 29
Figure 5-3: Chart. BBN for E-BDI framework. (9) ............................................................................ 30
Figure 5-4: Equation. EDFT used in the DZ. (9) ............................................................................... 31
Figure 5-5: Chart. SD diagram of Group A (RedLightCam=no and PedCountSig=no). (9) .............. 32
Figure 5-6: Chart. SD diagram of Group A (RedLightCam=yes and PedCountSig=yes). (9) ............ 33
Figure 5-7: Chart. SD diagram of group D (RedLightCam=no and PedCountSig=no). (9)............... 35
Figure 5-8: Chart. SD diagram of group D (RedLightCam=yes and PedCountSig=yes). (9) ............ 35

v
List of Tables
Table 4-1: Order I description by scenario ID, signal phase, and values for independent factors. (9) ....................................................................................................................................... 11
Table 4-2: Order II description by scenario ID, signal phase, and values for independent factors. (9) ....................................................................................................................................... 12
Table 4-3: Order III description by scenario ID, signal phase, and values of independent factors. (9) ....................................................................................................................................... 13
Table 4-4: Order IV description by scenario ID, signal phase, and values of independent factors. (9) ....................................................................................................................................... 14
Table 4-5: Wald Type III statistics for GEE analysis of the probability of proceeding through a DZ intersection regarding the different design factors. .................................................................... 20
Table 4-6: Distribution of how often participants recalled other drivers running red lights in the real world (based on their respective definition of red-light running). ....................................... 25
Table 4-7: Distribution of how often participants recalled themselves running red lights in the real world (based on their respective definition of red-light running). ....................................... 25
Table 5-1: Standardized regression weights of driver groups. (9) ................................................. 29
Table 5-2: Weight vector of driver groups. ................................................................................... 31
Table 5-3: Summary of experiments (group A: 90 percent; group B: 10 percent). ...................... 33
Table 5-4: Summary of experiments (group A: 10 percent; group B: 90 percent). ...................... 34
Table 5-5: Summary of experiments (group C: 90 percent; group D: 10 percent). ...................... 37
Table 5-6: Summary of experiments (group C: 10 percent; group D: 90 percent). ...................... 37

vi
List of Abbreviations and Symbols
ABMS Agent-based Modeling and Simulation BBN Bayesian Belief Network CD/M2 Candela per Square Meter
CI Confidence Interval DZ Dilemma Zone E-BDI Extended Belief-Desire Intention EDFT Extended Decision Field Theory fL Foot-lambert GEE Generalized Estimating Equations HDS Highway Driving Simulator ITE Institute of Traffic Engineers KM/H Kilometers per Hour MI/H Miles per Hour NHTSA National Highway Traffic Safety Administration PRT Perception-Reaction Time SEM Structural Equation Modeling S-D Speed-Distance


1
1 Executive Summary
The dilemma zone (DZ) is an area in which a driver cannot stop gently before the stop line or clear the intersection safely before the red phase. (1) When decisions are made in the DZ, there could be a risk of a car crash, such as a rear end or right-angle crash. To mitigate the risk inherent in the DZ, many researchers have attempted to identify critical factors and develop a driver decisionmaking model. (1) The purpose of this study is to develop a realistic DZ model that considers the effects of surrounding factors at an intersection. The factors examined in the assessment of the influence of the road environment on driver decisionmaking behavior within the DZ simulation were:
Facility speed limit of the roadway (FacilitySpeed): Possible speed limits included 40 miles per hour (mi/h) (64.37 kilometers per hour (km/h)) and 55 mi/h (88.51 km/h). Each participant performed three drives, and each drive had the same posted speed limit.
Degree of driving in a hurry (InAHurry): Half of the participants were tasked to finish their drives within the expected completion time (18.5 minutes for the 55 mi/h (88.51 km/h) group and 22.5 minutes for the 40 mi/h (64.37 km/h) group).
Presence of a red-light photo enforcement camera at the intersection (RedLightCam): Red-light photo enforcement cameras were simulated at four of the DZ intersections and eight of the non-DZ intersections.
Presence of a pedestrian countdown signal at the intersection (PedCountSig): Pedestrian countdown signals were simulated at four of the DZ intersections and eight of the non-DZ intersections.
Behavior of an adjacent vehicle as the participant approaches the intersection (AdjVehBeh): An adjacent vehicle in the left lane (participant was in the right lane) was simulated for all DZ intersections and eight of the non-DZ intersections. The adjacent vehicle stopped at four of the DZ intersections and proceeded through the other four.
Participants were separated into four groups based on the facility speed limit and the degree of driving in a hurry. The four groups were: (1) group A had a 40 mi/h speed limit and did not drive in a hurry; (2) group B had a 40 mi/h speed limit and drove in a hurry; (3) group C had a 55 mi/h speed limit and did not drive in a hurry; and (4) group D had a 55 mi/h speed limit and drove in a hurry.
The Federal Highway Administration’s Highway Driving Simulator (HDS) was used to conduct experiments with licensed drivers (i.e., residents of the Washington, DC, metropolitan area, which includes the District of Columbia, southern Maryland, and Northern Virginia). The HDS used a late model compact car chassis providing acceleration, deceleration, handling, and braking functions, along with all audio (e.g., driving noise) and a 210-degree horizontal high-resolution visual scene. The experimental scenarios had 24 signalized intersections, 8 of which had signal changes intended to produce a DZ.

2
Ninety-nine licensed drivers provided useable data, 48 females (mean age 46 years, range 18–80) and 51 males (mean age 47 years, range 19–82).
Generalized estimating equations (GEE) with a binomial response distribution and logit link function were used to assess whether the probability of proceeding through a DZ intersection varied regarding the five factors (FacilitySpeed, InAHurry, RedLightCam, PedCountSig, and AdjVehBeh). The results showed that all factors influenced the drivers’ decisions. Participants in the 40 mi/h (64.37 km/h) speed condition had a higher probability of continuing through a DZ intersection than those in the 55 mi/h (88.51 km/h) speed condition. The probability of proceeding through a DZ intersection was greater for participants who were not tasked to drive in a hurry than for participants who were driving in a hurry. In addition, the probability of proceeding through a DZ intersection without a red-light photo enforcement camera increased across all drivers. The absence of a pedestrian countdown signal also increased the likelihood that participants continued through a DZ intersection. When an adjacent vehicle traveled through the intersection, participants were also more likely to proceed through a DZ intersection.
From these driver response findings in the HDS, a DZ model was developed via ABMS under the E-BDI framework, which represents the perception and decisionmaking behaviors of humans regarding an uncertain property by using probabilistic models.
(2) Four types of E-BDI-based DZ models were classified by the facility speed limit and the degree of being in a hurry. E-BDI-based DZ models were calibrated with two hypothetical constructs: internal information and external information. Internal information includes variables that depend on the vehicle’s approach speed (AppSpeed) and distance to the stop line (Distance), as set forth in the Institute of Traffic Engineers’ (ITE) DZ model. External information includes three environmental factors, i.e., RedLightCam, PedCountSig, and AdjVehBeh. Because both hypothetical attributes were unobserved during the experiments, i.e., they were latent variables, a structural equation modeling (SEM) approach was used to analyze the relative contributions of internal and external attributes on drivers’ decisions in a DZ. The results of the SEM were used to calibrate the E-BDI framework (i.e., E-BDI-based DZ model). Thus, the E-BDI-based DZ model was able to represent stopping and proceeding decisions of drivers from external and internal information.
The ABMS with E-BDI-based DZ model depicts the impact of external and internal information via a speed-distance (SD) diagram. In ABMS, driver agents’ stopping and proceeding decisions at the onset of the yellow phase were counted to create SD diagrams under different configurations of intersections. The results showed that the presence of a pedestrian countdown signal or a red-light photo enforcement camera mitigates the number of red-light violations. According to the post-participation survey of the drivers, drivers were able to predict the time of the traffic signal change via the remaining time of the pedestrian countdown signal so that they could make a clear decision at the intersection. In addition, when drivers were uncertain of their decisions, they followed the decisions of adjacent vehicles or tried to stop if a red-light photo enforcement camera existed on a roadway.

3
2 Introduction
For decades, driving safety has been a major concern in the traffic management domain because car accidents not only affect the performance of the traffic system but also inflict huge damage in terms of deaths and major injuries to humans. According to the National Highway Traffic Safety Administration (NHTSA), 23 percent of the 29,757 fatal crashes in the United States in 2012 were crashes related to intersections. (3) This is because a driver at an intersection needs to consider multiple options (e.g., stop, proceed, turn right, and turn left) with respect to the traffic situation within a short amount of time. (4) Therefore, many studies related to driving safety have focused on drivers’ behaviors at an intersection, aiming to reduce the risk of car crashes. One major concept is the dilemma zone (DZ), which is an area in which a driver cannot stop safely before the stop line or clear the intersection safely before the red phase. (1) Whatever decision is made in the DZ, there could be a risk of a car crash, such as a rear end or right-angle collision.
To reduce the risk inherent to the DZ, ITE recommended a DZ model (or Type I DZ) based on the approaching speed and distance to the stop line of a vehicle. (1) The Type I DZ is used to detect the DZ (xdz) if the vehicle’s approaching speed (V0) to an intersection is already known. The goal of the Type I DZ is to minimize the DZ by controlling the length of the yellow phase so that a driver can choose either to proceed or stop at the onset of the yellow phase (i.e., option zone). In the Type I DZ, the DZ (xdz) is detected by subtracting the minimum stopping distance (xc) from the maximum yellow passing distance (x0) at the onset of the yellow phase. To compute the minimum stopping distance (xc) and the maximum yellow passing distance (x0), the Type I DZ model includes the following factors: the approaching speed of the vehicle (V0), the maximum deceleration rate when stopping (a2), the maximum acceleration rate when proceeding (a1), the perception-reaction time of the driver (PRT) for proceeding (δ1) and stopping (δ2), the length of the yellow phase (τ), the width of the intersection (w), and the average vehicle length (L).
Nonetheless, due to the uncertainty of the human reasoning process, car crashes still occur, even when a driver is in the option zone. To study the uncertainty in driver decisions, a Type II DZ has been proposed, which considers the stopping probability of drivers at the onset of the yellow phase. (5) This approach defines the DZ as being from the position at which 90 percent of drivers stop to the position at which 10 percent of drivers stop, so that the uncertainty aspect of driver decisions can be covered. Similar to the Type I DZ, the Type II DZ can be eliminated by controlling the length of the yellow phase. However, because the Type II DZ focuses only on the results of observations (i.e., stopping and proceeding) without considering the factors that impact driver decisions, controlling the length of the yellow phase is considered the only way to minimize the number of car crashes caused in the Type II DZ. This focus means that the Type II DZ model is difficult to handle in the case in which drivers are affected by other factors, such as traffic conditions.
Drivers’ behaviors are affected by the surrounding environment, such as other vehicles’ movements or intersection conditions.

4
In a DZ, the drivers’ decisions are also influenced not only by their own condition (e.g., approaching speed and distance to the stop line of a vehicle) but also by the surrounding environment at an intersection. Gates et al. (6) claimed that the actions of vehicles in an adjacent lane affect drivers’ decisions in the DZ. Huey and Ragland (7) similarly showed that the pedestrian countdown signal made drivers’ behaviors more conservative (i.e., less likely to enter the intersection at the end of the yellow phase). A red-light photo enforcement camera is also known to be useful to mitigate red-light running by vehicles, thereby reducing the possibility of car crashes. (8)
Therefore, in this study, we developed a new DZ model that includes the effects of three surrounding factors (i.e., presence of a pedestrian countdown signal, presence of a red-light photo enforcement camera, and behavior of an adjacent vehicle) in addition to factors such as the subject vehicle’s approaching speed and distance to the stop line given by the Type I DZ model. The driver’s decision model is then developed by ABMS under the E-BDI framework, which is able to represent the uncertain decisionmaking behavior of drivers via probabilistic inference algorithms such as the Bayesian belief network. (9) (2)

5
3 Overview of Research Methodology
Our research efforts focused on two elements: (1) collecting human behavioral data via a driving simulator, and (2) modeling and analysis.
While collecting human behavioral data via a driving simulator, our first goal was to develop an experimental plan, which helps to understand the individual and interactive impacts of factors on output results with minimal experimental and systematic error. (10) The goal was to capture driver behavior in the DZ under a variety of conditions. An experimental plan was developed in collaboration with the University of Arizona, Leidos, and AAI, where the factors considered include the (1) facility speed limit of the roadway (FacilitySpeed), (2) degree of driving in a hurry (InAHurry), (3) presence of a red-light photo enforcement camera (RedLightCam), (4) presence of a pedestrian countdown signal (PedCountSig), and (5) behavior of an adjacent vehicle as the participant approaches the intersection (AdjVehBeh). The University of Arizona, in collaboration with researchers at AAI and Leidos, developed a simulation work plan that was used to collect human behavior data when encountering intersections via a driving simulator at Federal Highway Administration’s Turner-Fairbank Highway Research Center. More details about the simulation work plan can be found in section 4, and a video of the driving simulator is available at https://www.youtube.com/watch?v=vrJiVJaZW4g. (11)
The responses of participants in the driving simulation experiment were used to develop an ABMS under the E-BDI framework (see section 5.1.2). In addition to the five factors previously mentioned, two factors provided by the ITE DZ model were considered: a vehicle’s approaching speed (AppSpeed), and a vehicle’s distance to the stop line (Distance). More details of the experiment design can be found in section 5.
In terms of modeling and analysis, our first goal was to identify the essential factors relevant to drivers’ decisionmaking and to mimic their behavior when running into a yellow phase at intersections. To this end, an analysis of the DZ was conducted based on the responses of participants in the driving simulation experiment. Generalized estimating equations (GEE) with a binomial response distribution and logit link function were used to assess whether the probability of proceeding through a DZ intersection varied with respect to the five factors (i.e., FacilitySpeed, InAHurry, RedLightCam, PedCountSig, and AdjVehBeh). The second goal was to develop a DZ simulation model where drivers’ decisionmaking behaviors are represented in the E-BDI framework. (1) (12)
In addition to the five factors previously mentioned, two factors provided by the ITE DZ model were also considered, AppSpeed and Distance. To test the impact of these factors on drivers’ proceeding behavior when encountering a DZ, several microscopic traffic simulation experiments were conducted based on the constructed and validated ABMS model. More details of this work can be found in section 5.


7
4 DZ Data Collection Using a Highway Driving
Simulator
4.1 Method
4.1.1 Experimental Design
There were five design factors in this study: (1) facility speed limit, (2) degree of driving in a
hurry, (3) presence of a red-light photo enforcement camera, (4) presence of a pedestrian
countdown signal, and (5) presence and behavior of an adjacent vehicle. Each design element is
discussed in more detail below. For DZ intersections, the facility speed limit and degree of
driving in a hurry were between-group factors, while the presence of a red-light photo
enforcement camera, presence of a pedestrian countdown signal, and behavior of an adjacent
vehicle were within-group factors.
Facility speed of the roadway (FacilitySpeed): The two speed limits were 40 mi/h (64.37
km/h) and 55 mi/h (88.51 km/h). All drives completed by a participant had the same
posted speed limit.
Degree of driving in a hurry (InAHurry): Half of the participants were tasked to drive in a
hurry (as described in section 4.1.6). However, there was no change in the simulation
between those tasked with driving in a hurry and those not tasked with driving in a
hurry. All drives completed by a participant had the same degree of hurried driving.
Presence of a red-light photo enforcement camera at the intersection (RedLightCam):
Red-light photo enforcement cameras were simulated at four of the DZ intersections
and eight of the non-DZ intersections. The intersections with an enforcement camera
were appropriately signed (one 500 feet in advance of the intersection and one at the
intersection).
Presence of a pedestrian countdown signal at the intersection (PedCountSig): Pedestrian
countdown signals were simulated at four of the DZ intersections and eight of the non-
DZ intersections. Three to five simulated pedestrians crossed or prepared to cross in
each direction on the near crosswalk at both of the forced red phase intersections and
two of the forced green phase intersections. Pedestrians were included to make the
simulation appear more realistic to the driver and to mimic the possible threat of
pedestrians at the DZ intersections.
8
Behavior of an adjacent vehicle as the participant approaches the intersection
(AdjVehBeh): An adjacent vehicle in the left lane (participant was in the right lane) was
present for all DZ intersections and eight of the non-DZ intersections. The vehicle first
turned onto the simulated roadway from a left midblock side entrance. It accelerated to
overtake the participant’s vehicle and maintained a one-car-length lead on the
participant’s vehicle until the next signal.
The vehicle stopped at four of the DZ intersections and proceeded through the other
four. If the vehicle was supposed to stop, then it slowed, and the brake lights were
simulated 1 second after the onset of the yellow phase. The adjacent vehicle never
changed lanes and, in all cases, would turn off at the next midblock location following
the green phase of the intersection. In addition, for non-DZ intersections, the presence
of an adjacent vehicle was manipulated to expose participants to similar road conditions
between DZ and non-DZ intersections. Thus, participants would not know whether they
are at DZ intersections or not.
In addition to the aforementioned five factors, oncoming left-turn traffic was considered at
eight of the non-DZ green phase intersections to make the simulation appear more realistic to
the driver and to mimic the possible threat of a left-turning vehicle at the DZ intersections (in
fact, there was no left-turning vehicle at the DZ intersections). Three or four vehicles were
queued in the turn lane, with the first vehicle 328.08 feet (100.00 m) away from the
intersection. The first vehicle started to move when the participant was 21 seconds away from
the intersection. Each successive vehicle started to travel through the intersection 12 seconds
after the preceding one. Oncoming traffic traveled, on average, at a rate of 40 mi/h (64.37
km/h). Depending on how fast the participant drove, all, some, or none of these other vehicles
passed through the intersection. The oncoming traffic turned in the presence of the driver, but
did not interact with the driver in any way.
There are four groups specified by the between-group factors: (1) facility speed limit, and (2) degree of driving in a hurry. (9) The posted speed limit for groups A and B was 40 mi/h, and the posted speed limit for groups C and D was 55 mi/h. Participants in groups A and C drove as they normally would, and those in groups B and D drove in a hurry. A payoff matrix was used to motivate participants to drive in a hurry (see section 4.1.6). The manipulation of the within-group factors is discussed in more detail in section 4.1.2.
4.1.2 Simulation
The simulation consisted of a four-lane roadway (two lanes in each direction) with signalized intersections present every 0.6 mi (0.97 km). There was also a left turn lane for each direction of travel. Each lane was 12 feet (3.66 meters) wide.

9
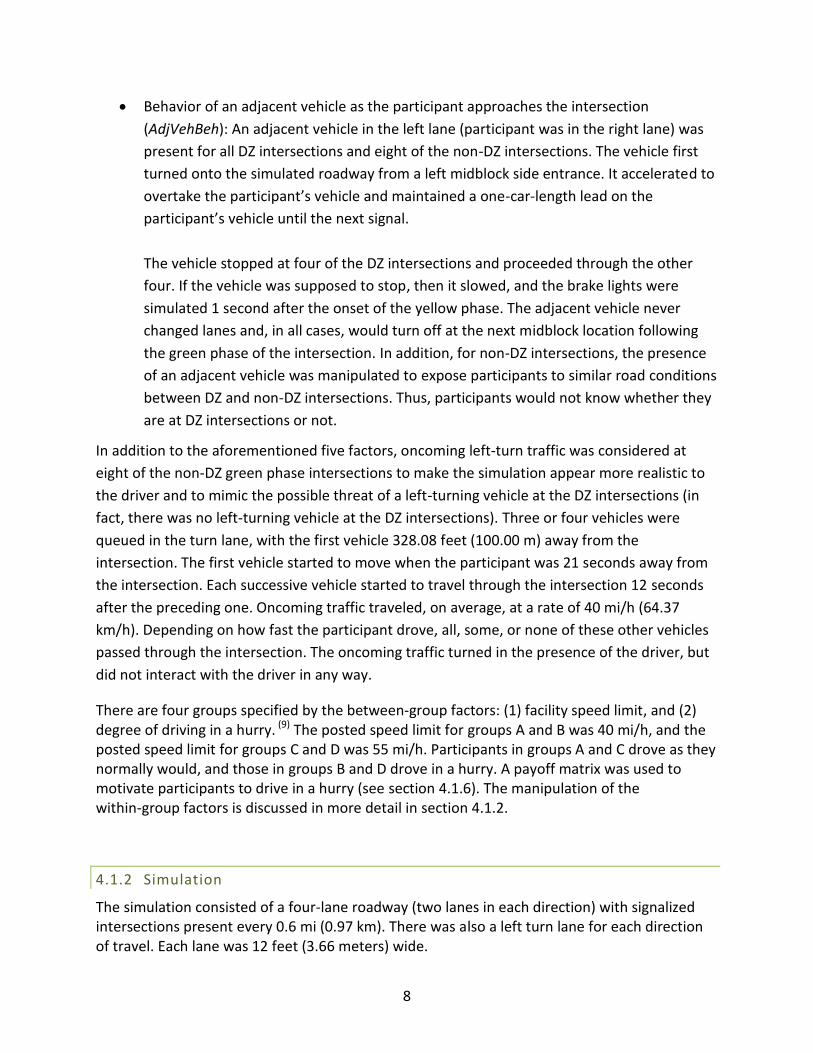
The total intersection width (from stop bar to stop bar, including crosswalks, shoulders, curbs, and sidewalks) was 193.55 feet (58.99 meters). The aforementioned configuration of the simulated intersection is shown in Figure 4-1, where from each direction the short white line represents the stop bar and the two longer white lines delineate the two sides of the crosswalk. The total mileage was approximately 14.5 mi (23.34 km) and the simulated environment resembled a suburban commercial area. Assuming participants would comply with the speed limit, for those participants who had a 40-mile-per-hour speed limit, the drive was approximately 22 minutes long without traffic signals and signal compliance (i.e., no stopping while driving). For those participants with a 55-mile-per-hour speed limit, the drive was approximately 16 minutes long, without traffic signals and signal compliance.
© AAI
Figure 4-1: Image. Intersection indicating where pedestrians crossed.
The posted speed limit follows the facility speed limit based on the group assignment, as stated in section 4.1.1 (i.e., 40 mi/h or 55 mi/h). Speed limit signs were posted once every three intersections in the simulation.

10
To make all participants maintain the posted speed limit, the driver of a vehicle going 8 mi/h over the speed limit received a speeding ticket ($0.50) after that participant’s drive (see section 4.1.6). There were 24 intersections in each drive. Eight of the intersections presented a DZ, and the remaining 16 intersections did not. Of the 16 non-DZ intersections, 2 were set to the red phase for all participants and the rest remained green throughout. The order of the 24 intersections within a drive was pseudorandom, and there were 4 different scenario orders (order I–order IV).
Table 4-1, (9) Table 4-2, (9) Table 4-3, (9)
and Table 4-4 (9) outline order I, order II, order III, and
order IV, respectively. One of the orders was randomly selected for each participant and the experiment was conducted according to the selected order. Therefore, the order of the intersections was different for each participant, but for any one participant, the same order was used for his or her drives. Within each of the groups (A–D), 6 of the 24 participants received each order (I, II, III, or IV). The same four scenario orders were replicated with the two speed limits (40 mi/h and 55 mi/h) for a total of eight different simulation designs.

11
Table 4-1: Order I description by scenario ID, signal phase, and values for independent factors. (9)
Position Scenario ID
Signal Phase
Red-light
camera
Pedestrian Countdown
Signal
Adjacent Vehicle
Oncoming Left-Turn
Traffic
1 12 Green Yes Yes (no Peds) No Yes
2 18 Red No Yes (with Peds) Stop No
3 4 Dilemma No No Stop No
4 13 Green Yes No Go No
5 2 Dilemma Yes No Stop No
6 23 Green No No No Yes
7 9 Red Yes Yes (with Peds) Stop No
8 5 Dilemma Yes Yes Go No
9 19 Green No Yes (no Peds) No Yes
10 16 Green Yes No No Yes
11 22 Green No No Go No
12 7 Dilemma No Yes Go No
13 20 Green No Yes (with Peds) No No
14 10 Green Yes Yes (no Peds) Go Yes
15 1 Dilemma Yes Yes Stop No
16 21 Green No No Go Yes
17 3 Dilemma No Yes Stop No
18 15 Green Yes No No No
19 17 Green No Yes (no Peds) Go Yes
20 11 Green Yes Yes (with Peds) No No
21 8 Dilemma No No Go No
22 24 Green No No No No
23 6 Dilemma Yes No Go No
24 14 Green Yes No Go Yes

12
Table 4-2: Order II description by scenario ID, signal phase, and values for independent factors. (9)
Position Scenario ID
Signal Phase
Red-light
camera
Pedestrian Countdown
Signal
Adjacent Vehicle
Oncoming Left-Turn
Traffic
1 16 Green Yes No No Yes
2 9 Red Yes Yes (with Peds) Stop No
3 7 Dilemma No Yes Go No
4 19 Green No Yes (no Peds) No Yes
5 5 Dilemma Yes Yes Go No
6 23 Green No No No Yes
7 22 Green No No Go No
8 3 Dilemma No Yes Stop No
9 20 Green No Yes (with Peds) No No
10 10 Green Yes Yes (no Peds) Go Yes
11 21 Green No No Go Yes
12 1 Dilemma Yes Yes Stop No
13 24 Green No No No No
14 11 Green Yes Yes (with Peds) No No
15 6 Dilemma Yes No Go No
16 17 Green No Yes (no Peds) Go Yes
17 8 Dilemma No No Go No
18 15 Green Yes No No No
19 14 Green Yes No Go Yes
20 12 Green Yes Yes (no Peds) No Yes
21 2 Dilemma Yes No Stop No
22 18 Red No Yes (with Peds) Stop No
23 4 Dilemma No No Stop No
24 13 Green Yes No Go No

13
Table 4-3: Order III description by scenario ID, signal phase, and values of independent factors. (9)
Position Scenario ID
Signal Phase
Red-light
camera
Pedestrian Countdown
Signal
Adjacent Vehicle
Oncoming Left-Turn
Traffic
1 20 Green No Yes (with Peds) No No
2 18 Red No Yes (with Peds) Stop No
3 1 Dilemma Yes Yes Stop No
4 21 Green No No Go Yes
5 3 Dilemma No Yes Stop No
6 15 Green Yes No No No
7 17 Green No Yes (no Peds) Go Yes
8 8 Dilemma No No Go No
9 11 Green Yes Yes (with Peds) No No
10 24 Green No No No No
11 14 Green Yes No Go Yes
12 6 Dilemma Yes No Go No
13 12 Green Yes Yes (no Peds) No Yes
14 10 Green Yes Yes (no Peds) Go Yes
15 4 Dilemma No No Stop No
16 13 Green Yes No Go No
17 2 Dilemma Yes No Stop No
18 23 Green No No No Yes
19 9 Red Yes Yes (with Peds) Stop No
20 19 Green No Yes (no Peds) No Yes
21 5 Dilemma Yes Yes Go No
22 16 Green Yes No No Yes
23 7 Dilemma No Yes Go No
24 22 Green No No Go No

14
Table 4-4: Order IV description by scenario ID, signal phase, and values of independent factors. (9)
Position Scenario ID
Signal Phase
Red-light
camera
Pedestrian Countdown
Signal
Adjacent Vehicle
Oncoming Left-Turn
Traffic
1 12 Green Yes Yes (no Peds) No Yes
2 9 Red Yes Yes (with Peds) Stop No
3 6 Dilemma Yes No Go No
4 24 Green No No No No
5 8 Dilemma No No Go No
6 11 Green Yes Yes (with Peds) No No
7 14 Green Yes No Go Yes
8 2 Dilemma Yes No Stop No
9 13 Green Yes No Go No
10 23 Green No No No Yes
11 18 Red No Yes (with Peds) Stop No
12 4 Dilemma No No Stop No
13 20 Green No Yes (with Peds) No No
14 22 Green No No Go No
15 7 Dilemma No Yes Go No
16 16 Green Yes No No Yes
17 5 Dilemma Yes Yes Go No
18 19 Green No Yes (no Peds) No Yes
19 10 Green Yes Yes (no Peds) Go Yes
20 21 Green No No Go Yes
21 3 Dilemma No Yes Stop No
22 15 Green Yes No No No
23 1 Dilemma Yes Yes Stop No
24 17 Green No Yes (no Peds) Go Yes
The distance at which DZs were triggered depended on the facility speed limit. For the 40 mi/h (64.37 km/h) case, the DZ triggered when the driver was 852.30 feet (259.78 m) from the stop bar, and the signal turned yellow 10 seconds later. The yellow phase lasted 4 seconds, and the red phase lasted 38 seconds. For the 55 mi/h (88.51 km/h) case, the DZ triggered when the driver was 812.20 feet (247.56 m) from the stop bar, and the signal turned yellow 5 seconds later. The yellow phase lasted 5 seconds, and the red phase lasted 15 seconds.
The duration of the yellow phase in both cases met the traffic signal control guideline (i.e., yellow change interval) established in the Traffic Engineering Handbook. (13) The period of time from when the DZ was triggered until the onset of the yellow phase incorporated the pedestrian countdown signal timing.

15
The pedestrian countdown started at 9 seconds to the stop bar for the 40 mi/h (64.37) drive and 4 seconds to the stop bar for the 55 mi/h (88.51 km/h) drive.
Oncoming left-turn traffic was present for half (8) of the non-DZ intersections; there was no oncoming traffic at DZ intersections (see Table 4-1 for a more detailed description). There was also no oncoming traffic at the forced red phase intersections. For forced green phase intersections, left-turning vehicles crossed through the intersection before the driver entered the intersection. These vehicles were included to make the simulation appear more realistic to the driver and to mimic the possible threat of a left-turning vehicle at the DZ intersections. The oncoming traffic turned in the presence of the driver but did not interact with the driver in any way. There were three to five pedestrians crossing in each direction on the near crosswalk (see Figure 4-1) at both of the forced red phase intersections and two of the forced green phase intersections; there were no pedestrians at DZ intersections. Pedestrians were included to make the simulation appear more realistic to the driver.
Regardless of whether a DZ was present, the designs of the red-light photo enforcement camera and pedestrian countdown signal were the same. The intersections with a red-light photo enforcement camera were appropriately signed; the signal warning sign (W3-3) (14) mounting the photo-enforced plaque (W16-10P) (14) was displayed in advance of the intersection (i.e., 500 feet), and the red-light photo enforced sign (R10-19-DE) (14) was displayed at the intersection. The light-emitting diodes (LED) pedestrian countdown signal (14) was located at the intersection.

16
4.1.3 Highway Driving Simulator
The HDS consisted of a late model compact car chassis mounted inside a section of a cylindrical projection screen. The car was instrumented so that normal driver functions, visual scenes, and audio were interactive.
Figure 4-2: Photograph. Driving simulator used for the study.
The cylindrical screen had a horizontal radius of 107 inches (271.78 cm) and a vertical height of 95 inches (241.30 cm). It wrapped around the center (also known as the eye point) for a total of 240 degrees. When looking at the center of the projections, the driver’s eye point was between 0 and 8 inches (20.32 cm) to the rear from the center of the cylinder. Three BARCO SIM10 liquid crystal on silicon digital projectors, each with a resolution of 4,096 by 2,400 pixels, provided the screen image. The luminance of each projector was measured three times. Across the three projectors, the mean luminance was 41.62 foot-lambert (fL); (142.60 candela per square meter
(cd/m2), with a range from 40.86 fL (140.00 cd/m2) to 42.26 fL (144.79 cd/m2). The combined image of the 3 projectors covered 200 degrees around the center of the screen. A cluster of personal computers with high-resolution graphics cards were used for rendering the scene image and controlling the real-time scenario. The system updated at a rate of 60 Hertz. The setup of the HDS is shown in Figure 4-2.
4.1.3.1 Post-Participation Questionnaire
Participants completed a questionnaire after their final drive. The questionnaire was administered through MediaLab® software on a laptop computer. On the questionnaire, participants answered questions regarding whether they stopped at or proceeded through the DZ intersections and why, and whether they noticed or were influenced by the red-light photo enforcement cameras, pedestrian countdown signals, and adjacent vehicles.

17
For the purposes of the questionnaire, DZ intersections were defined as follows: “During each of the simulated drives, some of the traffic signals turned to yellow as you were approaching the intersection. Consider your behavior at these intersections (whether you stopped at or proceeded through the intersection) for the remaining questions.” Followup questions regarding red-light running behaviors in the real world were also included. The specific wording for each question is in Appendix A. Post-Participation Survey.
4.1.4 Participants
Originally, 24 participants for each group (A–D) were planned to be recruited in this study. However, considering a 25 percent dropout rate due to simulator sickness, 121 participants were recruited and began testing. Participants were between 18 and 72 years of age, with roughly equal numbers of younger (44 years or younger) and older (45 years or older) drivers in each group. Additionally, there were roughly equal numbers of male and female drivers in each group. All participants had a valid driver’s license. Based on the possession of a license, visual acuity was assumed to be at least 20/40 (corrected, if necessary) in at least one eye. Of 121 participants, 19 drivers chose to discontinue due to simulator sickness. Two drivers were forced to discontinue due to problems with the simulator, and one driver was removed from the study due to erratic driving behaviors and rule breaking. The remaining 99 participants (51 males) completed the study. Therefore, responses of the 99 participants were used in this study.
The HDS was also equipped with a six-degree-of-freedom (tilt, roll, and yaw) motion base. The motion base was turned on for approximately the first month of data collection and then turned off to mitigate high rates of simulator sickness. Of those who completed the study, 29 participants drove the study with the motion base turned on, and 70 participants drove the study with the motion base turned off. Participants were also split by age group, either younger (44 years or younger) or older (45 years or older). Approximately half of the participants fell into each age group. The mean age of the males was 47 years (range 19 to 82 years), and the mean age of the females was 46 years (range 18 to 80 years).
4.1.5 Procedures
Each participant completed a practice drive to become acquainted with the simulator. The practice drive includes four intersections with two green and two red signals. The practice roadway mirrored what was used in the test drives, but no manipulations (e.g., pedestrian countdown signals and red-light photo enforcement cameras) were present. No dilemma zones were introduced in the practice drive. If participants had become familiar with the yellow phase timing during the practice drive, they could have made decisions (i.e., accelerate or decelerate their vehicles) before a traffic signal turned to the yellow phase in order to avoid dilemma zones. The signals in the practice drive mimicked the time and duration of the signals used in the test drives. Each participant was instructed to proceed through two green signals and stop at two red signals. If the researcher believed the participant was having trouble with controlling the vehicle on the driving simulator, then the researcher asked the participant to continue until a higher level of comfort was achieved.

18
Next, the participants completed a series of three drives. Each drive (a series of 24
intersections) lasted approximately 16 to 22 minutes, depending on the posted facility speed
(40 mi/h or 55 mi/h) and the number of times the driver stopped at the DZ intersections.
Participants took a short break between drives and were asked to complete a simulator
sickness questionnaire so that symptoms of simulator sickness could be monitored. (15) After the
third drive, researchers administered the post-participation questionnaire.
4.1.6 Instructions
Researchers verbally informed participants of the instructions before each drive, including before the practice drive. All participants were reminded of the posted speed limit and were asked to stay in the right lane and not change lanes. Participants were offered a $10 bonus, as described below, in addition to the $80 they received for participation. (16)
To advise participants of aerial speed enforcement and red-light photo enforcement in the scenarios, researchers read the following to the participants:
“You have been told by a friend that this road has aerial speed enforcement. Your friend received a ticket for going 8 miles per hour over the speed limit. If you receive a speeding ticket, you will be charged a fee of $1 from your overall bonus amount.
There will also be red-light photo enforcement at some of the intersections. The red-light photo enforcement camera is triggered if your vehicle enters the intersection after the signal has turned to red. If you commit a red-light violation at these intersections, then you will lose $0.50 per violation from your overall bonus amount.”
If the drivers were to be in a hurry, then researchers also read the following to advise them of penalties if they did not meet their expected completion time (18.5 minutes for the 55 mi/h (88.51 km/h) group and 22.5 minutes for the 40 mi/h (64.37 km/h) group).
“You are running late for a doctor’s appointment. If you finish the simulation in __ minutes, then you will arrive on time for the appointment. However, if you arrive late for the appointment, then you will be charged a late fee of $1 from your overall bonus amount.”
As listed above, deductions occurred if drivers were late or speeding. For the speeding deduction in the 40 mi/h (64.37 km/h) case, participants needed to drive 45 mi/h (72.42 km/h) or more for at least 30 seconds. For the speeding deduction in the 50 mi/h (88.51 km/h) case, participants needed to drive 60 mi/h (96.56 km/h) or more for at least 20 seconds.
In addition, drivers received a $1 deduction if they changed lanes. Participants were not penalized beyond the $10 bonus they were originally offered.

19
4.2 Results
4.2.1 Influence of Motion Base
One concern was whether it was appropriate to combine data from participants who completed the study with the motion base turned on with those who did not. It was believed that this particular study would have a high simulator sickness rate because of the many stops. Given that the inclusion of the motion may have increased the severity and frequency of simulator sickness, one may hypothesize that drivers would, over time, start to proceed through the yellow signal phase to avoid stopping. In other words, the probability of proceeding through a DZ intersection would increase across the three drives.
Generalized estimating equations (GEE) with a binomial response distribution and logit link function were used to determine whether the probability of proceeding through a DZ intersection changed over time for those drivers who completed the study with the motion base turned on and those who completed it with the motion base turned off. The predictors in the model were motion, drive number, and the interaction between the two. Wald Type III statistics indicated that the drive number was the only significant effect with 95 percent confidence interval (CI); χ2 (2) = 9.69, p = 0.0078. Both motion and the interaction of motion with drive number were not significant. Therefore, it was deemed appropriate to combine the two groups.
4.2.2 Driver Performance Measures
GEEs with a binomial response distribution and logit link function were used to determine whether the probability of proceeding through a DZ intersection varied regarding the different design factors. An exchangeable correlation structure was assumed. Due to the limited number of observations from 99 participants, only second-order interaction effects were considered. The drive number, which significantly affected the probability of a driver proceeding through a DZ intersection in the previous analysis, was selected as the interaction factor with other factors. Thus, the predictors in the model were facility speed limit (FacilitySpeed), degree of driving in a hurry (InAHurry), presence of a red-light photo enforcement camera (RedLightCam), presence of a pedestrian countdown signal (PedCountSig), behavior of the adjacent vehicle (AdjVehBeh), drive number (Drive), and all second-order interactions with the drive number. Wald Type III statistics for this analysis are shown in Table 4-5. Significant effects with 95 percent CI, printed in boldface red, are discussed in more detail in the following sections.

20
Table 4-5: Wald Type III statistics for GEE analysis of the probability of proceeding through a DZ intersection regarding the different design factors.
Wald Statistics For Type 3 GEE Analysis
Source DF Chi-Square Pr > ChiSq Significant Effects with 95% CI?
FacilitySpeed 1 6.78 0.0092 Yes
InAHurry 1 36.69 <0.0001 Yes
RedLightCam 1 4.30 0.0380 Yes
PedCountSig 1 36.86 <0.0001 Yes
AdjVehBeh 1 8.28 0.0040 Yes
Drive 2 0.67 0.7136 No
Drive*FacilitySpeed 2 1.55 0.4601 No
Drive*InAHurry 2 8.94 0.0114 Yes
Drive*RedLightCam 2 10.55 0.0051 Yes
Drive*PedCountSig 2 1.24 0.5379 No
Drive*AdjVehBeh 2 1.68 0.4319 No
4.2.2.1 Between-Group Factors
There were two between-group design factors: facility speed limit (FacilitySpeed) and degree of driving in a hurry (InAHurry). The main effects for both were significant, and the interaction of the drive number with degree of driving in a hurry was also significant.
Participants in the 40 mi/h (64.37 km/h) speed condition had a higher probability of continuing through a DZ intersection (M = 0.43 with a 95 percent CI of [0.31, 0.56]) than those in the 55 mi/h (88.51 km/h) speed condition (M = 0.25 with a 95 percent CI of [0.17, 0.36]). There are at least two possible rationales for this. First, participants most likely knew from their real-world driving experience that it would take longer to come to a complete stop when traveling at 55 mi/h (88.51 km/h). Thus, these drivers may have anticipated the need to stop and been more conscientious in taking notice and being cautious when the signal changed from green to yellow. Second, based on the developed signal timing (see section 4.1.1), participants in the 55 mi/h (88.51 km/h) speed condition had approximately 0.9 seconds longer to come to a complete stop than their slower counterparts. The time to a complete stop is 3.4 seconds in the 40 mi/h zone and 4.3 seconds in the 55 mi/h zone when the perception reaction time (PRT) is 1 second. Although this was consistent with the physics needed to stop a car traveling at higher speeds, it may have allowed participants more time to come to a complete stop at the DZ intersections; thus, these drivers may have been more willing to stop.

21
Figure 4-3: Chart. Predicted probability of proceeding through a DZ intersection by degree of driving in a hurry and drive number.
As shown in Figure 4-3, participants who were not tasked to drive in a hurry were fairly consistent in each drive in their probability of proceeding through a DZ intersection (M = 0.11 with 95 percent CI of [0.05, 0.22] at the first drive; M = 0.11 with 95 percent CI of [0.06, 0.20] at the second drive; and M = 0.13 with 95 percent CI of [0.06, 0.23] at the third drive). The bars in Figure 4-3 represent the 95 percent CI of each case. Conversely, participants who were in a hurry increased their probability of continuing through a DZ intersection from the first drive (M = 0.42 with 95 percent CI of [0.29, 0.57]), to the second drive (M = 0.58 with 95 percent CI of [0.44, 0.71]), and again to the third drive (M = 0.63 with 95 percent CI of [0.49, 0.75]). This outcome could perhaps be due to the financial penalty described to participants by the researchers and incorporated into the research procedure to create pressure for the drivers to finish the drive in a certain amount of time. The greatest increase in the probability of proceeding occurred between the first and second drives (a difference of 0.16). Additionally, 94 percent of the in-a-hurry drivers (InAHurry) received a financial penalty after the first drive because they were late for their doctor’s appointment. In comparison, only 68 percent of the participants received a financial penalty after the second drive. Between the second and third drives, the probability of proceeding increased by only 0.05. These results imply that the financial penalty described by the researchers succeeded in creating time pressure for the drivers, and being in a hurry significantly increased the probability of a driver proceeding through a DZ intersection. Even on the first drive, participants who were in a hurry were four times more likely to continue through the intersection than their nonpressured counterparts.
0
0.1
0.2
0.3
0.4
0.5
0.6
0.7
0.8
0.9
1
1 2 3
Pre
dic
ted
Pro
bab
ility
of
Pro
cee
din
g
Drive Number
Not in a hurry
In a hurry

22
4.2.2.2 Within-Group Factors
There were three within-group design factors: presence of a red-light photo enforcement camera (RedLightCam), presence of a pedestrian countdown signal (PedCountSig), and behavior of an adjacent vehicle (AdjVehBeh). All three main effects were significant, and the interaction of the drive number with the presence of an enforcement camera was also significant.
Figure 4-4: Chart. Predicted probability of proceeding through a DZ intersection by presence of a red-light photo enforcement camera and drive number.
As the interaction term with the presence of a red-light photo enforcement camera was significant, the corresponding main effect will not be discussed. The results are displayed in Figure 4-4 where the bars represent the 95 percent CI of each case. For those intersections where an enforcement camera was present, the probability of proceeding increased from the first drive (M = 0.27 with 95 percent CI of [0.17, 0.40]) to the second (M = 0.37 with 95 percent CI of [0.26, 0.48]), but then plateaued and remained constant during the third drive (M = 0.36 with 95 percent CI of [0.26, 0.47]). In comparison, for intersections without a red-light photo enforcement camera, the probability of continuing through a DZ intersection increased across all drives (M = 0.28 with 95 percent CI of [0.18, 0.41] at the first drive; M = 0.35 with 95 percent CI of [0.25, 0.46] at the second drive; and M = 0.42 with 95 percent CI of [0.31, 0.54] at the third drive). During data collection, red-light violations were noted if a participant entered the intersection following the onset of the red phase. However, only three violations occurred among all participants, and the violations were for different people. Drivers were perhaps at first wary of receiving a fine for a red-light violation, but then became more attentive to the placement of the red-light photo enforcement cameras as they became familiar with the simulated scenario.
0
0.1
0.2
0.3
0.4
0.5
0.6
0.7
0.8
0.9
1
1 2 3
Pre
dic
ted
Pro
bab
ility
of
Pro
cee
din
g
Drive Number
No photo enforcement
Photo enforcement

23
The probability of proceeding was greater for those intersections without a pedestrian countdown signal (M = 0.41 with 95 percent CI of [0.30, 0.54]) than for those with the countdown signal (M = 0.57 with 95 percent CI of [0.18, 0.38]).
The probability of continuing was greater when the adjacent vehicle also traveled through the intersection (M = 0.36 with 95 percent CI of [0.25, 0.48]) than when it stopped at the signal (M = 0.32 with 95 percent CI of [0.23, 0.44]).
4.2.3 Post-Participation Questionnaire
4.2.3.1 Behavior at DZ Intersections
Two questions were asked to gather information on whether participants stopped at or proceeded through the DZ intersections (see questions 1 and 2 in Appendix A. Post-Participation Survey for more details).
Ninety-eight percent of the participants recalled stopping at least once at a DZ intersection. The reasons participants gave for stopping at the DZ intersections were classified into the following categories: adjacent vehicle related; experiment related (e.g., feeling of being watched); normal driving (e.g., rule-following behaviors); pedestrian related; red-light photo enforcement camera related; and signal timing related. The modal categories were pedestrian related (39 percent) and signal timing (31 percent). Pedestrian-related rationales included the presence of the pedestrian countdown signal (63 percent). Signal-timing rationales included the impending onset of the red phase (33 percent), the distance to the intersection at the onset of the yellow phase (27 percent), the length of the yellow phase (20 percent), and the onset of the yellow phase (20 percent).
Sixty-eight percent of the participants recalled proceeding through at least one DZ intersection. The reasons for continuing through DZ intersections were classified into the following categories: to avoid a potential collision; environmental factors (e.g., pedestrian countdown signal; adjacent vehicle); being in a hurry; being inattentive; confidence in crossing the intersection before the onset of the red phase; and distance to the intersection at the onset of the yellow phase. The modal categories were the distance to the intersection at the onset of the yellow phase (40 percent) and confidence in crossing the intersection before the onset of the red phase (27 percent). Only six percent of the participants cited the pedestrian countdown signal or the adjacent vehicle in their rationales. In addition, approximately 10 percent of the participants provided answers indicating that they may have misunderstood the question.
4.2.3.2 Red-Light Photo Enforcement Camera Influence
Question 3 was asked to gather information on whether participants noticed the red-light photo enforcement camera and, if so, whether the presence of the enforcement camera influenced their behavior (see Appendix A. Post-Participation Survey).

24
Approximately 75 percent of the drivers claimed to have run a red light in the real world at least once. Of these individuals, the most common reason for doing so was because they could not stop in time.
Fifty-five percent of the participants noticed the red-light photo enforcement camera present at some of the intersections. The following results reflect responses only from these drivers.
Fifty-four percent of the participants believed the presence of the enforcement camera influenced their behavior at the DZ intersections. Additionally, 94 percent of these drivers thought that their behaviors in response to the enforcement camera mimicked what they would have done in the real world. Participants were asked to rate, on a scale from 1 (not at all influenced) to 10 (extremely influenced), how much the red-light photo enforcement camera influenced their decision at the DZ intersections. The mode was 10, and the median rating was 5.5.
4.2.3.3 Pedestrian Countdown Signal Influence
Question 4 was asked to gather information on whether participants noticed the pedestrian countdown signal and, if so, whether the presence of the pedestrian countdown signal influenced their behavior (see Appendix A. Post-Participation Survey).
Ninety-two percent of the participants noticed the pedestrian countdown signal at some of the intersections. The following results reflect responses only from these drivers.
Ninety-three percent of the participants believed the presence of the pedestrian countdown signal influenced their behavior at the DZ intersections. Participants used the remaining time of the pedestrian countdown signal so that they could have a clear decision at an intersection. Additionally, 86 percent of these drivers thought their behaviors in response to the pedestrian countdown signal mimicked what they would have done in the real world. Participants were asked to rate, on a scale from 1 (not at all influenced) to 10 (extremely influenced), how much the pedestrian countdown signal influenced their decision at the DZ intersections. The mode was 10, and the median rating was 8.0.
4.2.3.4 Adjacent Vehicle Influence
Question 5 was asked to gather information on whether participants noticed the adjacent vehicle and, if so, whether the presence and/or behavior of the adjacent vehicle influenced their behavior (see Appendix A. Post-Participation Survey).
All participants noticed the adjacent vehicle traveling in the left lane. Only 13 percent of the drivers believed the presence of the adjacent vehicle influenced their behavior at the DZ intersections. Similarly, only 11 percent of the participants believed the behavior of the adjacent vehicle influenced their behavior at the DZ intersections. Eighty-four percent of the drivers thought their behaviors in response to the adjacent vehicle mimicked what they would have done in the real world.

25
Participants were asked to rate, on a scale from 1 (not at all influenced) to 10 (extremely influenced), how much the adjacent vehicle influenced their decision at the DZ intersections. The mode was 1, and the median rating was 2.0. However, the results conflicted with the statistical analysis, shown in Table 4-5 (i.e., behavior of an adjacent vehicle (AdjVehBeh) was a significant element to the drivers’ responses at the DZ intersection).
4.2.3.5 Real-World Experience with Red-Light Running
Questions 6 to 10 were asked to gather information about participants’ self-reported red-light running in actual driving. Respondents were asked to consider only their past experiences in the real world (see Appendix A. Post-Participation Survey).
Approximately 66 percent of participants defined running a red light as entering an intersection on red, while the balance defined running a red light as entering an intersection on yellow and the light turning to red while the car was still in the intersection. Table 4-6 and Table 4-7 show the distribution of how often the participants recalled other drivers and themselves running red lights, respectively.
Table 4-6: Distribution of how often participants recalled other drivers running red lights in the real world (based on their respective definition of red-light running).
Response Percentage
Every day 25
A few times a week 39
A few times a month 22
Less than once a month
13
Table 4-7: Distribution of how often participants recalled themselves running red lights in the real world (based on their respective definition of red-light running).
Response Percentage
Yes, once or twice 57
Yes, more than twice 18
No 24
Those participants who reported running a red light in the real world were asked to identify which factors affected their decision to do so. Multiple selections were allowed. Figure 4-5 displays what percentage of these drivers selected each factor.

26
Figure 4-5: Chart. Percentage of participants who selected each factor that affected their decisions to run a red light in the real world.
82.67
46.67
5.33 2.67
48.00
29.33
52.00 50.67
34.67
0.00
10.00
20.00
30.00
40.00
50.00
60.00
70.00
80.00
90.00
100.00
Could notstop intime
Afraid ofrear
collision
Side carran the
light
Front carran the
light
In a hurry No othercars
around
Notpayingclose
attention
Unfamiliarwith area
Distracted
Pe
rce
nta
ge o
f P
arti
cip
ants

27
5 Analysis Results
5.1 ABMS Scenario
5.1.1 DZ Model
The proposed driver behavior model was implemented using ABMS software. The simulation scenario was a segment of an urban arterial with three lanes in each direction containing two signalized intersections.
Figure 5-1: Image. Screenshot of simulation.
In the simulation (Figure 5-1), the nearest leading vehicle in the adjacent lane was considered the adjacent vehicle. The simulation time horizon was 30,000 hours and the number of replications was 30. Initial speed of vehicles was assumed to be uniformly distributed between 23.3 mi/h and 30 mi/h. Moreover, the coming flow rate was 1,200 vehicles/hour and perception-reaction time (δ) was 0.7 seconds. The number of sampled vehicles is 1,000. The free flow speed of each group was given by drivers’ data collected by the HDS. Free flow speed of group A, group B, group C, and group D was Normal (38.89, 3.34) mi/h, Normal (42.38, 4.93) mi/h, Normal (52.67, 3.12) mi/h, and Normal (57.30, 3.34) mi/h, respectively. Parameters in the parenthesis represent mean and variance of the Normal distribution. Based on collected data from the HDS, decisionmaking behaviors of the drivers in the four groups were developed via the E-BDI framework (see section 5.2 for more details). The constructed simulation models were executed under the two different facility speed limit cases (40 mi/h and 55 mi/h), as mentioned in section 4.1.1.
5.1.2 E-BDI Framework
The E-BDI framework was used as an underlying model in ABMS to mimic participants’ decisionmaking behaviors shown in the DZ experiments conducted with the HDS. Because E-BDI generates a multistage plan via probabilistic inference, it is able to represent the uncertain perception and reasoning processes of humans. (2)
In the E-BDI framework, once an agent perceives the road condition (e.g., traffic), the perceptual processor in the Belief module creates Beliefs via the Bayesian Belief Network (BBN). The BBN uses conditional probabilities between variables to infer states of attributes (e.g., travel time) from the observed road conditions (e.g., free flow speed, traffic volume, and road length). Thus, each agent can have its own Beliefs about the attributes based on the BBN trained by its own experience. (2)

28
Then, a real-time planner creates a multistage plan from the Beliefs. In this process, Extended Decision Field Theory (EDFT) is used to select one option from multiple alternatives regarding interdependencies between alternatives. (17) (18)
It calculates the preference values of all alternatives based on perception and attention of a human on each attribute of each option (see section 0). Once the preference values converge, EDFT selects one option that has the highest preference value. By running EDFT multiple times with BBN, choice probabilities for all of the alternatives can be computed. More details on this work can be found in Lee, Son, and Jin (2010).
5.2 ABMS Model Calibration and Validation
5.2.1 Calibration of BBN
In the E-BDI framework, a driver’s decisionmaking behavior in the DZ was represented by BBN with EDFT. To be more specific, the BBN provides the states of the attributes of each option from the environmental factors, and the EDFT computes the preferences on each option regarding the psychological aspect of driver deliberation. As mentioned in section 4.1.1, there were four groups classified by facility speed and degree of driving in a hurry. Each group had three environmental factors (i.e., RedLightCam, PedCountSig, and AdjVehBeh). In addition to these three factors, two more factors (distance to stop line of a vehicle (Distance) and approaching speed of a vehicle at the onset of the yellow phase (AppSpeed)), as included in the existing ITE DZ model, (1) were considered to represent the status of an individual vehicle. To identify the impacts of the three environmental factors (i.e., external information) and the status of the individual vehicle (i.e., internal information) on the driver’s decision in the DZ, external information and internal information were considered as attributes in the E-BDI framework.
The challenge of calibration is how to measure the correlations between the five observed factors and two attributes (i.e., two latent variables: internal information and external information). Although the status of the attributes is not observed by the HDS, the status can be inferred from the five observed factors and the drivers’ decisions by an SEM approach. Structural equation modeling is a statistical technique for testing and estimating causal relations using a combination of statistical data and causal assumptions that has been widely used to find the relationships between observed variables and latent variables. (19)
Figure 5-2 shows the hypothetical model for SEM analysis. (9)

29
© Elsevier B.V.
Figure 5-2: Chart. Path model in SEM analysis. (9)
Table 5-1 shows the standardized regression weights of each group. (9)
Table 5-1: Standardized regression weights of driver groups. (9)
Causal Relation Group A Group B Group C Group D
AppSpeed -> Internal information –.775 –.629 –.523 –.816
Distance -> Internal information .935 .923 1.285 .919
PedCountSig -> External information –.181 –.130 - –.194
RedLightCam -> External information .091 –.034 - –.020
AdjVehBeh -> External information .055 .036 - .018
Decision <- Internal information .245 .261 .880 .270
Decision <- External information 1.043 1.361 - 1.032
To evaluate the validity of the developed models, a χ2 goodness of fit test was conducted (H0: the data are consistent with the developed model; Ha: the data are not consistent with the developed model). The χ2/df value of the models was 1.846/7 (group A), 1.206/7 (group B), 2.274/7 (group C), and 3.926/7 (group D). In general, if χ2/df is less than 3, the model would be considered a desirable model for the given dataset. (19) Thus, the path model shown in Figure 5-2 was used as a fitted model to explain the collected data by HDS in this study (the model can be different based on a collected dataset). Regarding the standardized regression weight of each group, drivers in group A, group B, and group D were more sensitive to external information than internal information, i.e., Decision <- Internal information.

30
This sensitivity implies that the existing ITE DZ model, which mainly considers AppSpeed and Distance, would not be sufficient to explain the driver’s decision when the driver also had external information. The gap in the standardized regression weights between internal information and external information in affecting a decision also shows that group B (i.e.,
|0.261–1.361| = 0.900) and group D (i.e., |0.270–1.032| = 0.762) cared more about external
information than group A (i.e., |0.245–1.043| = 0.798) and that for group C, there was no
impact of external information. In other words, external information was considered to a significant extent by drivers in the in-a-hurry situation.
From the SEM approach, the status of each attribute was estimated. Figure 5-3 shows the developed BBN. (9) In this process, the values of each attribute were discretized and normalized to use the same scale in the EDFT algorithm for each option. In fact, if there was no significant impact on the inference accuracy of the BBN, discretization of a continuous factor reduced the space complexity of the BBN so that inference process using the BBN could be improved.
© Elsevier B.V.
Figure 5-3: Chart. BBN for E-BDI framework. (9)
The advantage of BBN is its ability to infer the status of attributes even though only partial observations of the parent variables (i.e., AppSpeed, Distance, RedLightCam, PedCountSig, and AdjVehBeh) were available. Additionally, because it is a probabilistic model using conditional probabilities between variables, BBN could handle the driver’s uncertain perception process.
5.2.2 Calibration of EDFT
The calibration of EDFT is the process to find the parameters of EDFT to mimic real drivers’ decisionmaking behaviors in the DZ.
Figure 5-4 shows the EDFT used in this study. (9)

31
Figure 5-4: Equation. EDFT used in the DZ. (9)
The first term on the right-hand side includes a stability matrix (S) to consider the effect of the preference at the previous state (the memory effect) and preference values (P) of two alternatives at time t. The second term on the right-hand side includes a contrast matrix (C) regarding the correlation between alternatives, a value matrix (M(t+h)) to represent the subjective perception of a human on each attribute of each option, and a weight vector (W(t)) to assign the weights of attention on each attribute. (9) (17) (18)
By fixing the values of the stability matrix S and contrast matrix C, the calibration process could be simplified as a searching process for the appropriate weight vector (W(t)) of each driver group under the given value matrix M(t). In this study, by comparing the decisions of real drivers with the inferred decisions given by the E-BDI framework, the weight vector W(t) with the highest prediction accuracy was found. Table 5-2 (9) reveals the selected weight vectors. (9)
Table 5-2: Weight vector of driver groups.
Weight Vector Group A Group B Group C Group D
𝑊(𝑡) = (𝑤𝑖𝑛𝑡(𝑡)
𝑤𝑒𝑥𝑡(𝑡)) (
0.160.84
) (0.110.89
) (10) (
0.080.92
)
5.3 Modeling Experiments
To analyze the simulation results, a Speed-Distance (SD) diagram was used. The SD diagram shows drivers’ decisions, together with the vehicles’ approaching speed and distance to the stop line, at the onset of the yellow phase. In an SD diagram, there are two curves; one is called the stopping curve and the other is called the crossing curve. (9) The stopping curve represents the limited stopping distance under different vehicle speeds with respect to comfortable
deceleration (i.e., –3.72 m/sec2 in this research, as given by the Traffic Engineering
Handbook). (13) Similarly, the crossing curve represents the limited crossing distance under different vehicle speeds within the length of the yellow phase.
By using these two curves, the space in the SD diagram can be separated into four zones: (1) cross zone-space beyond both curves, (2) stop zone-space under both curves, (3) option zone-space under stopping curve and above crossing curve, and (4) DZ-space under crossing curve and above stopping curve. A driver is able to clear the intersection with the current approaching speed before the traffic signal turns red in the cross zone and to stop comfortably at the stop line in the stop zone. Otherwise, a driver must choose either to go or to stop when the driver is in the DZ or the option zone.

32
5.3.1 Low-Facility Speed Limit
In this scenario, the simulation model consisted of 50 percent group A vehicles and 50 percent group B vehicles.
Figure 5-5 (9) and Figure 5-6 (9) show the experimental results under different configurations of
RedLightCam and PedCountSig (i.e., presence or not). On the one hand, among the vehicles in Figure 5-5 (no RedLightCam and no PedCountSig), 36.31 percent cleared the intersection successfully (red stars), 60.71 percent stopped (blue circles), and 2.98 percent chose to cross but had to run a red light. On the other hand, among all vehicles in Figure 5-6 (RedLightCam and PedCountSig present), 36.37 percent cleared the intersection successfully (red stars), 61.22 percent stopped (blue circles), and 2.41 percent chose to cross but had to run a red light (black triangles). According to the definition of the option zone, there were no vehicles running a red light in the option zone because drivers could either stop their vehicles or go through an intersection before the traffic signal changed to a red light. However, because of traffic on the roadway, drivers could not suddenly change their vehicle speed. In other words, the actual maximum acceleration rate and deceleration rate were different from the theoretical values. Thus, vehicles that ran red lights were detected in the simulation model. In addition, comparing the proportion of red-light running vehicles in the two figures, when RedLightCam and PedCountSig were present, they were able to reduce the number of red-light running vehicles (i.e., from 2.98 percent to 2.41 percent).
© Elsevier B.V.
Figure 5-5: Chart. SD diagram of Group A (RedLightCam=no and PedCountSig=no). (9)

33
© Elsevier B.V.
Figure 5-6: Chart. SD diagram of Group A (RedLightCam=yes and PedCountSig=yes). (9)
When the red-light photo enforcement camera and pedestrian countdown signal do not exist at a signalized intersection (no RedLightCam and no PedCountSig), among all vehicles in group B, 36.60 percent cleared the intersection successfully (red stars), 60.85 percent stopped (blue circles), and 2.55 percent chose to cross but had to run a red light (black triangles) to do so.
On the other hand, when the RedLightCam and PedCountSig present, 39.38 percent cleared the intersection successfully (red stars), 58.94 percent stopped (blue circles), and 1.68 percent chose to cross but had to run a red light (black triangles). As found for group A, the presence of RedLightCam and PedCountSig reduced the number of vehicles running red lights. Significantly, group B had a higher reduction in the amount of red-light running vehicles (0.87 percent) than group A (0.57 percent) because drivers who were driving in the in-a-hurry situation cared more about the external information than other drivers who were driving in a normal situation.
Table 5-3: Summary of experiments (group A: 90 percent; group B: 10 percent).
Group Presence of PedCountSig
and RedLightCam Crossed Stopped
Red-light running
A Yes 36.49 60.85 2.66
A No 31.51 65.35 3.13
B Yes 34.91 63.20 1.89
B No 33.48 63.87 2.65

34
Table 5-4: Summary of experiments (group A: 10 percent; group B: 90 percent).
Group Presence of PedCountSig
and RedLightCam Crossed Stopped
Red-light running
A Yes 40.28 57.64 2.08
A No 33.91 63.29 2.80
B Yes 39.35 59.35 1.29
B No 34.14 62.84 2.43
Table 5-3 and Table 5-4 show the average numbers of crossed, stopped, and red-light running
vehicles collected by 30 replications of each scenario. As previously mentioned, the presence of
RedLightCam and PedCountSig reduced the number of red-light violations for group A and
group B. In addition, the impact of RedLightCam and PedCountSig on drivers’ decisions
increased when the roadway had a greater number of group B vehicles, as shown in the tables
on the reduction of red-light violations. Table 5-3 had a 0.47 percent reduction for group A and
a 0.76 percent reduction for group B, and Table 5-4 had a 0.72 percent reduction for group A
and 1.14 percent for group B because the drivers in group B considered the external
information more significantly than those in group A. Moreover, group A had more red-light
running vehicles than group B. This result meant that the approaching speed of group A was too
slow to cross the intersection within the yellow phase (group A has Normal (38.89, 3.34) mi/h
speed distribution and group B has Normal (42.38, 4.93) mi/h speed distribution).
5.3.2 High-Facility Speed Limit
Unlike group A and group B, drivers’ decisions in group C were only related to the internal information mentioned in section 5.2.
Among all vehicles in group C, 56.24 percent cleared the intersection successfully (red stars), 42.26 percent stopped (blue circles), and 1.50 percent chose to cross but had to run the red light (black triangles). Comparing the distribution of decisions with group A, the number of red-light running vehicles in group C was smaller than the number of red-light running vehicles in group A. Noting that group C drivers had a 55 mile-per-hour speed limit, this smaller number of violations meant that drivers could make clear decisions under the high-facility speed limit (FacilitySpeed) under the experimental settings.

35
© Elsevier B.V.
Figure 5-7: Chart. SD diagram of group D (RedLightCam=no and PedCountSig=no). (9)
© Elsevier B.V.
Figure 5-8: Chart. SD diagram of group D (RedLightCam=yes and PedCountSig=yes). (9)
Group D, however, had different decisionmaking patterns from group C. Figure 5-7 (9) and Figure 5-8 (9) show the experimental results of group D. Among the vehicles in Figure 5-7, 57.72 percent cleared the intersection successfully (red stars), 40.68 percent stopped (blue circles), and 1.60 percent chose to cross but had to run the red light (black triangles).

36
Comparing the distribution of decisions in group D with group C, an urgent situation (i.e., driving in a hurry) made drivers have uncertain decisions. In other words, it increased the potential risk of a car crash at an intersection. If RedLightCam and PedCountSig were present at the intersection, the uncertainty was significantly mitigated. In Figure 5-8, 55.25 percent cleared the intersection successfully (red stars), 43.29 percent stopped (blue circles), and 1.46 percent chose to cross but had to run the red light (black triangles).
Similar to the low-facility speed limit case, experiments under different configurations of group
C and group D were conducted. Table 5-5 and Table 5-6 show the average numbers of vehicles
that crossed, stopped, red-light-running vehicles collected by 30 replications of each scenario.
As indicated in Figure 5-7 and Figure 5-8, the presence of RedLightCam and PedCountSig
reduced the number of red-light running vehicles. The number of red-light running vehicles
decreased as the percentage of group D increased from 90 percent to 10 percent. The
reduction in the amount of red-light running vehicles of group D was 0.06 percent in Table 5-5
and 0.43 percent in Table 5-6. Group C had a 0.01 percent reduction in Table 5-5 and 0.09
percent reduction in Table 5-6.
In fact, because the decision model of group C did not include external information as an
attribute, the number of light violations of group C should not be affected by the presence of
RedLightCam and PedCountSig. However, group C shared a roadway with group D, which was
influenced by the external information so that group C was indirectly affected by the external
information via physical interactions (i.e., actual movements of vehicles) with vehicles in group
D. Therefore, in group C, there were small differences according to the presence of
RedLightCam and PedCountSig.

37
Table 5-5: Summary of experiments (group C: 90 percent; group D: 10 percent).
Group RedLightCam and PedCountSig
Crossed Stopped Red-light running
C Yes 57.27 41.88 0.85
C No 56.80 42.34 0.86
D Yes 57.12 41.08 1.80
D No 54.78 43.36 1.86
Table 5-6: Summary of experiments (group C: 10 percent; group D: 90 percent).
Group RedLightCam and PedCountSig
Crossed Stopped Red-light running
C Yes 49.25 50.00 0.75
C No 52.93 46.23 0.84
D Yes 58.92 40.06 1.02
D No 56.34 42.21 1.45
5.4 Discussions
The E-BDI-based DZ model was proposed to predict drivers’ decisions at an intersection. The proposed model can be used to assist in intersection design to reduce the potential risk of crashes as a result of drivers’ responses. In addition to the two factors considered in the ITE DZ model (i.e., AppSpeed and Distance), various external factors in the roadway environment (i.e., RedLightCam, PedCountSig, and AdjVehBeh) were considered. The first two factors were defined as internal information, and the other three factors were defined as external information. The internal and external information were used as attributes in the E-BDI-based DZ model.
From the drivers’ responses collected by the HDS, SEM analyzed the impact of unobserved attributes (i.e., internal information and external information) on drivers’ decisions in the DZ.
According to the standardized regression weights given by SEM, most driver groups, except group C, used both external and internal information for their decisionmaking.
The SEM analysis results were utilized to calibrate BBN and EDFT in the E-BDI-based model to understand the impact of internal and external information on drivers’ decisionmaking behaviors in the DZ.
According to the calibration results, when drivers were in a hurry situation (i.e., group B and group D), drivers’ decisionmaking behaviors were significantly affected by the external information.

38
Agent-based modeling and simulation with the calibrated E-BDI-based DZ model showed the impact of external information via SD diagrams. It was executed with multiple vehicles to consider physical interactions between vehicles. The experimental results revealed that drivers tended to have a higher number of red-light running vehicles when a pedestrian countdown signal and a red-light photo enforcement camera were not installed at an intersection. The presence of a pedestrian countdown signal and red-light photo enforcement camera were able to reduce the number of red-light running vehicles significantly, particularly when drivers were in a situation that called for them to be in a hurry. The findings corresponded to the results from the E-BDI-based DZ model calibration. This is a good proof of concept for the potential development of a model to predict driver decisions in the DZ via ABMS with the E-BDI-based DZ model.

39
6 Concluding Remarks
This report provided details about the work on developing a novel DZ model based on ABMS. In order to develop a realistic driver’s behavior model regarding the uncertainty of a driver’s perception and decision, the E-BDI framework was adopted. In the E-BDI framework, internal information (i.e., vehicle’s approaching speed and distance to stop line at the onset of the yellow phase) and external information (i.e., presence of a red-light photo enforcement camera, presence of a pedestrian countdown signal, and behavior of an adjacent vehicle) were considered as major factors on the stopping and proceeding decisions of a driver. In addition, the impact of factors on drivers’ decisionmaking behaviors in the DZ was analyzed under four roadway conditions classified by facility speed limit of the roadway and degree of driving in a hurry. The highway driving simulator was used to collect real drivers’ responses and to calibrate the ABMS model with E-BDI framework. To demonstrate and validate our proposed approach, the drivers’ behaviors under two cases were compared: (1) drivers only knew the approaching speed and distance to the stop line of a vehicle (i.e., internal information), and (2) drivers knew the internal information as well as the external information. The experiments revealed that knowing the external information could predict real drivers’ behaviors accurately and reduce the number of red-light violations, which could cause potential car crashes at an intersection.


41
7 References
1. The problem of the amber signal light in traffic flow. Gazis, D., Herman, R., and Maradudin, A. 1, Catonsville, MD: INFORMS, 1960, Operations Research, Vol. 8, pp. 112–132.
2. An Integrated Human Decision Making Model for Evacuation Scenarios under BDI Framework. Lee, S. Son, Y.J., and Jin, J. 4, New York, NY: ACM, Inc., 2010, ACM Transactions on Modeling and Computer Simulation, Vol. 20, pp. 23:1–23:4.
3. National Highway Traffic Safety Administration. Fatality Analysis Reporting System. [Online] [Cited: May 29, 2014.] http://www.nhtsa.gov/FARS.
4. Design of an intersection descision support (IDS) interface to reduce crashes at rural stop-controlled intersections. Laberge, J.C., Creaser, J.I., Rakauskas, M.E., and Ward, N.J. 1, Amsterdam, Netherlands: Elsevier B.V., 2006, Transportation Research Part C: Emerging Technologies, Vol. 14, pp. 39–56.
5. Zegeer, C.V. Effectiveness of Green-Extension Systems at High-Speed Intersections. Frankfort, KY: Kentucky Department of Transportation, Bureau of Highways, 1977.
6. Analysis of driver behavior in dilemma zones at signalized intersections. Gates, T.J., Noyce, D.A., Laracuente, L., and Nordheim, E.V. 1, Washington, DC: Transportation Research Board, 2007, Vol. 2030, pp. 29–39.
7. Changes in driver behavior resulting from pedestrian countdown signals. Huey, S.B., and Ragland, D. Washington, DC: s.n., 2007. Presented at the 86th Annual Meeting of the Transportation Research Board.
8. Evaluation or red light camera enforcement in Oxnard, California. Retting, R.A., Williams, A.F., Farmer, C.M., and Feldman, A.F. 3, Amsterdam, Netherlands: Elsevier B.V., 1999, Accident Analysis & Prevention, Vol. 31, pp. 169–174.
9. Impact of road environment on drivers' behaviors in dilemma zone: application of agent-based simulation. Kim, S., Son, Y., Chiu, Y., Jeffers, M.A.B., and Yang, C.Y.D. Amsterdam, Netherlands: Elsevier B.V., 2015, Accident Analysis & Prevention (accepted).
10. Oehlert, G.W. A First Course in Design and Analysis of Experiments. New York: W.H. Freeman, 2000. Vol. 1.
11. CIMSLab. Dilemma Zone Driving Simulator. YouTube. [Online] CIMSLab, September 25, 2013. [Cited: December 11, 2105.] https://www.youtube.com/watch?v=vrJiVJaZW4g.
12. Extended DBI framework for modelling human desisionmaking in complex automated manufacturing systems. Zhao, X., and Son, Y. 3, Philadelphia, PA: Taylor and Francis Group, 2008, International Journal of Modelling & Simulation, Vol. 28, p. 347.

42
13. Kraft, W. Traffic Engineering Handbook. Washington, DC: Institute of Transportation Engineers, Sixth Edition, 2009.
14. FHWA. Manual of Uniform Traffic Control Devices. Washington, DC: Federal Highway Administration, 2009.
15. Simulator sickness questionnaire: an enhanced method of quantifying simulator sickness. Kennedy, R., Lane, N., Berbaum, K., and Lilienthal, M. Philadelphia, PA: Taylor & Francis Group, 1993, The International Journal of Aviation Psychology, Vol. 3, pp. 203–220.
16. Implications of dilemma zone behavior on intersection safety: a driving simulator study. Jeffers, M.A.B., Yang, C.Y.D., Kim, S., and Son, Y. Amsterdam, Netherlands: Elsevier B.V., 2015, Transportation Research Part F (submitted).
17. Survey of decision field theory. Busemeyer, J.R., and Diedrich, A. 3, Amsterdam, Netherlands: Elsevier Science B.V., 2002, Mathematical Social Sciences, Vol. 43, pp. 345–370.
18. Decision field theory extensions for behavior modeling in dynamic environment using Bayesian belief network. Lee, S., Son, Y.J., and Jin, J. 10, Amsterdam, Netherlands: Elsevier B.V., 2008, Information Sciences, Vol. 178, pp. 2297–2314.
19. Ullman, J.B., and Bentler, P.M. Structural Equation Modeling. Malden: Wiley Online Library, 2003.

43
Appendix A. Post-Participation Survey
Congratulations! You have just completed your series of three drives.
Next you will complete a short survey about your experiences in the simulator and how those experiences compare to similar situations in the real world. The survey will take about 5 minutes to complete. Please answer as honestly and thoroughly as possible.
Some of the questions will be multiple choice. For these questions, you can click on the answer choice number or use the keypad on the keyboard. Other questions will be fill in the blank. For those questions, please type your response and hit “ENTER” on the keyboard.
At this time, please let the experimenter know if you have any questions. Once you are ready, please click “CONTINUE” at the bottom of the screen.
During each of the simulated drives, some of the traffic signals turned to yellow as you were
approaching the intersection. Consider your behavior at these intersections (whether you stopped at or
proceeded through the intersection) for the remaining questions.
1. Did you ever stop at one of these intersections?
A. YES
B. NO
If “YES” …
What factors, if any, influenced your decision to stop at the intersection? (Fill in the blank)
2. Did you ever proceed through one of these intersections?
A. YES
B. NO
If “YES” …
What factors, if any, influenced your decision to proceed through the intersection? (Fill in the blank)

44
3. Did you notice the red-light camera present at some of the intersections?
A. YES
B. NO
If “YES” …
Did the presence of the red-light camera influence your decision to proceed through or stop at the
intersection?
A. YES
B. NO
If “YES” …
How did the red-light camera influence your decision at the intersection? (Fill in the blank)
If “NO” …
Why did the red-light camera not influence your decision at the intersection? (Fill in the blank)
Was your behavior in response to the red-light camera similar to what you would have done in the real
world?
A. YES
B. NO
If “NO” …
What would you have done differently in the real world in response to the red-light camera? (Fill
in the blank)
On a scale from 1 to 10, how much did the red-light camera influence your decision to proceed through
or stop at the intersection?
1 2 3 4 5 6 7 8 9 10
Not at All Extremely Influenced

45
4. Did you notice the pedestrian countdown signal at some of the intersections?
A. YES
B. NO
If “YES” …
Did the presence of the pedestrian countdown signal influence your decision to proceed through or stop
at the intersection?
A. YES
B. NO
If “YES” …
How did the pedestrian countdown signal influence your decision at the intersection? (Fill in the
blank)
If “NO” …
Why did the pedestrian countdown signal not influence your decision at the intersection? (Fill in
the blank)
Was your behavior in response to the pedestrian countdown signal similar to what you would have done
in the real world?
A. YES
B. NO
If “NO” …
What would you have done differently in the real world in response to the pedestrian
countdown signal? (Fill in the blank)
On a scale from 1 to 10, how much did the pedestrian countdown signal influence your decision to
proceed through or stop at the intersection?
1 2 3 4 5 6 7 8 9 10
Not at All Extremely Influenced
5. Did you notice the vehicle that occasionally traveled next to you in left lane?
A. YES
B. NO

46
If “YES” …
Did the presence of the adjacent vehicle influence your decision to proceed through or stop at the
intersection?
A. YES
B. NO
If “YES” …
How did the presence of the adjacent vehicle influence your decision at the intersection? (Fill in
the blank)
If “NO” …
Why did the presence of the adjacent vehicle not influence your decision at the intersection?
(Fill in the blank)
Sometimes the adjacent vehicle would travel through the intersection and other times it would stop at
the intersection.
Did the behavior of the adjacent vehicle influence your decision to proceed through or stop at the
intersection?
A. YES
B. NO
If “YES” …
How did the behavior of the adjacent vehicle influence your decision at the intersection? (Fill in
the blank)
If “NO” …
Why did the behavior of the adjacent vehicle not influence your decision at the intersection?
(Fill in the blank)
Was your behavior in response to the adjacent vehicle similar to what you would have done in the real
world?
A. YES
B. NO
If “NO” …
What would you have done differently in the real world in response to the adjacent vehicle? (Fill
in the blank)

47
On a scale from 1 to 10, how much did the adjacent vehicle influence your decision at the intersection?
1 2 3 4 5 6 7 8 9 10
Not at All Extremely Influenced
6. For the following questions, please consider only your past experiences in the real world. How do
you define running a red light?
A. Entering an intersection on yellow, but the light turns to red while the car is still in the
intersection.
B. Entering an intersection on red.
C. Other:
7. How often do you see other drivers run red lights, based on your definition?
A. Every day.
B. A few times a week.
C. A few times a month.
D. Less than once a month.
8. Have you ever run a red light, based on your definition?
A. Yes, once or twice.
B. Yes, more than twice.
C. No.
9. In the past, what are some factors that have affected your decision to run a red light? Select all that
apply.
A. Could not stop in time.
B. Afraid car behind me would hit me.
C. Car to the side of me ran the light first.
D. Car in front of me ran the light first.
E. In a hurry.
F. No other cars around the intersection.

48
G. Not paying close enough attention.
H. Unfamiliar with area and/or did not see the light.
I. Distracted by someone and/or something in my car.
J. Other:
10. Do you have any other comments?