agent-basedcompetitivesimulation:exploringfuture ...xlarge.rsm.nl/large/block10icec.pdf ·...
TRANSCRIPT

Agent-based competitive simulation: Exploring futureretail energy markets
Carsten BlockInstitute of IS&M
Karlsruhe Inst. of Technology
John CollinsDept of CS&E
University of [email protected]
Wolfgang KetterRotterdam Sch. of Mgmt.
Erasmus University [email protected]
ABSTRACTFuture sustainable energy systems will need efficient, clean,low-cost, renewable energy sources, as well as market struc-tures that motivate sustainable behaviors on the part ofhouseholds and businesses. “Smart grid” components canhelp consumers manage their consumption only if pricingpolicies are in place that motivate consumers to install anduse these new tools in ways that maximize utilization ofrenewable energy sources while minimizing dependence onnon-renewable energy. Serious market breakdowns, such asthe California energy crisis in 2000, have made policy makerswary of setting up new retail energy markets. We present thedesign of an open, competitive simulation approach that willproduce robust research results on the structure and opera-tion of retail power markets as well as on automating mar-ket interaction by means of competitively tested and bench-marked electronic agents. These results will yield policyguidance that can significantly reduce the risk of institutingcompetitive energy markets at the retail level, thereby ap-plying economic motivation to the problem of adjusting ourenergy production and consumption patterns to the require-ments of a sustainable future.
1. INTRODUCTIONThe energy sector will experience fundamental change overthe next ten years. The cost of fossil fuel is continuouslyincreasing, there is an urgent need to reduce CO2 emissions,and the United States and European Union are stronglymotivated to become independent from imported energy.One result will be increasing numbers of distributed, inter-mittent renewable energy systems, which will be connectedto the distribution grid at the bottom (retail) level ratherthan at the top (wholesale) level. This trend conflicts withthe current top-down grid control infrastructure, where afew control centers manage large power plants and top-levelswitchgear such that energy output meets energy demandin real time. It also conflicts with the way electrical poweris sold at the retail level; consumers currently have neitherthe information nor the economic motivation to adjust their
demand to the availability of clean sources of power.
At its core, this is a problem of distributing resources amongself-interested parties, a problem that markets can solve. Ina regional retail energy market, participants are responsi-ble to build and maintain a near-optimal balance betweenproducers and consumers of electrical power at the low volt-age distribution level of the grid hierarchy, in real-time. Sofar, there is limited experience from pilot projects and fieldstudies that could guide design and operation of such re-gional markets [11, 3]. All these projects rely on “intelligentdevices” and automation technology [2] to facilitate or evenautomate energy management at both consumer and gener-ator sites. The automation solutions proposed within theseprojects are “unchallenged” in the sense that no other (com-peting) automation technology was deployed within thesepilot projects, though competing technologies and solutionswill be the default case in large-scale technology deploy-ments on regional or national levels. The California energymarket breakdown in 2000 [16, 6] is an example of the prob-lems that can occur if potential strategic, competitive orcollusive behavior of market participants is not sufficientlyaccounted for in the design of such markets.
In this paper, we describe the design of a competitive sim-ulation environment that uses a market-based managementstructure for a local energy grid, which mirrors reality fairlyclosely. This simulation environment challenges researchteams to create agents, or possibly agent-assisted decisionsupport systems for human operators, that can operate effec-tively and profitably in direct competition with each other.Research teams with a variety of specific interests therebycontribute to the development of reliable and efficient au-tomation technologies for efficient energy trading on the re-tail customer level. At the same time they are challenged toexploit the structure of the market, and that structure is ad-justed periodically to defeat counterproductive strategic be-haviors. The result will be a body of valuable research datathat could guide energy policy, along with a much higherdegree of confidence that such mechanisms could be safelyintroduced into operating energy systems.
2. RELATEDWORKThe U.S. National Institute of Standards and Technology(NIST) recently published the first draft of a “Smart GridInteroperability Standards Roadmap” [33]. It defines a sim-plified domain model for a future smart grid with identified“Distribution”, “Market,” and “Customer” domains being in
Proceedings of the 12th International Conference on Electronic Commerce, Honolulu, August 2-4, 2010. 67
the core of the overall model. Furthermore a list of pri-oritized actions for the fast transformation of the currentinfrastructure into a smart grid is provided. Highest prior-ity, according to NIST, are Demand Response and consumerenergy efficiency measures. In particular they state that“Market information is currently not available to the cus-tomer domain. Without this information, customers cannotparticipate in the wholesale or retail markets. In order toinclude customers in the electricity marketplace, they needto understand when opportunities present themselves to bidinto the marketplace and how much electricity is needed.”
The German industry group BDI has published a technol-ogy roadmap that describes the transition from the currentenergy infrastructure into a so called“Internet of Energy” [4]on a timeline from 2009 to 2020. According to this roadmap,regional energy markets, virtual power plants based on microCHP turbines, as well as Demand Side Management (DSM)technologies will be mainstream by 2015. One of the keychallenges identified is the development of “applications andservices implementing the coordination of the energy grid onthe economic level” in a sense that the technical infrastruc-ture will be in place but smart coordination and operationstrategies are yet to be developed.
Electricity production and distribution systems are complexadaptive systems [20] that need to be managed in real timeto balance the load of an electricity grid. Electricity mar-kets are undergoing a transition from centrally regulatedsystems to decentralized markets [22]. These transitions arevery risky since we do not have sufficient experience in set-ting up decentralized energy systems and predicting theireffect on the economy. We have observed in recent historythat failures in designing such systems can cause major dam-age while deploying them in the real world. The Californiaenergy market debacle [6] and the recent collapse of Enronchallenge the wisdom of deregulating the electricity industry,and have demonstrated that the success of competitive elec-tricity markets crucially depends on market design, demandresponse, capacity reserves, financial risk management andreliability control along the electricity supply chain. There-fore, it is very important to thoroughly test system designproposals in a risk free simulated environment before de-ploying these ideas into the real world.
Agent-based simulation modeling, especially using the meth-ods of Agent-based Computational Economics (ACE) [30],has emerged over the last few years as a dominant researchtool of the energy sector. For instance, the Electricity Mar-ket Complex Adaptive Systems Model (EMCAS) electricpower simulation is an agent simulation that represents thebehavior of an electric power system and the producers andconsumers that work within it [22]. Sueyoshi and Tadi-parthi [28] have developed MAIS, an agent-based decisionsupport system for analyzing and understanding dynamicprice changes for the U.S. wholesale electricity market be-fore and during the California energy crisis. A large scalesimulation of interrelated German energy markets was de-veloped by [32], and [29] use ACE to study U.S. wholesalepower market designs. A nice review of agent-based simula-tion tools for energy markets can be found in [35].
Over the last decade competitions are becoming increas-
ingly prevalent in the research world. The current Trad-ing Agent Competitions use a multi-year competition for-mat to study trading in simultaneous online markets (TACClassic) [34], operation of a three-tier supply chain (TACSCM) [7], trading of search keywords for advertising pur-poses (TAC AA) [14], and the operation of online exchanges(TAC CAT) [21].
The natural human desire to win will be a strong motiva-tion to create competitive agents that solve the challenges ofthe domain. Competitions force researchers to build com-plete, working systems by a specified date. Over the lastseven years the annual TAC SCM tournament has pittedautonomous manufacturing agents against each other to de-termine which is the best performing agent. Each year, re-sults from the previous competition have been published,such as [23, 18, 17]. This rapidly raises the bar for re-search. Since all teams have to solve the same problemsin the same domain, this becomes a strong driver for re-search, and teams learn quickly from each other. Teams areencouraged to contribute their agents to a shared reposi-tory, allowing researchers to run controlled experiments thatdemonstrate the effect of individual agent designs, such asdescribed by [15, 26].
3. COMPETITION SCENARIOThe main goals of the TAC Energy competition are (i) toprovide a competitive testbed for the development and val-idation of a market structure for managing electrical powerdistribution in a local grid, (ii) to spur research and devel-opment on intelligent agents and decision support systemsthat help automate decision processes in such markets, and(iii) to ease knowledge transfer between research and appli-cation by providing a testing environment that closely re-sembles reality. The entities competing in this market arebrokers who buy and sell electrical power in a local energygrid that contains a mix of intermittent energy sources alongwith residential, commercial, and industrial demands.
The competition introduces the role of a retail “energy bro-ker,” represented by a trading agent. In reality, such brokerscould be energy retailers, municipal utilities, cooperatives,or in some cases large utilities. Within the competition abroker sells tariff contracts to end customers (e.g. house-holds, small and medium enterprises, owners of electric ve-hicles), which are attracted or deterred by the respectivetariff conditions. Tariff conditions may include flat prices,time of use prices, peak prices, load caps for certain timesof the day, etc. In addition to “classical” tariff contracts forenergy consumption, a broker can also sell “energy produc-tion” tariffs to end customers who wish to sell solar or windpower, as well as “balancing” tariffs for operation of a de-centralized energy generator such as a Combined Heat andPower (CHP) plant that feeds power into the grid, and is atleast partially controllable by the grid operator.
Another type of consumer is Plug-in Electric Vehicles (PEVs).These customers may be offered tariff contracts that haveseparate, time dependent prices for charging the vehicle (con-suming energy) and for feeding energy back into the grid (ef-fectively producing energy). PEV customers are relativelylarge energy consumers during their charge cycle but mightdecide to discharge some of their stored energy at their own
Proceedings of the 12th International Conference on Electronic Commerce, Honolulu, August 2-4, 2010. 68
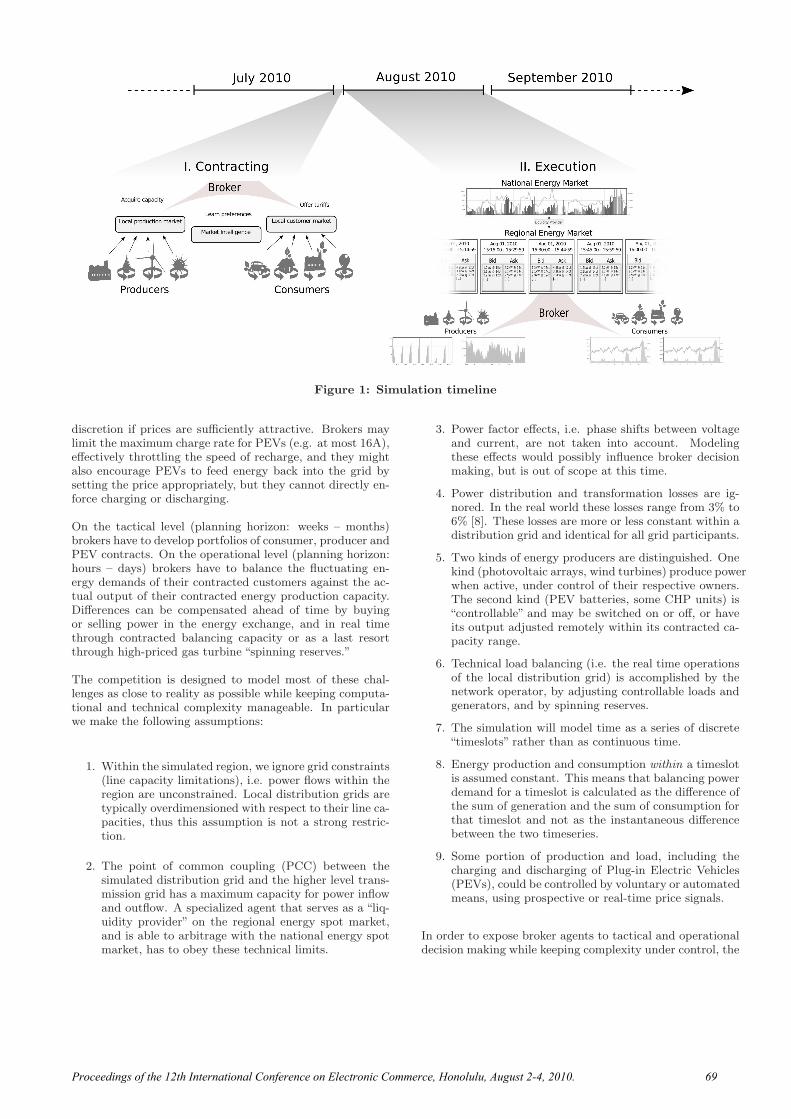
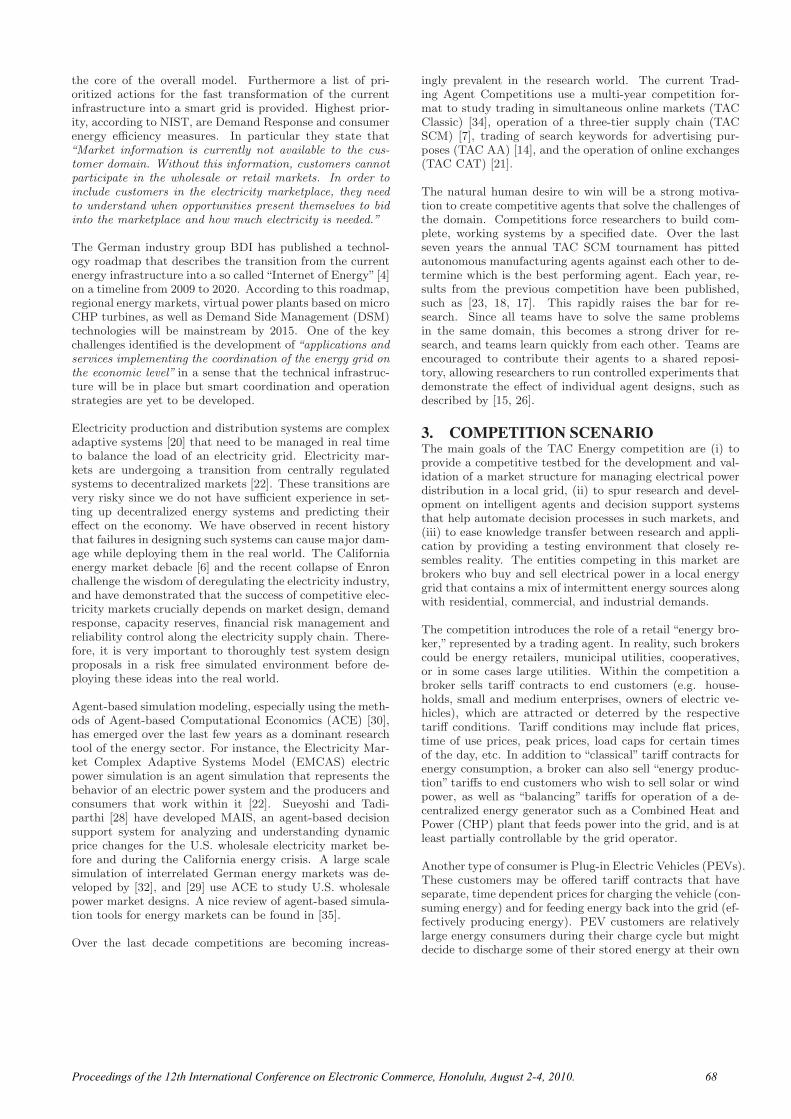
Figure 1: Simulation timeline
discretion if prices are sufficiently attractive. Brokers maylimit the maximum charge rate for PEVs (e.g. at most 16A),effectively throttling the speed of recharge, and they mightalso encourage PEVs to feed energy back into the grid bysetting the price appropriately, but they cannot directly en-force charging or discharging.
On the tactical level (planning horizon: weeks – months)brokers have to develop portfolios of consumer, producer andPEV contracts. On the operational level (planning horizon:hours – days) brokers have to balance the fluctuating en-ergy demands of their contracted customers against the ac-tual output of their contracted energy production capacity.Differences can be compensated ahead of time by buyingor selling power in the energy exchange, and in real timethrough contracted balancing capacity or as a last resortthrough high-priced gas turbine “spinning reserves.”
The competition is designed to model most of these chal-lenges as close to reality as possible while keeping computa-tional and technical complexity manageable. In particularwe make the following assumptions:
1. Within the simulated region, we ignore grid constraints(line capacity limitations), i.e. power flows within theregion are unconstrained. Local distribution grids aretypically overdimensioned with respect to their line ca-pacities, thus this assumption is not a strong restric-tion.
2. The point of common coupling (PCC) between thesimulated distribution grid and the higher level trans-mission grid has a maximum capacity for power inflowand outflow. A specialized agent that serves as a “liq-uidity provider” on the regional energy spot market,and is able to arbitrage with the national energy spotmarket, has to obey these technical limits.
3. Power factor effects, i.e. phase shifts between voltageand current, are not taken into account. Modelingthese effects would possibly influence broker decisionmaking, but is out of scope at this time.
4. Power distribution and transformation losses are ig-nored. In the real world these losses range from 3% to6% [8]. These losses are more or less constant within adistribution grid and identical for all grid participants.
5. Two kinds of energy producers are distinguished. Onekind (photovoltaic arrays, wind turbines) produce powerwhen active, under control of their respective owners.The second kind (PEV batteries, some CHP units) is“controllable” and may be switched on or off, or haveits output adjusted remotely within its contracted ca-pacity range.
6. Technical load balancing (i.e. the real time operationsof the local distribution grid) is accomplished by thenetwork operator, by adjusting controllable loads andgenerators, and by spinning reserves.
7. The simulation will model time as a series of discrete“timeslots” rather than as continuous time.
8. Energy production and consumption within a timeslotis assumed constant. This means that balancing powerdemand for a timeslot is calculated as the difference ofthe sum of generation and the sum of consumption forthat timeslot and not as the instantaneous differencebetween the two timeseries.
9. Some portion of production and load, including thecharging and discharging of Plug-in Electric Vehicles(PEVs), could be controlled by voluntary or automatedmeans, using prospective or real-time price signals.
In order to expose broker agents to tactical and operationaldecision making while keeping complexity under control, the
Proceedings of the 12th International Conference on Electronic Commerce, Honolulu, August 2-4, 2010. 69
competition scenario proceeds through a series of alternatingcontracting and execution phases. as depicted in Figure 1.Both phases are described in more detail in subsequent sec-tions.
To enhance realism of the scenario, we will drive the simu-lation with real historical data on generation, consumption,and weather information, along with a model of preferencesof potential customers derived from customer surveys andpilot projects. One source of such data series is the GermanMeRegio project, a smart grid project that is implementinga combination of advanced grid control systems and innova-tive real-time pricing tariffs [12]. A pilot region for MeRegiois the area around Freiamt, which contains a range of dif-ferent distributed renewable energy generation facilities incombination with households and small and medium enter-prises (SMEs) that are currently equipped with demand sidemanagement devices allowing them to flexibly react to pricesignals from the distribution grid. This equipment also col-lects and stores demand data that can be then be used todrive individual and aggregate simulation models. Similardata is available for wind turbines and solar arrays in Ger-many, for CHP plants in the Netherlands, and for house-holds and enterprises in the Olympic Peninsula project inthe United States [10]. An essential ongoing element of thisproject will be to collect and incorporate this type of datafor a wide array of customer types and geographical regions.
With historic consumption and generation data collectedfrom a region like this, the simulation environment will ex-pose the broker agents to the challenge of managing vir-tual consumers and generators, which exhibit realistic en-ergy consumption and generation patterns based on the his-tory data.
3.1 Contracting phaseOn the simulation timeline, a contracting phase representsa short period of time (perhaps 60 seconds). During thisphase, broker agents may acquire capacity from local pro-ducers and sell energy to local customers as depicted in Fig-ure 2.
Figure 2: Contracting phase
To build profitable portfolios, brokers must estimate andreason about consumer and producer preferences in order todesign appropriate tariffs. They will also need to estimatefuture consumer and generator behavior to build a port-folio that has well-balanced demand and supply over time.Commonly, companies delegate the tasks of determining cus-
tomer preferences and estimating business potential for newproducts (tariffs) to their marketing departments, or theyoutsource them to specialized service providers. Within thecompetition scenario, brokers may request such informationfrom the market intelligence service (c.f. Fig. 2).
The market intelligence service also provides brokers withhistoric supply and demand time series for producers andconsumers under contract. With these time series at hand,a broker will be able to estimate aggregate capacity overtime and whether its portfolio is well balanced. Figure 3shows an example of such a historic time series for a windturbine with a nominal capacity of 150kW.
3.1.1 Negotiating tariffsTariffs are contracts that can be accepted or not by anony-mous energy consumers and producers. The problem facedby broker agents in a competitive market is how to know howwell a particular tariff will “sell.” In the real world, firms arecontinually bidding against each other, attempting to attractthe most “desirable” customers with their offerings. In thesimulation, this process is modeled by making tariff offersin multiple “rounds” during a contracting phase, with thenumber of rounds |R| indeterminate to eliminate boundaryeffects. In each round r ∈ R, agents are permitted to addor withdraw tariffs from their current offerings, resulting ina set of tariffs Ur for round r. As shown by the schematicdrawing of Figure 4, the market intelligence service thenruns a customer preference model to allocate customers tooffered tariffs. Each agent is then provided with the numberof customers who would agree to each of their offered tariffs,and they may then query the market intelligence service forpredicted “demand profiles” for the projected customer baseassociated with each of their currently offered tariffs. Theseare simply aggregated time series for the set of customerswho currently prefer the individual tariffs. At the end ofthe last round, no more offerings may be made, and bro-kers are charged a fee for each concurrently offered tariff. Inother words, in each round r, a set of tariffs Ub,r is offeredby broker b. If the fee for offering a tariff is pfee, then the to-tal tariff fee pfeeb for broker b during the current contractingcycle will be
pfeeb = p
fee maxR
(|Ub,r|), ∀r ∈ R. (1)
At the end of the last round, all currently-offered tariffs willbe available for inspection by all agents through the marketintelligence service.
Across multiple contracting phases, customers develop rat-ings of brokers, through a “social network” facility. Throughthese ratings, we model the reputations of individual bro-kers, which filter through to customer profiles and affectcustomer preferences among brokers. For example, in orderto attract customers to a tariff with fully-dynamic pricing,a broker may provide estimates of average expected prices.If actual prices during previous execution phases have ex-ceeded these estimates, this reduces the broker’s reputationwith regard to its overall cost estimates.
3.1.2 Negotiating individual contractsIndividual contracts may be negotiated through a Requestfor Quote (RFQ) process, in which larger energy producers
Proceedings of the 12th International Conference on Electronic Commerce, Honolulu, August 2-4, 2010. 70

Figure 3: Sample wind turbine generation timeline as provided by the market intelligence service.
Figure 4: Market intelligence service during tariffnegotiation.
and consumers request specific terms that are not offeredin the current or common tariff offerings. Any broker mayrespond to such an RFQ, and may make counteroffers. Ne-gotiation proceeds across potentially multiple rounds, withoffers and concessions across multiple issues, as long as thecustomer and at least one broker remain interested, subjectto a reasonable time limit. Customers who are unable to ne-gotiate individual contracts must accept tariff offerings. Thespecific protocol for this negotiation process is to be deter-mined, but there are examples in the literature, such as [13].
This is a monotonic concession model, in which negotiatingagents ideally discover and explore the Pareto frontier of thenegotiation issue space.
3.2 Execution phaseDuring an execution phase (see Figure 5), each broker mustmanage supply and demand across its portfolio acquired dur-ing the previous contracting phase over at least seven consec-utive simulated days. Besides strong diurnal effects, energydemand also differs significantly between working days andweekends. The length of seven days ensures an inclusion ofboth type of days within each execution phase. The exactlength of an execution phase is drawn from a random distri-bution but is not revealed to the agents in order to reduceend-effects within the competition.
The broker needs to ensure that total energy demands andsupplies of the customers and generators in its portfolio arebalanced for each time period through the whole executionphase. Deviations between production and consumptionmight still occur but will be charged an (expensive) bal-ancing power fee.
In this context, balance between supply and demand meansthat
eim(b, s) +
|Gb|∑
j=1
ej(s) = eex(b, s) +
|Cb|∑
i=1
ei(s) (2)
where Gb is the set of contracted power producers for brokeragent b, Cb is the set of contracted consumers for b, ej(s) isthe total energy produced by generator j, ei(s) is the totalenergy used by consumer i, eim(b, s) is power imported (pur-chased) by broker b from the regional exchange for deliveryduring timeslot s, and eex(b, s) is power exported (sold) bybroker b into the regional exchange. Note that ej(s) andei(s) can include an arbitrary portion of contracted balanc-ing power.
A broker’s consumer and producer portfolio (i.e. the set ofcontracts) remains stable throughout an execution phase,but the overall energy demand and supply within the port-
Proceedings of the 12th International Conference on Electronic Commerce, Honolulu, August 2-4, 2010. 71

folio is volatile over time. This behavior is simulated usinghistorical data. For example, Figure 3 shows the output ofa sample wind turbine over a 7-day period in 2003.
Figure 5: Execution phase: Brokers manage theirportfolios and trade in the regional market.
3.2.1 Collecting information and predicting the fu-
tureAs during the contracting phase, a broker may request his-toric time series data for the seven preceding days (i.e. theapproximate length of one complete execution phase) fromthe market intelligence service for all generators and con-sumers currently under contract. With this historic dataseries at hand a broker will be able to build its own predic-tion model for future energy consumption and production ofits portfolio, in order to be able to detect and address likelyfuture imbalances.
In general, retrieval of future time series data from the mar-ket intelligence service is not permitted, with one exception:For intermittent generators such as photovoltaics or windturbines, the estimation of future output solely based onhistoric time series data is unrealistic. Predictions for suchsources are usually based on weather forecasts as describedfor example in [24].
In order to shield brokers from having to model weather
forecasts, and also because forecasts for specific generatorsas input for the competition are usually not publicly avail-able1 the approach for this competition is to permit futuretime series data lookups only for intermittent generators. Inorder to accurately model the problem brokers must solve,these future time series will be artificially distorted to exhibitapproximately the level of accuracy that might be achievedusing the best available weather forecasts (see [1] for back-ground).
Based on (i) the historic generation schedules of“predictable”generators (e.g. micro turbines or CHP plants), (ii) the his-toric consumption schedules of the consumers under con-tract, and (iii) the forecasted generation schedules of inter-mittent generators, a broker will have to estimate futureenergy production and consumption schedules for its port-folio as visualized in Figure 6. Note how the uncertainty forthe expected demand and supply in time slots far into thefuture is higher than for those near to the current time slot.In Figure 6(a) the maximum expected overall generation ca-pacity of broker b in time slot sn+5, e
′g(b, sn+5) is much lower
than the expected overall load e′c(b, sn+5). But as the meanabsolute percentage errors (MAPEs) for both numbers arehigh (indicated as gray boxes), the accuracy of this predic-tion is low. The MAPE for the overall consumption stemsfrom the demand forecasting model the broker has to buildon its own. The MAPE for the overall production stems inpart from the artificial distortion of future production data,and in part from the broker’s prediction model for forecast-ing non intermittent production resources such as CHP en-gines or micro gas turbines. 120 Minutes later (Figure 6(b))the expectation values for supply and demand remained un-changed but the standard deviation has decreased. At thispoint the broker is able to predict an excess demand situa-tion for the time slot with a good confidence and thus canintroduce appropriate countermeasures. In this case it de-cided to acquire additional energy for time slot sn+5 fromthe regional energy exchange as indicated in the Figure. Analternative would be to adjust energy production and supplywithin its portfolio as described in the following section.
3.2.2 Adjusting energy demand and supplyFor each time slot s, each broker b must balance expectedsupply and demand. Expected demand is the sum of theexpected loads e′i(s) of each consumer i in the the consumerportfolio Cb during time slot s:
e′C(b, s) = eex(b, s) +
|Cb|∑
i=1
e′i(s) (3)
Expected supply is total expected production capacity of allgenerators j within portfolio Gb:
e′g(b, s) = eim(b, s) +
|Gb|∑
j=1
ej(s) (4)
In addition, the broker will have some amount of contractedbalancing load ǫc(b, s) and balancing generation capacityǫg(b, s). These amounts may be subtracted from load or pro-duction by the grid operator during timeslot s to achieve ex-act balance. Therefore, as long as e′c(b, s)−ǫc(b, s) ≤ e′g(b, s)
1Such forecasts are provided by specialized companies thatcharge significant fees.
Proceedings of the 12th International Conference on Electronic Commerce, Honolulu, August 2-4, 2010. 72

Figure 6: Broker’s total energy demand and supply as anticipated at a particular point in time (a), and againtwo hours later (b).
and e′g(b, s)−ǫg(b, s) ≤ e′c(b, s) then time slot s is in balance,or at least expected to be so.
In Figure 6(a), we can see that the forecasted overall con-sumption of broker b deviated from the actual consump-tion ec(b, sn). But as the difference between ec(b, sn) andeg(b, sn) was smaller than the production balancing capac-ity ǫg(b, sn), the network operator automatically shut downa portion of the balancing capacity such that overall de-mand and supply for timeslot sn was rebalanced. A brokeragent cannot directly affect production or consumption inthe current time slot sn.
For time slot sn+1 in Figure 6(a), overall demand was fore-casted to be within range of the available production capac-ities even when taking uncertainty (indicated as grey boxes)into account. In other words e′g(b, sn+1) − ǫg(b, sn+1) ≤e′c(b, sn+1). After 2τ simulation time elapsed (Figure 6(b)),the real consumption in this time slot turned out to be evenlower than was predicted. This means that even after thesimulation environment reduced the generator’s internal bal-ancing power capacity to its minimum level, the overall pro-duction still exceeded the overall consumption. In this caseexternal balancing power (e.g. some large pumped-storagepower plant outside the broker’s portfolio) had to absorb the
excess generated energy. In the energy industry this type ofbalancing power is usually called an “ancillary service” andits utilization is billed to the broker at a defined (high) price.
In slot sn+2 in Figure 6(a), the broker forecasts a significantdifference between overall production and overall consump-tion. Internal balancing capacity is likely to be insufficientfor leveling the expected difference. In order to avoid the(expensive) utilization of external balancing power, brokera can use its contracted pricing power to try to encourage(i) some or all of its consumers to increase their demand,or (ii) some or all of its producers to reduce their produc-tion. Technical adjustments initiated by the broker (e.g.a remote activation of loads at consumer premises) is notallowed within the competition. But a consumer’s energyconsumption ec(i, s) is subject to the energy consumptionprice for this consumer in a time slot s, which is defined aspc(i, s). We define
ec(i, sn+2) = e′c(i, sn+2, pc(i, sn+2)) (5)
as the predicted load for consumer i in time slot sn+2, givenprice pc(i, sn+2). If the broker changes the underlying con-sumption price to p′c(i, sn+2) the forecasted consumption ofthis consumer is expected to increase as
e′c(i, sn+2) = e
′c(i, sn+2, p
′c(i, sn+2)) (6)
Proceedings of the 12th International Conference on Electronic Commerce, Honolulu, August 2-4, 2010. 73
The ratio of demand change to price change
PE i =ec(i, s, p)− ec(i, s, p
′)
p− p′(7)
is called the “price elasticity” for consumer c. Price elastic-ities will have to be modeled within the different consumeragents provided by the competition environment, followingempirical findings on price elasticity as described for exam-ple in [27, 25].
Some producers in the broker’s portfolio (such as PEV bat-teries that can be discharged into the grid) might have agreedto flexible pricing as well, and therefore their output willbe sensitive to price in a similar way. In other words, thepower generation capacity of broker b in time slot s, eg(b, s),is likely to decrease if the generation price pg(j, s) for a pro-ducer j is changed to p′g(j, s), assuming p′g(j, s) < pg(j, s).We also assume that the internal balancing power capacityǫg(b, s) and ǫc(b, s) will remain unchanged, assuming thatthe balancing portion of the tariff contracts offered by agentb are not price-sensitive.
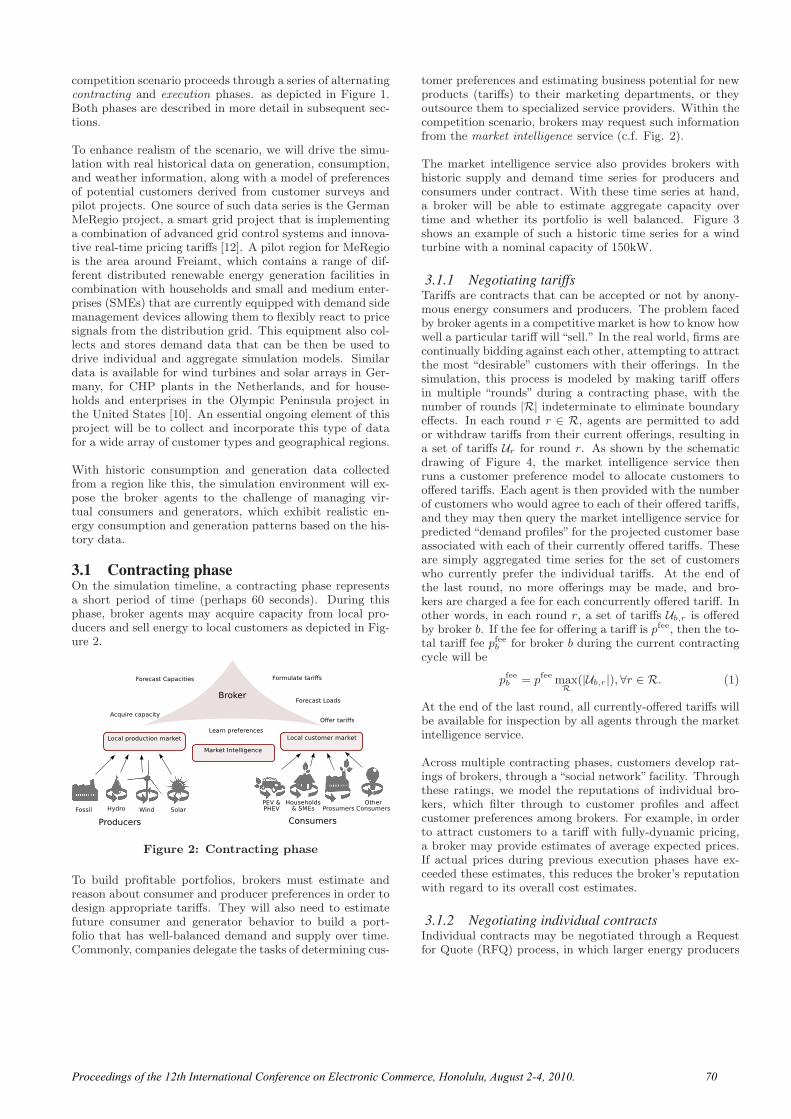
3.2.3 Buying or selling futures on the energy marketThe re-adjustment of energy prices for consumers and gener-ators as well as the advance reservation of (partial) genera-tor capacity as balancing power reserves are two possibilitiesto level out a broker’s portfolio over time. A third optionis to buy missing or to sell excess capacities on the energymarket. Within the competition this market is modeled asa continuous double auction with uniform pricing and thusresembles the prevalent mechanism design in place for en-ergy spot market trading in Europe and North America [19].On this market standardized energy futures are traded. Anenergy future is a binding commitment to consume or toproduce a defined amount of energy (e.g. 1kWh) within adefined future time slot (e.g. Aug 01, 2007, 03:00 – 03:59)at a defined price (e.g. 0.20 $/kWh). In order to buy orsell energy futures, a market participant sends bid or askorders to the energy market, which then clears (matches) allincoming bids and asks at a uniform price determined ac-cording to the the maximum turnover needed principle (seee.g. [9] for a detailed description of the mechanism).
In addition to the brokers, the regional market includes aspecial “liquidity provider” to represent the point of com-mon coupling (PCC) between the simulated region and thenational grid. It can buy energy at the national market andtransfer it via the PCC to the simulated region and viceversa. Thus the liquidity provider serves as an arbitrageagent that levels prices of the regional and the national en-ergy market and constitutes an explicit market coupling [19].
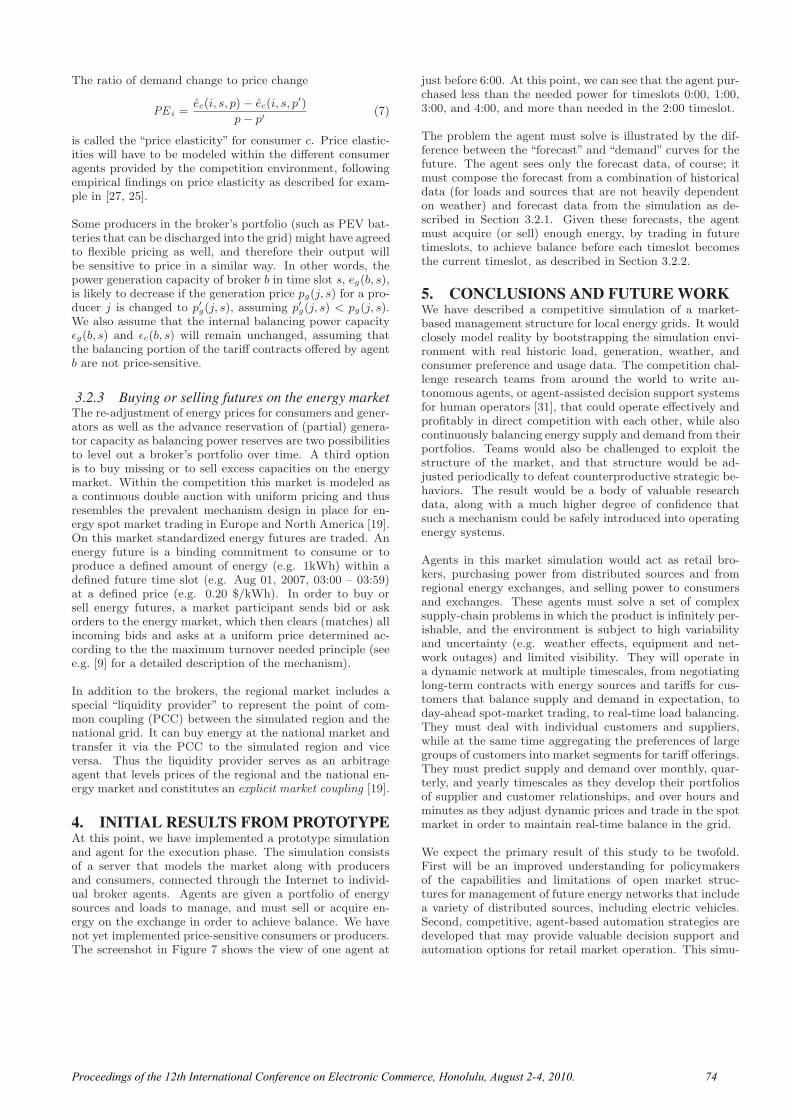
4. INITIAL RESULTS FROM PROTOTYPEAt this point, we have implemented a prototype simulationand agent for the execution phase. The simulation consistsof a server that models the market along with producersand consumers, connected through the Internet to individ-ual broker agents. Agents are given a portfolio of energysources and loads to manage, and must sell or acquire en-ergy on the exchange in order to achieve balance. We havenot yet implemented price-sensitive consumers or producers.The screenshot in Figure 7 shows the view of one agent at
just before 6:00. At this point, we can see that the agent pur-chased less than the needed power for timeslots 0:00, 1:00,3:00, and 4:00, and more than needed in the 2:00 timeslot.
The problem the agent must solve is illustrated by the dif-ference between the “forecast” and “demand” curves for thefuture. The agent sees only the forecast data, of course; itmust compose the forecast from a combination of historicaldata (for loads and sources that are not heavily dependenton weather) and forecast data from the simulation as de-scribed in Section 3.2.1. Given these forecasts, the agentmust acquire (or sell) enough energy, by trading in futuretimeslots, to achieve balance before each timeslot becomesthe current timeslot, as described in Section 3.2.2.
5. CONCLUSIONS AND FUTUREWORKWe have described a competitive simulation of a market-based management structure for local energy grids. It wouldclosely model reality by bootstrapping the simulation envi-ronment with real historic load, generation, weather, andconsumer preference and usage data. The competition chal-lenge research teams from around the world to write au-tonomous agents, or agent-assisted decision support systemsfor human operators [31], that could operate effectively andprofitably in direct competition with each other, while alsocontinuously balancing energy supply and demand from theirportfolios. Teams would also be challenged to exploit thestructure of the market, and that structure would be ad-justed periodically to defeat counterproductive strategic be-haviors. The result would be a body of valuable researchdata, along with a much higher degree of confidence thatsuch a mechanism could be safely introduced into operatingenergy systems.
Agents in this market simulation would act as retail bro-kers, purchasing power from distributed sources and fromregional energy exchanges, and selling power to consumersand exchanges. These agents must solve a set of complexsupply-chain problems in which the product is infinitely per-ishable, and the environment is subject to high variabilityand uncertainty (e.g. weather effects, equipment and net-work outages) and limited visibility. They will operate ina dynamic network at multiple timescales, from negotiatinglong-term contracts with energy sources and tariffs for cus-tomers that balance supply and demand in expectation, today-ahead spot-market trading, to real-time load balancing.They must deal with individual customers and suppliers,while at the same time aggregating the preferences of largegroups of customers into market segments for tariff offerings.They must predict supply and demand over monthly, quar-terly, and yearly timescales as they develop their portfoliosof supplier and customer relationships, and over hours andminutes as they adjust dynamic prices and trade in the spotmarket in order to maintain real-time balance in the grid.
We expect the primary result of this study to be twofold.First will be an improved understanding for policymakersof the capabilities and limitations of open market struc-tures for management of future energy networks that includea variety of distributed sources, including electric vehicles.Second, competitive, agent-based automation strategies aredeveloped that may provide valuable decision support andautomation options for retail market operation. This simu-
Proceedings of the 12th International Conference on Electronic Commerce, Honolulu, August 2-4, 2010. 74

Figure 7: One agent’s view during an execution phase.
lation will allow such structures to be evaluated in a risk-freeenvironment under a variety of real-world conditions rang-ing from normal to extreme. The competitive design willeffectively uncover potential hazards of proposed market de-signs in the face of strategic behaviors on the part of theparticipating agents. The likely effects of various dynamicpricing approaches for consumers and electric vehicle charg-ing can be evaluated. Complex preference models will bedeveloped that have three important properties: attractiveto consumers, attractive to brokers, and give brokers suffi-cient flexibility to balance loads in expectation and in realtime. Methods will be developed for charging large num-bers of electric vehicles in ways that are both technicallyfeasible and economically attractive to consumers, and thattake advantage of the balancing capacities of vehicles. Amore complete description of the TAC Energy scenario isavailable as [5].
6. REFERENCES[1] Ahlert, K.-H., and Block, C. Assessing the impact
of price forecast errors on the economics of distributedstorage systems. In 43rd Hawaii InternationalConference on System Science (HICSS-43) (Hawaii,USA, 2010).
[2] Amin, M., and Wollenberg, B. Toward a smartgrid: Power delivery for the 21st century. IEEE Power& Energy Magazine 3, 5 (2005), 34–41.
[3] Blaabjerg, F., Teodorescu, R., Liserre, M., and
Timbus, A. Overview of control and gridsynchronization for distributed power generationsystems. IEEE Transactions on Industrial Electronics53, 5 (2006), 1398–1409.
[4] Block, C., Bomarius, F., Bretschneider, P.,
Briegel, F., Burger, N., Fey, B., Frey, H.,
Hartmann, J., Kern, C., Plail, B., Praehauser,
G., Schetters, L., Schoepf, F., Schumann, D.,
Schwammberger, F., Terzidis, O., Thiemann, R.,
van Dinther, C., von Sengbusch, K., Weidlich,
A., and Weinhardt, C. Internet der Energie - IKTfur Energiemarkte der Zukunft. Bdi-drucksache nr.418, Bundesverband der Deutschen Industrie e.V.(BDI), 12 2008.
[5] Block, C., Collins, J., Ketter, W., and
Weinhardt, C. A multi-agent energy tradingcompetition. Tech. Rep. ERS-2009-054-LIS, RSMErasmus University, Rotterdam, The Netherlands,2009.
[6] Borenstein, S., Bushnell, J. B., and Wolak,
F. A. Measuring market inefficiencies in California’srestructured wholesale electricity market. TheAmerican Economic Review 92, 5 (2002), 1376–1405.
[7] Collins, J., Arunachalam, R., Sadeh, N.,
Ericsson, J., Finne, N., and Janson, S. The supplychain management game for the 2006 trading agentcompetition. Tech. Rep. CMU-ISRI-05-132, CarnegieMellon University, Pittsburgh, PA, November 2005.
Proceedings of the 12th International Conference on Electronic Commerce, Honolulu, August 2-4, 2010. 75
[8] Technology options for the near and long term. Tech.rep., U.S. Department of Energy Climate ChangeTechnology Program, September 2006.
[9] EEX. Introduction to exchange trading at EEX onXetra and Eurex. Tech. rep., European EnergyExchange AG, January 2008.
[10] Hammerstrom, D. J., Ambrosio, R., Brous, J.,
Carlon, T. A., Chassin, D. P., DeSteese, J. G.,
Guttromson, R. T., Horst, G. R., Jarvegren,
O. M., Kajfasz, R., Katipamula, S., Kiesling, L.,
Le, N. T., Michie, P., Oliver, T. V., Pratt,
R. G., Thompson, S., and Yao, M. Pacificnorthwest gridwise testbed demonstration projects:The Olympic Peninsula project. Final report, PacificNorthwest National Laboratory, Richland, Washington99352, October 2007.
[11] Hatziargyriou, N., Asano, H., Iravani, R., and
Marnay, C. Microgrids: An overview of ongoingresearch, development, and demonstration projects.Berkeley Lab Publications LBNL-62937, LawrenceBerkeley National Laboratory, July 2007.
[12] Hirsch, C., Hillemacher, L., Block, C.,
Schuller, A., and Moest, D. Simulation studieswithin the MEREGIO field experiment. IT -Information Technology forthcoming (2010).
[13] Jonker, C. M., and Treur, J. An agentarchitecture for multi-attribute negotiation. InInternational joint conference on artificial intelligence(2001), pp. 1195–1201.
[14] Jordan, P. R., Cassell, B., Callender, L. F.,
and Wellman, M. P. The ad auctions game for the2009 trading agent competition. Tech. rep., Universityof Michigan, Department of Computer Science andEngineering, 2009.
[15] Jordan, P. R., Kiekintveld, C., and Wellman,
M. P. Empirical game-theoretic analysis of the TACsupply chain game. In Proc. of the Sixth Int’l Conf. onAutonomous Agents and Multi-Agent Systems (May2007), pp. 1188–1195.
[16] Joskow, P., and Kahn, E. A quantitative analysisof pricing behavior in California’s wholesale electricitymarket during summer 2000. NBER Working PaperSeries 8157, National Bureau of Economic Research,2001.
[17] Ketter, W., Collins, J., Gini, M., Gupta, A.,
and Schrater, P. Detecting and forecastingeconomic regimes in multi-agent automated exchanges.Decision Support Systems 47, 4 (2009), 307–318.
[18] Kiekintveld, C., Miller, J., Jordan, P. R.,
Callender, L. F., and Wellman, M. P.
Forecasting market prices in a supply chain game.Electronic Commerce Research and Applications 8, 2(2009), 63–77. Special Section: Supply Chain TradingAgent Research.
[19] Meeus, L., and Belmans, R. Is the prevailingwholesale market design in Europe and North Americacomparable? In Power Engineering Society GeneralMeeting, 2007. IEEE (2007), pp. 1–5.
[20] Miller, J., Page, S., and LeBaron, B. Complexadaptive systems: An introduction to computationalmodels of social life. Princeton University PressPrinceton and Oxford, 2007.
[21] Niu, J., Cai, K., Parsons, S., Gerding, E., and
McBurney, P. Characterizing effective auctionmechanisms: Insights from the 2007 TAC marketdesign competition. In Proceedings of the 7thinternational joint conference on Autonomous agentsand multiagent systems-Volume 2 (2008),International Foundation for Autonomous Agents andMultiagent Systems, pp. 1079–1086.
[22] North, M., Conzelmann, G., Koritarov, V.,
Macal, C., Thimmapuram, P., and Veselka, T.
E-laboratories: agent-based modeling of electricitymarkets. In 2002 American Power Conference (2002),pp. 1–19.
[23] Pardoe, D., and Stone, P. Adapting in agent-basedmarkets: A study from tac scm. In Proc. of the SixthInt’l Conf. on Autonomous Agents and Multi-AgentSystems (May 2007), pp. 677–679.
[24] Sanchez, I. Short-term prediction of wind energyproduction. International Journal of Forecasting 22, 1(January 2006), 43–56.
[25] Siddiqui, A., Bartholomew, E., and Marnay, C.
Empirical analysis of the spot market implications ofprice-elastic demand. Berkeley Lab PublicationsLBNL-56141, Lawrence Berkeley National Laboratory,July 2004.
[26] Sodomka, E., Collins, J., and Gini, M. Efficientstatistical methods for evaluating trading agentperformance. In Proc. of the Twenty-Second NationalConference on Artificial Intelligence (2007),pp. 770–775.
[27] Spees, K., and Lave, L. Impacts of responsive loadin PJM: Load shifting and real time pricing. TheEnergy Journal 29, 2 (2008), 101–122.
[28] Sueyoshi, T., and Tadiparthi, G. An agent-baseddecision support system for wholesale electricitymarket. Decision Support Systems 44, 2 (2008),425–446.
[29] Sun, J., and Tesfatsion, L. Dynamic testing ofwholesale power market designs: An open-sourceagent-based framework. Computational Economics 30,3 (2007), 291–327.
[30] Tesfatsion, L. Agent-based computationaleconomics: Growing economies from the bottom up.Artificial Life 8, 1 (2002), 55–82.
[31] Varga, L. Z., Jennings, N. R., and Cockburn, D.
Integrating intelligent systems into a cooperatingcommunity for electricity distribution management.Int. Journal of Expert Systems with Applications 7, 4(1994), 563–579.
[32] Veit, D., Weidlich, A., and Krafft, J. A. Anagent-based analysis of the german electricity marketwith transmission capacity constraints. Energy Policy37, 10 (2009), 4132–4144.
[33] von Dollen, D. Report to NIST on the smart gridinteroperability standards roadmap. Tech. Rep.SB1341-09-CN-0031, Electric Power Research Institute(EPRI), June 2009.
[34] Wellman, M. P., Greenwald, A., and Stone, P.
Autonomous Bidding Agents. MIT Press, 2007.
[35] Zhou, Z., Chan, W., and Chow, J. Agent-basedsimulation of electricity markets: a survey of tools.Artificial Intelligence Review 28, 4 (2007), 305–342.
Proceedings of the 12th International Conference on Electronic Commerce, Honolulu, August 2-4, 2010. 76