aggregate testing for construction of arrester...
TRANSCRIPT

TRANSPORTATION RESEARCH RECORD 1250
Aggregate Testing for Construction of Arrester Beds
M. C. WANG
This paper presents methods of testing aggregate for use in arrester beds. Also presented are test results of five aggregates and the performance of the aggregates in the arrester beds. The test aggregates were obtained from five existing arrester beds throughout Pennsylvania.-They were Pennsylvania State University (PSU) river pea gravel, PSU crushed aggregate, Pleasant Gap gravel, Green Tree gravel, and Freeport gravel. Tests performed in the laboratory included gradation, specific gravity, Los Angeles abrasion, and freeze-thaw. In addition, particle angularity, sphericity, and shearing resistance were determined. The field performance of the test aggregates except Green Tree gravel was evaluated in terms of mean average truck deceleration in the bed. The available data show that PSU crushed aggregate performs most poorly of the four. Tlte other three perform nearly equally well, although Pleasant Gap gravel has a static internal friction angle considerably lower than PSU river pea gravel. These results indicate that aggregate performance depends not only on interparticle friction but also on other properties such as particle angularity and sphericity. For long-term performance, particle durability is also an important factor. Thus, testing of aggregate for use in the arrester bed should involve determination of gradation, interparticle friction, angularity, sphericity, and durability.
When heavy vehicles such as trucks or tractor-trailers travel on highways with long, steep downgrades and lose their braking capabilities, property damage and loss of life often occur if they hit other vehicles, nearby buildings, or pedestrians. To save life and avoid property damage, there must be facilities along the highway that can stop runaway vehicles that are driven into them. Such facilities are often called escape ramps or arrester beds.
There are three main types of arrester beds: gravity ramp, sand piles, and gravel beds. Of these three types, gravel beds have been shown to be safer and more efficient.The field performance of gravel arrester beds depends greatly on two aggregate properties, namely interparticle friction and free drainage. The ideal condition is an interparticle friction low enough for tires to sink into the aggregate yet sufficiently high to stop the vehicle within a desired distance. This condition must be maintained throughout the entire service life of the arrester bed without being influenced by freezing and other possible adverse factors. The effect of freezing can be minimized by preventing the accumulation of excess water in the arrester bed. Therefore, the aggregate must be free-draining.
To possess both low interparticle friction and high permeability, the aggregate must have rounded particles with uniform gradation. A natural aggregate that can satisfy this requirement is pea gravel; for this reason, pea gravel has been used most often in the construction of arrester beds.
Department of Civil Engineering, The Pennsylvania State University, University Park, Pa. 16802
Although particle size and distribution are important factors influencing interparticle friction and drainage, other factors such as particle shape and surface texture are of equal importance. To maintain the original as-constructed level of performance, furthermore, the aggregate particles must be tough and durable. Thus, selection of aggregate for construction of arrester beds requires extensive testing to determine not only the grain size distribution but also other properties, including at least particle shape, angularity, durability, and shearing resistance. This paper presents test methods, test results for five different aggregates, and the relation between the measured aggregate properties and field performance.
TEST AGGREGATES
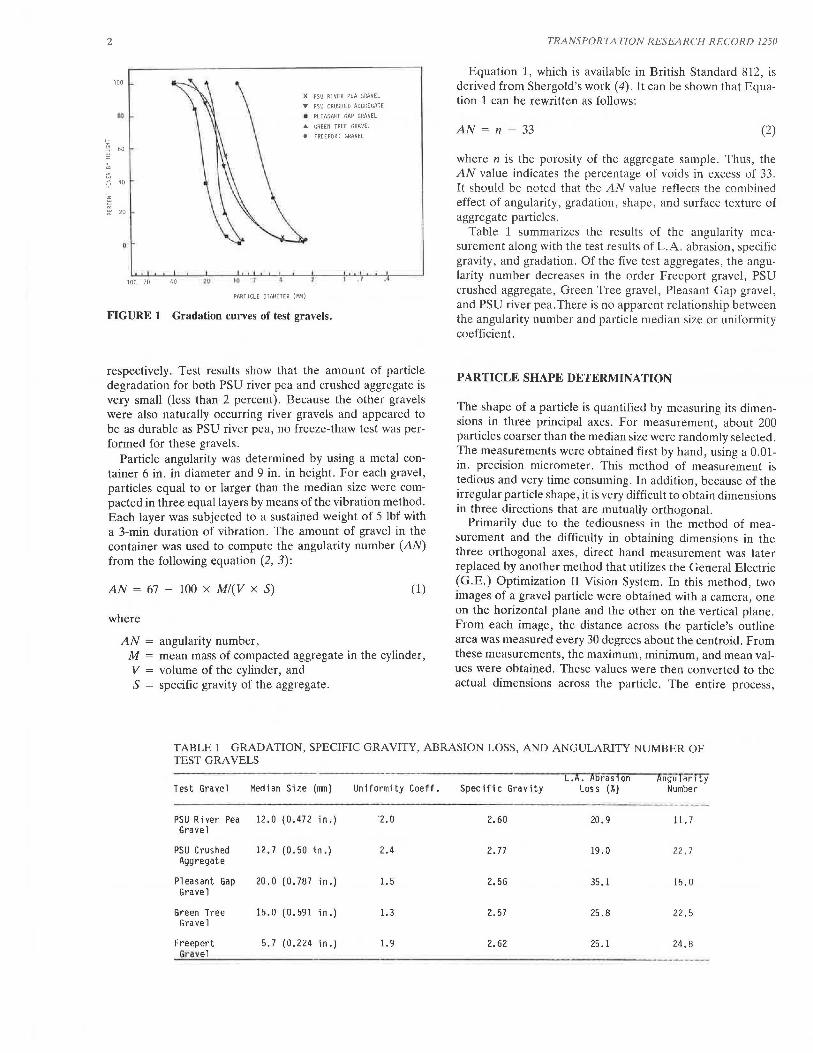
The aggregates tested were obtained from escape ramps located at the Pennsylvania State University (PSU) Transportation Research Facility (two ramps), Pleasant Gap, Green Tree, and Freeport. For convenience, these five aggregates were named PSU river pea gravel, PSU crushed aggregate, Pleasant Gap gravel, Green Tree gravel, and Freeport gravel. PSU crushed aggregate was produced by crushing limestone; the others were naturally occurring river gravels. These aggregates were first subjected to gradation and bulk specific gravity tests in accordance with ASTM C 136-84 and C 127-84 test procedures, respectively. Their gradation curves are shown in Figure 1.
PSU river pea, PSU aggregate, Pleasant Gap gravel, Green Tree gravel, and Freeport gravel were formed to have maximum particle sizes of 1.5, 1.0, 1.5, 0.75, and 0.375 in. (38, 25, 38, 19, and 10 mm), respectively. Pleasant Gap, Green Tree, and Freeport gravels also appear to be more uniformly graded than PSU river pea and crushed aggregate. Based on these gradations, their American Association of State Highway and Transportation Officials (AASHTO) grades are 57, 57, 467, 6, and 8 for PSU river pea, PSU crushed aggregate, Pleasant Gap, Green Tree, and Freeport gravels, respectively.
DURABILITY AND ANGULARITY TESTS
Aggregate durability against abrasion was determined by means of the L.A. abrasion test, ASTM C 355-81. For freezing and thawing durability, the test method proposed by Brink (J) was followed. The test gravel was subjected to 50 cycles of freezing and thawing in a standard freeze-thaw test apparatus within a temperature range of -15 ± 2°F and 70 ± 2°F. The durations of freezing and thawing were about 3.5 and 1.0 hr,
2
100
so
~
"' 60
;;
'" ~
~ 20
100 70
FIGURE 1
10 1
X PSU RlVER PEA GRAVEL
Y PSU CRUSHED AGGREGATE
a PL[ASANT GAP GRAVEL
• GREEN TREE GRAVEL
e FREEPORT GRAVEL
PARTJCLE DIAMETER (MM)
Gradation curves of test gravels.
respectively. Test results show that the amount of particl.e degradation for both PSU river pea and crushed aggregate 1s very small (less than 2 percent). Because the other gravels were also naturally occurring river gravels and appeared to be as durable as PSU river pea, no freeze-thaw test was performed for these gravels.
Particle angularity was determined by using a metal container 6 in. in diameter and 9 in. in height. For each gravel, particles equal to or larger than the media~ siz~ were compacted in three equal layers by means of the vibration meth~d. Each layer was subjected to a sustained weight of 5 lb~ with a 3-min duration of vibration. The amount of gravel m the container was used to compute the angularity number (AN) from the following equation (2, 3):
AN = 67 - 100 x Ml(V x S) (1)
where
AN = angularity number, M = mean mass of compacted aggregate in the cylinder, V = volume of the cylinder, and S = specific gravity of the aggregate.
TRANSPORTA T!ON RESEARCH RECORD 1250
Equation 1, which is available in British Standard 812, is derived from Shergold's work (4). It can be shown that Equation 1 can be rewritten as follows:
AN= n - 33 (2)
where n is the porosity of the aggregate sample. Thus, the AN value indicates the percentage of voids in excess of 33. It should be noted that the AN value reflects the combined effect of angularity, gradation, shape, and surface texture of aggregate particles.
Table 1 summarizes the results of the angularity measurement along with the test results of L.A. abrasion, specific gravity, and gradation. Of the five test aggregates, the angularity number decreases in the order Freeport gravel, PSU crushed aggregate, Green Tree gravel, Pleasant Gap gravel, and PSU river pea.There is no apparent relationship between the angularity number and particle median size or uniformity coefficient.
PARTICLE SHAPE DETERMINATION
The shape of a particle is quantified by measuring its dimensions in three principal axes. For measurement, about 200 particles coarser than the median size were randomly selected. The measurements were obtained first by hand, using a 0.01-in. precision micrometer. This method of measurement is tedious and very time consuming. In addition, because of the irregular particle shape, it is very difficult to obtain dimensions in three directions that are mutually orthogonal.
Primarily due to the tediousness in the method of measurement and the difficulty in obtaining dimensions in the three orthogonal axes, direct hand measurement was later replaced by another method that utilizes the General Electric (G.E.) Optimization II Vision System. In this method, two images of a gravel particle were obtained with a camera, one on the horizontal plane and the other on the vertical plane. From each image, the distance across the particle's outline area was measured every 30 degrees about the centroid. From these measurements, the maximum, minimum, and mean values were obtained. These values were then converted to the actual dimensions across the particle. The entire process,
TABLE 1 GRADATION, SPECIFIC GRAVITY, ABRASION LOSS, AND ANGULARITY NUMBER OF TEST GRAVELS
L.A. Abrasion /lnguTarITY Test Gravel Medi an Size (lllTI) Uniformity Coeff. Specific Gravity Loss (%) Number
PSU River Pea 12.0 (0.472 in.) ·2. 0 2.60 20. 9 11. 7 Gravel
PSU Crushed 12. 7 (0. 50 in.) 2.4 2. 77 19. 0 22.7 Aggregate
Pleasant Gap 20. 0 (0.787 in.) 1. 5 2.56 35.1 16.0 Gravel
Green Tree 15.0 (0. 591 in.) 1.3 2.57 25 .8 22.5 Gravel
Freeport 5.7 (0.224 in.) 1. 9 2.62 25 .1 24.8 Gravel
Wang
including measurement, conversion, and computation of mean values, was performed on a personal computer.
For each gravel particle, the maximum dimension and the dimension perpendicular to it are obtained from the horizontal view; the smallest dimension is obtained from the vertical view. These values are used as the largest, intermediate, and smallest dimensions of the particle , respectively. Using these dimensions, the particle shape is quantified in terms of sphericity, S, according to the following definition (2, 3, 5):
(3)
where a, b, and care the largest, intermediate, and smallest dimensions of the particle, respectively.
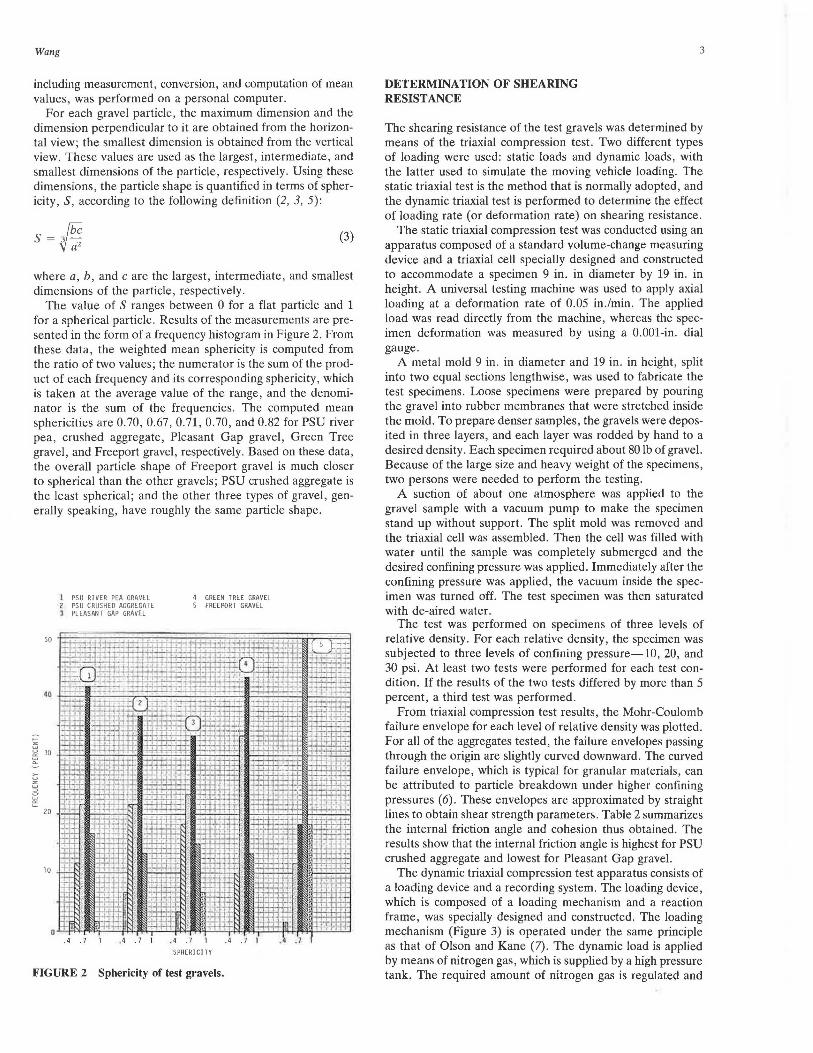
The value of S ranges between 0 for a flat particle and 1 for a spherical particle. Results of the measurements are presented in the form of a frequency histogram in Figure 2. From these data, the weighted mean sphericity is computed from the ratio of two values; the numerator is the sum of the product of each frequency and its corresponding sphericity, which is taken at the average value of the range, and the denominator is the sum of the frequencies. The computed mean sphericities are 0.70, 0.67, 0.71, 0.70, and 0.82 for PSU river pea, crushed aggregate, Pleasant Gap gravel, Green Tree gravel, and Freeport gravel, respectively. Based on these data, the overall particle shape of Freeport gravel is much closer to spherical than the other gravels; PSU crushed aggregate is the least spherical; and the other three types of gravel, generally speaking, have roughly the same particle shape.
PSU RIVER PEA GRAVEL PSU CRUSHED AGGREGATE PLEASANT GAP GRAVEL
GREEN TREE GRAVEL FREEPORT GRAVEL
SPHERI CITY
FIGURE 2 Sphericity of test gravels.
DETERMINATION OF SHEARING RESISTANCE
3
The shearing resistance of the test gravels was determined by means of the triaxial compression test. Two different types of loading were used: static loads and dynamic loads, with the latter used to simulate the moving vehicle loading. The static triaxial test is the method that is normally adopted, and the dynamic triaxial test is performed to determine the effect of loading rate (or deformation rate) on shearing resistance.
The static triaxial compression test was conducted using an apparatus composed of a standard volume-change measuring device and a triaxial cell specially designed and constructed to accommodate a specimen 9 in. in diameter by 19 in. in height. A universal testing machine was used to apply axial loading at a deformation rate of 0.05 in./min. The applied load was read directly from the machine, whereas the specimen deformation was measured by using a 0.001-in. dial gauge.
A metal mold 9 in. in diameter and 19 in. in height, split into two equal sections lengthwise, was used to fabricate the test specimens. Loose specimens were prepared by pouring the gravel into rubber membranes that were stretched inside the mold. To prepare denser samples, the gravels were deposited in three layers, and each layer was rodded by hand to a desired density . Each specimen required about 80 lb of gravel. Because of the large size and heavy weight of the specimens, two persons were needed to perform the testing.
A suction of about one atmosphere was applied to the gravel sample with a vacuum pump to make the specimen stand up without support. The split mold was removed and the triaxial cell was assembled. Then the cell was filled with water until the sample was completely submerged and the desired confining pressure was applied. Immediately after the confining pressure was applied, the vacuum inside the specimen was turned off. The test specimen was then saturated with de-aired water.
The test was performed on specimens of three levels of relative density. For each relative density, the specimen was subjected to three levels of confining pressure-10, 20, and 30 psi. At least two tests were performed for each test condition. If the results of the two tests differed by more than 5 percent, a third test was performed.
From triaxial compression test results, the Mohr-Coulomb failure envelope for each level of relative density was plotted. For all of the aggregates tested, the failure envelopes passing through the origin are slightly curved downward. The curved failure envelope, which is typical for granular materials , can be attributed to particle breakdown under higher confining pressures (6). These envelopes are approximated by straight lines to obtain shear strength parameters. Table 2 summarizes the internal friction angle and cohesion thus obtained. The results show that the internal friction angle is highest for PSU crushed aggregate and lowest for Pleasant Gap gravel.
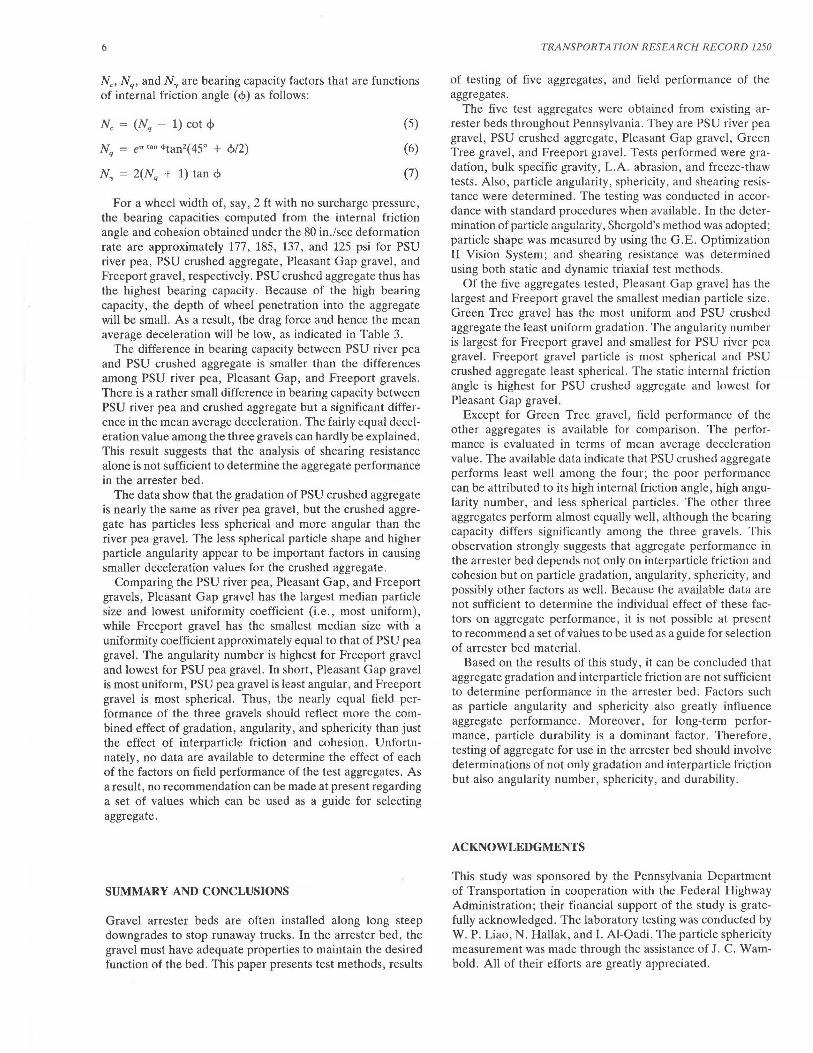
The dynamic triaxial compression test apparatus consists of a loading device and a recording system. The loading device, which is composed of a loading mechanism and a reaction frame, was specially designed and constructed. The loading mechanism (Figure 3) is operated under the same principle as that of Olson and Kane (7). The dynamic load is applied by means of nitrogen gas, which is supplied by a high pressure tank. The required amount of nitrogen gas is regulated and

4 TRANSPORTATION RESEARCH RECORD 1250
TABLE 2 INTERNAL FRICTION ANGLE AND COHESION OBTAINED FROM STATIC AND DYNAMIC TESTS
Aggregate Test
PSU Pea Gravel 35
PSU Crushed 38 Aggreyate
Pleasant Gap 27 Gravel
4 41 2
40
8 30
44
43
31
2
2
9
Green Tree 29 30 9 32 10 Gravel
Freeport 33 34 6 Gravel
*internal friction angle in degrees . **cohesion in psi.
TRIGGER
MAIN VALVE
LOADING CHAMBER
MAIN PRESSURE CHAMBER
LOADING PISTON
FIGURE 3 Schematic view of dynamic loading mechanism.
35
stored in the main pressure chamber. When the loading mechanism is activated by a sudden pull of the trigger, the plug that blocks the main port is lifted rapidly and the gas rushes into the loading chamber. This pushes the loading piston downward at a very high speed and induces the desired vertical loading in the test specimen.
To satisfy safety requirements, the pressure chamber is surrounded by 4-in. x 4-in. studs that are nailed together with two metal strips, and the triaxial cell is enclosed in a metal cage. The cage is made of expanded steel and has a door on one side so that the test specimen in the triaxial cell can be pushed in and out of the cage.
6
39
41
30 4
31 4
34 3
40
40
32 4
31 3
34 2
36
40
30
33
33
36
40
3 32
31 4
34
The vertical (axial) load applied to the test specimen was measured with a type C3Pl load cell, manufactured by BLH, Inc. with maximum capacity of 10,000 lb. The load cell was placed on top of the loading cap, which rested on top of the test specimen. The load cell was connected to a 12-volt amplifier, which was set at an amplification factor of 500.
Test specimen deformations were measured with a linear potentiometer, type M1326-2-502, with a capacity in ohms of SK ± 5 percent and measuring up to 2 inches, purchased from Maurey Instruments. The housing of the linear potentiometer was attached to a steel rod about 0.5 in. in diameter by 6 in. in length, which was in turn clamped perpendicularly to one of the triaxial cell's supporting rods. The core of the linear potentiometer rested vertically on the top of the test specimens.
Both the load cell and the linear potentiometer were connected to a SOL TEC Visigraph-5L electronic recorder. The recorder can accommodate a maximum chart speed of 200 cm/sec.
The dynamic tests were performed only for one level of relative density, which was as close to the loosest condition of the gravel as possible. This relative density level was used to simulate the density condition of the gravel in the arrester bed. For this level of density, the test specimen was subjected to three levels of confining pressure applied through a vacuum; they were 5, 10, and 12.5 psi. The maximum pressure of 12.5 psi was used because it was the highest vacuum the available vacuum pump could produce.
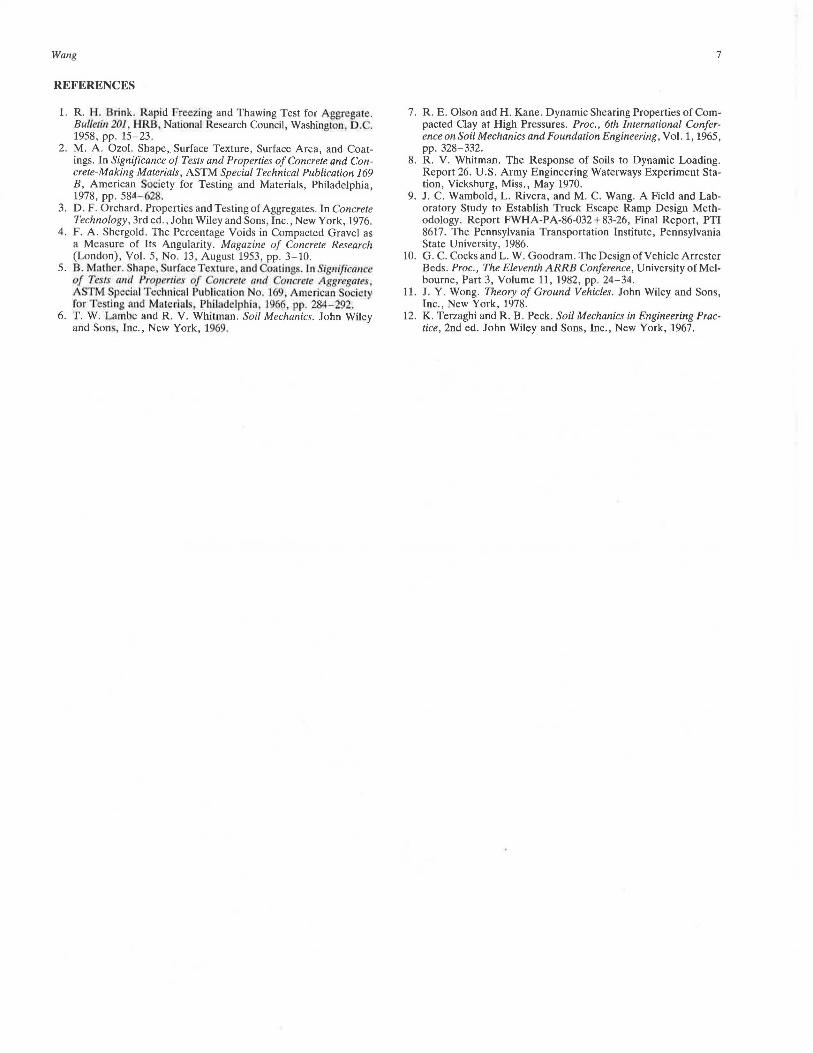
The compressive strength of PSU pea gravel thus obtained is plotted against deformation rate in Figure 4. It is seen that as the rate of deformation increases, the compressive strength decreases from the static value to a minimum, then increases slightly. All other aggregates also exhibit a similar trend. The shape of the curve roughly resembles the trend obtained by Whitman from his study on sands (8). According to Whitman, the decrease in compressive strength with increasing deformation rate can be attributed to the effect of kinetic friction, which is generally less than the static friction. The increase of compressive strength at a very high deformation rate can be explained by the fact that the interlocking among particles becomes more effective when the particles are not given sufficient time to find the easiest path to pass one another.
From these dynamic strength data, the failure envelopes are plotted. As with the static failure envelope, the dynamic

Wang
failure envelope is also slightly curved downward. Using the straight line approximation, the internal friction angle and cohesion for different deformation rates are obtained and are summarized in Table 2. It is seen that within the deformation rates tested, the internal friction angle fluctuates slightly with the deformation rate. The data reveal no definite trend of variation, and therefore the data fluctuation could be attributed to possible testing errors and linear approximation of the failure envelopes.
AGGREGATE PERFORMANCE
Except for the Green Tree gravel, field performance of the test aggregates has been studied by Wambold et al. (9). They conducted extensive field testing to investigate deceleration, stopping distance, and various other important parameters of aggregate performance in the arrester bed. The test was conducted with a wide range of entry speeds and also with dif-
-~
~
"' ~
~
CONFINING PRESSURE
12 , 5 PSI
40
10, 0 PSI
30
20 5 ~ 0 PSI
10 -a ~'---,~o ~'---,~o~'---,-0~'---i-a~'---1~'----'----'120~....._--',.-o--'
DEFOR~IATION RATE (JU/SEC)
FIGURE 4 Deviator stress at failure versus deformation rate for PSU river pea gravel.
5
ferent aggregate layer thicknesses for PSU river pea gravel. The average deceleration data, according to their test results, are tabulated in Table 3. The mean value of deceleration for each aggregate is computed for ease of comparison, because the data are widely scattered and no well-defined trend of variation of deceleration with entry speed similar to that detected by Cocks and Goodram (10) can be found. Because there is no clear trend of how deceleration varies with layer thickness, the PSU river pea gravel data are combined into two levels of thickness in the table.
For dump truck data, the deceleration value of Pleasant Gap gravel was obtained only from one test. Because of the wide scattering of the data, a direct comparison of this value with other data should be made with caution. The dump truck deceleration data clearly indicate that the performance of PSU crushed aggregate is considerably lower than the river pea gravel. Meanwhile, the three types of gravel, generally speaking, perform equally well, although Pleasant Gap gravel slightly outperforms the other two for tests with a dump truck, and Freeport gravel performs a little bett<;r than the others for a tractor-trailer.
In the arrester beds, the moving trucks induce dynamic shearing to the aggregate. Thus, to evaluate the effect of shearing resistance on aggregate performance, the dynamic internal friction angle and cohesion should be used. Furthermore, because there are some resemblances between the process of a wheel sinking into aggregate and the bearing capacity failure of a shallow foundation, the bearing capacity principle has been used to evaluate the resistance of soft ground to moving vehicles (11). The bearing capacity of each aggregate is computed using the following equation (12):
where
q0 = bearing capacity, c = cohesion, q surcharge pressure, "I unit weight of aggregate, and B = width of wheel.
(4)
TABLE 3 AVERAGE DECELERATION DATA (9)
Veh i cfe Test ~GureQ'are-----Tiitry Speed No. of Average necelera El on I2[~: Typ e Aggrega te Thi ckness (i n. ) (mph) Test Range Mean --
Dump PSU River 18 - 22 29 - 54 11 0.26 - 0. 48 0.38 Truck Gravel 30 - 36 39 - 47 8 0.45 - 0.59 0.52
PSU Crushed 15 - 18 29 - 47 10 0.20 - 0.33 0.26 Aggregate
Pleasant Gap 96 50 0.57 0.57 Grava l
Freeport Gravel 72 39 - 54 0.45 - 0.56 0.50
Tractor PSU River 36 40 - 51 0.29 - 0.44 0.36 Trail er Gravel
Pleasant Gap 96 48 2 0.37 - o. 39 0.38 Gravel
Freeport Gravel 72 47 - 60 4 0.37 - 0.52 0.42
6
Nc, Nq, and N~ are bearing capacity factors that are functions of internal friction angle ( <j>) as follows:
Nc = (Nq - 1) cot <!>
Nq = e" <an <l>tan2 ( 45° + <j>/2)
N~ = 2(Nq + 1) tan <j>
(5)
(6)
(7)
For a wheel width of, say, 2 ft with no surcharge pressure, the bearing capacities computed from the internal friction angle and cohesion obtained under the 80 in./sec deformation rate are approximately 177, 185, 137, and 125 psi for PSU river pea, PSU crushed aggregate, Pleasant Gap gravel, and Freeport gravel, respectively. PSU crushed aggregate thus has the highest bearing capacity. Because of the high bearing capacity, the depth of wheel penetration into the aggregate will be small. As a result, the drag force and hence the mean average deceleration will be low, as indicated in Table 3.
The difference in bearing capacity between PSU river pea and PSU crushed aggregate is smaller than the differences among PSU river pea, Pleasant Gap, and Freeport gravels. There is a rather small difference in bearing capacity between PSU river pea and crushed aggregate but a significant difference in the mean average deceleration. The fairly equal deceleration value among the three gravels can hardly be explained. This result suggests that the analysis of shearing resistance alone is not sufficient to determine the aggregate performance in the arrester bed.
The data show that the gradation of PSU crushed aggregate is nearly the same as river pea gravel, but the crushed aggregate has particles less spherical and more angular than the river pea gravel. The less spherical particle shape and higher particle angularity appear to be important factors in causing smaller deceleration values for the crushed aggregate.
Comparing the PSU river pea, Pleasant Gap, and Freeport gravels, Pleasant Gap gravel has the largest median particle siz~ and lowest uniformity coefficient (i.e., most uniform), while Freeport gravel has the smallest median size with a uniformity coefficient approximately equal to that of PSU pea gravel. The angularity number is highest for Freeport gravel and lowest for PSU pea gravel. In short, Pleasant Gap gravel is most uniform, PSU pea gravel is least angular, and Freeport gravel is most spherical. Thus, the nearly equal field performance of the three gravels should reflect more the combined effect of gradation, angularity, and sphericity than just the effect of interparticle friction and cohesion. Unfortunately, no data are available to determine the effect of each of the factors on field performance of the test aggregates. As a result, no recommendation can be made at present regarding a set of values which can be used as a guide for selecting aggregate.
SUMMARY AND CONCLUSIONS
Gravel arrester beds are often installed along long steep downgrades to stop runaway trucks. In the arrester bed, the gravel must have adequate properties to maintain the desired function of the bed. This paper presents test methods, results
TRANSPORTATION RESEARCH RECORD 1250
of testing of five aggregates, and field performance of the aggregates.
The five test aggregates were obtained from existing arrester beds throughout Pennsylvania. They are PSU river pea gravel, PSU crushed aggregate, Pleasant Gap gravel, Green Tree gravel, and Freeport gravel. Tests performed were gradation, bulk specific gravity, L.A. abrasion, and freeze-thaw tests. Also, particle angularity , sphericity, and shearing resistance were determined. The testing was conducted in accordance with standard procedures when available. In the determin~tion of particle angularity, Shcrgold's method was adopted; particle shape was measured by using the G.E. Optimization II Vision System; and shearing resistance was determined using both static and dynamic triaxial test methods.
Of the five aggregates tested, Pleasant Gap gravel has the largest and Freeport gravel the smallest median particle size. Green Tree gravel has the most uniform and PSU crushed ?ggregate the least uniform gradation. The angularity number 1s largest for Freeport gravel and smallest for PSU river pea gravel. Freeport gravel particle is most spherical and PSU crushed aggregate least spherical. The static internal friction angle is highest for PSU crushed aggregate and lowest for Pleasant Gap gravel.
Except for Green Tree gravel, field performance of the other aggregates is available for comparison . The performance is evaluated in terms of mean average deceleration value. The available data indicate that PSU crushed aggregate performs least well among the four; the poor performance can be attributed to its high internal friction angle, high angularity number, and less spherical particles. The other three aggregates perform almost equally well, although the bearing capacity differs significantly among the three gravels. This observation strongly suggests that aggregate performance in the arrester bed depends not only on interparticle friction and cohesion but on particle gradation, angularity, sphericity, and possibly other factors as well. Because the available data are not sufficient to determine the individual effect of these factors on aggregate performance, it is not possible at present to recommend a set of values to be used as a guide for selection of arrester bed material.
Based on the results of this study, it can be concluded that aggregate gradation and interparticle friction are not sufficient to determine performance in the arrester bed . Factors such as particle angularity and sphericity also greatly influence aggregate performance. Moreover, for long-term performance, particle durability is a dominant factor. Therefore, testing of aggregate for use in the arrester bed should involve determinations of not only gradation and interparticle friction but also angularity number, sphericity, and durability .
ACKNOWLEDGMENTS
This study was sponsored by the Pennsylvania Department of Transportation in cooperation with the Federal Highway Administration; their financial support of the study is gratefully acknowledged. The laboratory testing was conducted by W. P. Liao, N. Hallak, and I. Al-Qadi. The particle sphericity measurement was made through the assistance of J.C. Wambold. All of their efforts are greatly appreciated.
Wang
REFERENCES
1. R . H. Brink. Rapid Freezing and Thawing Test for Aggregate. Bu/le1i1120l, KRB, Nmionnl Research Council, Washington , D . . 1958, pp. 15-23.
2. M. A. Ozol. Shape, Surface Texture, Surface Area, and Coatings. In Significance of Tests and Properties of Concrete and Concrete-Making Materials, ASTM Special Technical Publication 169 B, American ociety for Testing and Materials, Philadelphia, 1978, pp. 584- 628.
3. D . F. Orchard. Properties and Testing of Aggregates. In Concrete Technology, 3rd ed., John Wiley and Sons, Inc. , New York, 1976.
4. F. A. Shergold. The Percentage Voids in Compacted Gravel as a Measure of Its Angularity . Magazine of Concrete Research (London), Vol. 5, No. 13, August 1953, pp. 3-10.
5. B. Mather. Shape, Surface Texture, and Coatings. In Significance of Tests mu/ Properties of oncrere 1111<1 oncrete Aggregates ASTM pccial Technical Publ ication o. 169, American oc.icty for Tc ting and Material , Philadelphia , 196~ pp. 284- 292.
6. T. W. Lamhe and R. V. Whitman . Soil Mechanics. John Wiley and Sons, Inc., New York, 1969.
7
7. R. E. Olson and H. Kane. Dynamic Shearing Properties of Compacted Clay at High Pressures . Proc., 6th International Conference on Soil Mechanics and Foundation Engineering, Vol. 1, 1965, pp. 328-332.
8. R. V. Whitman. The Response of Soils to Dynamic Loading. Report 26. U.S. Army Engineering Waterways Experiment Station, Vicksburg, Miss., May 1970.
9. J. C. Wambold, L. Rivera, and M. C. Wang. A Field and Laboratory Study to Establish Truck Escape Ramp Design Methodology. Report FWHA-PA-86-032+83-26, Final Report, PTI 8617. The Pennsylvania Transportation Institute, Pennsylvania State University, 1986.
10. G . C. Cocks and L. W. Goodram . The Design of Vehicle Arrester Beds . Proc., The Eleventh ARRB Conference, University of Melbourne, Part 3, Volume 11, 1982, pp. 24-34.
11. J. Y. Wong. Theory of Ground Vehicles. John Wiley and Sons, Inc., New York, 1978.
12. K. Terzaghi and R. B. Peck. Soil Mechanics in Engineering Practice, 2nd ed. John Wiley and Sons, Inc., New York, 1967.