aggregating voters and the electoral connection: the e ect
TRANSCRIPT

Aggregating Voters and the Electoral Connection: TheEffect of District Representation on the Distributive
Equity of the Housing Supply
Michael Hankinson∗ Asya Magazinnik†
August 21, 2019
Abstract
How does the aggregation of voters affect policy outcomes? We leverage the CaliforniaVoting Rights Act of 2001 as a conditionally exogenous institutional reform, compellingover one hundred cities in California to switch from multi-member (‘at-large’) to single-member (‘district’) elections for city council. Using panel data, we find that districtrepresentation causes a substantial decrease in the permitting of multifamily housing,the type of housing residents are most likely to oppose in their neighborhood. How-ever, the reform also causes the housing that is permitted to be more affordable andmore equitably spread throughout the city. Thus, district elections both amplify thelocal interests of previously underrepresented groups, but also threaten the collectiveprovision of goods that society needs, but few people want nearby.
Keywords: institutions, representation, panel data, local political economy
Both authors contributed equally. We appreciate the research assistance of Isaac Hietanen and LauraAgosto. All mistakes, however, are our own.∗Assistant Professor, Department of Political Science, Baruch College, City University of New York.
[email protected]†PhD Candidate, Department of Political Science, Princeton University. [email protected]
1

A representative democracy requires that voter preferences influence policy outcomes
through the behavior of elected officials. Inherent in this connection of voters to policy is
the decision of how to aggregate those preferences. Given a population, voters can be aggre-
gated into one large, multi-member district, with each citizen voting for several candidates
(‘at-large elections’). Or, voters can be disaggregated into several smaller, single-member
districts, with each citizen voting for only one candidate to represent their district (‘district
elections’).1 While both institutional forms aggregate the preferences of an identical voting
population, they produce different constituencies for elected officials, with some beholden to
the population as a whole versus only those voters in their district.
How voters are aggregated not only affects who legislators are accountable to, but which
coalitions achieve representation. In the United States, non-white voters often compose a
minority of the voting population. Consequently, at-large representation has generally been
found to suppress the descriptive representation of minorities (Engstrom and McDonald,
1981; Leal, Martinez-Ebers, and Meier, 2004; Marschall, Ruhil, and Shah, 2010; Meier et al.,
2005; Molina Jr and Meier, 2018), albeit more so under specific conditions (Abott and
Magazinnik, 2019; Trounstine and Valdini, 2008; Welch, 1990). In an at-large city, so long
as white residents vote predominantly for candidates from their majority in-group, the white
majority can prevent the election of any minority candidates to city council. In contrast,
district boundaries can be drawn to provide minorities a large enough vote share to elect a
minority city council member even in the presence of racially polarized voting.
By increasing descriptive representation, switching to district-elected city councils should
produce policies more in line with the city’s median voter, all else equal. But by definition,
district elections also empower local interests. Instead of policy reflecting a single, citywide
median voter, legislation is crafted by district-elected officials responsive to their district’s
median voter (Trounstine, 2010). For some policies, the aggregate of these district medians
will equal the at-large median, producing policy outcomes identical to the at-large coun-
1District representation is known by many different names, including “by-trustee” and “ward.” For the sakeof clarity, we will use the term “district” throughout.
1
terfactual. But for others, the process of aggregating medians will affect policy outcomes.
For instance, city council members tend to have more influence over issues that directly
affect their own district, a deference known as ‘aldermanic privilege’ (Banfield and Wilson,
1963; Schleicher, 2013). If district-elected councils defer to these local preferences, then
policy will be more responsive to the host district’s median voter, rather than the city-
wide median voter. This variation in policy from the same population raises a foundational
challenge for democracy: To what extent do district elections—while enhancing descriptive
representation—amplify local interests at the expense of collective outcomes?
A strong test of local versus collective interests requires an outcome where the con-
stituency pressures of the at-large elected official differ the most from those of the official
elected by-district. An example of this divergence occurs in the siting of land uses that soci-
ety needs but few citizens want nearby. These locally unwanted land uses (‘LULUs’) range
from new housing (Hankinson, 2018), to energy facilities (Stokes, 2016), to drug addiction
treatment clinics (de Benedictis-Kessner and Hankinson, Forthcoming). Because LULUs are
perceived to threaten the property values, safety, or general quality of life of nearby resi-
dents, legislators representing the host district have a strong electoral incentive to oppose
their siting. Whereas legislators generally target concentrated benefits to their constituents
and duck blame for diffuse costs spread nationally (Mayhew, 1974), LULU politics incen-
tivize legislators to block concentrated costs from their constituents and duck the diffuse
blame from a citywide electorate unable to hold them accountable (Denzau and Weingast,
1982).
Of all possible LULUs, the permitting of new housing is perhaps ideal for measuring the
effect of voter aggregation on policy. First, new housing is often opposed most by those
living nearby due to the noise, traffic, loss of open space, change of aesthetics, and fear
of new residents that the housing will bring (Einstein, Palmer, and Glick, 2019). Second,
permitting is controlled almost exclusively by municipal governments, which are numerous
and divided between at-large and district elections for city council. Third, housing permits
2

are issued continually, providing far more observable outcomes than the extremely rare siting
of new landfills or other LULUs.
Finally, understanding the siting challenges of new housing has a strong normative moti-
vation. Since 1970, real housing prices in the United States have dramatically increased, with
growth led by the top quintile of high demand cities (Glaeser, Gyourko, and Saks, 2005).
This rise in prices stems from an inability of new supply to meet demand due to political
restrictions that limit the quantity of new homes and apartments (Mayer and Somerville,
2000; Quigley and Raphael, 2005). While these restrictions are local, their consequences
are national. Limits on new housing not only increase rent burdens (Charette et al., 2015),
but also threaten the upward income mobility (Ganong and Shoag, 2017), economic growth
(Hsieh and Moretti, 2019), and environmental sustainability (Jones and Kammen, 2014) of
the United States as a whole.
We believe that voter aggregation affects the housing supply in two ways, illustrating
the tradeoff between local interests and collective outcomes. First, cities that switch to
district elections will permit less new housing annually. Because at-large representation
is not evenly distributed across the city, at-large city councils are more able to channel
unwanted housing into politically weak, often majority-minority neighborhoods. District
elections distribute representation evenly. With ostensibly no weak neighborhoods, district-
elected city councils face political pushback to housing throughout the city, causing fewer
new units to be permitted citywide.
Second, cities that switch to district elections will permit housing more equitably across
neighborhoods. Because at-large systems are more likely to underrepresent minorities, un-
wanted housing is more likely to be concentrated in minority neighborhoods. When district
elections empower local interests, they primarily amplify the voice of minority neighbor-
hoods, as white neighborhoods are already represented by at-large coalitions. No longer
able to channel housing into weak, minority neighborhoods, district-elected city councils will
more evenly distribute new housing across neighborhoods—and consequently demographic
3
groups.
Together, these two processes capture the challenge of voter aggregation for democracy.
District representation may lead to a more equitable distribution of housing, but at the
cost of building less housing overall. Because of limited new supply, local housing costs
will likely rise even higher, disproportionately harming the well-being of low-income and
minority communities. In other words, each district’s local interest in blocking unwanted
housing conflicts with a collective outcome of protecting affordability by permitting enough
new supply to meed demand.
To causally identify the effect of voter aggregation on the housing supply, we leverage
the California Voting Rights Act of 2001 (CVRA) as a conditionally exogenous treatment,
spurring city councils to switch from at-large to district elections. First, we use city-level
panel data to measure the effect of this conversion on the amount, structural composition,
and affordability of new housing units permitted annually. Second, we use an original panel
dataset of geocoded housing approvals within six cities to capture the effect of district elec-
tions on the spatial distribution of new housing within each city.
We find that the switch to district elections causes a 44 percent decrease in the permitting
of multifamily housing. However, housing which is permitted is more likely to be affordable
to low-income residents. Additionally, district elections decrease the spatial concentration of
new housing by breaking the correlation between a neighborhood’s racial composition and
the number of new units permitted. Not only is new housing more equitably distributed
across the city, but it is less likely to be concentrated in minority neighborhoods. We
close by discussing the policy implications of these findings—how to balance descriptive
representation and local interests with collective outcomes in responding to the housing
affordability crisis.
4

Theoretical Expectations
The ‘electoral connection’ refers to the link of accountability between elected officials and
their constituents (Mayhew, 1974). In pursuit of reelection, representatives strive to meet
the needs of their constituencies. As a result, even if legislating on the same policy ques-
tions for the same population, an elected official is expected to behave differently should
their constituency within that population change. Possibly the most extreme change in
constituency occurs when legislative bodies switch from multi-member, at-large elections to
single member, district elections. While single and multi-member districts exist in assorted
forms internationally, variation at the same level of government is perhaps most prevalent in
the structure of American city councils. As of 2012, approximately 64 percent of American
municipalities relied on at-large voting for their city council elections, whereas 14 percent
used district elections, with the remaining 22 percent utilizing some form of hybrid at-large
and district systems (Clark and Krebs, 2012).2
This city-level variation stems largely from the early 20th century, when municipal re-
formers sought to counter the influence of machine-style politics via at-large electoral sys-
tems (Davidson and Korbel, 1981; Trounstine, 2009). Theoretically, at-large elections would
produce city council members interested in the outcomes of the city as a whole, rather
than the parochialism and patronage politics of their district (Banfield and Wilson, 1963).
In practice, by expanding the scope of conflict to the city level, at-large elections allowed
citywide coalitions to dominate. So long as the city maintained a majority white popula-
tion, this coalition could prevent the descriptive representation of its minority citizens. To
Progressive Era reformers, minority groups were largely Catholic and southern European
immigrants (Bridges, 1999). To whites of the post-Reconstruction South, minority groups
meant African-Americans (Kousser, 2000). Above all, the at-large aggregation of voters was
a conscious decision in pursuit of exclusionary representation and policy outcomes.
2We use the term “city” throughout the paper to stand-in for any incorporated municipality. Regardingour data analysis, while California municipalities may self-describe as cities or towns, there is no legaldistinction.
5
The use of institutional design to disenfranchise did not go unnoticed. Section 2 of
The Voting Rights Act of 1965 specifically prohibits “voting regulations or prerequisite to
voting, or standard, practice or procedure” meant to discriminate on the basis of race.
After challenging direct impediments to black voter registration, civil rights advocates began
using Section 2 to target southern cities with at-large elections (Issacharoff, 1991). Though
successful litigation was limited by a high standard of proof, southern cities that converted to
district elections in the wake of the VRA did experience increased minority representation
(Sass and Mehay, 1995). Beyond representation, the post-VRA shift to district elections
also affected policy outcomes, albeit with potentially unintended consequences. Southern
cities that switched to district elections in the wake of the Voting Rights Act were found
to generate higher pension benefits while simultaneously lowering funding for those benefits
and decreasing investment in infrastructure (Boylan and Stevenson, 2017). In other words,
district-elected leaders were more likely to ‘time-shift’ expenditures, delaying unpopular
payments to future voters.
Other work has found weaker institutional effects. Comparing voter preferences to munic-
ipal policy outcomes, Tausanovitch and Warshaw (2014) find little evidence of a moderating
effect of at-large versus district elections. However, that study does not investigate outcomes
or preferences linked to land use, an omission which encourages additional research in two
ways. First, land use is often considered the primary policy domain of local politics, one al-
most exclusively controlled by the municipal government (Peterson, 1981). Second, whereas
Tausanovitch and Warshaw (2014) compare the ideology of citizens to the ideological place-
ment of policy outcomes, local housing policy has been found to lack a strong ideological
dimension (Marble and Nall, 2018). This importance in local politics and orthogonality to
ideology call for a direct examination of the effect of institutions on land use policy.
Similar to the ‘time-shifting’ of expenditures, we believe that district-elected represen-
tatives are incentivized to ‘spatially shift’ burdensome LULUs out of their own district.
Theoretically, were a LULU in the city’s collective interest, the remaining n − 1 council
6

members would vote in favor of the siting proposal. However, this collective outcome of
more housing is threatened by the iterated nature of city council voting. A form of legisla-
tive log-rolling, city council members often defer to the preferences of the council member
representing the host neighborhood. This local deference is repaid to each member in future
siting decisions, allowing them to survive the political threat of a LULU when it is proposed
for their own district (Schleicher, 2013).3
With each neighborhood able to block new development, district-elected cities will strug-
gle to permit new housing compared to their at-large peers. Cross-sectional studies of local
institutions support this theory, finding district elections to be associated with increased
use of growth management regulation (Feiock, Tavares, and Lubell, 2008), greater restric-
tions on the siting of group homes (Clingermayer, 1994), and decreased permitting of single
family homes (Lubell, Feiock, and De La Cruz, 2009). We build upon this theory by first
measuring the causal effect of district elections on the volume and composition of the local
housing supply. Second, we look within cities to directly observe the mechanism behind
district-elected cities’ decrease in new housing—the ability of previously underrepresented
minority neighborhoods to block new LULUs.
Identifying the Causal Effect of District Elections on
Policy Outcomes
Existing research has struggled to identify the causal effect of district elections on political
and policy outcomes. Even after controlling for any number of covariates, crucial unobserved
differences remain between areas with histories under each rule. Those that switch from one
system to another are also likely to have unusual features that confound estimates of the
effect of conversion. Even studies leveraging the reform of the Voting Rights Act of 1965
suffer from endogenous enforcement, relying on assumptions of unobservable covariates (e.g.,
3See Burnett and Kogan (2014) for limitations to aldermanic privilege.
7
Boylan and Stevenson, 2017).
We advance our understanding of the causal effect of voter aggregation by leveraging the
California Voting Rights Act of 2001 (CVRA). In the pursuit of equal representation, the
CVRA lowered the legal standard for plaintiffs to win cases alleging minority vote dilution
under at-large electoral systems. To prove discrimination under the VRA, plaintiffs have
to meet a three part test of minority size and geographic compactness, minority political
cohesion, and a bloc voting majority (Kousser, 1992). Under the CVRA, plaintiffs no longer
have to demonstrate a specific geographic district where a minority is concentrated enough
to establish a majority. Additionally, California city governments are now responsible for all
legal and court fees, even in the case of an out of court settlement (Ingram, 2012). These
changes have spurred a wave of litigation against cities with at-large elections.
The CVRA presents an opportunity for causal identification. In principle, the CVRA
has enabled law firms to threaten litigation against the vast majority of at-large local gov-
ernments in California. In practice, firms have only pursued legal action in a subset of these
eligible jurisdictions due to limited resources, with litigation threats rolling out gradually
over time. Importantly, of the more than 100 municipalities targeted, none of them have
successfully resisted the switch from at-large to district elections.
We leverage this slow rollout over time to measure the effect of district elections on
housing, Specifically, we use a differences-in-differences framework, including city and year
fixed effects as detailed below. This baseline difference-in-differences estimate rules out
confounding from any time-invariant factors, but also assumes that changes in electoral
system are unrelated to any other changes that might also influence housing permitting.
While this assumption is much weaker than in a cross-sectional design, it is still possible
that other determinants of permitting also change when a city changes its electoral system,
biasing estimates.
For example, the switch to district elections may correlate with changes in voter prefer-
ences for housing. In this scenario, district elections are not amplifying local NIMBY (‘Not
8
In My Backyard’) interests, but are capturing newly emerged preferences, just as at-large
elections would. We believe this to be unlikely. Through conversations with city council
members and lawyers litigating CVRA cases, as well as reviewing several hundred local me-
dia articles and coding nearly a decade of city council meeting minutes over six cities, we have
not encountered any discussion of housing politics driving CVRA litigation. Furthermore,
while an annual, city-level measure of NIMBY preferences does not exist, we can proxy for
changing preferences using time-varying measures of demographic variables, including pop-
ulation, median income, the percentage of white, black, and Latino residents, as well as the
percentage of residents who are homeowners. Additionally, we can account for changes in
the local housing market which may affect permitting activity by controlling for the city’s
residential vacancy rate and the median home value. We include these time-varying controls
in all of our models.
As an additional check against endogenity, we repeat each city-level analysis using a
subset of cities which either switch to district elections during our panel (‘treated units’)
or have agreed to switch in an upcoming election (‘to be treated’). As targets of CVRA
litigation, these ‘eventually treated’ cities are likely to be more similar to each other than
cities which neither have nor may ever be targets of the CVRA. While this subset limits
external validity to similar cities, it helps to control for unobservable confounders. The
results of these models are substantively identical to those conducted on the full sample of
California cities and are presented in Appendix G.
In all, the distribution of legal threats across cities and over years generates a panel of
conversions from at-large to district elections exogenous to our outcome of housing permit-
ting. To our knowledge, this reform provides the best opportunity to measure the effect of
voter aggregation on policy outcomes, revealing the shift in political power from collective
to local interests. We measure this shift through changes in the permitting of new housing
units and the process of discretionary review.4
4Unfortunately, we cannot discern the independent effect of descriptive representation from enhanced localinterests, as both effects are the result of district elections. We revisit this limitation in our Discussion.
9

The Political Economy of Zoning
In the United States, proposals for new development travel through one of two paths: ‘by
right’ and discretionary review (Schleicher, 2013). By right proposals are those that are
allowed under the existing regulations, known as the zoning code. For example, if a developer
wants to build a 6-unit apartment building in an area zoned for up to 6 units of multifamily
housing, that developer’s application simply needs to meet the necessary building standards
and codes. As a result, the 6-unit project is insulated from political pressure that could
either downsize or even block the proposal.
However, if the developer wants to exceed the allowable capacity of the lot by build-
ing a 12-unit apartment building on that same parcel, her application will be subject to
discretionary review by the city’s planning commission and, occasionally, the city council.
Review begins with a public hearing where any resident is allowed to speak for or against the
proposal. After deliberation, members of the legislative body vote whether to approve the
project by granting a zoning amendment.5 Consequently, discretionary review opens the per-
mitting process to political demands, with voters directly pressuring members of city council
via the electoral connection. In California, members of the planning commission are also
vulnerable. Not only are they appointed by city council, but their zoning decisions may be
appealed to city council (Taylor, 1962), effectively keeping their verdicts in line with council
preferences. In other words, both legislative bodies are subject to the electoral connection
and therefore the political effects of the CVRA.
Like any regulatory regime, the discretionary review of housing proposals generates its
own political economy. But unlike the distributive boon of pork barrel politics, new housing
is often seen as a distributive burden to nearby residents. Development brings noise and
congestion, harming quality of life. New residents often consume more in public services than
they provide in tax revenue, raising the tax burden of existing property owners (Hamilton,
5The same discretionary review process applies to zoning variances and conditional use permits, which, whilelegally distinct, are effectively similar requests for exemption from the current zoning code.
10
1976). Biases against social or racial outgroups may cause current residents to be wary of
new neighbors, especially if those neighbors are of lower economic standing (Charles, 2006).
These threats to property values lead risk averse homeowners to oppose new housing in
favor of the status quo (Fischel, 2001).6 In contrast, renters generally prefer more housing.
However, in cities with high housing prices, renters too may be risk averse, associating new
housing with rising prices. Consequently, risk averse renters also resist new market-rate
housing when it is proposed for their neighborhood (Hankinson, 2018). The political force
of these NIMBY homeowners and renters has led to an inability of the housing supply to
meet growing demand, increasing prices both within municipalities and entire metropolitan
areas (Ganong and Shoag, 2017).
Still, housing preferences are not uniform, but vary based on the unit’s structure and
affordability. Housing may range from low density, detached single family homes to high
density apartment buildings. New single family homes are seen as the most tolerable form of
housing (Marble and Nall, 2018). All else equal, a single family home is far more expensive
than a unit within a multifamily apartment building. Thus, future residents are more likely
to be white and contribute more in tax revenue than they use in public services, mitigating
some of the above concerns. Labeled “cumulative zoning,” this preference for single family
homes has existed since the inception of zoning in early 20th century (Hills Jr and Schleicher,
2010). As a formal hierarchy, single family housing is often permitted by right anywhere that
is residentially zoned, whereas multifamily housing is restricted to specific areas or requires
discretionary review.
Preferences also vary by affordability. The Department of Housing and Urban Develop-
ment classifies a unit as “affordable” if its annual costs amount to no more than 30 percent of
a household’s annual income (Charette et al., 2015). Units affordable to those making above
120% of the Area Median Income (AMI) are considered ‘above moderate-income’ housing.
In contrast, units affordable to a household making less than 80% AMI are considered ‘low-
6Even in majority renter cities, neighborhoods with higher homeownership rates are more likely to be ‘down-zoned,’ decreasing by right buildable capacity (Been, Madar, and McDonnell, 2014).
11

income’ housing. Generally speaking, residents concerned with maintaining property values
will prefer above moderate-income housing, while residents concerned about rising prices
and gentrification will prefer housing affordable to low-income residents (Hankinson, 2018).
The amount, structure, and affordability of new housing are all consequences of the po-
litical economy of zoning. The electoral connection gives control of these policy outcomes
to voters via discretionary review. Spurred by voter pressure, some city councils and plan-
ning commissions stifle new housing in well-represented neighborhoods, while permitting it
in politically weak ones. Others only allow new housing if it includes units affordable to
their constituents, be they wealthy homeowners or low-income renters.7 If district elections
enhance the political influence of minority neighborhoods and local interests, we should see
those shifts reflected in the amount, type, and location of new housing permitted through
discretionary review.
Hypotheses
We expect that cities which switch to district elections under the CVRA will experience
changes in the amount, structure, affordability, and spatial distribution of new housing units
permitted. Primarily, the conversion to district elections will decrease the number of new
units permitted annually. However, we predict heterogeneous effects across the structure of
those units as well as the city’s level of segregation and racial diversity. Additionally, we
expect district aggregation to increase the share of new housing that is affordable to low-
income residents. Finally, we believe district elections will affect the spatial distribution of
new housing within cities, specifically the relationship between new units permitted and a
neighborhood’s racial composition.
First, we expect the decrease in units permitted to be driven almost exclusively by a
7A case study of Atlanta, GA spotlights the importance of descriptive representation, with new housingdisproportionately channeled into black neighborhoods until the election of black city council members(Hinds and Ordway, 1986). See Sances and You (2017) for recent advances on the connection betweendescriptive representation and distributive burdens.
12
decrease in the permitting of multifamily housing for three reasons. First, as stated, single
family homes are viewed as more benign, meaning there is little neighborhood opposition
to be amplified by district constituencies. Second, because they require a large amount of
space per unit, single family homes are rarely proposed in already developed parts of a city.
Instead, they are built on the outskirts, were there are few neighbors to provoke. Finally,
because of cumulative zoning, single family homes rarely require discretionary review. Thus,
NIMBY opposition lacks the venue to publicly pressure legislators to veto or scale back
single family proposals. In contrast, multifamily housing is almost uniformly less desirable,
more likely planned in densely populated areas, and more often requires discretionary review
vulnerable to district-based pressures.
Second, we expect the effect of district elections to vary across cities according to levels
of segregation and racial diversity. For district elections to make a meaningful difference
in representation, minority racial groups must be segregated (Marschall, Ruhil, and Shah,
2010; Trounstine and Valdini, 2008; Vedlitz and Johnson, 1982). More segregated cities foster
majority-minority districts. Once formed, these districts can more easily elect a minority
candidate, changing the descriptive representation of city council. Segregated cities may also
be more likely to create the initial conditions for an unequal distribution of housing. If white
voters are evenly distributed, there may be fewer politically weak neighborhoods in which
to concentrate housing. If no neighborhood serves as a ‘dumping ground,’ district elections
will not have an imbalance to correct. Though we are unable to discern which of the two
pathways is more responsible, we expect higher levels of segregation to be associated with a
larger decrease in units permitted annually.
Variation is also likely to stem from the racial diversity of the city. To dilute minority
influence, at-large elections require a voting population which is over 50% white. Below
this threshold, the white population may struggle to control city council (Trebbi, Aghion,
and Alesina, 2008). Higher turnout among white residents means that a white population
below 50% could still comprise over 50% of voters. The abysmally low turnout rates in
13
local elections heighten this imbalance between white residents’ share of the electorate and
share of the overall city population (Hajnal and Trounstine, 2005).8 Therefore, we expect
district elections to have the greatest effect on permitting in cities where non-Hispanic whites
compose a larger share of the population. In contrast, cities with fewer whites are less likely
to suffer majority bloc voting pre-treatment, meaning the switch to district elections will
have less of an effect on their policy outcomes.
Third, we expect the effect of district elections to vary across levels of housing affordabil-
ity. Given at-large elections dilute the power of minority voters, newly empowered neigh-
borhoods are more likely to be composed of lower income residents. Threatened by rising
prices, these voters are likely to demand less market-rate housing commonly associated with
gentrification and more housing affordable to low-income residents. Consequently, we pre-
dict that district elections will produce a distributional change in new supply, with a larger
proportion of the housing that is permitted affordable to low-income residents.
Finally, along with changes in the housing supply across cities, we also expect a change in
the spatial distribution of new housing within cities. District elections mean representation
has been evenly divided across the city. In turn, council members will find it harder to
channel unwanted housing into underrepresented communities. Our hypotheses regarding
spatial allocation are twofold. First, upon conversion to district elections, housing units
permitted through the discretionary review will be more evenly distributed throughout the
city. Second, because previously underrepresented neighborhoods are likely to be minority
communities, we expect that any positive relationship between minority communities and
new housing permitted will weaken with the advent of district elections. In other words,
race will become less predictive of a neighborhood’s housing burden.
8This imbalance in local political participation also magnifies NIMBY voices at public hearings about newhousing development (Einstein, Palmer, and Glick, 2019).
14

Research Design and Data
To test our hypotheses, we constructed a comprehensive database of all 482 municipalities in
California. We recorded each city’s council structure (district or at-large) and, for cities that
switched to district elections, the year of its first district election. To visualize the rollout
of switches over time, Figure 1 presents the cumulative distribution of cities with district
elections. After a slow start, 23 cities held their first district election in 2016. Only one
city held their first election in 2017, an off-cycle year, but 56 additional cities held their first
district election in 2018. In sum, of the 88 cities to switch electoral structures post-CVRA,
64% of them did so in 2018.
● ● ● ● ● ●
● ●
●
0.0
0.1
0.2
0.3
0.4
2010 2012 2014 2016 2018
Year
Pro
port
ion
of c
ities
with
sin
gle−
mem
ber
dist
ricts
Figure 1: Proportion of California cities with district elections over time.
The switch to district elections is a treatment with imprecise timing. First, cities stagger
their council elections, with only half of a city’s council seats contested every two years. As
a result, the first district election only changes the constituencies of half of the city council
members. Second, members of city council elected in the fall do not take office until January
of the following calendar year. Thus, district elections should not directly affect permitting
until the year after the first election. However, indirect effects likely occur earlier. Upon
deciding to switch, council members may alter their behavior to secure re-election via a
15
district-based campaign. Controversial housing proposals may have trouble winning approval
as council members seek to gain a new identity as a neighborhood protector. We investigate
the imprecision of treatment timing using a Granger causality test (e.g., Autor, 2003), adding
indicator variables for each year pre- and post-treatment. Figure 3, discussed below, shows
treatment effect concentrated in the year of the first district election. Consequently, we use
the year of first district election as the date of treatment throughout this study.
Aggregate Outcomes
We first test the effect of district elections on the number of housing units permitted each year
at the city level. To do so, we use a panel of housing permit data from 469 municipalities from
2010 to 2018 collected by the U.S. Census Building Permits Survey.9 These data include the
number of total units permitted as well as the distribution of new units between single family
and multifamily housing. For each analysis, we use a difference-in-differences framework with
the city as the unit of analysis, the switch to district elections as the treatment, and logged
units permitted as our dependent variable (e.g., Glaeser and Ward, 2009; Kahn, 2011).
Specifically, we include city and year fixed effects as well as city-specific linear time trends
(e.g., Dynarski, Jacob, and Kreisman, 2018; Wolfers, 2006), with Huber-White standard
errors clustered at the city level. To account for time-varying city attributes, we include
5-year estimates from the American Community Survey from 2010 to 2018 of population,
percent non-Hispanic white, percent black, percent Hispanic, median income, homeownership
rate, home vacancy rates, and median home value, with estimates interpolated for 2017 and
2018 observations. 10
To test for heterogeneous effects across cities, we use the same model but compare cities
in the top tercile of our variable of interest to those in the bottom tercile. We do so by
including an interaction for being in the top tercile and dropping the middle tercile of data,
913 of the 482 municipalities in California did not report annual housing permit data to the U.S. Census.10We impute missing data for control variables throughout this study using Amelia (Honaker, King, and
Blackwell, 2011). The medians and ranges of control variables are substantively the same before and afterimputing missing data.
16
thus directly comparing the treatment effect of district elections across cities with high and
low values of segregation and racial diversity. We measure citywide segregation using the
Theil’s H index (Thiel, 1972) as calculated in Trounstine (2016).11
Next, we provide direct evidence of how district elections affect the affordability of new
housing. Each year, California cities report of the number of units they permit within each
band of affordability: very low-income (0-50% AMI), low-income (50-80% AMI), moderate-
income (80-120% AMI), and above-moderate income (above 120% AMI) (Dept HCD APR
Instructions). To measure the effect of district elections on affordability, we repeat our
first difference-in-differences model using the same specifications, but with the proportion
of housing units permitted that are affordable to low and very-low income residents as our
dependent variable. Furthermore, we capture the composition of this shift in affordability
by repeating the difference-in-differences model for each income band of affordability, using
log units permitted as our dependent variable.
Spatial Outcomes
Having measured the effect of district representation on the aggregate supply of housing,
we apply our theory to the spatial distribution of the housing supply. To measure these
geographic effects, we constructed a dataset of zoning changes emerging from the discre-
tionary review process. Specifically, within our 6 sampled cities, we reviewed every meeting
of the planning commission and city council from 2011 through 2018. We coded details of
each housing proposal and zoning change approved for development, including the number of
units, the composition of units, the proposal’s address, and year of approval.12 We geocoded
these changes in the ‘by right’ buildable capacity to the Census block group level and merged
them with time-varying socioeconomic variables drawn from the American Community Sur-
vey. These block group-level controls include median income, percent non-Hispanic white,
11Due to collinearity with our interaction variables, time-varying measures of racial demographics are ex-cluded from these heterogeneous effects models.
12Coding decisions are discussed in more detail in Appendix B.
17
percent black, percent Hispanic, homeownership rate, residential vacancy rate, and median
home value.
The intensity of this data collection required sampling cities. First, we selected cities
with more than one year of post-treatment data. Second, we chose cities that had a non-
Hispanic white population large enough to potentially dilute minority representation via
bloc majority voting. Third, we chose cities large enough to generate enough new permits
that an effect would be detectable. These decision rules winnowed treated cities to Santa
Barbara, Escondido, and Anaheim. We match these treated cities to similarly sized and
racially composed cities with at-large elections as controls: Santa Cruz, San Buenaventura
(Ventura), and Glendale, respectively.13 Larger and more diverse than the average California
city, the cities of this sample limit external validity. However, we believe our spatial findings
capture a generalizable mechanism behind how district elections effect the housing supply.
To measure the spatial concentration of new housing, we calculated the Moran’s I of
housing units permitted each year. Moran’s I is a measure of spatial clustering which com-
pares the spatial distribution of a variable to an as-if random distribution (Anselin, 1988;
Moran, 1948).14 Positive values show that the distribution is more concentrated than would
otherwise be expected by randomness.15 While we have little doubt that housing permits
are spatially concentrated, we expect this concentration to decrease after a city switches
to district elections. To measure this change, we calculate the Moran’s I using a queen
contiguity matrix within each city for each year from 2011 to 2018. We then average the
Moran’s I within each treated city during the pre- and post-treatment periods, and present
the difference. We repeat these for our treated cities’ matches pairs, defining pseudo-pre-
and post-treatment periods to test for similar decreases in the concentration of new housing.
Finally, we examine the distributive equity of the housing supply by estimating the cor-
relation between a neighborhood’s racial composition and the number of housing units per-
13Table A shows demographic data of these matched pairs.14Equation for Moran’s I presented in Appendix C.15Within political science, Moran’s I has been used to measure the spatial clustering of voter turnout (Chen,
2013; Darmofal, 2006) and campaign contributions (Gimpel, Lee, and Kaminski, 2006; Tam Cho, 2003).
18

mitted within that neighborhood. We replicate our first model—the difference-in-differences
design—using the block group as our unit of analysis. Our dependent variable is log housing
units permitted annually via discretionary review. To capture the role of race, we define
minority and non-minority block groups using cutpoints from the top and bottom tercile of
percent non-Hispanic white in treated cities. ‘White’ block groups are more than 64% white,
‘minority’ block groups are less than 35% white. We use these cutpoints to classify the block
groups of all six treated and control cities as either minority or white, dropping the middle
tercile of block groups from the analysis.
To measure the effect of district elections within cities, we interact our independent vari-
able, the switch to district elections, with an indicator for being a minority block group. This
interaction signifies whether district elections affect the housing supply differently within mi-
nority blocks groups compared to non-minority block groups. We include city fixed effects
so our model only compares minority and white block groups within the same city. Year
fixed effects and city-specific linear time trends are also used, with Huber-white standard
errors clustered by block group. For time-varying controls, we use same covariates as in our
aggregate supply models, now measured at the block group level.
Results
We present our results in the same order as our hypotheses, beginning with aggregate out-
comes across cities. We start with the effect of district elections on single family and mul-
tifamily housing units permitted. We then examine our identification assumptions using a
Granger causality test. Next, we test for heterogeneous effects across cities and affordability
levels. Finally, we present effects on the spatial distribution of housing within cities, mea-
suring changes in both the concentration of new housing and the role of race in determining
a neighborhood’s housing burden.
19

Aggregate Outcomes
Figure 2 shows the effect of district elections on the number of housing units permitted
annually.16 For interpretability, we present coefficients transformed from log housing to the
percent change in housing units permitted, with total housing units to the left and single
family and multifamily housing to the right.17 Conversion to district elections decreases per-
mitting of all housing units by 14 percent, however the effect is not statistically significant.
Disaggregating this effect by the structural composition of new housing, conversion has no
effect on the permitting of single family homes, but causes a 44 percent decrease in the
number of multifamily units permitted annually. These results are consistent with our hy-
pothesis, with multifamily housing being both less desirable and more likely to be vulnerable
to local NIMBY pressure via discretionary review compared to single family housing.
●
●
●
−100
−50
0
50
Total permits Single−family Multifamily
Per
cent
cha
nge
units
per
mitt
ed
Figure 2: Treatment effects and confidence intervals among all cities. Points are regressioncoefficients and indicate the difference in number of units permitted within cities followingthe switch to district elections. Lines indicate 95%-confidence intervals (thin lines) and90%-confidence intervals (thick lines).
One concern of identification is whether cities that switched to district elections were
16Results using cities ‘eventually treated’ are presented in Appendix G.17Results in table form are presented in Appendix E.
20
already becoming more likely to permit fewer housing units prior to the change in electoral
system. We use a Granger causality test to explore how the housing trends of treated cities
differed from those of control cities before and after switching to district elections. To conduct
this test, we plot the difference in outcomes between switcher and non-switcher cities, before
and after the switch occurs. In this regression, the plotted treatment coefficients represent
the difference in outcomes—net of city and year fixed effects, city-specific time trends, and
time-varying controls—between switcher and non-switcher cities for each year relative to the
year of their first district election, from three years prior to two years after. If for example,
β−3 were negative and significantly different from zero, cities that changed to district elections
were already seeing lower housing permitting, suggesting that housing trends may cause cities
to select into treatment.
We plot these coefficients in Figure 3, with the horizontal axis representing the number
of years before or after the switch to district elections occurred. The figure shows that
the estimates are almost precisely null and statistically no different from zero prior to the
year of the first district election. In contrast, the estimates are uniformly negative and
approaching statistical significance following the year of the first district election, dropping
to as low as a 58 percent decrease in multifamily units permitted during the first year post-
treatment. In short, the near precise null estimates pre-treatment suggest that the observed
effect of elections is not driven by pre-treatment differences in trends between switching and
non-switching cities. Thus, the specification in Figure 2 likely captures the causal effect of
district elections on the local housing supply.
Next, we test for variation in the effect of district elections on multifamily housing across
cities, both by a city’s segregation and racial diversity. We visualize these results in Figures 4,
with the percent change in multifamily units permitted annually as our dependent variable.
Treatment effects across levels of segregation are on the left, with effects according to percent
non-Hispanic white presented on the right.18
18For histograms of subgroup variables and cleavages, see Appendix D.
21

●●
●
●●
●
−150
−100
−50
0
50
100
t−3 t−2 t−1 t t+1 t+2
Per
cent
cha
nge
units
per
mitt
ed
Figure 3: Effect of district elections on multifamily units permitted, checking for pre-treatment differences in outcomes. This figure plots coefficient estimates, with lines indi-cating 95%-confidence intervals (thin lines) and 90%-confidence intervals (thick lines), fromthree years prior to the switch to two years after.
●
●
●●
−100
−50
0
50
Low Segregation High Segregation Low Minority High Minority
Per
cent
cha
nge
units
per
mitt
ed
Figure 4: Treatment effects and confidence intervals comparing cities in the top and bottomterciles of segregation (left) and percent non-Hispanic white (right). Points are regressioncoefficients and indicate the difference in number of units permitted within cities followingconversion to single member districts. Lines indicate 95%-confidence intervals (thin lines)and 90%-confidence intervals (thick lines).
22

On the left, the effect of district elections appears driven by cities with high levels of
segregation. The difference between high and low segregation cities is not statistically sig-
nificant, though this appears the result of large standard errors for the effect of district
elections in low segregation cities. These results suggest that high segregation may produce
the conditions for large differential policy outcomes, whereas cities with low segregation have
heterogenous effects our model does not account for.
Figure 4 also presents variation in the treatment effect across cities by racial composition.
We expected the treatment effect to be concentrated in whiter cities, where district elections
would make the largest difference in minority representation. However, treatment appears
equally strong across levels of racial diversity. One reason may be that whiter cities do not
have enough minorities to effectively change local politics even with district elections. If
minority residents are neither numerous nor segregated enough to form a majority-minority
district, then district elections will produce a similar city council as at-large elections. Like-
wise, we had expected high minority cities with at-large elections to lack a dominant majority
white voting bloc. But given how low turnout is in local elections, the voting population
may still be white enough to exclude representation. As a result, high minority cities with
a fragile white majority voting bloc may be primed to respond with the largest treatment
effects.
Next, Figure 5 presents the effect of district elections on the affordability of new housing,
with the proportion of housing that is low-income on the left and changes in the units permit-
ted by affordability band on the right. Switching to district elections cause a 10 percentage
point increase in the share of housing that is affordable to low- and very low-income residents
(p = .12). This .41 standard deviation increase appears driven by an increase in the per-
mitting of low-income units, whereas moderate-income and above moderate-income (‘High’)
housing are not affected by the switch in institutions. Unlike our Census permits data, af-
fordability data from the CA Department of Housing and Community Development comes
from a shorter panel, generally from 2015 to 2018, limiting our sample size and statistical
23

●
0.00
0.05
0.10
0.15
0.20
Prop. low−income
Pro
port
ion
of p
erm
its
●
● ●
−100
0
100
200
300
Low Moderate High
Per
cent
cha
nge
units
per
mitt
ed
Figure 5: Treatment effects and confidence intervals among all cities. Points are regressioncoefficients and indicate the difference in the proportion of housing affordable to low-incomeresidents (left) and the number of units permitted by affordability level (right) within citiesfollowing conversion to single member districts. Lines indicate 95%-confidence intervals (thinlines) and 90%-confidence intervals (thick lines).
power.19
Connecting these findings to those in Figure 2 requires inference. Unfortunately, the
affordability data do not report whether the units are part of multifamily or single family
housing. However, given low-income housing is almost universally multifamily due to con-
struction costs, we can assume that the decrease in multifamily housing presented in Figure
2 is concentrated within market-rate housing. In other words, district representation reduces
the permitting of multifamily housing, but housing which is permitted is more likely to be
affordable to low-income residents.
19Variation in length of each city’s panel data comes from administrative differences in when the State ofCalifornia defines each city’s planning period for meeting state-defined housing goals.
24

Spatial Outcomes
Having measured the effect of district elections at the city level, we next look at policy
outcomes within both treated and control cities. Previously, we focused on multifamily
housing as the best proxy for units subject to discretionary review. If district elections
increase NIMBY influence, we would expect to observe a change in multifamily permitting.
For our within city data, we have built a corpus of all housing permits that were subject
to discretionary review across six cities. Be they single family or multifamily, these units
are directly vulnerable to the political economy of zoning. No longer needing to proxy for
units within reach of political pushback, we present the effects of district elections on total
housing units permitted.
First, we measure the spatial concentration of new housing units by calculating the aver-
age Moran’s I pre- and post-treatment for our three treated cities: Anaheim, Escondido, and
Santa Barbara. As shown in Table 1, new housing is spatially concentrated more than would
otherwise be expected in each city prior to district elections.20 However, after converting to
district elections, housing has not only decreased in spatial concentration, but decreased to
the point of being as-if random in Santa Barbara and Escondido.21
Table 1: Moran’s I, Pre- and Post-Treatment
City Before Treatment After Treatment
Santa Barbara 0.22*** 0.06Escondido 0.12** 0.03Anaheim 0.13*** 0.10**
Note: ∗p<0.05; ∗∗p<0.01; ∗∗∗p<0.001
Next, we use a difference-in-difference framework to measure the effect of district elections
on log housing units permitted at the block group level. Our sample now includes both our
20Maps of pre- and post-treatment included in Appendix F.21We replicate this process for our three control cities in Table C-4 and find varying trends of increasing and
decreasing concentration, suggesting that district elections may be a sufficient, but not necessary trend forthe dispersion of housing permits.
25

three treated cities and three control cities, generating a 8-year panel of 223 block groups.
We interact treatment with an indicator for minority block group, allowing us to compare
treatment effects across white and minority block groups, dropping the middle tercile. Table
2 presents the treatment effects on log units permitted, as well as on units disaggregated into
single family and multifamily housing. Given all units recorded were subject to discretionary
review, we discuss the results for total units. However, results examining only multifamily
units are substantively the same.
Table 2: Effect of Conversion to Single-Member Districts on Units Permitted, Logged
Total Units Multifamily Units Single-family units
(1) (2) (3)
Single-member districts 0.835∗∗∗ 0.684∗∗∗ 0.160(0.235) (0.197) (0.145)
Minority block groups 0.470∗∗ 0.485∗∗ 0.007(0.171) (0.180) (0.062)
SMD:Minority block groups −0.503∗ −0.483∗ −0.047(0.246) (0.231) (0.084)
Controls Yes Yes YesYear FE Yes Yes YesCity FE Yes Yes YesLinear Trends Yes Yes YesObservations 768 768 768R2 0.165 0.195 0.061
Note: ∗p<0.05; ∗∗p<0.01; ∗∗∗p<0.001
Under at-large representation, minority block groups saw 60 percent (.47 log points) more
housing units permitted annually compared to their white block group counterparts within
the same city, even after controlling for demographic and housing market covariates. This
racial imbalance represents the channeling of new housing into the communities most likely
to be politically underrepresented in at-large elections. After switching to district elections,
this racial relationship with housing breaks down. White block groups experienced a 132
percent (.84 log points) increase in housing units permitted annually. In contrast, because
26
of the negative and statistically significant interaction between treatment and race, minority
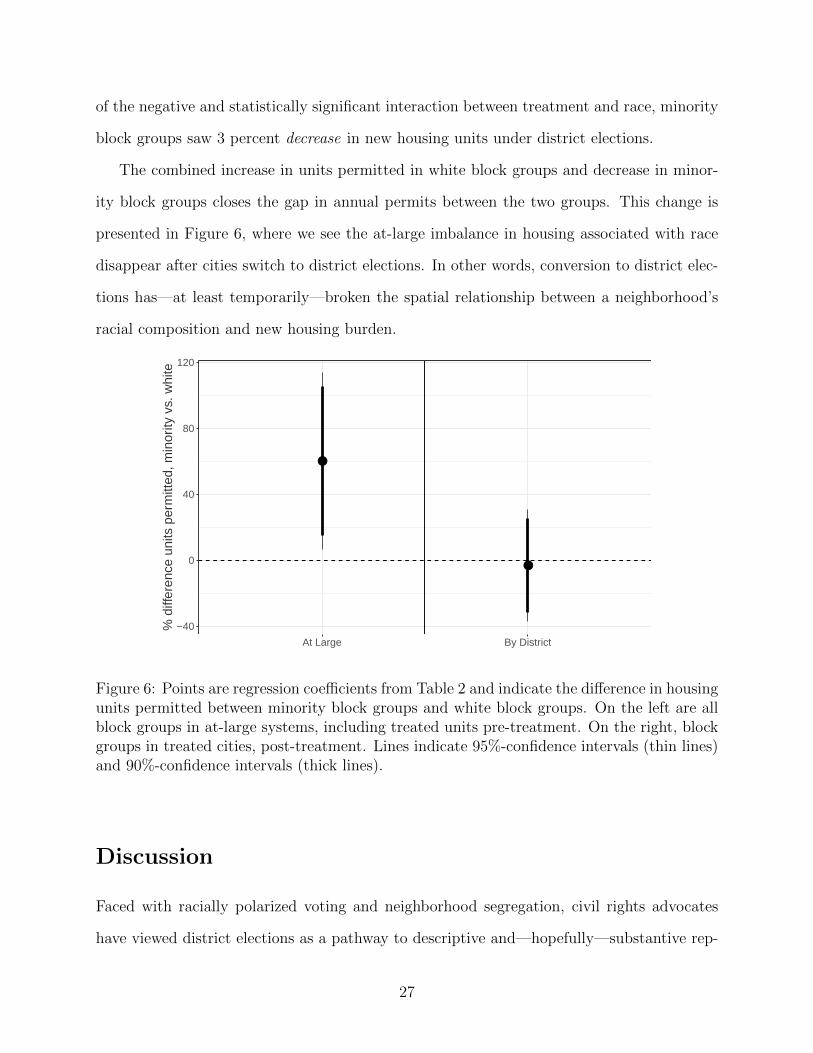
block groups saw 3 percent decrease in new housing units under district elections.
The combined increase in units permitted in white block groups and decrease in minor-
ity block groups closes the gap in annual permits between the two groups. This change is
presented in Figure 6, where we see the at-large imbalance in housing associated with race
disappear after cities switch to district elections. In other words, conversion to district elec-
tions has—at least temporarily—broken the spatial relationship between a neighborhood’s
racial composition and new housing burden.
●
●
−40
0
40
80
120
At Large By District
% d
iffer
ence
uni
ts p
erm
itted
, min
ority
vs.
whi
te
Figure 6: Points are regression coefficients from Table 2 and indicate the difference in housingunits permitted between minority block groups and white block groups. On the left are allblock groups in at-large systems, including treated units pre-treatment. On the right, blockgroups in treated cities, post-treatment. Lines indicate 95%-confidence intervals (thin lines)and 90%-confidence intervals (thick lines).
Discussion
Faced with racially polarized voting and neighborhood segregation, civil rights advocates
have viewed district elections as a pathway to descriptive and—hopefully—substantive rep-
27
resentation. Using districts, previously underrepresented neighborhoods are almost guaran-
teed a voice in the legislative body. But efforts like the CVRA not only change the racial
composition of constituencies, but their spatial composition as well. Thanks to the electoral
connection, district-elected council members are now more beholden to the local interests of
their constituents. Responding to these local interests risks threatening collective outcomes
for policies with concentrated costs and diffuse benefits.
In this paper, we present evidence of the direct effect of district representation on policy
outcomes, specifically the amount, structural composition, affordability, and spatial distri-
bution of new housing. Our findings suggest that the switch to district elections has made
it more politically challenging to permit new multifamily housing. However, the housing
that is permitted is more affordable, reflecting the preferences of previously excluded low-
income and minority voters. Likewise, the reform has shifted the distribution of new housing,
both spatially dispersing the concentration of permits and breaking the correlation between
minority block groups and unwanted development.
To explain these effects, we propose a mechanism where local interests have greater
influence at the expense of collective, citywide outcomes. However, other factors may be at
work. At-large elections tend to underrepresent lower-income and minority communities. In
turn, district elections tend to increase the electoral influence of these more liberal voters,
potentially leading to a more liberal-minded city council (Erie, Kogan, and MacKenzie, 2011).
The policy outcomes we measure may therefore be the result of a liberal ideology shift in
city council, not increased NIMBY influence. We believe this to be unlikely. As discussed,
Tausanovitch and Warshaw (2014) find electoral institutions to be weak moderators of the
effect of ideology on policy outcomes. Likewise, the growing evidence of housing’s non-
ideological preferences suggests that our findings are less driven by an ideological swing than
a change in council member’s electoral incentives.
Our results present direct implications for the policy response to the housing crisis.
Though fewer new multifamily units are permitted in by district cities, those units permitted
28
are more likely to be affordable to low-income residents. This is fortunate for those lucky
enough to win a housing lottery and gain access the price-fixed, affordable unit. But wait lists
for these lotteries are measured in years, with the majority of those eligible for housing as-
sistance unlikely to receive it (Williams, 2000). Consequently, for low and moderate-income
residents relying on market-rate housing, the decrease in multifamily housing is likely to
drive their housing costs even higher.
To counter this decrease in supply, district elections may be best paired with top-down
pressure from a higher level of government, such as the State of California. The state
government has an interest in each city permitting its share of new housing to maintain
statewide affordability. Previously, such top-down pressure would likely channel market-rate
housing into underrepresented, minority neighborhoods. But under districts elections, with
more equal representation secured, the push for supply may be more equitably distributed
across neighborhoods. This pressure would generate new housing to meet demand while also
maintaining neighborhood representation within cities, fulfilling the mission of the original
Voting Rights Act of 1965.
Beyond policy outcomes, additional research is necessary to understand how district
elections more broadly affect political behavior. While majority-minority districts have been
found to enhance voter turnout (Barreto, Segura, and Woods, 2004; Fraga, 2016), such
work has focused on the redistricting of congressional districts, not the wholesale creation of
new district-based institutions. And while city-level research has found district elections to
conditionally increase the diversity of elected officials (Trounstine and Valdini, 2008), that
increase may be attributable to the new majority-minority nature of the district, not any
increase in the mobilization of its minority constituents. Future work should address whether
the new district-based representation sparks ‘policy feedback’ (e.g., Mettler, 2002; Pierson,
1993) in the form of greater minority turnout and political participation at the local level.
Broadly defined, policies with concentrated costs and diffuse benefits have never been
popular (Wilson, 1984). The NIMBY politics of unwanted land use present a unique type of
29

concentrated burden, one subject to the spatial aggregation of voters. We have identified an
institutional reform that directly grapples with such issues, facing a tradeoff between local
interests and collective outcomes—between distributive equity and aggregate supply. Further
research is needed to understand how additional reform can preserve newfound neighborhood
equity while supplying the housing necessary to stem the deepening affordability crisis.
30
References
Abott, Carolyn, and Asya Magazinnik. 2019. “At-Large Elections and Minority Represen-
tation in Local Government.” Working Paper .
Anselin, Luc. 1988. Spatial Econometrics: Methods and Models. Boston: Kluwer.
Autor, David H. 2003. “Outsourcing At Will: The Contribution of Unjust Dismissal Doctrine
to the Growth of Employment Outsourcing.” Journal of Labor Economics 21(1): 1–42.
Banfield, Edward C, and James Q Wilson. 1963. City Politics. Harvard University Press.
Barreto, Matt A, Gary M Segura, and Nathan D Woods. 2004. “The Mobilizing Effect of
Majority–Minority Districts on Latino Turnout.” American Political Science Review 98(1):
65–75.
Been, Vicki, Josiah Madar, and Simon McDonnell. 2014. “Urban Land-Use Regulation: Are
Homevoters Overtaking the Growth Machine?” Journal of Empirical Legal Studies 11(2):
227–265.
Boylan, Richard T, and Dru Stevenson. 2017. “The Impact of Distinct Elections on Municipal
Pensions and Investment.” JL Econ. & Pol’y 14: 127.
Bridges, Amy. 1999. Morning Glories: Municipal Reform in the Southwest. Princeton
University Press.
Burnett, Craig M, and Vladimir Kogan. 2014. “Local Logrolling? Assessing the Impact of
Legislative Districting in Los Angeles.” Urban Affairs Review 50(5): 648–671.
Charette, Allison, Chris Herbert, Andrew Jakabovics, Ellen Tracy Marya, and Daniel T Mc-
Cue. 2015. “Projecting Trends in Severely Cost-Burdened Renters: 2015-2025.” Harvard
University’s Joint Center for Housing Studies and Enterprise Community Partners Inc .
31

Charles, Camille Zubrinksy. 2006. Won’t You Be My Neighbor: Race, Class, and Residence
in Los Angeles. Russell Sage Foundation.
Chen, Jowei. 2013. “Voter Partisanship and the Effect of Distributive Spending on Political
Participation.” American Journal of Political Science 57(1): 200–217.
Clark, Alistair, and Timothy B Krebs. 2012. “Elections and Policy Responsiveness.” In The
Oxford Handbook of Urban Politics.
Clingermayer, James C. 1994. “Electoral Representation, Zoning Politics, and the Exclusion
of Group Homes.” Political Research Quarterly 47(4): 969–984.
Darmofal, David. 2006. “The Political Geography of Macro-Level Turnout in American
Political Development.” Political Geography 25(2): 123–150.
Davidson, Chandler, and George Korbel. 1981. “At-Large Elections and Minority-Group
Representation: A Re-Examination of Historical and Contemporary Evidence.” The Jour-
nal of Politics 43(4): 982–1005.
de Benedictis-Kessner, Justin, and Michael Hankinson. Forthcoming. “Concentrated Bur-
dens: How Self-Interest and Partisanship Shape Opinion of Opioid Treatment Policy.”
American Political Science Review .
Denzau, Arthur T, and Barry R Weingast. 1982. “The Political Economy of Land Use
Regulation.” Urban Law Annual 23: 385.
Dynarski, Susan, Brian Jacob, and Daniel Kreisman. 2018. “How Important Are Fixed
Effects and Time Trends in Estimating Returns to Schooling? Evidence from a Replication
of Jacobson, Lalonde, and Sullivan, 2005.” Journal of Applied Econometrics 33(7): 1098–
1108.
Einstein, Katherine Levine, Maxwell Palmer, and David M Glick. 2019. “Who Participates
32
in Local Government? Evidence from Meeting Minutes.” Perspectives on Politics 17(1):
28–46.
Engstrom, Richard L, and Michael D McDonald. 1981. “The Election of Blacks to City
Councils: Clarifying the Impact of Electoral Arrangements on the Seats/Population Re-
lationship.” American Political Science Review 75(2): 344–354.
Erie, Steven P, Vladimir Kogan, and Scott A MacKenzie. 2011. Paradise Plundered: Fiscal
Crisis and Governance Failures in San Diego. Stanford University Press.
Feiock, Richard C, Antonio F Tavares, and Mark Lubell. 2008. “Policy Instrument Choices
for Growth Management and Land Use Regulation.” Policy Studies Journal 36(3): 461–
480.
Fischel, William A. 2001. The Homevoter Hypothesis. Cambridge, MA: Harvard University
Press.
Fraga, Bernard L. 2016. “Redistricting and the Causal Impact of Race on Voter Turnout.”
The Journal of Politics 78(1): 19–34.
Ganong, Peter, and Daniel Shoag. 2017. “Why Has Regional Income Convergence in the US
Declined?” Journal of Urban Economics 102: 76–90.
Gimpel, James G, Frances E Lee, and Joshua Kaminski. 2006. “The Political Geography of
Campaign Contributions in American Politics.” The Journal of Politics 68(3): 626–639.
Glaeser, Edward L, and Bryce A Ward. 2009. “The Causes and Consequences of Land Use
Regulation: Evidence from Greater Boston.” Journal of Urban Economics 65(3): 265–278.
Glaeser, Edward L, Joseph Gyourko, and Raven E Saks. 2005. “Why Have Housing Prices
Gone Up?” American Economic Review 95(2): 329–333.
Hajnal, Zoltan, and Jessica Trounstine. 2005. “Where Turnout Matters: The Consequences
of Uneven Turnout in City Politics.” The Journal of Politics 67(2): 515–535.
33

Hamilton, Bruce W. 1976. “Capitalization of Intrajurisdictional Differences in Local Tax
Prices.” The American Economic Review 66(5): 743–753.
Hankinson, Michael. 2018. “When Do Renters Behave Like Homeowners? High Rent, Price
Anxiety, and NIMBYism.” American Political Science Review 112(3): 473–493.
Hills Jr, Roderick M, and David Schleicher. 2010. “The Steep Costs of Using Noncumulative
Zoning to Preserve Land for Urban Manufacturing.” The University of Chicago Law Review
pp. 249–273.
Hinds, Dudley S, and Nicholas Ordway. 1986. “The Influence of Race on Rezoning Decisions:
Equality of Treatment in Black and White Census Tracts, 1955–1980.” The Review of Black
Political Economy 14(4): 51–63.
Honaker, James, Gary King, and Matthew Blackwell. 2011. “Amelia II: A Program for
Missing Data.” Journal of Statistical Software 45(7): 1–47.
Hsieh, Chang-Tai, and Enrico Moretti. 2019. “Housing Constraints and Spatial Misalloca-
tion.” American Economic Journal: Macroeconomics 11(2): 1–39.
Ingram, Joanna E Cuevas. 2012. “The Color of Change: Voting Rights in the 21st Century
and the California Voting Rights Act.” Harv. Latino L. Rev. 15: 183.
Issacharoff, Samuel. 1991. “Polarized Voting and the Political Process: The Transformation
of Voting Rights Jurisprudence.” Mich. L. Rev. 90: 1833.
Jones, Christopher, and Daniel M Kammen. 2014. “Spatial Distribution of US Household
Carbon Footprints Reveals Suburbanization Undermines Greenhouse Gas Benefits of Ur-
ban Population Density.” Environmental Science & Technology 48(2): 895–902.
Kahn, Matthew E. 2011. “Do Liberal Cities Limit New Housing Development? Evidence
from California.” Journal of Urban Economics 69(2): 223–228.
34
Kousser, J Morgan. 1992. “Beyond Gingles: Influence Districts and the Pragmatic Tradition
in Voting Rights Law.” USFL Rev. 27: 551.
Kousser, J Morgan. 2000. Colorblind Injustice: Minority Voting Rights and the Undoing of
the Second Reconstruction. Univ of North Carolina Press.
Leal, David L, Valerie Martinez-Ebers, and Kenneth J Meier. 2004. “The Politics of Latino
Education: The Biases of At-Large Elections.” The Journal of Politics 66(4): 1224–1244.
Lubell, Mark, Richard C Feiock, and Edgar E Ramirez De La Cruz. 2009. “Local Institutions
and the Politics of Urban Growth.” American Journal of Political Science 53(3): 649–665.
Marble, William, and Clayton Nall. 2018. “Where Self-Interest Trumps Ideology: Liberal
Homeowners and Local Opposition to Housing Development.” Working Paper .
Marschall, Melissa J, Anirudh VS Ruhil, and Paru R Shah. 2010. “The New Racial Calculus:
Electoral Institutions and Black Representation in Local Legislatures.” American Journal
of Political Science 54(1): 107–124.
Mayer, Christopher J, and C Tsuriel Somerville. 2000. “Land Use Regulation and New
Construction.” Regional Science and Urban Economics 30(6): 639–662.
Mayhew, David R. 1974. Congress: The Electoral Connection. Vol. 26 Yale University Press.
Meier, Kenneth J, Eric Gonzalez Juenke, Robert D Wrinkle, Polinard, and JL. 2005. “Struc-
tural Choices and Representational Biases: The Post-Election Color of Representation.”
American Journal of Political Science 49(4): 758–768.
Mettler, Suzanne. 2002. “Bringing the State Back in to Civic Engagement: Policy Feedback
Effects of the GI Bill for World War II Veterans.” American Political Science Review 96(2):
351–365.
35
Molina Jr, Angel Luis, and Kenneth J Meier. 2018. “Demographic Dreams, Institutional
Realities: Election Design and Latino Representation in American Education.” Politics,
Groups, and Identities 6(1): 77–94.
Moran, Patrick AP. 1948. “The Interpretation of Statistical Maps.” Journal of the Royal
Statistical Society. Series B (Methodological) 10(2): 243–251.
Peterson, Paul E. 1981. City Limits. University of Chicago Press.
Pierson, Paul. 1993. “When Effect Becomes Cause: Policy Feedback and Political Change.”
World Politics 45(4): 595–628.
Quigley, John M, and Steven Raphael. 2005. “Regulation and the High Cost of Housing in
California.” American Economic Review 95(2): 323–328.
Sances, Michael W, and Hye Young You. 2017. “Who Pays for Government? Descriptive
Representation and Exploitative Revenue Sources.” The Journal of Politics 79(3): 1090–
1094.
Sass, Tim R, and Stephen L Mehay. 1995. “The Voting Rights Act, District Elections,
and the Success of Black Candidates in Municipal Elections.” The Journal of Law and
Economics 38(2): 367–392.
Schleicher, David. 2013. “City Unplanning.” Yale Law Journal 122: 1670.
Stokes, Leah C. 2016. “Electoral Backlash against Climate Policy: A Natural Experiment
on Retrospective Voting and Local Resistance to Public Policy.” American Journal of
Political Science 60(4): 958–974.
Tam Cho, Wendy K. 2003. “Contagion Effects and Ethnic Contribution Networks.” Ameri-
can Journal of Political Science 47(2): 368–387.
Tausanovitch, Chris, and Christopher Warshaw. 2014. “Representation in Municipal Gov-
ernment.” American Political Science Review 108(3): 605–641.
36
Taylor, Clarence. 1962. “Current Problems in California Subdivision Control.” Hastings LJ
13: 344.
Thiel, Henri. 1972. Statistical Decomposition Analysis: With Applications in the Social and
Administrative Sciences. Amsterdam: North Holland Publishing Company.
Trebbi, Francesco, Philippe Aghion, and Alberto Alesina. 2008. “Electoral Rules and Minor-
ity Representation in US Cities.” The Quarterly Journal of Economics 123(1): 325–357.
Trounstine, Jessica. 2009. Political Monopolies in American Cities: The Rise and Fall of
Bosses and Reformers. University of Chicago Press.
Trounstine, Jessica. 2010. “Representation and Accountability in Cities.” Annual Review of
Political Science 13: 407–423.
Trounstine, Jessica. 2016. “Segregation and Inequality in Public Goods.” American Journal
of Political Science 60(3): 709–725.
Trounstine, Jessica, and Melody E Valdini. 2008. “The Context Matters: The Effects of
Single-Member versus At-Large Districts on City Council Diversity.” American Journal of
Political Science 52(3): 554–569.
Vedlitz, Arnold, and Charles A Johnson. 1982. “Community Racial Segregation, Electoral
Structure, and Minority Representation.” Social Science Quarterly 63(4): 729.
Welch, Susan. 1990. “The Impact of At-Large Elections on the Representation of Blacks and
Hispanics.” The Journal of Politics 52(4): 1050–1076.
Williams, A Kevin. 2000. The Long Wait: The Critical Shortage of Housing in California.
Housing California.
Wilson, James Q. 1984. “The Politics of Regulation.” T. Ferguson, & J. Rogers, The Political
Economy: Readings in the Politics and Economics of American Public Policy pp. 82–103.
37

Wolfers, Justin. 2006. “Did Unilateral Divorce Laws Raise Divorce Rates? A Reconciliation
and New Results.” American Economic Review 96(5): 1802–1820.
38
Supplementary Appendix for
“Aggregating Voters and the Electoral Connection:
The Effect of District Representation on the
Distributive Equity of the Housing Supply”
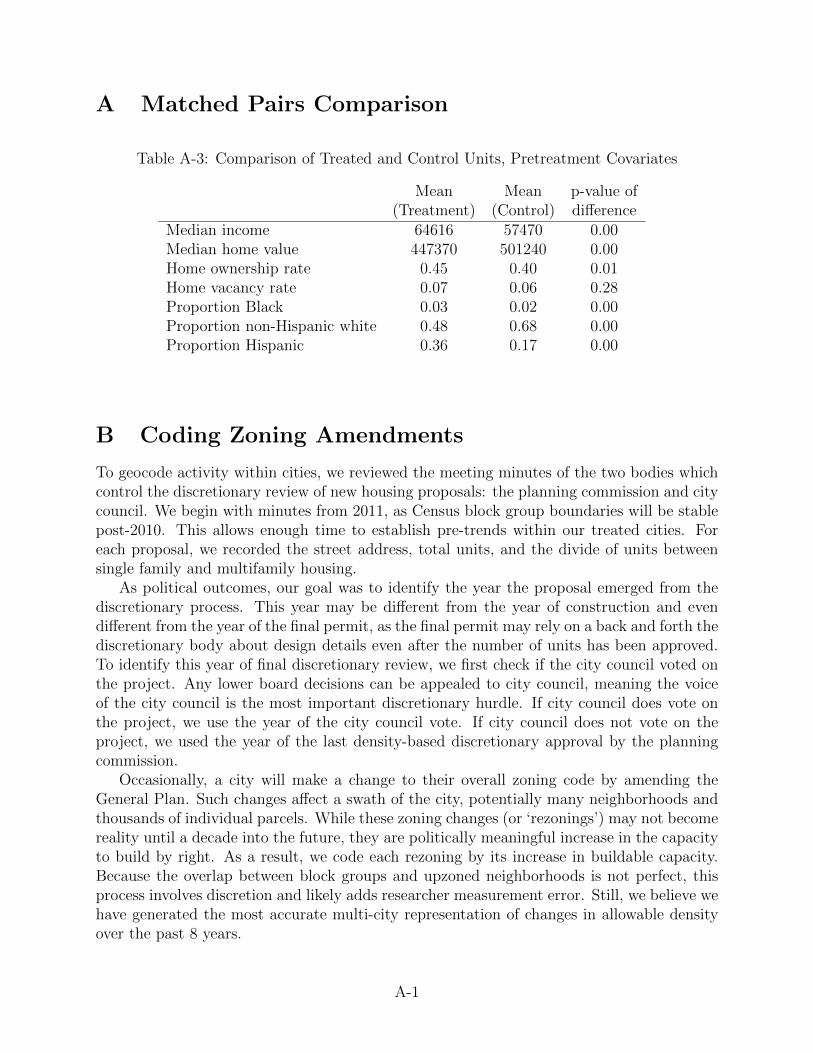
A Matched Pairs Comparison
Table A-3: Comparison of Treated and Control Units, Pretreatment Covariates
Mean Mean p-value of(Treatment) (Control) difference
Median income 64616 57470 0.00Median home value 447370 501240 0.00Home ownership rate 0.45 0.40 0.01Home vacancy rate 0.07 0.06 0.28Proportion Black 0.03 0.02 0.00Proportion non-Hispanic white 0.48 0.68 0.00Proportion Hispanic 0.36 0.17 0.00
B Coding Zoning Amendments
To geocode activity within cities, we reviewed the meeting minutes of the two bodies whichcontrol the discretionary review of new housing proposals: the planning commission and citycouncil. We begin with minutes from 2011, as Census block group boundaries will be stablepost-2010. This allows enough time to establish pre-trends within our treated cities. Foreach proposal, we recorded the street address, total units, and the divide of units betweensingle family and multifamily housing.
As political outcomes, our goal was to identify the year the proposal emerged from thediscretionary process. This year may be different from the year of construction and evendifferent from the year of the final permit, as the final permit may rely on a back and forth thediscretionary body about design details even after the number of units has been approved.To identify this year of final discretionary review, we first check if the city council voted onthe project. Any lower board decisions can be appealed to city council, meaning the voiceof the city council is the most important discretionary hurdle. If city council does vote onthe project, we use the year of the city council vote. If city council does not vote on theproject, we used the year of the last density-based discretionary approval by the planningcommission.
Occasionally, a city will make a change to their overall zoning code by amending theGeneral Plan. Such changes affect a swath of the city, potentially many neighborhoods andthousands of individual parcels. While these zoning changes (or ‘rezonings’) may not becomereality until a decade into the future, they are politically meaningful increase in the capacityto build by right. As a result, we code each rezoning by its increase in buildable capacity.Because the overlap between block groups and upzoned neighborhoods is not perfect, thisprocess involves discretion and likely adds researcher measurement error. Still, we believe wehave generated the most accurate multi-city representation of changes in allowable densityover the past 8 years.
A-1

There are several types of residential proposals we do not include. First, we do notcollect data on renovations nor conversions of apartments to condominiums. The legalizationof existing illegal units is coded, as legalization is similar enough to building a new unit.Additionally, we include proposals by commercial enterprises seeking to designate part oftheir existing structure as residential. Finally, we do not collect data on permits approvedby the staff of the city’s planning division. These projects are less vulnerable to discretionaryapproval and often are only reviewed for conformance with existing code.
Ultimately the data we collect represent a corpus of permits that were approved bypassing through discretionary review. These data capture the output of permits that shouldbe most directly affected by the change in representation from district elections.
A-2

C Moran’s I
Moran’s I is the most popular statistic to test for the presence of spatial autocorrelationand to evaluate its strength in maps partitioned in geographical areas, such as block groups.Consider a region divided in n areas and let yi be a random variable measured in area i,with i = 1, . . . , n. Moran’s I is given by
I =n∑ij wij
∑ij wij(yi − y)(yj − y)∑
i(yi − y)2(1)
where the value wij is the weight assigned to areas i and j, and y =∑
i yi/m. Usually, wij
will reflect the geographical distance between areas i and j, being defined, for example, aswij = 1 if the areas are adjacent and i 6= j, and by wij = 0, otherwise. However, weights canbe more general depending on functions of distances between the areas. Moran’s I usuallyranges between −1 and 1 with large positive values indicating neighborhood similarity ofthe rates and values close to zero indicating absence of spatial autocorrelation.
Table C-4: Moran’s I, Pre- and Post-Treatment (Control Cities)
City Before Treatment After Treatment
Santa Cruz (Control for Santa Barbara) 0.05 0.09**Ventura (Control for Escondido) 0.07** 0.04Glendale (Control for Anaheim) 0.24*** 0.12**
Note: ∗p<0.05; ∗∗p<0.01; ∗∗∗p<0.001
A-3

D Distributions of Heterogenous Effects Variables
Figure D-7: Distributions of variables used to assess heterogeneous effects across cities.Tercile cutpoints markets in blue.
Segregation
Segregation
Fre
quen
cy
0.00 0.05 0.10 0.15 0.20 0.25 0.30 0.35
050
010
0015
00
Percent white−nonhispanic
Percent white, non−Hispanic
Fre
quen
cy
0.0 0.2 0.4 0.6 0.8 1.0
050
100
150
200
250
300
E Table Results
A-4
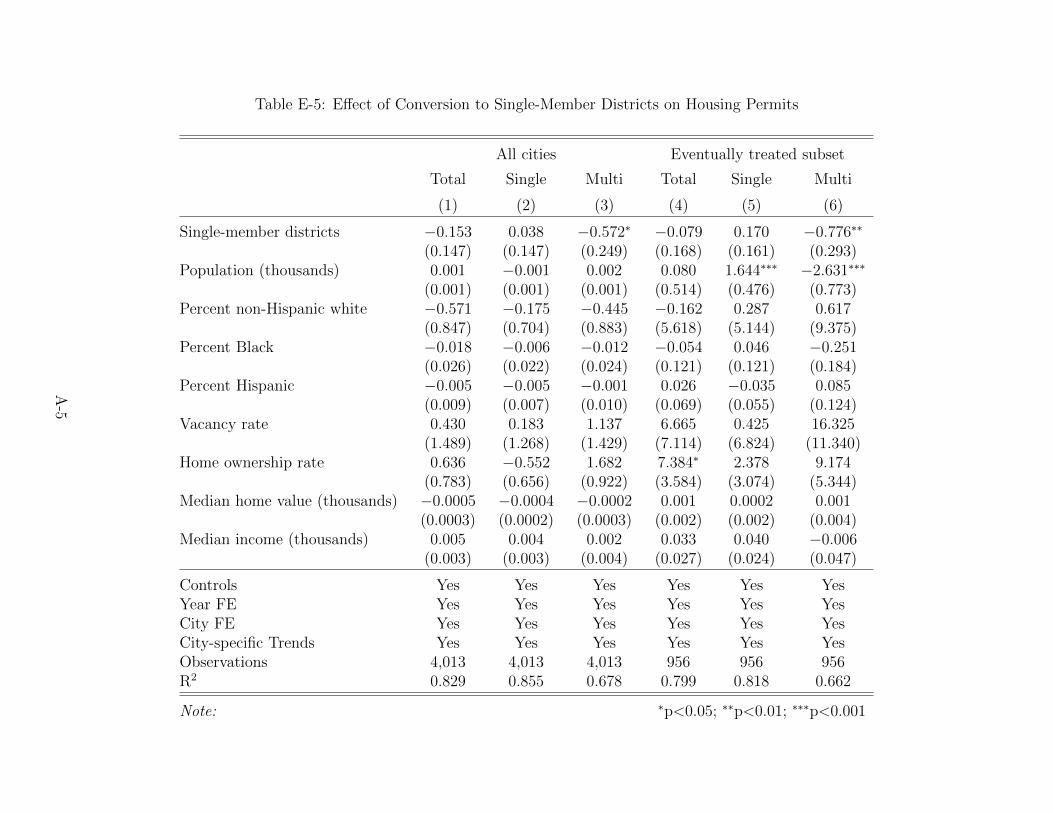
Table E-5: Effect of Conversion to Single-Member Districts on Housing Permits
All cities Eventually treated subset
Total Single Multi Total Single Multi
(1) (2) (3) (4) (5) (6)
Single-member districts −0.153 0.038 −0.572∗ −0.079 0.170 −0.776∗∗
(0.147) (0.147) (0.249) (0.168) (0.161) (0.293)Population (thousands) 0.001 −0.001 0.002 0.080 1.644∗∗∗ −2.631∗∗∗
(0.001) (0.001) (0.001) (0.514) (0.476) (0.773)Percent non-Hispanic white −0.571 −0.175 −0.445 −0.162 0.287 0.617
(0.847) (0.704) (0.883) (5.618) (5.144) (9.375)Percent Black −0.018 −0.006 −0.012 −0.054 0.046 −0.251
(0.026) (0.022) (0.024) (0.121) (0.121) (0.184)Percent Hispanic −0.005 −0.005 −0.001 0.026 −0.035 0.085
(0.009) (0.007) (0.010) (0.069) (0.055) (0.124)Vacancy rate 0.430 0.183 1.137 6.665 0.425 16.325
(1.489) (1.268) (1.429) (7.114) (6.824) (11.340)Home ownership rate 0.636 −0.552 1.682 7.384∗ 2.378 9.174
(0.783) (0.656) (0.922) (3.584) (3.074) (5.344)Median home value (thousands) −0.0005 −0.0004 −0.0002 0.001 0.0002 0.001
(0.0003) (0.0002) (0.0003) (0.002) (0.002) (0.004)Median income (thousands) 0.005 0.004 0.002 0.033 0.040 −0.006
(0.003) (0.003) (0.004) (0.027) (0.024) (0.047)
Controls Yes Yes Yes Yes Yes YesYear FE Yes Yes Yes Yes Yes YesCity FE Yes Yes Yes Yes Yes YesCity-specific Trends Yes Yes Yes Yes Yes YesObservations 4,013 4,013 4,013 956 956 956R2 0.829 0.855 0.678 0.799 0.818 0.662
Note: ∗p<0.05; ∗∗p<0.01; ∗∗∗p<0.001
A-5

Table E-6: Effect of Conversion to Single-Member Districts on Housing Permits, by Affordability Status
Prop low income All permits Low income Moderate Above moderate
(1) (2) (3) (4) (5)
Single-member districts 0.100 0.270 0.726 0.052 0.116(0.064) (0.292) (0.495) (0.489) (0.356)
Population (thousands) 0.00003 0.002 0.001 0.001 0.002(0.001) (0.003) (0.003) (0.004) (0.003)
Percent non-Hispanic white −0.166 0.233 −0.590 1.507 1.244(0.424) (1.784) (2.226) (2.152) (2.107)
Percent Black −0.021 0.164 0.032 0.115 0.213(0.042) (0.122) (0.186) (0.162) (0.175)
Percent Hispanic −0.001 0.010 0.008 0.017 0.024(0.006) (0.024) (0.028) (0.030) (0.031)
Vacancy rate −0.265 2.299 −2.714 −0.159 3.365(1.422) (5.230) (8.028) (6.414) (6.437)
Home ownership rate −0.532 2.910 −2.223 −0.874 1.818(0.600) (2.365) (3.201) (2.730) (2.920)
Median home value (thousands) 0.00001 −0.0001 −0.00000 0.0004 −0.0003(0.0001) (0.0005) (0.0004) (0.0004) (0.001)
Median income (thousands) −0.001 0.004 −0.001 −0.009 0.006(0.001) (0.007) (0.008) (0.007) (0.008)
Controls Yes Yes Yes Yes YesYear FE Yes Yes Yes Yes YesCity FE Yes Yes Yes Yes YesCity-specific Trends Yes Yes Yes Yes YesObservations 1,480 1,480 1,480 1,480 1,480R2 0.660 0.886 0.697 0.796 0.890
Note: ∗p<0.05; ∗∗p<0.01; ∗∗∗p<0.001
A-6

Table E-7: Effect of Conversion to Single-Member Districts on Housing Permits, Interacted with City Characteritics
(1) (2) (3) (4)
Single-member districts −1.017∗ −0.496 −1.183∗∗ −0.527(0.422) (0.466) (0.402) (0.499)
SMD:High white group 0.182 0.363(0.622) (0.642)
SMD:High segregation group −0.835 −0.779(0.581) (0.588)
Population (thousands) 0.003 0.001 −3.154∗∗∗ −3.830∗∗∗
(0.002) (0.001) (0.508) (0.557)Vacancy rate 1.973 1.336 21.966 17.734
(1.496) (1.398) (13.434) (13.879)Home ownership rate 1.210 1.446 6.022 8.344
(0.973) (0.815) (5.568) (5.885)Median home value (thousands) −0.0003 −0.0002 0.004 0.002
(0.0003) (0.0003) (0.003) (0.004)Median income (thousands) 0.003 0.002 0.027 −0.024
(0.003) (0.003) (0.049) (0.051)
Controls Yes Yes Yes YesYear FE Yes Yes Yes YesCity FE Yes Yes Yes YesCity-specific Trends Yes Yes Yes YesObservations 3,158 3,026 650 641R2 0.691 0.697 0.663 0.676
Note: ∗p<0.05; ∗∗p<0.01; ∗∗∗p<0.001
A-7
F Maps of Treated Cities, Housing Pre- and Post-Treatment
Figure F-8: Distribution of Total Housing, Escondido
0 100200300400500Total housing units
(a) Pre-treatment
0 100200300400500Total housing units
(b) Post-treatment
A-8
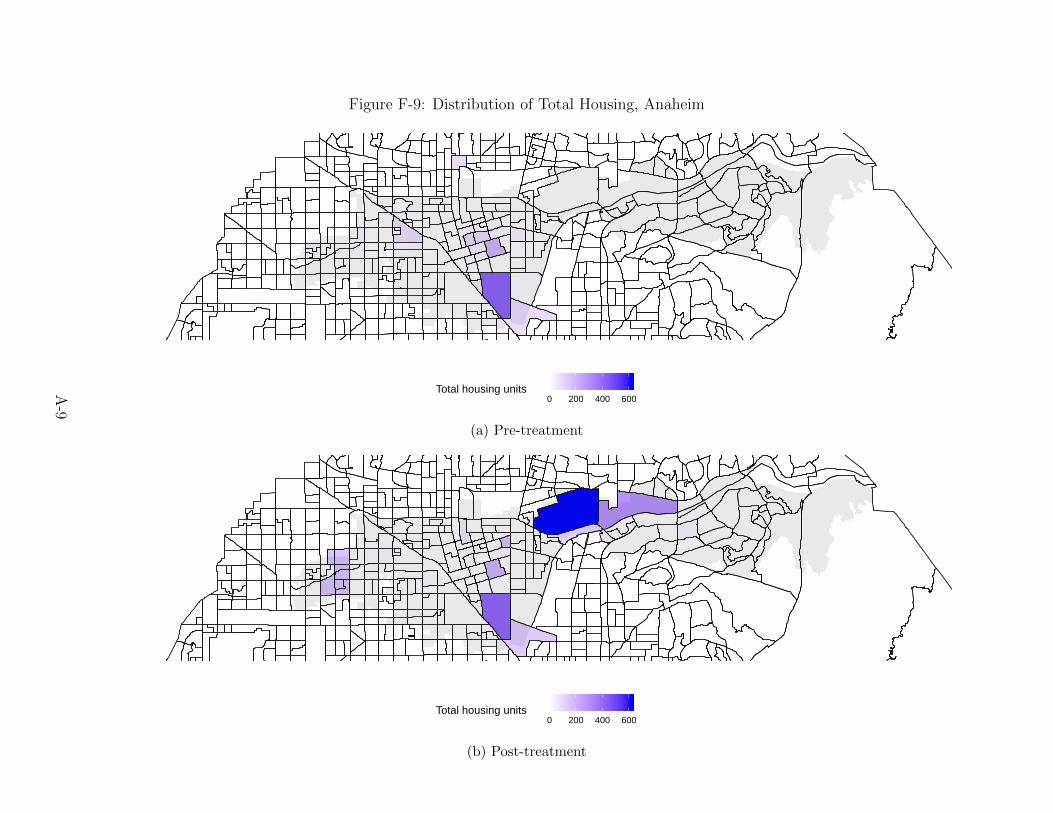
Figure F-9: Distribution of Total Housing, Anaheim
0 200 400 600Total housing units
(a) Pre-treatment
0 200 400 600Total housing units
(b) Post-treatment
A-9
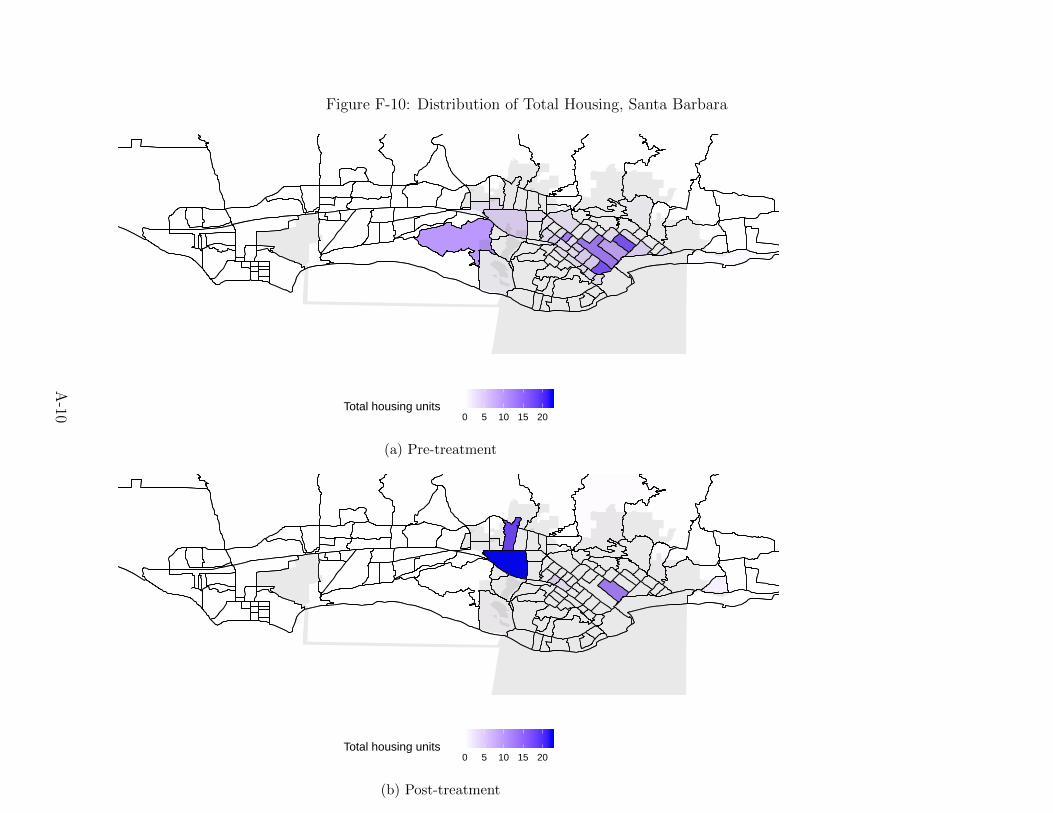
Figure F-10: Distribution of Total Housing, Santa Barbara
0 5 10 15 20Total housing units
(a) Pre-treatment
0 5 10 15 20Total housing units
(b) Post-treatment
A-10

G Results with Subset of ‘Eventually Treated’ Cities
●
●
●
−100
−50
0
50
Total permits Single−family Multifamily
Per
cent
cha
nge
units
per
mitt
ed
Sample ● Full Data Eventually Treated
Figure G-11: Effect of district elections on multifamily units permitted, checking for pre-treatment differences in outcomes. This figure plots coefficient estimates, with lines indi-cating 95%-confidence intervals (thin lines) and 90%-confidence intervals (thick lines), fromthree years prior to the switch to two years after.
A-11

●
●
●●
−100
−50
0
50
Low Segregation High Segregation Low Minority High Minority
Per
cent
cha
nge
units
per
mitt
ed
Sample ● Full Data Eventually Treated
Figure G-12: Treatment effects and confidence intervals comparing cities in the top andbottom terciles of segregation (left) and percent non-Hispanic white (right). Points areregression coefficients and indicate the difference in number of units permitted within citiesfollowing conversion to single member districts. Lines indicate 95%-confidence intervals (thinlines) and 90%-confidence intervals (thick lines).
●●
0.0
0.1
0.2
Prop. low−income
Pro
port
ion
of p
erm
its
●
● ●
−100
0
100
200
300
Low Moderate High
Per
cent
cha
nge
units
per
mitt
ed
Subgroups ● Full Data Eventually Treated
Figure G-13: Treatment effects and confidence intervals among all cities. Points are re-gression coefficients and indicate the difference in the proportion of housing affordable tolow-income residents (left) and the number of units permitted by affordability level (right)within cities following conversion to single member districts. Lines indicate 95%-confidenceintervals (thin lines) and 90%-confidence intervals (thick lines).
A-12