agi 2100 bioanalyzer appcomp05 050805 - vhir · • the agilent 2100 bioanalyzer helps to optimize...
TRANSCRIPT
Agilent 2100 bioanalyzer
Application compendium
Agilent in Life Sciences > Genomics > Proteomics > Drug Discovery > Development > QA/QC

Application compendium
Agilent 2100 bioanalyzer

Agilent Technologies is a leading provider of life
science and chemical analysis solutions. We offer
systems for the acquisition and interpretation
of genetic and chemical information – from sample
handling, to analysis, data management and
reporting. Let us provide you with the right
solution for your success.
Whatever your life science needs, Agilent
Technologies has the solution. We are committed
to providing you with superior technology designed
for maximum productivity and cost efficiency.

The Agilent 2100 bioanalyzer is a unique analysis tool capableof handling nucleic acids, proteins and cells on one platform.When combined with any one of our kits, you will discover how, lab-on-a-chip technology can revolutionize your laboratory.
One of the many benefits the Agilent 2100 bioanalyzer has over conventional bioanalytical methods is the elimination of time consuming procedures – youenjoy standardized handling and interpretation of data. And as our portfolioof microfluidics continues to expand, you will benefit from the wide range ofapplications to which the technology can be used. Lab-on-a-Chip technologysimplifies the process of data gathering and analysis down to three quick andeasy steps:
The Agilent 2100 bioanalyzer utilizes micro-fabricated chips with up to 12-wells requiring minimum sample consumption, in the low µl-range. Prepackagedreagents included with the chip kits help to speed up the entire process.
• With it's single, compact system architecture the Agilent 2100 bioanalyzer integrates sample handling, separation, detection and data analysis, all in the name of speed.
• Eliminate potential mistakes that can occur while interpreting and storing data. The Agilent 2100 bioanalyzer automatically incorporates steps some researchers might otherwise ignore in the interest of time.
The Agilent 2100 bioanalyzer with lab-on-a-chiptechnology will increase the efficiency of youranalysis and the productivity of your day.
Load sample, run analysis, view data.
• The Agilent 2100 bioanalyzer helps to optimize PCR reactions for geneexpression, sequencing, cloning and typing. When used in conjunction with the DNA kits, it provides higher sensitivity, improved sizing accuracyand automated, reproducible quantitation, compared with regular slab gel electrophoresis, which is crucial for RT-PCR and any type of multiplex PCR.
• RNA 6000 Pico kit: catch RNA degradation with sample amounts as low as200 pg of total RNA and automatically detect ribosomal RNA contaminationin mRNA. The RNA 6000 Nano kit is the industry standard for sample QC in the context of microarray analysis. With the introduction of RIN (RNAIntegrity Number), each RNA electropherogram receives a RIN assigned by the software. The RIN unambiguously assesses RNA quality in terms of degradation.
• DNA and RNA LabChip kits enable you to check the quality of probes and targets in your microarray gene expression analysis. Agilent also providesthe full solution for gene expression analysis with its high performancemicroarray scanner and the suite of off-the-shelf microarrays.
• The Protein 200 Plus LabChip kit is a fast and reliable assay capable of quantifying and sizing a multitude of different protein samples. Used with the Agilent 2100 bioanalyzer it can analyze ten, 4 µl samples in less than 30 minutes.
• Agilent offers an add-on pressure cartridge, cell fluorescence software and Cell LabChip kit for multiple types of cell assay applications. Combinedwith the Agilent 2100 bioanalyzer, this makes performing simple flow cytometric analyses a reality, even for the smallest lab.
• Make your Agilent 2100 bioanalyzer system compliant! The Agilent 2100bioanalyzer security pack software ensures full 21 CFR part 11 complianceof your system. Along with IQ and OQ/PV services offered for all assays ofour LabChip kits, your Agilent 2100 bioanalyzer system will be compliant in no time.
Contents Page
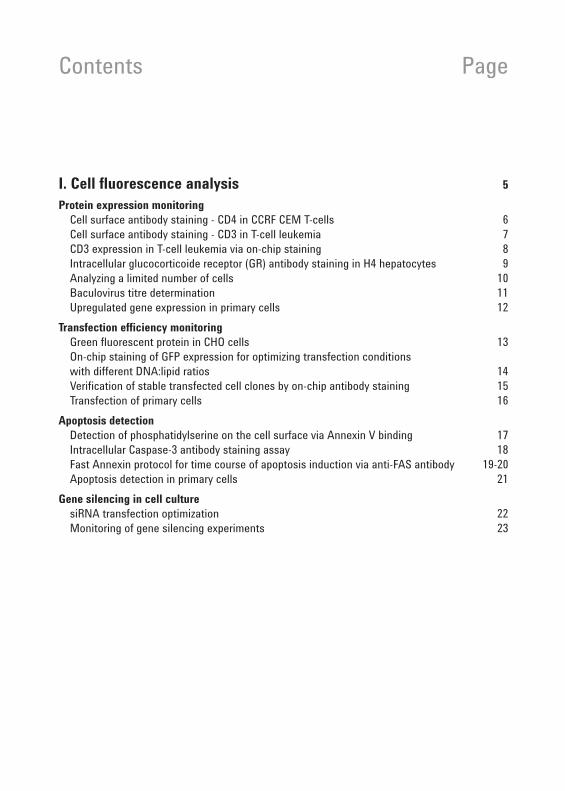
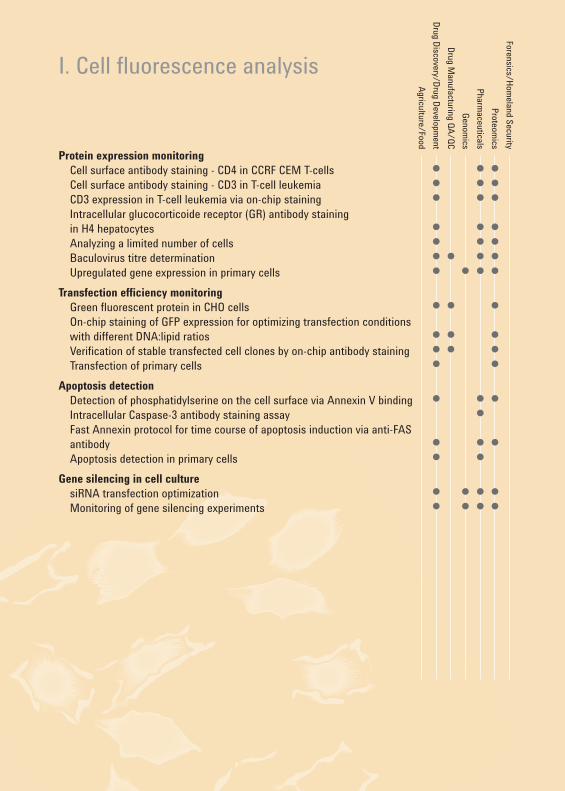
I. Cell fluorescence analysis 5
Protein expression monitoringCell surface antibody staining - CD4 in CCRF CEM T-cells 6Cell surface antibody staining - CD3 in T-cell leukemia 7CD3 expression in T-cell leukemia via on-chip staining 8Intracellular glucocorticoide receptor (GR) antibody staining in H4 hepatocytes 9Analyzing a limited number of cells 10Baculovirus titre determination 11Upregulated gene expression in primary cells 12
Transfection efficiency monitoringGreen fluorescent protein in CHO cells 13On-chip staining of GFP expression for optimizing transfection conditions with different DNA:lipid ratios 14Verification of stable transfected cell clones by on-chip antibody staining 15Transfection of primary cells 16
Apoptosis detectionDetection of phosphatidylserine on the cell surface via Annexin V binding 17Intracellular Caspase-3 antibody staining assay 18Fast Annexin protocol for time course of apoptosis induction via anti-FAS antibody 19-20Apoptosis detection in primary cells 21
Gene silencing in cell culturesiRNA transfection optimization 22Monitoring of gene silencing experiments 23
Contents Page
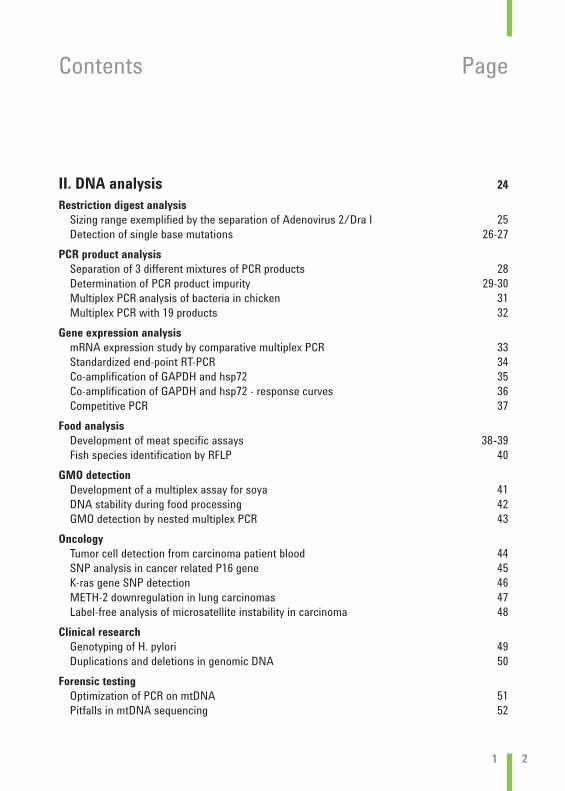
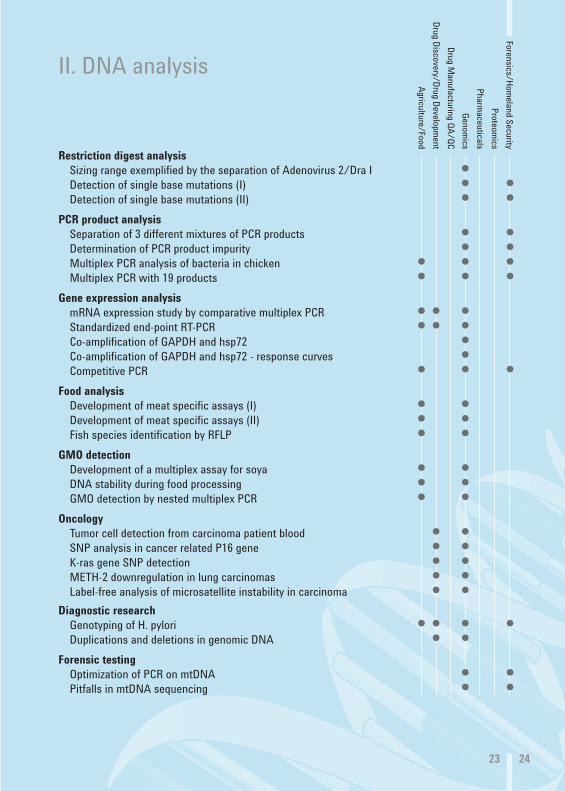
II. DNA analysis 24
Restriction digest analysisSizing range exemplified by the separation of Adenovirus 2/Dra I 25Detection of single base mutations 26-27
PCR product analysisSeparation of 3 different mixtures of PCR products 28Determination of PCR product impurity 29-30Multiplex PCR analysis of bacteria in chicken 31Multiplex PCR with 19 products 32
Gene expression analysismRNA expression study by comparative multiplex PCR 33Standardized end-point RT-PCR 34Co-amplification of GAPDH and hsp72 35Co-amplification of GAPDH and hsp72 - response curves 36Competitive PCR 37
Food analysisDevelopment of meat specific assays 38-39Fish species identification by RFLP 40
GMO detectionDevelopment of a multiplex assay for soya 41DNA stability during food processing 42GMO detection by nested multiplex PCR 43
OncologyTumor cell detection from carcinoma patient blood 44SNP analysis in cancer related P16 gene 45K-ras gene SNP detection 46METH-2 downregulation in lung carcinomas 47Label-free analysis of microsatellite instability in carcinoma 48
Clinical researchGenotyping of H. pylori 49Duplications and deletions in genomic DNA 50
Forensic testingOptimization of PCR on mtDNA 51Pitfalls in mtDNA sequencing 52
1 2

Contents Page
III. RNA analysis 53
Analysis of total RNARNA integrity 54Standardization of RNA Quality Control 55Reproducibility of quantitation 56Genomic DNA contamination 57
Low amounts of total RNADetection of low levels of RNA 58RNA integrity with the RNA 6000 Pico kit 59RNA quality after staining and microdissection 60Analysis of minimum RNA amounts 61Genomic DNA in low concentrated RNA extracts 62Low RNA amounts from kidney sections 63
Analysis of mRNARNA integrity 64Ribosomal RNA contamination in mRNA samples 65
Analysis of Cy5-labeled samplesAnalysis of cRNA with and without dye in gel matrix 66Optimization of labeling reactions 67cRNA fragmentation 68
Analysis of T7-RNA transcriptsSize estimation 69

Contents Page
IV. Protein analysis 70
Protein expressionAnalysis of cell lysates - protein induction 71
Protein purification:Comparison between lysate and flow through 72Analysis of protein purification 73GFP Streptag fusion protein purification 74Analysis of column capacity 75Analysis of column fractions to optimize conditions 76His-tag protein purification with Ni++ ZipTips® 77Enzymatic removal of His Tags from recombinant proteins 78Complementing RP-HPLC protein purification 79
Antibody AnalysisAnalysis of antibodies under reducing and non-reducing conditions 80Quantitation of the half-antibody content in IgG4 preparations 81Comparison of SDS-PAGE, CGE and Agilent 2100 bioanalyzer for humanized monoclonal antibody analysis 82Absolute quantitation of IgG 83Quality control of stressed antibodies 84Separation of bispecific antibodies chains 85
Food analysisBovine milk analysis 86Protein pattern of different transgenic seedlines 87
Protein - othersAbsolute protein quantitation 88Glycoprotein sizing 89Protein quality control prior to MS-analysis 90Depletion of high abundant proteins from blood samples 91Increased sensitivity by desalting protein samples 92
V. Literature 93
3 4
I. Cell fluorescence analysisForensics/H
omeland Security
Proteomics
Pharmaceuticals
Genom
ics
Drug M
anufacturing QA
/QC
Drug D
iscovery/Drug D
evelopment
Agriculture/Food
Protein expression monitoringCell surface antibody staining - CD4 in CCRF CEM T-cells ● ● ●
Cell surface antibody staining - CD3 in T-cell leukemia ● ● ●
CD3 expression in T-cell leukemia via on-chip staining ● ● ●
Intracellular glucocorticoide receptor (GR) antibody staining in H4 hepatocytes ● ● ●
Analyzing a limited number of cells ● ● ●
Baculovirus titre determination ● ● ● ●
Upregulated gene expression in primary cells ● ● ● ●
Transfection efficiency monitoringGreen fluorescent protein in CHO cells ● ● ●
On-chip staining of GFP expression for optimizing transfection conditionswith different DNA:lipid ratios ● ● ●
Verification of stable transfected cell clones by on-chip antibody staining ● ● ●
Transfection of primary cells ● ●
Apoptosis detectionDetection of phosphatidylserine on the cell surface via Annexin V binding ● ● ●
Intracellular Caspase-3 antibody staining assay ●
Fast Annexin protocol for time course of apoptosis induction via anti-FAS antibody ● ● ●
Apoptosis detection in primary cells ● ●
Gene silencing in cell culturesiRNA transfection optimization ● ● ● ●
Monitoring of gene silencing experiments ● ● ● ●

Flow cytometer (10,000 Events) Agilent 2100 bioanalyzer (500 Events)
Protein expression monitoring Cell surface antibody staining - CD4 in CCRF CEM T-cells
Kit: Cell fluorescence kitAssay: Antibody staining assayApplication: CCRF-CEM cells were stained with hCD4-APC labeled antibodies and calcein livedye. 65% of all CCRF-CEM live cells (yellow curve) are expressing CD4 protein which is good in comparison to conventional flow cytometer results.
Corresponding application note: 5988-4322EN
5 6

Protein expression monitoring Cell surface antibody staining - CD3 in T-cell leukemia
Kit: Cell fluorescence kitAssay: Antibody staining assayApplication: Jurkat (T-cell leukemia) cells were stained with calcein alone or with calcein and APC-labeled anti-CD3 antibody. To mimic different subpopulation sizes, mixtures of bothpopulations were prepared at various ratios.Samples were analyzed with 4 Agilent 2100 bioanalyzer instruments on 5 chips and compared to a flow cytometer reference instrument. Interestingly, small subpopulations (like 10 - 20%) could be analyzed with good accuracy and reproducibility.
Averaged data per instrument
Corresponding application note: 5988-4322EN
Mean % CD3+ cells2100-1 2100-2 2100-3 2100-4 Flow cyt.60.9 67.8 66.6 65.0 60.934.4 36.7 36.7 34.3 29.817.3 17.6 18.7 17.2 13.8
8.9 9.4 9.9 8.3 6.55.1 4.4 5.3 4.9 3.20.8 0.6 0.3 0.3 0.0

Protein expression monitoring CD3 expression in T-cell leukemia via on-chip staining
B. Conventional flow cytometryA. On-chip Agilent 2100 bioanalyzer
Kit: Cell fluorescence kitAssay: Antibody staining assayApplication: Jurkat cells were stained on-chip with anti hCD3-APC prediluted 1:5.5 in cellbuffer and Calcein (1:50 in cell buffer). After an incubation time of 25 minutes in the chip,samples were measured in the Agilent 2100 bioanalyzer. The faster and easier on-chip staining procedure has the advantage here of reducing cell consumption 17 fold and antibody reagent costs 80 fold.
A) Overlay of representative histograms of calcein and antibody treated cells.B) Comparison between on-chip staining data and data obtained by measuring cells stained
by conventional staining on a flow cytometer.
Corresponding application note: 5988-7111EN
7 8

Protein expression monitoring Intracellular glucocorticoide receptor (GR) antibodystaining in H4 hepatocytes
Chip histogram overlay from 700 cells/sample Correlation of chip vs. flow cytometer results
Kit: Cell fluorescence kitAssay: Generic assayApplication: H4 hepatocytes cells were stained with SYTO16 DNA dye alone or with SYTO16and GR primary antibody. After washing, both cell preparations were stained with APC-labeledsecondary antibody. Mixtures of both populations were prepared at various ratios.The insert in the left picture shows the overlay of all six cell samples in the blue reference color.The black histogram represents data from the control sample, no GR detected.All other 5 samples have significant staining above marked fluorescence intensity in the red. Good chip to chip reproducibility and comparison to flow cytometer is demonstrated.
Corresponding application note: 5988-4322EN

9 10
Protein expression monitoringAnalyzing a limited number of cells
Kit: Cell fluorescence kitAssay: On-chip antibody staining assayApplication: The direct comparison of different input numbers of cells (down to 625 cells in 10 µl) for the on-chip staining protocol reveals that even with a much lower number than the recommended 20000 cells/10 µl for the standard protocol reliable and meaningful resultscan be achieved with good reproducibility. The data shown were generated with CD3-positiveJurkat cells stained with an anti-CD3 antibody for the CD3 protein and counterstained with thelive cell stain Calcein AM. Similar results were obtained with primary human dermal fibroblasts(PHDF) indicating the usefulness of this method for scarce specimen. The lack of sensitivity,automation and convenient quantitation found with other methods can be circumvented easilyby using the Agilent 2100 bioanalyzer.
Cells Live-CD3+ STD(n=4)
20,000 83.7% 3.5%10,000 85.6% 4.1%5,000 87.7% 4.2%2,500 84.0% 3.0%1,250 89.8% 6.5%625 90.0% 9.3%
Corresponding application note: 5989-0746EN
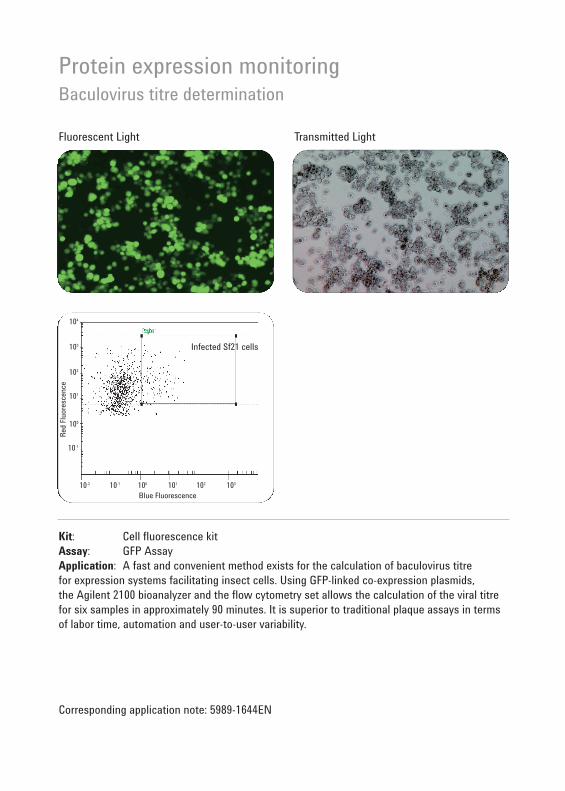
Protein expression monitoringBaculovirus titre determination
Kit: Cell fluorescence kitAssay: GFP AssayApplication: A fast and convenient method exists for the calculation of baculovirus titre for expression systems facilitating insect cells. Using GFP-linked co-expression plasmids, the Agilent 2100 bioanalyzer and the flow cytometry set allows the calculation of the viral titrefor six samples in approximately 90 minutes. It is superior to traditional plaque assays in termsof labor time, automation and user-to-user variability.
Corresponding application note: 5989-1644EN
Transmitted LightFluorescent Light
Infected Sf21 cells
Blue Fluorescence10-2 10-1 100 101 102 103
10-1
Red
Flu
ores
cenc
e
100
101
102
103
104

A
B
11 12
Protein expression monitoringUpregulated gene expression in primary cells
Kit: Cell fluorescence kitAssay: On-chip antibody staining assayApplication: Flow cytometric analysis of primary cells can present a challenge for researchersdue to limited availability and life span of primary cells. A dose-respondent upregulation of protein expression in primary cells using only a minimum number of cells in a fast on-chip-staining approach is shown here. Activation of peripheral blood lymphocytes by phorbol-12-myristate-13-acetate (PMA) leads to increased expression of the T cell receptor CD3 (Figure A, mean from 3 experiments). For HUVECs (human umbilical vein endothelia cells) the induction of E-selectin (CD62E) expression upon IL-1β treatment is shown (Figure B, white bars) in comparison to results from a conventional flow cytometer (white bars).
Corresponding application note: 5989-2718EN

Mock transfected cells
GFP transfected cells
Transfection efficiency monitoringGreen fluorescent protein in CHO cells
Kit: Cell fluorescence kitAssay: GFP assayApplication: Chinese hamster ovary (CHO-K1) cells were transfected with EGFP DNA by a lipofection method. The upper panel shows the control mock transfection; here cells don'texpress GFP. Examples for data evaluation in dotplot view and histogram view are shown incomparison to the microscopy view. For analysis on the Agilent 2100 bioanalyzer, cells werestained with a red dye for live cells (reference stain). The transfection efficiency of 56% can be easily determined with the Agilent 2100 bioanalyzer.
Corresponding application note: 5988-4320EN

13 14
Control 1:2 1:4
1:6 1:8 1:10
Transfection efficiency monitoringOn-chip staining of GFP expression for optimizingtransfection conditions with different DNA:lipid ratios
Kit: Cell fluorescence kitAssay: On-chip GFP assayApplication: Chinese hamster ovary (CHO-K1) cells were transfected with EGFP DNA by alipofection method. Optimization of transfection conditions were done on one chip. Several DNA:lipofectamine ratios were tried. A ratio of 1:8 gave the best transfection efficiency.All cells were reference stained with a red live dye. On-chip staining was applied, minimizingthe staining time, reagent usage and cell consumption.
Corresponding application note: 5988-7296EN

Hek 293 control cells CD 80 stable clone
Transfection efficiency monitoring Verification of stable transfected cell clones by on-chip antibody staining
Kit: Cell fluorescence kitAssay: On-chip antibody staining assayApplication: Verification of CD80 protein expression in stable transfected Hek 293 cells with the Agilent 2100 bioanalyzer. Control (left dot plot) and CD80 transfected cells (right) are stained on-chip with blue calcein live dye and anti-CD80-CyChrome antibody. Red regionmarks CD80 protein expressing 293 cells within live cell population - confirming expression in the CD80 stable clone Hek 293 cells.
Corresponding application note: 5988-7111EN
15 16
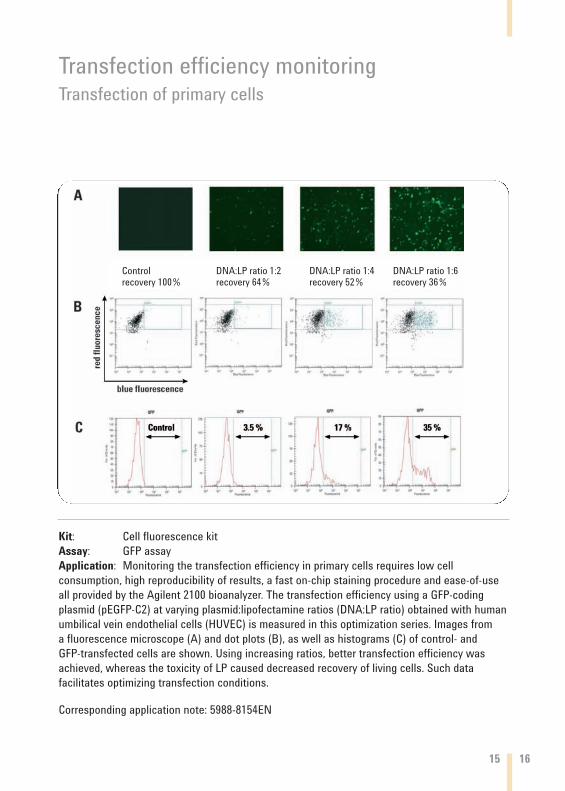
Transfection efficiency monitoringTransfection of primary cells
Kit: Cell fluorescence kitAssay: GFP assayApplication: Monitoring the transfection efficiency in primary cells requires low cell consumption, high reproducibility of results, a fast on-chip staining procedure and ease-of-useall provided by the Agilent 2100 bioanalyzer. The transfection efficiency using a GFP-codingplasmid (pEGFP-C2) at varying plasmid:lipofectamine ratios (DNA:LP ratio) obtained with humanumbilical vein endothelial cells (HUVEC) is measured in this optimization series. Images from a fluorescence microscope (A) and dot plots (B), as well as histograms (C) of control- and GFP-transfected cells are shown. Using increasing ratios, better transfection efficiency wasachieved, whereas the toxicity of LP caused decreased recovery of living cells. Such data facilitates optimizing transfection conditions.
Corresponding application note: 5988-8154EN
Controlrecovery 100%
DNA:LP ratio 1:2recovery 64%
DNA:LP ratio 1:4recovery 52%
DNA:LP ratio 1:6recovery 36%

16h treated sample
Subpopulation of all live cells which are apoptotic
Apoptosis detectionDetection of phosphatidylserine on the cell surfacevia Annexin V binding
Agilent 2100 bioanalyzer histogram: blue channel
(Calcein)
Agilent 2100 bioanalyzer histogram: red channel
(Annexin-Cy5)
Agilent 2100 bioanalyzer dot plot:
events from both channels
Kit: Cell Fluorescence kitAssay: Apoptosis assayApplication: Apoptosis (programmed cell death) in Jurkat cells was induced with camptothecin. Cells treated for 16 hours and untreated cells were stained with calcein and Annexin-Cy5.Annexin-V binds to phosphatidylserine - a membrane lipid which is kept to the inner leaflet of the cellmembrane of intact cells. Exposure of phopshatidylserine on the outer leaflet is an early indicator of apoptotic processes. Annexin-V binding is made detectable by Cy5 staining of the Annexin-V via a biotin-streptavidin interaction. Calcein staining of cells is used as a live control to distinguish livingand apoptotic cells from dead cells. Calcein enters the cell via the membrane as a non-fluorescentester. The ester is cleaved inside the cell which results in fluorescence.
The histograms on the left show the number and intensity value of all events which generated a signal in the blue channel, corresponding to calcein-stained cells. The histograms on the rightshows all events which generated a signal in the red channel, corresponding to Annexin-V bindingto apoptotic cells. While the control shows only low intensity values (background noise), the treatedsample shows high intensity values (within the red markers) corresponding to apoptotic cells. Thedot plot of the treated sample nicely shows the subpopulation of all live cells which are apoptotic.Corresponding application note: 5988-4319EN

17 18
Kit: Cell fluorescence kitAssay: Generic assayApplication: Induction of apoptosis in Jurkat cells was done with anti-FAS antibody treatment.Intracellular staining with specific antibodies against 'active' Caspase-3 were performed.Reference staining was done with SYTO16 DNA dye. Good chip to chip reproducibility and goodcomparison to conventional flow cytometer results were obtained.
Apoptosis detectionIntracellular Caspase-3 antibody staining assay
Corresponding application note: 5988-4319EN

Apoptosis detectionFast Annexin protocol for time course of apoptosisinduction via anti-FAS antibody
A
Kit: Cell fluorescence kitAssay: Apoptosis assayApplication: Apoptosis (programmed cell death) in Jurkat cells was induced with anti-FASantibody. Cells treated for 0,1,2,3,4 and 6 hours were stained with calcein and Annexin-Cy5.Annexin-V binds to phosphatidylserine - a membrane lipid which is kept to the inner leaflet of the cell membrane of intact cells. Exposure of phopshatidylserine on the outer leaflet is anearly indicator of apoptotic processes. Annexin V binding is detectable by Cy5 staining of the Annexin-V via a biotin-streptavidin interaction. Calcein staining of cells is used as a live control to distinguish living and apoptotic cells from dead cells. Calcein enters the cell via the membrane as non-fluorescent ester. The ester is cleaved inside the cell which results in fluorescence and indicates apoptosis.

B
The histograms on page 18 (A) show the number and intensity value of all events whichgenerated a signal in the blue channel, corresponding to calcein-stained cells.The histograms on the right show all events which generated a signal in the red channel,corresponding to Annexin-V binding to apoptotic cells. While the control shows only low intensity values (background noise), the treated sample shows high intensity values (within the red markers) corresponding to apoptotic cells.(B) Time course of the induction of apoptosis by anti-FAS antibody in Jurkat cells. Apoptosis is detectable in a significant amount of cells after 2 hours. Following a treatment of 4 hours,approximately 95% of the cells are apoptotic.
Corresponding application note: 5988-4319EN
19 20

Apoptosis detectionApoptosis detection in primary cells
Kit: Cell fluorescence kitAssay: On-chip antibody staining assayApplication: The Agilent 2100 bioanalyzer has been used to study induced apoptosis by monitoring annexin V-binding in primary human endothelial cells (HUVEC, not shown) andhuman dermal fibroblasts (NHDF, shown). A simple and fast assay protocol was used on cellsleft untreated or treated for 5 hours with different concentrations of staurosporine, which induces apoptosis. See row A for dot blots and B for histograms at different concentrations.Evaluation of the same samples on a conventional flow cytometer (row C) yielded similar results.
Corresponding application note: 5989-2934EN
21 22
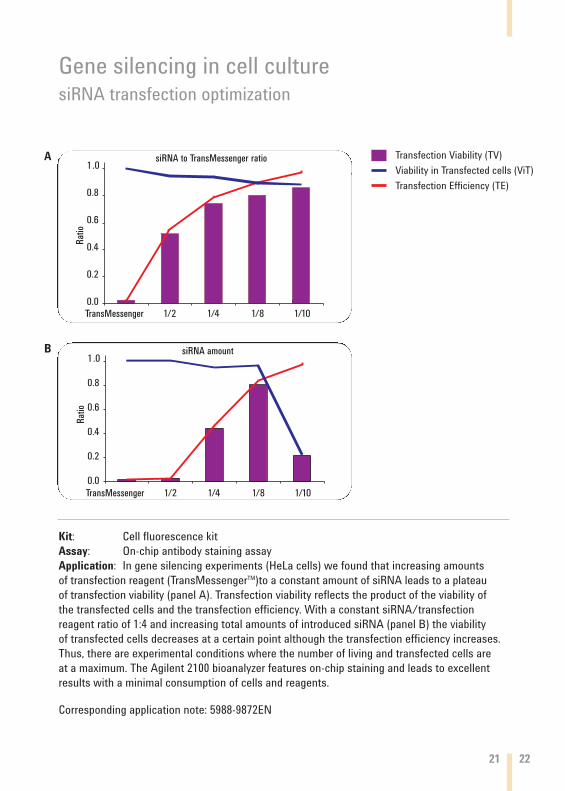
A
B
Gene silencing in cell culturesiRNA transfection optimization
Kit: Cell fluorescence kitAssay: On-chip antibody staining assayApplication: In gene silencing experiments (HeLa cells) we found that increasing amounts of transfection reagent (TransMessengerTM)to a constant amount of siRNA leads to a plateau of transfection viability (panel A). Transfection viability reflects the product of the viability of the transfected cells and the transfection efficiency. With a constant siRNA/transfectionreagent ratio of 1:4 and increasing total amounts of introduced siRNA (panel B) the viability of transfected cells decreases at a certain point although the transfection efficiency increases.Thus, there are experimental conditions where the number of living and transfected cells are at a maximum. The Agilent 2100 bioanalyzer features on-chip staining and leads to excellentresults with a minimal consumption of cells and reagents.
Transfection Viability (TV)
Viability in Transfected cells (ViT)
Transfection Efficiency (TE)
Corresponding application note: 5988-9872EN

Gene silencing in cell cultureMonitoring of gene silencing experiments
Kit: Cell fluorescence kitAssay: GFP AssayApplication: After co-transfection of a GFP plasmid and Cy5-labeled siRNA (GFP-specific), GFP expression and viability of cells were detected. The course of GFP expression in control(GFP only) and siRNA/GFP transfected cells was measured on the Agilent 2100 bioanalyzer.Accurate results were obtained fast and in an automated manner. They easily allow the efficiency and reliability of a given protocol and transfection reagents to be judged. Thus, such an experiment provides efficient monitoring and optimization of any gene silencing experiment.
Corresponding application note: 5989-0103EN
II. DNA analysis
23 24
Forensics/Hom
eland Security
Proteomics
Pharmaceuticals
Genom
ics
Drug M
anufacturing QA
/QC
Drug D
iscovery/Drug D
evelopment
Agriculture/Food
Restriction digest analysisSizing range exemplified by the separation of Adenovirus 2/Dra I ●
Detection of single base mutations (I) ● ●
Detection of single base mutations (II) ● ●
PCR product analysisSeparation of 3 different mixtures of PCR products ● ●
Determination of PCR product impurity ● ●
Multiplex PCR analysis of bacteria in chicken ● ● ●
Multiplex PCR with 19 products ● ● ●
Gene expression analysismRNA expression study by comparative multiplex PCR ● ● ●
Standardized end-point RT-PCR ● ● ●
Co-amplification of GAPDH and hsp72 ●
Co-amplification of GAPDH and hsp72 - response curves ●
Competitive PCR ● ● ●
Food analysisDevelopment of meat specific assays (I) ● ●
Development of meat specific assays (II) ● ●
Fish species identification by RFLP ● ●
GMO detectionDevelopment of a multiplex assay for soya ● ●
DNA stability during food processing ● ●
GMO detection by nested multiplex PCR ● ●
OncologyTumor cell detection from carcinoma patient blood ● ●
SNP analysis in cancer related P16 gene ● ●
K-ras gene SNP detection ● ●
METH-2 downregulation in lung carcinomas ● ●
Label-free analysis of microsatellite instability in carcinoma ● ●
Diagnostic researchGenotyping of H. pylori ● ● ● ●
Duplications and deletions in genomic DNA ● ●
Forensic testingOptimization of PCR on mtDNA ● ●
Pitfalls in mtDNA sequencing ● ●

Restriction digest analysisSizing range exemplified by the separation of Adenovirus 2/Dra I
Kit: DNA 12000 kitAssay: DNA 12000 assayApplication: Restriction digest analysis of Adenovirus 2/Dra I. For restriction fragment analysisthe large linear dynamic range of the lab-on-a-chip approach is very advantageous. Analyzingsamples with large and short fragments on slab gels can be difficult because of bands running off the gel and insufficient staining (or over-staining) of bands.
Corresponding application note: 5968-7501EN
25 26
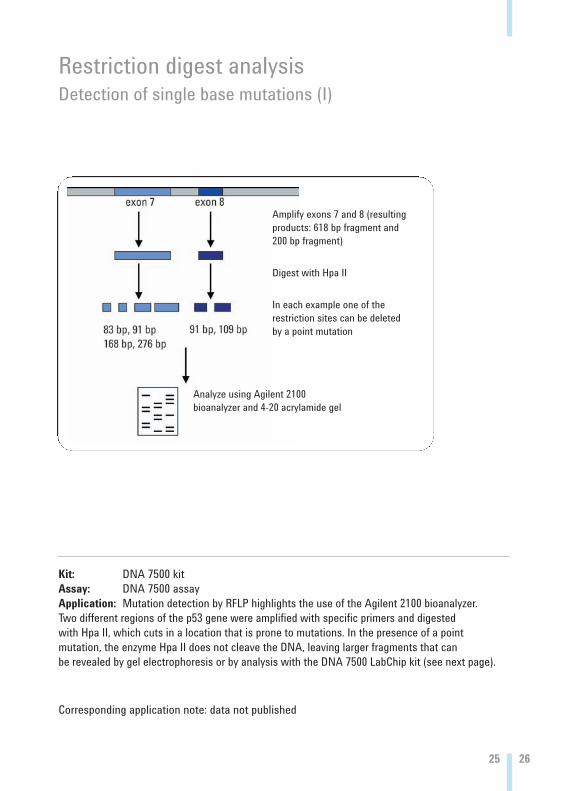
Restriction digest analysisDetection of single base mutations (I)
Kit: DNA 7500 kitAssay: DNA 7500 assayApplication: Mutation detection by RFLP highlights the use of the Agilent 2100 bioanalyzer. Two different regions of the p53 gene were amplified with specific primers and digested with Hpa II, which cuts in a location that is prone to mutations. In the presence of a point mutation, the enzyme Hpa II does not cleave the DNA, leaving larger fragments that can be revealed by gel electrophoresis or by analysis with the DNA 7500 LabChip kit (see next page).
Amplify exons 7 and 8 (resultingproducts: 618 bp fragment and200 bp fragment)
Digest with Hpa II
In each example one of the restriction sites can be deletedby a point mutation
Corresponding application note: data not published
Analyze using Agilent 2100 bioanalyzer and 4-20 acrylamide gel

Restriction digest analysis Detection of single base mutations (II)
Kit: DNA 7500 kitAssay: DNA 7500 assayApplication: Analysis on the chip showed an identical pattern of digest fragments as seen on the slab gel for the wildtype and Exon 7 & 8 PCR products. Comparison of the calculatedsizes of the bands shows 1-2% variance with the LabChip assay, which allows fast and accuratedetection of point mutations.
Corresponding application note: 5968-7496EN
27 28
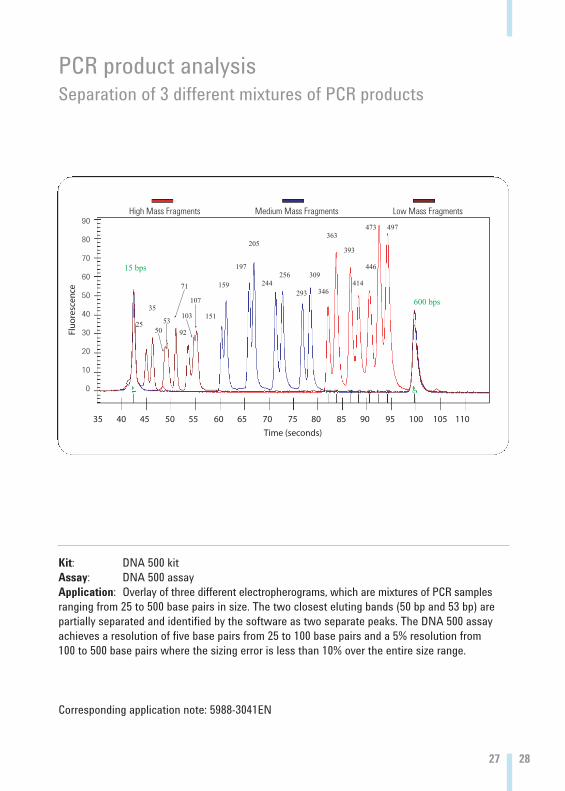
PCR product analysis Separation of 3 different mixtures of PCR products
Kit: DNA 500 kitAssay: DNA 500 assayApplication: Overlay of three different electropherograms, which are mixtures of PCR samplesranging from 25 to 500 base pairs in size. The two closest eluting bands (50 bp and 53 bp) arepartially separated and identified by the software as two separate peaks. The DNA 500 assayachieves a resolution of five base pairs from 25 to 100 base pairs and a 5% resolution from 100 to 500 base pairs where the sizing error is less than 10% over the entire size range.
Corresponding application note: 5988-3041EN

PCR product analysisDetermination of PCR product impurity
Kit: DNA 7500 kitAssay: DNA 7500 assayApplication: Comparison between the analysis of two PCR reactions (300 and 3000 bp products)using the DNA 7500 LabChip kit vs. an agarose gel. Two different concentrations are shown side by side for each PCR reaction (undiluted and 1:4 dilution). The Agilent 2100 bioanalyzer showssuperior performance in locating impurities over a broader concentration range than the gel. The 300 bp fragment appears to be uncontaminated in both the gel and on the Agilent 2100 bioanalyzer. The 3000 bp fragment shows few impurities on the gel, which become invisible at the 1:4 dilution. These impurities can easily be detected with the Agilent 2100 bioanalyzer.
Corresponding application note: 5968-7496EN

29 30
PCR product analysisDetermination of PCR product impurity
Kit: DNA 7500 kitAssay: DNA 7500 assayApplication: The quantitative data generated by the Agilent 2100 bioanalyzer indicate the amount of impurity or non-specific products in the PCR reactions from the previous page. Even in the 300 bp fragment a small impurity can be detected, while the 3000 bp fragmentshows more than 50% impurities.
Corresponding application note: 5968-7496EN
Sample c (DNA) Main peakAll peaks (3000bp)
Pure PCR 61.9 ng/µl 40.7 ng/µl1:4 dilution 14.8 ng/µl 9.8 ng/µl
Sample c (DNA) Main peakAll peaks (300bp)
Pure PCR 41.4 ng/µl 40.7 ng/µl1:4 dilution 9.6 ng/µl 9.6 ng/µl

PCR product analysisMultiplex PCR analysis of bacteria in chicken
Data kindly provided by GenPoint, NL
Kit: DNA 500 kitAssay: DNA 500 assayApplication: Multiplex PCR with four primer pairs, each one specific for a certain DNAsequence from one of the 4 bacteria to be tested for. Total DNA was extracted from chicken and subjected to PCR. The gel-like image shows traces from different chicken samples withbands showing up when an amplicon could be detected. The electropherogram is one examplewhere bacterial DNA from two species of the Campylobacter genus could be detected.
Corresponding application note: data not published
Uppermarker
E.coliC.jejuni
Salmonella
C.coli
Lowermarker

31 32
PCR product analysisMultiplex PCR with 19 products
Data kindly provided by Qiagen, Germany
Kit: DNA 7500 kitAssay: DNA 7500 assayApplication: Many molecular applications include PCR multiplexing as shown above with a PCR that yields 19 products. Applications are genotyping of transgenic organisms, detection of pathogens or GMs and microsatellite genotyping (e.g. short tandem repeat (STR) and variablenumber tandem repeat (VNTR) analyses). The sample shows optimization of PCR conditions(Mg2+ concentration) performed to ensure annealing of the multiple primers under identical conditions. Visualization and evaluation of the results can be performed efficiently with theAgilent 2100 bioanalyzer because of the high resolution, the accurate sizing, quantitation and extended linear range.
Corresponding application note: 5988-9342EN

Gene expression analysismRNA expression study by comparative multiplex PCR
Data kindly provided by the Roy Castle Centre
Kit: DNA 1000 kitAssay: DNA 1000 assayApplication: Two genes were co-amplified in this study. A tumor specific gene (upper band)along with a housekeeping gene (lower band). The upregulation of the tumor gene is visualizedvia analysis on the Agilent 2100 bioanalyzer. Building the ratio of the concentration values obtained from the Agilent 2100 bioanalyzer, numerical values are obtained that are normalizedwith regard to the RT-PCR amplification efficiency. This way tumor tissue can be distinguishedfrom normal tissue more unambiguously.
Corresponding application note: data not published

33 34
Gene expression analysisStandardized end-point RT-PCR
Data kindly provided by the Medical College of Ohio
Kit: DNA 7500 kitAssay: DNA 7500 assayApplication: Complementary DNA from bronchial epithelial cells (BEC) was analyzed by a Standardized RT-PCR (StaRT) for the expression of 15 different genes. This analysis can be performed at the end-point of PCR without the need for real-time measurement at each cycle of PCR. Three methods for evaluation of representative results were compared (see above). The coefficient of variance (CV) from at least 3 measurements was calculated. The direct comparison of the reproducibility for agarose gel analysis (A, CV = 0.50) and the ABI Prism310Genetic Analyzer (C, CV = 0.39) with the Agilent 2100 bioanalyzer (B, CV = 0.29) reveals that the Agilent 2100 bioanalyzer is superior. It is a reliable and valuable tool in quantitative geneexpression analysis.
Corresponding application note: 5988-3674 EN
5
1
9
6
2
10
7
3
11
8
4
12
A
B
C

Gene expression analysisCo-amplification of GAPDH and hsp72
Data kindly provided by Dr. Eric Gottwald, Forschungszentrum Karlsruhe, Germany
Kit: DNA 1000 kitAssay: DNA 1000 assayApplication: Gel-like image and electropherograms showing the results of separate amplificationsand co-amplifications of GAPDH and hsp72 in unstimulated HepG2 cells. Primers for GAPDHyield a PCR product of 443 bp (lane 1), primers for hsp72 yield PCR products of 384 and 650 bp(lane 2 and 3). Lane 4 and 5 show the results of the co-amplification reactions. Due to the competitiveness of the reaction, very little hsp72 products could be detected in lane 4 (insert)and no product was detected in lane 5 (lane 6 = negative control). The broad linear dynamicrange of the analysis allows detection of weak bands next to strong bands and helped in thedetermination of gene expression in this case.
Corresponding application note: 5988-4556EN

35 36
Gene expression analysisCo-amplification of GAPDH and hsp72 - response curves
Data kindly provided by Dr. Eric Gottwald, Forschungszentrum Karlsruhe, Germany
Kit: DNA 1000 kitAssay: DNA 1000 assayApplication: The optimized PCR conditions were used to monitor the response of a stimulus tohsp. Gene expression was monitored by comparing the RT-PCR amplification of a housekeepinggene with the co-amplification of hsp. In the current case, the highest gene expression was measured after about 10 minutes. As a comparison, the same set of samples was analyzed using the DNA 500 kit. Virtually identical results are obtained with both kits, demonstrating thatlab-on-a-chip technology can serve as a standardized approach to gel electrophoresis.
Corresponding application note: 5988-4556EN

Gene expression analysisCompetitive PCR
Data kindly provided by Dr. Eric Gottwald, Forschungszentrum Karlsruhe, Germany
Kit: DNA 1000 kitAssay: DNA 1000 assayApplication: Two genes were reverse transcribed and co-amplified in one reaction tube. The PCR products were analyzed using the DNA 1000 LabChip kit. Primers for hsp72 were present from the beginning of the PCR reactions, while primers for GAPDH were added aftervarious cycle numbers ranging from 20 to 40 cycles (primer dropping method). This allowed optimization of this competitive PCR reaction. The left graph displays the dynamic range (arrow)in the gel like view, whereas the right graph indicates conditions with greatest sensitivity (red line).
Corresponding application note: 5988-4556EN

37 38
Food analysisDevelopment of meat specific assays (I)
Kit: DNA 500 kitAssay: DNA 500 assayApplication: For detection of individual species in processed food, PCR assays with specific sets of primers can be developed. Example: turkey specific primers do not amplify any other meat species, including beef, chicken, lamb, or pork (see lane 5 and respectiveelectropherogram).
Data kindly provided by CCFRA, UK
Corresponding application note: 5988-4069EN

Food analysisDevelopment of meat specific assays (II)
Data kindly provided by CCFRA, UK
Kit: DNA 500 kitAssay: DNA 500 assayApplication: For detection of individual component types in processed food, PCR assays withspecific sets of primers can be developed. Example: Primers that amplify any type of meat, but do not amplify other food constituents, including soya, maize, wheat or fish.
Corresponding application note: 5988-4069EN

39 40
Restriction enzyme: DdeI
Restriction enzyme: HaeIII
Food analysisFish species identification by RFLP
Restriction enzyme: NlaIII
Kit: DNA 500 kitAssay: DNA 500 assayApplication: Identification of white fish and salmon species in the processed state presents a challenge. However, evaluation of PCR-RFLP profiles (PCR-restriction fragment length polymorphism) of a 464 bp region from the cytochrom b gene cut separately with three restriction enzymes facilitated the differentiation of 19 commercially important species.Analysis of the restriction digests was performed with the Agilent 2100 bioanalyzer. This approach was successfully tested in an interlaboratory study.
Corresponding application note: 5989-2982EN
Common name (UK) Latin name
Atlantic Cod Gadus morhuaPacific Cod Gadus macrocephalusColey (Saithe) Pollachius virensHaddock Melanogrammus
aeglefinusEuropean Hake Merluccius merlucciusSouth African Hake Merluccius paradoxusEuropean Plaice Pleuronectes platessaWhiting Merlangus merlangusAlaskan (Walleye) Pollock Theragra chalcogrammaHoki Macruronus
novaezelandiaeAtlantic Salmon Salmo salarRed / Sockeye Salmon Oncorhynchus nerkaPink / Humpback Salmon Oncorhynchus gorbuschaChinook Salmon Oncorhynchus
tschawytschaCoho / Silver Salmon Oncorhynchus kisutchKeta / Chum Salmon Oncorhynchus ketaCut-throat Trout Oncorhynchus clarki clarkiDolly Varden Salvelinus malma malmaCherry Salmon Oncorhynchus
masou masou
Data kindly provided by CCFRA, UK
A B
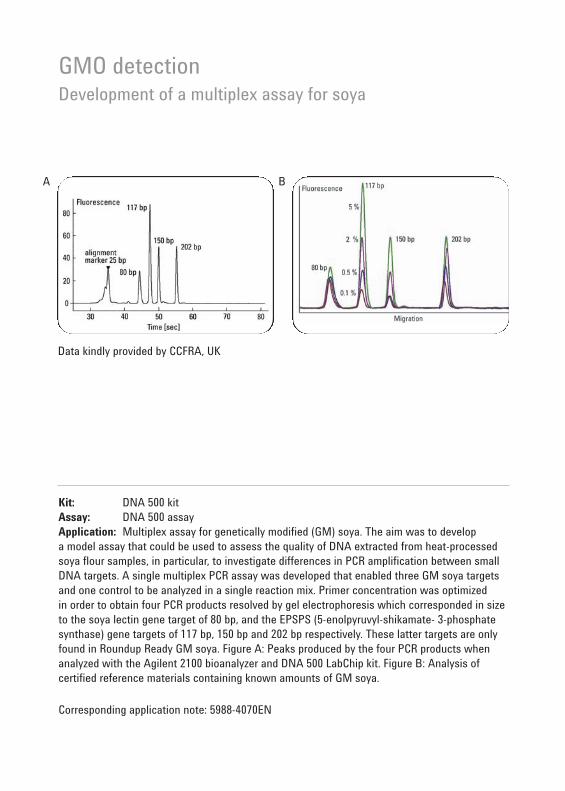
GMO detectionDevelopment of a multiplex assay for soya
Data kindly provided by CCFRA, UK
Kit: DNA 500 kitAssay: DNA 500 assayApplication: Multiplex assay for genetically modified (GM) soya. The aim was to develop a model assay that could be used to assess the quality of DNA extracted from heat-processed soya flour samples, in particular, to investigate differences in PCR amplification between smallDNA targets. A single multiplex PCR assay was developed that enabled three GM soya targetsand one control to be analyzed in a single reaction mix. Primer concentration was optimized in order to obtain four PCR products resolved by gel electrophoresis which corresponded in size to the soya lectin gene target of 80 bp, and the EPSPS (5-enolpyruvyl-shikamate- 3-phosphate synthase) gene targets of 117 bp, 150 bp and 202 bp respectively. These latter targets are onlyfound in Roundup Ready GM soya. Figure A: Peaks produced by the four PCR products when analyzed with the Agilent 2100 bioanalyzer and DNA 500 LabChip kit. Figure B: Analysis of certified reference materials containing known amounts of GM soya.
Corresponding application note: 5988-4070EN

41 42
GMO detectionDNA stability during food processing
Data kindly provided by CCFRA, UK
Kit: DNA 500 kitAssay: DNA 500 assayApplication: The multiplex PCR assay was applied to soya flour samples containing approx. 1.3 % GM soya and boiled at either pH 3.3, 4.3 or 6.7 for up to 21 minutes. For accurate determination of the quantity of each PCR product, the samples were applied to the DNA 500LabChip. The concentration of each PCR product was calculated using the Agilent 2100 bioanalyzersoftware. At pH 3.3 where an effect of heating time was observed, the amount of each PCR product at each time point was compared to the amount of each product at 0 minutes (Table 2). At pH 3.3, the relative amount of the 80 bp product was reduced to 48 % after 15 minutes and no product was detected at 18 or 21 minutes. After 15 minutes, the relative amounts of products of 118 bp and 150 bp were reduced to 27 % and 16 % respectively and the 202 bp product was not detected. None of the products were detected after 18 or 21 minutes.
Corresponding application note: 5988-4070EN
Time at 100°C and pH 3.3 (min) Amount of PCR product*
80 bp 118 bp 150 bp 202 bp
0 100 100 100 1003 74 77 73 676 57 58 21 69 36 23 24 15
12 67 33 47 2115 48 27 16 018 0 0 0 021 0 0 0 0
* % product determined relative to the amount at 0 minutes

GMO detectionGMO detection by nested multiplex PCR
Kit: DNA 1000 kitAssay: DNA 1000 assayApplication: GMO detection by multiplex PCR is widely used for soy and corn. Often sequences from the transgene and species specific controls or internal standard are co-amplified by endpoint PCR in a screening procedure. Multiple products can be analyzed with the Agilent 2100 bioanalyzer at high resolution and sensitivity. Quantification and comparison of product amounts may already lead to qualification of a positive screening result prior to analysis by expensive quantitative real time PCR.
Corresponding application note: 5989-0124EN
1 Low molecular weight marker2 Primer-dimer in negative control3 Soy lectin - 118 bp4 35S GMO - 153 bp5 Internal control - 217 bp6 Corn zein - 278 bp7 High molecular weight marker

43 44
OncologyTumor cell detection from carcinoma patient blood
Data kindly provided by AdnaGen
Kit: DNA 500 kitAssay: DNA 500 assayApplication: A combined method of specific tumor cell enrichment and a high sensitivity tumorcell detection by multiplex PCR allows analysis of several tumor marker genes. The method is so sensitive that it allows the detection of only a few tumor cells per 5 ml EDTA-blood. The Agilent 2100 bioanalyzer provides the performance to detect the PCR products with highsensitivity and automated result flagging. This method offers new possibilities for monitoringand prognosis in routine diagnosis, and may facilitate an appropriate selection of patients for adjuvant therapy.
Corresponding application note: 5988-9341EN
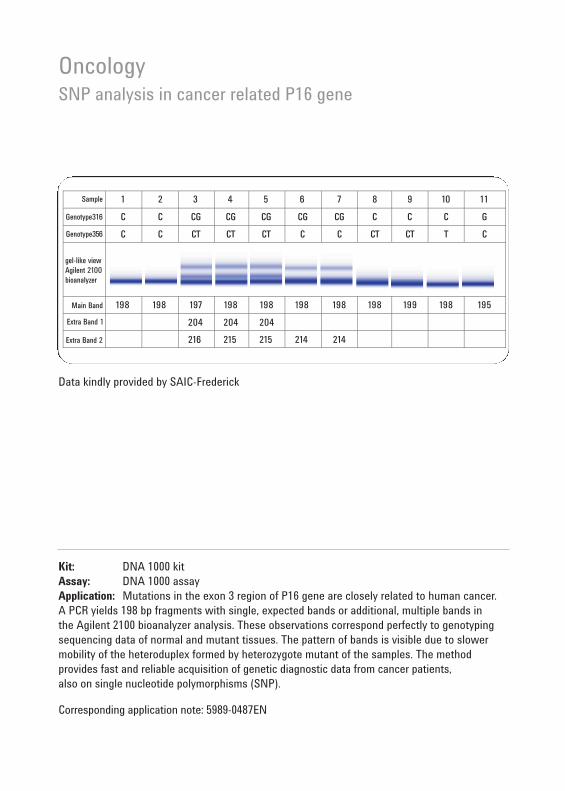
OncologySNP analysis in cancer related P16 gene
Data kindly provided by SAIC-Frederick
Kit: DNA 1000 kitAssay: DNA 1000 assayApplication: Mutations in the exon 3 region of P16 gene are closely related to human cancer. A PCR yields 198 bp fragments with single, expected bands or additional, multiple bands in the Agilent 2100 bioanalyzer analysis. These observations correspond perfectly to genotypingsequencing data of normal and mutant tissues. The pattern of bands is visible due to slowermobility of the heteroduplex formed by heterozygote mutant of the samples. The method provides fast and reliable acquisition of genetic diagnostic data from cancer patients, also on single nucleotide polymorphisms (SNP).
Corresponding application note: 5989-0487EN

45 46
hete
rozy
gous
Mut
ant 1
Mut
ant 2
neg
cont
rol
Wild
type
OncologyK-ras gene SNP detection
Data kindly provided by SAIC-Frederick ✄ - PCR product❍ - Restriction
✄ ❍ ✄ ❍ ✄ ❍ ✄ ❍ ✄ ❍
Kit: DNA 1000 kitAssay: DNA 1000 assayApplication: Mutations in the K-ras gene coding 12 region can lead to cancer in differenthuman tissues. A dedicated combination of PCR and specific restrictions (BstNI digest) revealsthe underlying single nucletide polymorphisms (SNPs). The integral element within this test is the rapid and precise analysis of short amplicons (135 bp, see PCR-product lanes above) and fragments (106 bp, visible in lanes labeled with restriction) with the lab-on-a-chip technique. The test was used to ultimately determine a cancer patient’s eligibility for a clinical trial for a peptide vaccine.
Corresponding application note: 5989-0487EN

Data kindly provided by Roy Castle Lung Cancer Research Programme,University of Liverpool, UK
OncologyMETH-2 downregulation in lung carcinomas
Kit: DNA 1000 kitAssay: DNA 1000 assayApplication: Microarray analysis reveals under- or over-representations of transcripts.Screening of several cell lines for independent validation of such observations can be done with different techniques such as comparative multiplex PCR. This application shows thedownregulation of a characteristic antiangiogenetic factor (METH-2) for a series of patient samples. Expression in normal tissue and tissue from the non small lung carcinomas is compared. Results from the array experiments were confirmed on a broad basis. Fast and convenient analysis with the Agilent 2100 bioanalyzer with given quantitation capability fit perfectly in such analytical workflow.
Corresponding application note: 5989-3514EN

OncologyLabel-free analysis of microsatellite instability in carcinoma
Kit: DNA 1000 kitAssay: DNA 1000 assayApplication: Microsatellite instability (MSI) is caused by a failure of the DNA mismatch repairsystem and occurs frequently in various types of cancer. Given that conventional techniquesused for MSI detection, for example, polyacrylamide gel electrophoresis (PAGE) or capillaryelectrophoresis, turned out to be laborious or expensive, this study aimed to develop a simple and efficient procedure of MSI detection. Detection of MSI could be demonstrated by microsatellite loci-associated, well defined deviations in the electropherogram profiles of tumor and non-tumor material and confirmed the classification of the MSI cases performed by conventional technology (95% concordance rate). Whereas the results of the MSI detectionwere comparable to conventional techniques, the on-chip electrophoresis on the Agilent 2100 bioanalyzer was superior in terms of speed, usability and data management.
Corresponding application note: 5989-2626EN
47 48

Clinical researchGenotyping of H. pylori
Data kindly provided by Institute for Pathology, Cologne
Kit: DNA 1000 kitAssay: DNA 1000 assayApplication: Different allelic variants are associated with different stages of H. pylori virulence.Multiplex PCR on five alleles with products in the range of 102 to 301 bp were used to analyzeDNA from paraffin embedded tissues. Agarose gel (A) yields only limited distinctiveness, whereas gel-like images (B) and electropherograms (C) show good resolution and superiorreproducibility allowing convenient analysis of all desired products in parallel (D). An extendedspectrum of prognostic or therapeutic relevant information is now routinely accessible for simultaneous analysis.
Corresponding application note: 5989-0078EN
A
C
D
B
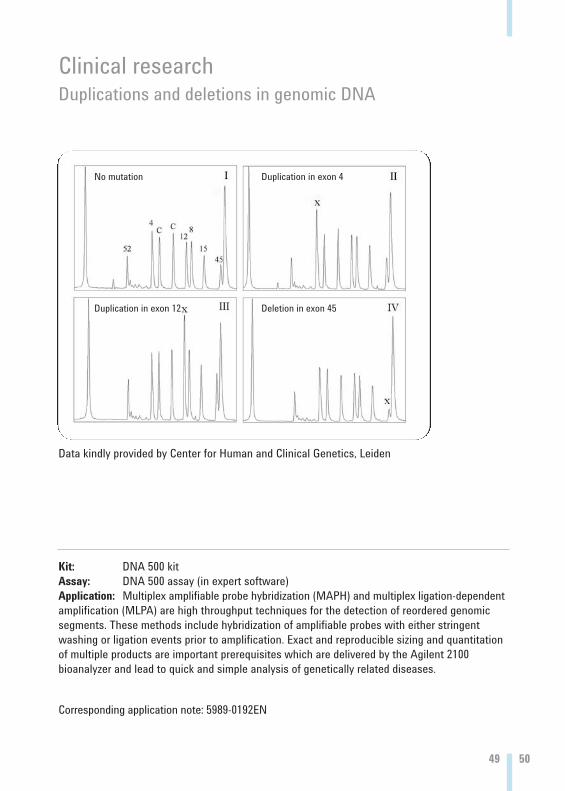
Clinical researchDuplications and deletions in genomic DNA
Data kindly provided by Center for Human and Clinical Genetics, Leiden
Kit: DNA 500 kitAssay: DNA 500 assay (in expert software)Application: Multiplex amplifiable probe hybridization (MAPH) and multiplex ligation-dependentamplification (MLPA) are high throughput techniques for the detection of reordered genomic segments. These methods include hybridization of amplifiable probes with either stringent washing or ligation events prior to amplification. Exact and reproducible sizing and quantitationof multiple products are important prerequisites which are delivered by the Agilent 2100 bioanalyzer and lead to quick and simple analysis of genetically related diseases.
Corresponding application note: 5989-0192EN
No mutation Duplication in exon 4
Duplication in exon 12 Deletion in exon 45
49 50
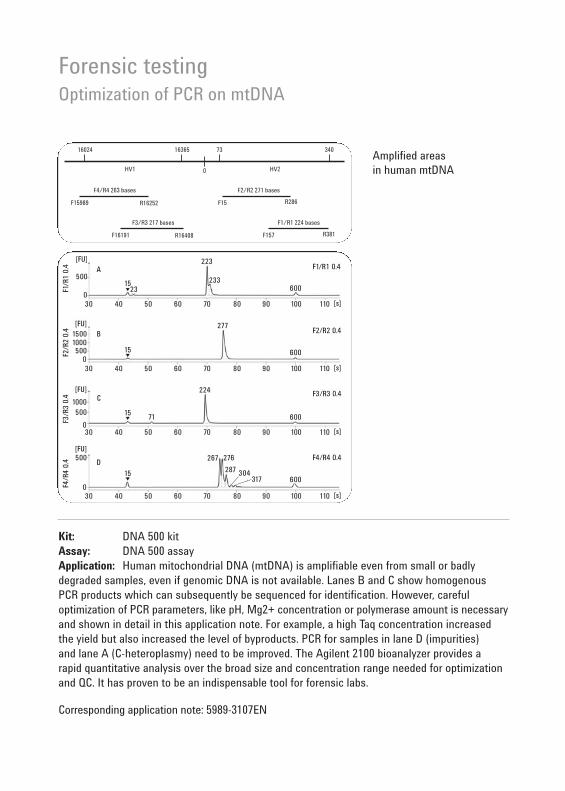
Forensic testingOptimization of PCR on mtDNA
Amplified areas in human mtDNA
Kit: DNA 500 kitAssay: DNA 500 assayApplication: Human mitochondrial DNA (mtDNA) is amplifiable even from small or badly degraded samples, even if genomic DNA is not available. Lanes B and C show homogenousPCR products which can subsequently be sequenced for identification. However, careful optimization of PCR parameters, like pH, Mg2+ concentration or polymerase amount is necessaryand shown in detail in this application note. For example, a high Taq concentration increasedthe yield but also increased the level of byproducts. PCR for samples in lane D (impurities) and lane A (C-heteroplasmy) need to be improved. The Agilent 2100 bioanalyzer provides a rapid quantitative analysis over the broad size and concentration range needed for optimization and QC. It has proven to be an indispensable tool for forensic labs.
Corresponding application note: 5989-3107EN

Forensic testingPitfalls in mtDNA sequencing
Kit: DNA 500 kitAssay: DNA 500 assayApplication: Analysis of the non-coding sequence of human mitochondrial DNA (mtDNA) isperformed for the purpose of identification in forensics. PCR amplification of limited or degradedmtDNA is done prior to sequencing. Quantitation and quality control of these PCR products (10-100 ng/ml, homogenous fragment in the range of 200-500 bp) was performed. Difficult PCRtemplates may cause G-stutters or other unintended byproducts of higher or lower mass (left).This may lead to indistinct sequence readings (right). Therefore, e.g. FBI guidelines enforce a 10% impurity level at the most. Fulfillment of this prerequisite can be satisfactorily verifiedwith the Agilent 2100 bioanalyzer.
Corresponding application note: 5989-0985EN
51 52
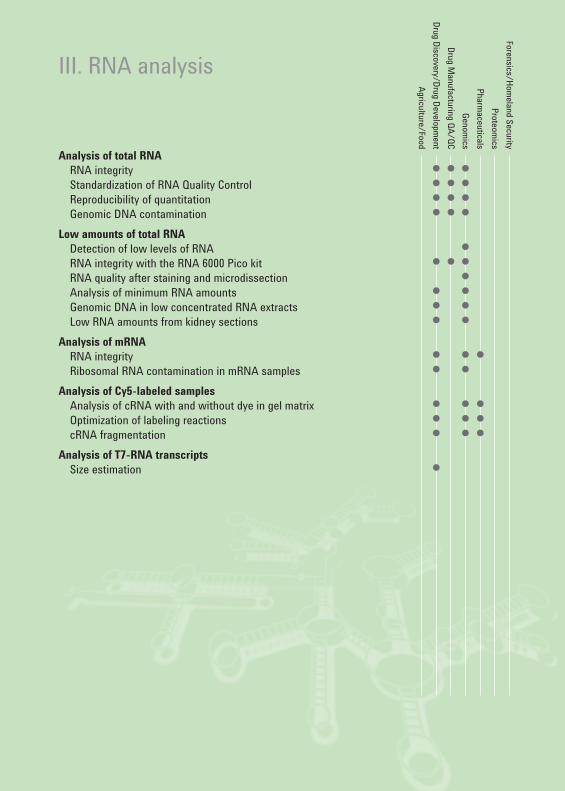
III. RNA analysisForensics/H
omeland Security
Proteomics
Pharmaceuticals
Genom
ics
Drug M
anufacturing QA
/QC
Drug D
iscovery/Drug D
evelopment
Agriculture/Food
Analysis of total RNARNA integrity ● ● ●
Standardization of RNA Quality Control ● ● ●
Reproducibility of quantitation ● ● ●
Genomic DNA contamination ● ● ●
Low amounts of total RNADetection of low levels of RNA ●
RNA integrity with the RNA 6000 Pico kit ● ● ●
RNA quality after staining and microdissection ●
Analysis of minimum RNA amounts ● ●
Genomic DNA in low concentrated RNA extracts ● ●
Low RNA amounts from kidney sections ● ●
Analysis of mRNARNA integrity ● ● ●
Ribosomal RNA contamination in mRNA samples ● ●
Analysis of Cy5-labeled samplesAnalysis of cRNA with and without dye in gel matrix ● ● ●
Optimization of labeling reactions ● ● ●
cRNA fragmentation ● ● ●
Analysis of T7-RNA transcriptsSize estimation ●

53 54
B
A
Analysis of total RNARNA integrity
High quality total RNA
Partially degraded products
Agilent 2100 bioanalyzer: electropherogram Agilent 2100 bioanalyzer: single lane gel-like image
Kit: RNA 6000 Nano kitAssay: Eukaryote total RNA Nano assayApplication: Analysis of total RNA integrity - a typical first QC step during cDNA or cRNA sampleprep for microarrays. In Figure A the upper electropherogram and gel-like image show the analysisof high quality total RNA with the 18S and 28S subunit as two distinct bands. Figure B shows theanalysis of a partially degraded total RNA sample. Many degradation products appear between thetwo ribosomal bands and below the 18S band. With the help of the Agilent 2100 bioanalyzer andthe RNA 6000 Nano kit the important sample QC step prior to an expensive microarray experimentcan be easily and quickly achieved.
Corresponding application note: 5968-7493EN
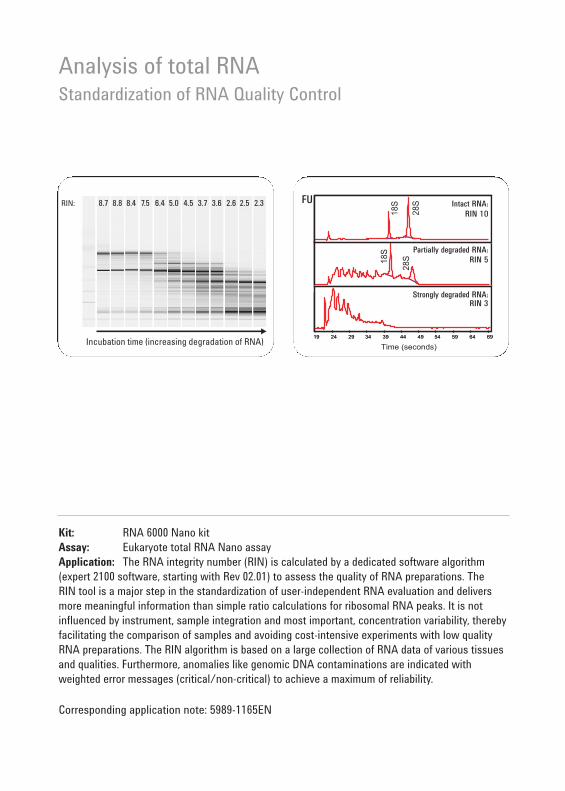
Analysis of total RNAStandardization of RNA Quality Control
Kit: RNA 6000 Nano kitAssay: Eukaryote total RNA Nano assayApplication: The RNA integrity number (RIN) is calculated by a dedicated software algorithm(expert 2100 software, starting with Rev 02.01) to assess the quality of RNA preparations. The RIN tool is a major step in the standardization of user-independent RNA evaluation and deliversmore meaningful information than simple ratio calculations for ribosomal RNA peaks. It is notinfluenced by instrument, sample integration and most important, concentration variability, therebyfacilitating the comparison of samples and avoiding cost-intensive experiments with low qualityRNA preparations. The RIN algorithm is based on a large collection of RNA data of various tissuesand qualities. Furthermore, anomalies like genomic DNA contaminations are indicated withweighted error messages (critical/non-critical) to achieve a maximum of reliability.
Corresponding application note: 5989-1165EN

55 56
Analysis of total RNAReproducibility of quantitation
Reproducibility for 12 consecutive runs
Kit: RNA 6000 Nano kitAssay: Eukaryote total RNA Nano assayApplication: Alongside the quality control of RNA samples, measurement of RNA concentration is important for (bio-)chemical reactions, such as labeling reactions in the context of microarray experiments. With the RNA 6000 Nano kit good reproducibility can be achieved (here 6% CV), which is little affected by sample contaminants, such as phenol.
Corresponding application note: 5988-7650 EN

Analysis of total RNAGenomic DNA contamination
Kit: RNA 6000 Nano kitAssay: Eukaryote total RNA Nano assay Application: Gel representation of a chip run with total RNA samples (mouse brain) spikedwith varying amounts of herring sperm genomic DNA before and after treatment with RNase.The left panel shows the intact RNA with broad bands in the low MW region stemming fromthe genomic DNA. After the RNase digest (right panel) only the DNA bands remain, ranging in intensity according to the amount of DNA spiked into the sample.
Corresponding application note: data not published

Low amounts of total RNADetection of low levels of RNA
Kit: RNA 6000 Pico kitAssay: Eukaryote total RNA Pico assay Application: The RNA 6000 Pico kit is complementary to the RNA 6000 Nano kit and is suitablefor all applications where the amount of RNA (or cDNA) is limited, e.g. for biopsy samples,samples from microdissection experiments, QC of cDNA made from total RNA, microarray samples, etc. Here Agilent 2100 bioanalyzer results obtained from mouse brain RNA (Ambion) at 200 and 1000 pg/ìl are shown. By analysis in repetitions the reproducibility of quality controlis demonstrated. Detection of 200 pg total RNA could be achieved without problems.
Analysis of mouse brain RNA at two different concentrations
Corresponding application note: data not published
57 58

A
B
Low amounts of total RNARNA integrity with the RNA 6000 Pico kit
Kit: RNA 6000 Pico kitAssay: Eukaryote total RNA Pico assay Application: Detection of RNA degradation with the RNA 6000 Pico kit. Sample: mouse livertotal RNA (Ambion) concentration: 1 ng. Degradation was accomplished by adding a lowamount of RNase. In Figure A the upper electropherogram and gel-like image show the analysisof high quality total RNA with the 18S and 28S subunit as two distinct bands. Figure A showsthe analysis of a partially degraded total RNA sample. Many degradation products appear between the two ribosomal bands and below the 18S band.
Intact RNA
Degraded RNA
Corresponding application note: data not published

59 60
Low amounts of total RNARNA quality after staining and microdissection
Kit: RNA 6000 Pico kitAssay: Eukaryote Total RNA Pico assayApplication: RNA derived from laser-microdissected tissue isolated by the PALM®MicroBeamsystem was shown to be of high quality by convenient analysis with the RNA 6000 Pico assay.RNA-purification kits from different manufacturers and various common staining procedureshave been tested and yielded 130-700pg/µl RNA from 1000 cells with different quality (seeabove). The RNA 6000 Pico kit was well suited to show differences in RNA quality and yieldand, therefore, is an ideal tool to optimize and adapt experimental conditions to individual tissue. The experiments were accompanied by a more laborious real time PCR that revealedsimilar results. Due to its unprecedented sensitivity, the RNA 6000 Pico assay is an indispensabletool for quality control in the context of microdissection experiments, ensuring successful geneexpression profiling experiments.
Corresponding application note: 5988-9128EN
Check and optimize RNA quality and yield
Laser micro dissection

A B
Low amounts of total RNAAnalysis of minimum RNA amounts
Kit: RNA 6000 Pico kitAssay: Eukaryote Total RNA Pico assayApplication: The challenge of analysis of minimal amounts of RNA from e.g. laser micro dissections calls for detailed knowledge of extraction conditions. Some commonly used RNAisolation kits and buffer components were assessed in detail. The majority of the kits had no negative effect on the performance of the analysis, whereas, some kits include buffers which lead to shifted, missing and diminished RNA-peaks. In figure A, RNA isolated after microdissection shows lack of the 28S-peak due to high salt concentration introduced duringthe isolation process. In figure B, a standard RNA was diluted in water and subsequently extracted with a commercially available RNA extraction kit. The original samples (red) and the eluates after extraction are shown. These data show the importance of evaluating the individual method used for RNA extraction to exclude misleading conclusions.
Corresponding application note: 5989-0712EN

61 62
A
B
Low amounts of total RNAGenomic DNA in low concentrated RNA extracts
Kit: RNA 6000 Pico kitAssay: Eukaryote Total RNA Pico assayApplication: Laser capture microdissection enables collection of cells from small tissue areas.A low RNA yield is in the nature of the extraction method from such a specimen that usuallycomplicates quality assessment – a fact that can be circumvented by taking advantage of the Agilent 2100 bioanalyzer capabilities. A comparative study using mouse kidney cryosections showed that on-column DNase digestion is indispensable to obtain a reasonableresult for integrity and yield (figure A). Experiments with omitted on-column DNA digestion confirmed that the peak visible in the inter-region consists of genomic DNA which caused overestimation of extracted RNA amounts (figure B).
Corresponding application note: 5989-0991EN
Concentration ≅ 0.14 ng/µl
Concentration ≅ 0.5 ng/µl
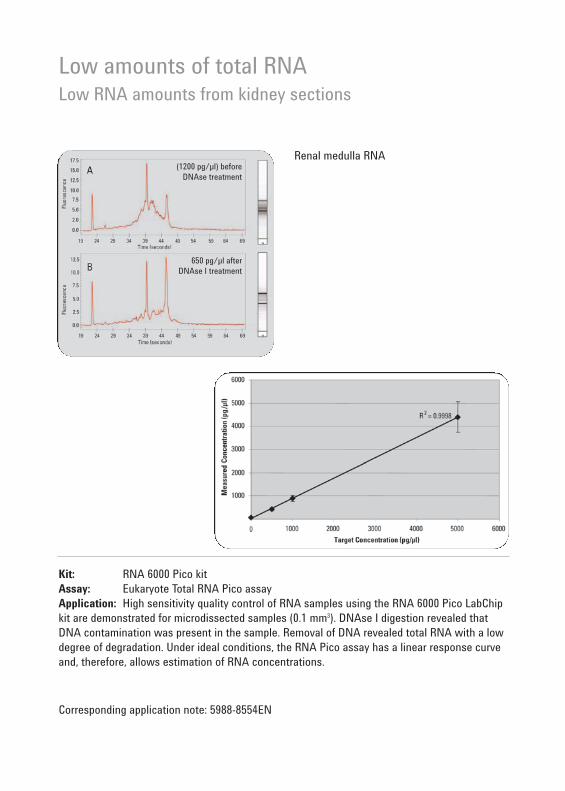
Low amounts of total RNALow RNA amounts from kidney sections
Kit: RNA 6000 Pico kitAssay: Eukaryote Total RNA Pico assayApplication: High sensitivity quality control of RNA samples using the RNA 6000 Pico LabChipkit are demonstrated for microdissected samples (0.1 mm3). DNAse I digestion revealed thatDNA contamination was present in the sample. Removal of DNA revealed total RNA with a lowdegree of degradation. Under ideal conditions, the RNA Pico assay has a linear response curveand, therefore, allows estimation of RNA concentrations.
Corresponding application note: 5988-8554EN
Renal medulla RNA (1200 pg/µl) before
DNAse treatment
650 pg/µl after DNAse I treatment
63 64
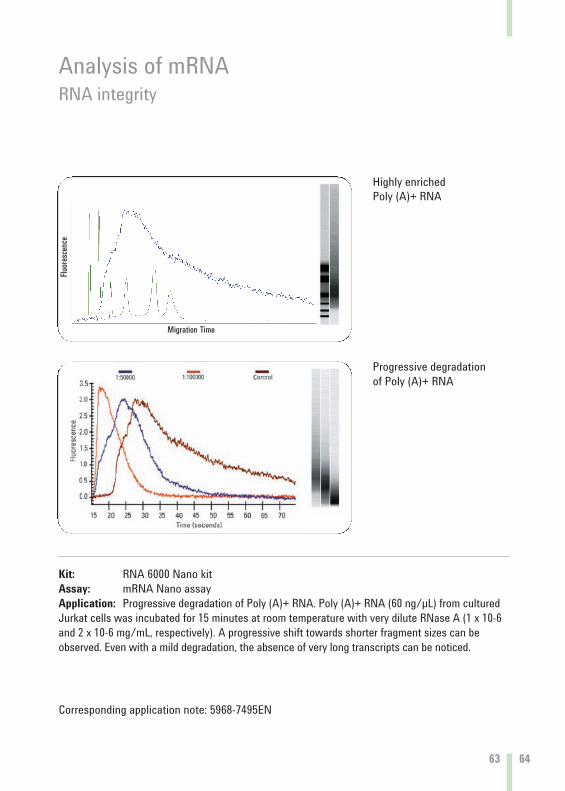
Analysis of mRNARNA integrity
Progressive degradation of Poly (A)+ RNA
Highly enriched Poly (A)+ RNA
Kit: RNA 6000 Nano kitAssay: mRNA Nano assayApplication: Progressive degradation of Poly (A)+ RNA. Poly (A)+ RNA (60 ng/µL) from culturedJurkat cells was incubated for 15 minutes at room temperature with very dilute RNase A (1 x 10⁻⁶and 2 x 10⁻⁶ mg/mL, respectively). A progressive shift towards shorter fragment sizes can beobserved. Even with a mild degradation, the absence of very long transcripts can be noticed.
Corresponding application note: 5968-7495EN
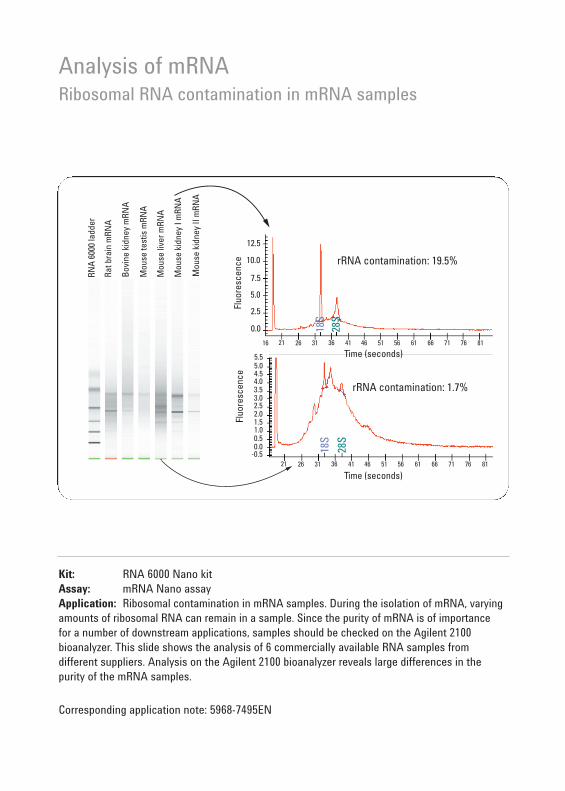
Analysis of mRNARibosomal RNA contamination in mRNA samples
Kit: RNA 6000 Nano kitAssay: mRNA Nano assayApplication: Ribosomal contamination in mRNA samples. During the isolation of mRNA, varyingamounts of ribosomal RNA can remain in a sample. Since the purity of mRNA is of importance for a number of downstream applications, samples should be checked on the Agilent 2100 bioanalyzer. This slide shows the analysis of 6 commercially available RNA samples from different suppliers. Analysis on the Agilent 2100 bioanalyzer reveals large differences in the purity of the mRNA samples.
Corresponding application note: 5968-7495EN

65 66
Analysis of Cy5 labeled samplesAnalysis of cRNA with and without dye in gel matrix
Kit: RNA 6000 Nano kitAssay: mRNA Nano and Cy5 labeled nucleic acids Nano assay Application: Analysis of Cy5 labeled and non-labeled cRNA samples. Cy5-labeled samples showthe combined signals of the fluorescent label and the RNA signal created by the fluorescenceof the RNA 6000 dye. If the RNA 6000 dye is omitted from the gel matrix, only the signal created by Cy5 is detected, allowing the determination of dye incorporation after a labeling reaction. Please note that for Cy3 labeled samples the intactness of the sample can be verified, but the dye incorporation can not be checked.
Assay conditions:- Cy5 labeled nucleic acids- no intercalating dye used- 5nM Cy5 dCTP added to gel
matrix and sample buffer for focusing
Lanes:1. Unlabeled cRNA2. Cy5 labeled cRNA3. Cy5 labeled cRNA
Assay conditions:as above, but intercalatingdye included in gel matrix
Lanes:1. RNA transcript ladder2. Unlabeled cRNA3. Cy5 labeled cRNA4. Cy5 labeled cRNA
Corresponding application note: 5980-0321EN

Analysis of Cy5 labeled samplesOptimization of labeling reactions
Kit: RNA 6000 Nano kitAssay: Cy5 Labeled Nucleic Acids Nano assay Application: An experiment was designed to check the influence of Cy5 dCTP concentration on labeling efficiency. Lane 2 represents the negative control (primer ommitted from the reactionmixture), while lane 3 shows the analysis of a reaction with a 6-fold increased Cy5 dCTP concentration. A look at the electropherograms reveals that the high Cy5 dCTP concentrationnot only gave a high peak of unincorporated Cy5, but also the labeling efficiency for longer fragments was very low. This approach allows the optimization of labeling reactions.
Corresponding application note: 5980-0321EN
67 68
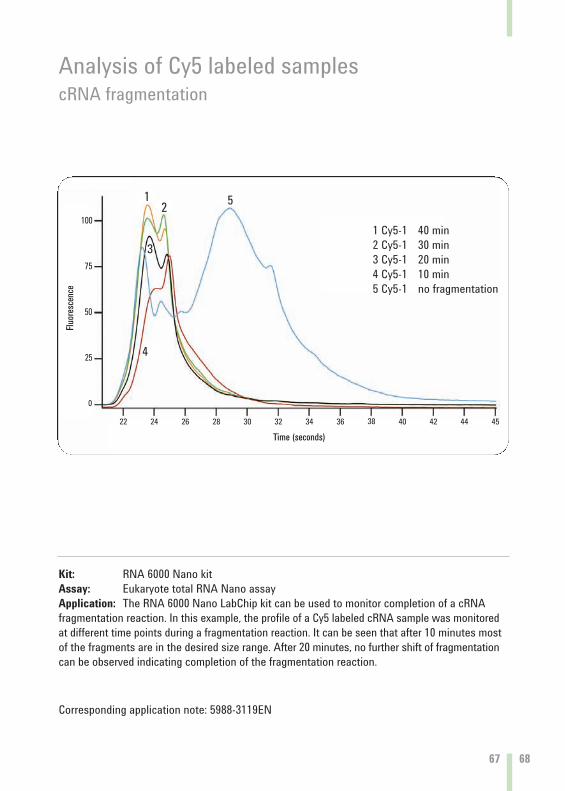
Analysis of Cy5 labeled samplescRNA fragmentation
Kit: RNA 6000 Nano kitAssay: Eukaryote total RNA Nano assay Application: The RNA 6000 Nano LabChip kit can be used to monitor completion of a cRNAfragmentation reaction. In this example, the profile of a Cy5 labeled cRNA sample was monitored at different time points during a fragmentation reaction. It can be seen that after 10 minutes mostof the fragments are in the desired size range. After 20 minutes, no further shift of fragmentationcan be observed indicating completion of the fragmentation reaction.
1 Cy5-1 40 min2 Cy5-1 30 min3 Cy5-1 20 min4 Cy5-1 10 min5 Cy5-1 no fragmentation
Corresponding application note: 5988-3119EN
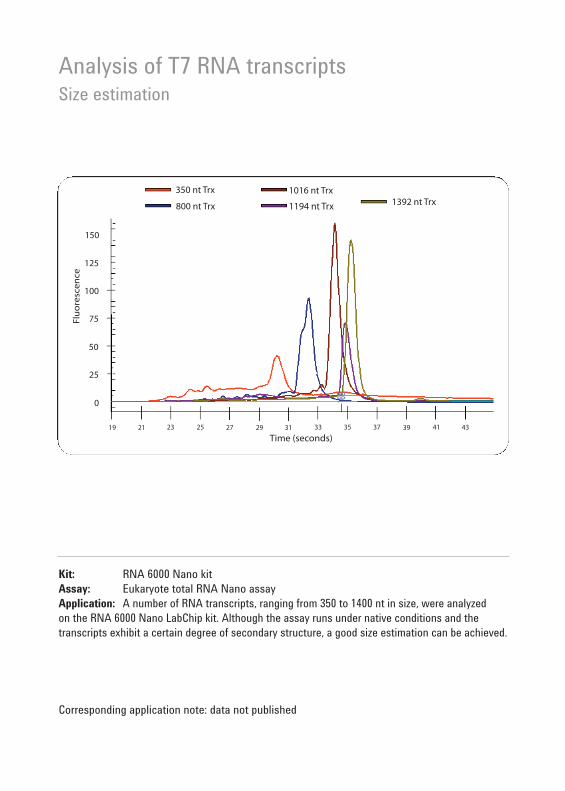
Analysis of T7 RNA transcriptsSize estimation
Kit: RNA 6000 Nano kitAssay: Eukaryote total RNA Nano assay Application: A number of RNA transcripts, ranging from 350 to 1400 nt in size, were analyzed on the RNA 6000 Nano LabChip kit. Although the assay runs under native conditions and the transcripts exhibit a certain degree of secondary structure, a good size estimation can be achieved.
Corresponding application note: data not published
IV. Protein analysis
69 70
Forensics/Hom
eland Security
Proteomics
Pharmaceuticals
Genom
ics
Drug M
anufacturing QA
/QC
Drug D
iscovery/Drug D
evelopment
Agriculture/Food
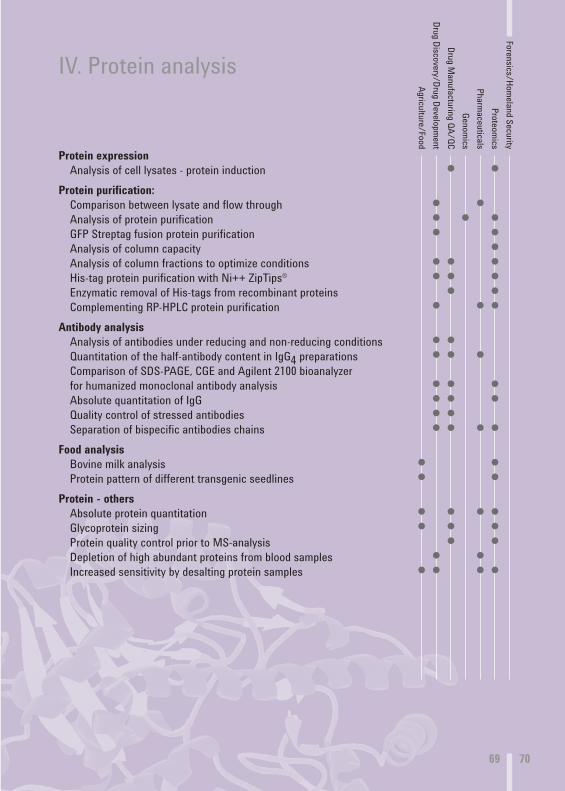
Protein expressionAnalysis of cell lysates - protein induction ● ●
Protein purification:Comparison between lysate and flow through ● ●
Analysis of protein purification ● ● ●
GFP Streptag fusion protein purification ● ●
Analysis of column capacity ●
Analysis of column fractions to optimize conditions ● ● ●
His-tag protein purification with Ni++ ZipTips® ● ● ●
Enzymatic removal of His-tags from recombinant proteins ● ●
Complementing RP-HPLC protein purification ● ● ●
Antibody analysisAnalysis of antibodies under reducing and non-reducing conditions ● ●
Quantitation of the half-antibody content in IgG4 preparations ● ● ●
Comparison of SDS-PAGE, CGE and Agilent 2100 bioanalyzer for humanized monoclonal antibody analysis ● ● ●
Absolute quantitation of IgG ● ● ●
Quality control of stressed antibodies ● ●
Separation of bispecific antibodies chains ● ● ● ●
Food analysisBovine milk analysis ● ●
Protein pattern of different transgenic seedlines ● ●
Protein - othersAbsolute protein quantitation ● ● ● ●
Glycoprotein sizing ● ● ●
Protein quality control prior to MS-analysis ● ●
Depletion of high abundant proteins from blood samples ● ●
Increased sensitivity by desalting protein samples ● ● ● ●

Protein expressionAnalysis of cell lysates - protein induction
Kit: Protein 200 Plus kitAssay: Protein 200 Plus assayApplication: Two cell lysates, induced and non-induced were compared to verify the induction of protein expression. The overlay feature of the bioanalyzer software allows quick sample comparison. The blue electropherogram trace shows the cell lysate highly expressing β-galactosidase (128 kDa).
Corresponding application note: data not published
β-Galactosidase

71 72
Protein purificationComparison between lysate and flow through
Kit: Protein 200 Plus kitAssay: Protein 200 Plus assayApplication: Cells were lysed using the Pierce B-Per kit and then loaded onto an affinitycolumn. The protein of interest, a 38 kDa protein, should bind to the column and not show up in the flow through. By overlaying the 2 electropherograms from both samples, the lysate andthe flow through, it is visible that the protein of interest has bound to the column as expected. In addition, a 77 kDa protein has bound to the column, which could be attributed to unspecificbinding or the binding of a dimer.
Corresponding application note: data not published
column flow throughload onto the column
38 kDa
77 kDa

Protein purificationAnalysis of protein purification
Kit: Protein 200 Plus kitAssay: Protein 200 Plus assayApplication: A 18 kDa protein was purified using affinitiy chromatography. The starting materialand the column fraction were analyzed with the protein assay. The protein of interest wasdetermined to be 99% pure and the concentration in the column fraction was 167 ng/µl. The protein assay allows protein purity and concentration to be determined in one step, inaddition it calculates protein size for reconfirmation.
Courtesy of P. Sebastian and S.R. Schmidt GPC-Biotech AG, Martinsried, Germany
Corresponding application note: data not published

73 74
Protein purificationGFP Streptag fusion protein purification
Kit: Protein 200 Plus kitAssay: Protein 200 Plus assayApplication: This example shows the analysis of various steps during the purification workflow of a GFP Streptag fusion protein (28 kDa). The protein was expressed in E.coli andpurified via affinity chromatography with Strep Tactin Poros as the column matrix. The proteinassay allows each purification step from the cell lysis to the elution of the purified protein to be monitored and optimized.
Courtesy of P. Sebastian and S.R. Schmidt GPC-Biotech AG, Martinsried, Germany
Corresponding application note: 5988-5025EN

Protein purificationAnalysis of column capacity
Kit: Protein 200 Plus kitAssay: Protein 200 Plus assayApplication: The binding of a recombinant antibody Fab fragment to a Sepharose column with immobilized Protein G was analyzed to determine the column capacity and prevent column overloading. The protein assay allows this purification step to be monitored and quickly optimized.
Corresponding application note: 5988-4022EN
column load conc.:150 µg/ml
flow through conc.:60 µg/ml

75 76
Corresponding application note: data not published
Protein purificationAnalysis of column fractions to optimize conditions
Kit: Protein 200 Plus kitAssay: Protein 200 Plus assayApplication: Different column conditions were tested to optimize the purification conditions for a 30 kDa protein. The column fractions were analyzed for protein purity and concentration to identify the optimal conditions providing a highly purified protein in a good yield. Using theprotein assay it was possible to determine the optimum purification conditions in a short timeframe.
Courtesy of P. Sebastian and S.R. Schmidt GPC-Biotech AG, Martinsried, Germany
column 1-eluate33 ng/µl
column 2-eluate44 ng/µl
column 2-eluatenot detected

Protein purificationHis-tag protein purification using Ni++ZipTips®
Kit: Protein 200 Plus kitAssay: Protein 200 Plus assayApplication: ZipTips loaded with a Ni2+-resin (in development by Millipore) were used to purify a His-tagged protein expressed in E.coli. Both the cell lysate and the purified protein were analyzed with the Agilent 2100 bioanalyzer to demonstrate the performance of the tips. The purification with the tips takes approximately 5 minutes, usually followed by the analysis of the samples with SDS-PAGE analysis which takes a further 2 hours. The SDS-PAGE analysiswas substituted by the much faster Protein 200 Plus assay run on the Agilent 2100 bioanalyzer.
E.coli cell lysate
purified protein, 25 kDaeluted with acetic acid
Corresponding application note: data not published

77 78
Protein purificationEnzymatic removal of His-tags from recombinant proteins
Poster presented at ABRF Conference, March 2002 byF. Schäfer, K. Steinert, C. Feckler, J.Drees, and J.Ribbe, QIAGEN GmbH, Hilden, Germany
Kit: Protein 200 Plus kitAssay: Protein 200 Plus assayApplication: For some applications, it might be necessary to remove the His-tag after the proteinpurification because of its effects on enzymatic activity or protein structure. Here the TAGZymesystem (Qiagen) was used to remove the N-terminal His-tag from two different proteins, a GFPvariant and a recombinant Interleukin 1β. Samples were taken at different time points to study the kinetics of the enzymatic cleavage. The dipeptide cleavage can be detected by a size shift on the gel-like images and the electropherograms. The fast analysis with the bioanalyzer allowsmultiple kinetic studies to done in one day instead of waiting until the next day for the results from SDS-PAGE analysis.
Corresponding application note: 5988-8144 EN

Protein purificationComplementing RP-HPLC protein purification
Kit: Protein 200 Plus kitAssay: Protein 200 Plus assayApplication: Protein purification and characterization was carried out facilitating an Agilent 1100 Series purification system for reverse phase HPLC assisted by the Agilent 2100 bioanalyzer. The final polishing of a 56 kDa protein by RP HPLC from a pre-purifiedsample (starting material, right: red electropherogram and gel) and the analysis of three HPLC-fractions containing the major components are shown (fractions 1-3). No impurity is visible by RP HPLC reanalysis (left chromatogram, fraction 2) of the fraction containing the target protein.However, because the Agilent 2100 bioanalyzer is an orthogonal technique compared to reversephase HPLC a 20 kDa protein could be found as an impurity (see insert). The reverse phase HPLCpurification leads to a purity of only 76% for the protein of interest and the Agilent 2100 bioanalyzer reveals the necessity of further purification.
Corresponding application note: 5988-8630EN

79 80
Antibody analysisAnalysis of antibodies under reducing andnon-reducing conditions
Kit: Protein 200 Plus kitAssay: Protein 200 Plus assayApplication: The protein kit allows analysis of both reduced and non-reduced antibodies on the same chip. This is not possible using SDS-PAGE, as the reducing agent will diffuse within the gel and will also reduce other samples. Under non-reducing conditions, it is expected to detect the intact antibody around 160 kDa. Here the single light and heavy chainsand half-antibodies are also visible. Under reducing conditions this is all completely reverted to single light and heavy chains, due to the reduction of the disulfide bonds.
Corresponding application note: data not published

Antibody analysisQuantitation of the half-antibody content in IgG4 preparations
Kit: Protein 200 Plus kitAssay: Protein 200 Plus assayApplication: In the given host cell line for antibody production usually up to 30% of IgG4 is secreted as half molecule (half antibody). The half-molecule has only a single disulfide bond between the heavy and light chains, the inter-heavy chain disulfide bonds are absent. The proteinassay allows the half-antibody content in IgG4 preparations to be determined automatically. In addition, the sizing provided by the Agilent 2100 bioanalyzer compares very well to the theoreticalsize and is superior to SDS-PAGE in terms of accuracy and reproducibility.
Poster presented at WCBP Conference, January 27-30, 2002 by E. Vasilyeva, H. Fajardo, P. Bove,F. Brown and M. Kretschmer. BIOGEN, Cambridge, MA , USA
Corresponding application note: data not published

81 82
Antibody analysisComparison of SDS-PAGE, CGE and Agilent 2100 bioanalyzer for humanized monoclonal antibody analysis
Kit: Protein 200 Plus kitAssay: Protein 200 Plus assayApplication: The analysis of a humanized monoclonal antibody under reducing condition was compared using 3 different techniques, the Agilent 2100 bioanalyzer, 4-20% SDS-PAGE, stained with Coomassie, and capillary gel electrophoresis. All 3 techniques result in a similar separation pattern showing the light and the heavy chain of the antibody. In addition, the determined sizes of the light and heavy chain were comparable for all 3 techniques and compared well to the molecular weights determined by MALDI-TOF (light chain: 23762 Da,heavy chain: 51003 Da). However, the Agilent 2100 bioanalyzer provides significant time savingcompared to the other techniques.
Poster presented at WCBP Conference, January 2002 byS.H. Bowen, M. Chan, P. McGeehan, J. Smith, L. Inderdass, R. Strouse, M. Schenerman MedImmune Inc., Gaithersburg, MD, USA
Corresponding application note: data not published
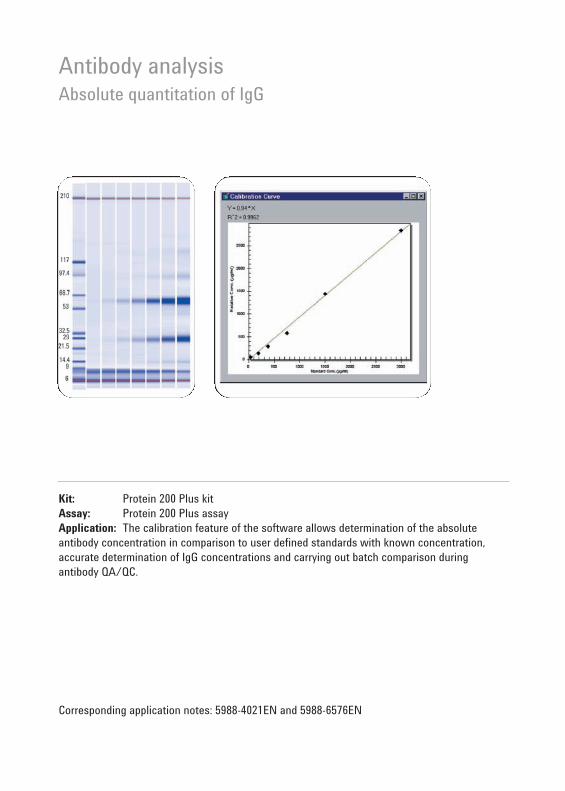
Antibody analysisAbsolute quantitation of IgG
Kit: Protein 200 Plus kitAssay: Protein 200 Plus assayApplication: The calibration feature of the software allows determination of the absolute antibody concentration in comparison to user defined standards with known concentration,accurate determination of IgG concentrations and carrying out batch comparison duringantibody QA/QC.
Corresponding application notes: 5988-4021EN and 5988-6576EN

83 84
Antibody analysisQuality control of stressed antibodies
Kit: Protein 200 Plus kitAssay: Protein 200 Plus assayApplication: A quality control step in pharmaceutical QA/QC departments is to trigger typicaldegradation and aggregation patterns for a specific antibody. The given samples from heatstress stability studies show expected protein byproducts after aging at elevated temperatures.The content of heavy and light chain, representing the intact antibody, is reduced by 5% or 13%within 1 month or respectively 12 weeks. Excellent reproducibility in the range from 0.6 to 1.7% CV for this quantification was achieved in a validation study with three differentusers and two bioanalyzer instruments over several days.
Corresponding application note: 5988-9648EN
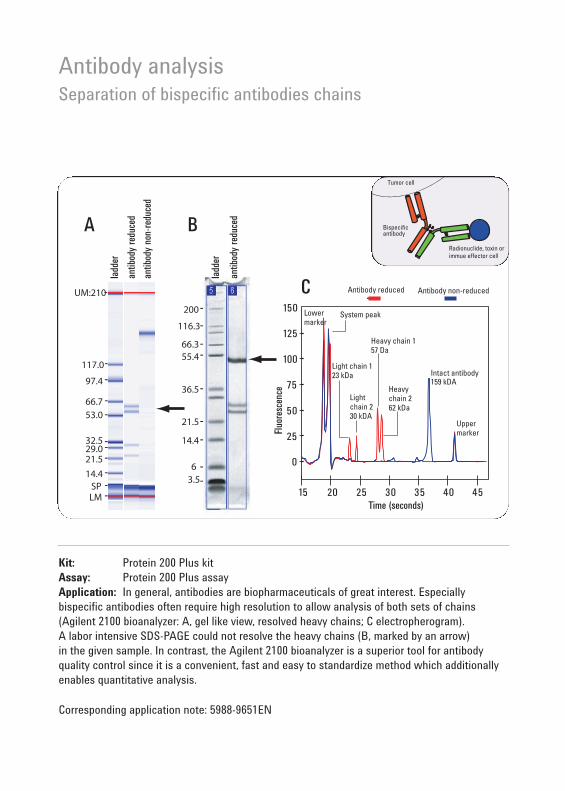
Antibody analysisSeparation of bispecific antibodies chains
Kit: Protein 200 Plus kitAssay: Protein 200 Plus assayApplication: In general, antibodies are biopharmaceuticals of great interest. Especially bispecific antibodies often require high resolution to allow analysis of both sets of chains(Agilent 2100 bioanalyzer: A, gel like view, resolved heavy chains; C electropherogram). A labor intensive SDS-PAGE could not resolve the heavy chains (B, marked by an arrow) in the given sample. In contrast, the Agilent 2100 bioanalyzer is a superior tool for antibody quality control since it is a convenient, fast and easy to standardize method which additionallyenables quantitative analysis.
Corresponding application note: 5988-9651EN
85 86
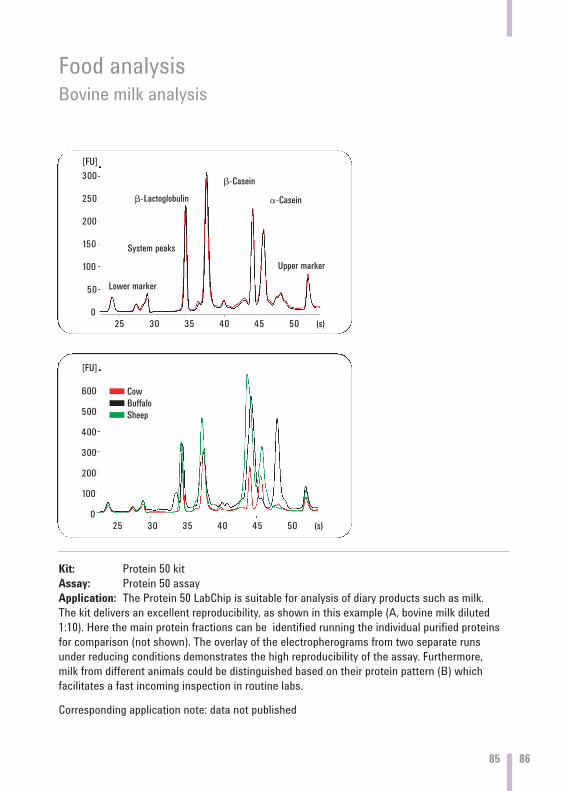
Food analysisBovine milk analysis
Kit: Protein 50 kitAssay: Protein 50 assayApplication: The Protein 50 LabChip is suitable for analysis of diary products such as milk. The kit delivers an excellent reproducibility, as shown in this example (A, bovine milk diluted1:10). Here the main protein fractions can be identified running the individual purified proteinsfor comparison (not shown). The overlay of the electropherograms from two separate runsunder reducing conditions demonstrates the high reproducibility of the assay. Furthermore, milk from different animals could be distinguished based on their protein pattern (B) which facilitates a fast incoming inspection in routine labs.
Corresponding application note: data not published

Food analysisProtein pattern of different transgenic seedlines
Kit: Protein 200 Plus kitAssay: Protein 200 Plus assayApplication: Determination of protein size and concentration with sufficient accuracy and precision allows the highly efficient characterization of transgenic seed lines. Expressed proteinwas available after grinding, extraction of seeds and dilution with buffer. Electropherogramswere evaluated by integration of regions specific for 7S or 11S seed storage proteins. The elevated ratio of 7S/11S for the analyzed unknown line shows significant changes in the expression profile in comparison with the control.
Corresponding application note: 5988-9441EN
SeedLine Extracted protein level 7S/11S Ratioµg/ml
Control 14,000 0.39±0.004(n=5)7S 5,200 3.411S 14,000 0.04Unknows 13,000 0.72±0.1(n=20)

87 88
Protein - othersAbsolute protein quantitation
Kit: Protein 200 Plus kitAssay: Protein 200 Plus assayApplication: A comparative analysis of different techniques used for absolute protein quantitation was performed analyzing 3 different proteins (CA, BSA, OV) in 4 different concentrations (40 - 1250 ug/ml). The same samples were quantitated using the Agilent 2100 bioanalyzer, two commonly used total protein quantitation assays, Lowry andBradford, and SDS-PAGE, stained with Coomassie. The relative standard deviation (CV) and the error compared to the target concentration were determined. A comparison shows thatthe CV and error for the Agilent 2100 bioanalyzer are better than for the SDS-PAGE by a factorof 2. This data demonstrates that the Agilent 2100 bioanalyzer is a viable alternative for proteinquantitation. It allows the quantitation of individual proteins and simultanous determination of protein purity and size.
Corresponding application notes: 5988-4021EN and 5988-6576EN

Protein - othersGlycoprotein sizing
Kit: Protein 200 Plus kitAssay: Protein 200 Plus assayApplication: Due to large carbohydrate moieties glycosylated proteins can differ in amount of incorporated SDS and shape of the protein/SDS-complex from non-glycosyslated proteins. This may lead to different migration times in SDS-PAGE, as well as in the Protein 200 Plus assay run on the Agilent 2100 bioanalyzer. The data compare deglycosylation of a mixture of three proteins (electropherogram on the left) with a commercial N-Glycosidase F Deglycosylation kit.Sizing experiments comparing glycosylated and non glycosylated states for additional proteins are compared and summarized on the right. Such an approach avoids misinterpretation of sizingdue to glycosylation and allows detection of a posttranslational modification of unknown proteins.
0.0
20.0
40.0
60.0
80.0
100.0
Rnase B IgG Light Chain IgG Heavy Chain Ovomucoid Ovalbumin alpha 1-acid
glycoprotein
Transferrin
SDS-PAGE / untreated
SDS-PAGE / deglycol.
Bioanalyser / untreated
Bioanalyser / deglycol.
Calculated / deglycol.
Corresponding application note: 5989-0332EN

89 90
Protein - othersProtein quality control prior to MS-analysis
Kit: Protein 200 Plus kitAssay: Protein 200 Plus assayApplication: By applying soft ionization methods like MALDI or ESI mass spectroscopy (MS),mass information from proteins up to 300kDa can be obtained. However, proper sample preparationis an important precondition. Concentration, purity and assumed size are valuable ex anteinformation usually given by biochemists to MS-analysis services. Two different examples for proteins analyzed by an LC/MS-method (right panel) with good results for sample A and discrepancies for sample B are shown. An analysis of the samples with the Protein 200 Plus assay (left panel) showed an impure protein preparation for sample B. Here, two major peaks at highermasses (66 and 132kDa) potentially caused by aggregates were encountered. The protein of interest (30kDa) yielded high noise background in the MS. A quality check of the sample with the Protein 200 Plus assay, therefore, may avoid an unproductive MS analysis or data evaluation.
Corresponding application note: 5989-0771EN

Protein - othersDepletion of high abundant proteins from blood samples
Kit: Protein 200 Plus kitAssay: Protein 200 Plus assayApplication: Depletion of high abundant proteins in human blood plasma was facilitated by the Agilent Multiple Affinity Removal System. Unprocessed serum, the flow through (i.e. the immunodepleted serum) and the bound proteins after specific elution were analyzed on the Agilent 2100 bioanalyzer. Equivalent amounts were analyzed and resulting electropherograms (left) and gel like images (right) show in comparison the completeness of separation. The Agilent 2100 bioanalyzer, in combination with the Protein 200 Plus LabChip kit,proves to be an excellent method for evaluation of serum processed with albumin removal kits. The system offers a rapid and accurate method to detect proteins both quantitatively and qualitatively.
Corresponding application note: data not published

91 92
Protein - othersIncreased sensitivity by desalting protein samples
Kit: Protein 200 Plus kitAssay: Protein 200 Plus assayApplication: Protein purification steps, such as ion exchange chromatography, often implicatehigh salt concentrations. Nevertheless, quantitation of these samples is effective since the upper marker serves as internal protein standard and is subjected to the same conditions. However,under high salt conditions lower amounts of protein are injected into the microfluidic channels for analysis. Therefore, the sensitivity can be increased by usage of convenient desalting spincolumns. Comparably higher and homogeneous peak intensities are obtained while the recoveryafter such treatment is good.
Corresponding application note: 5989-0228EN
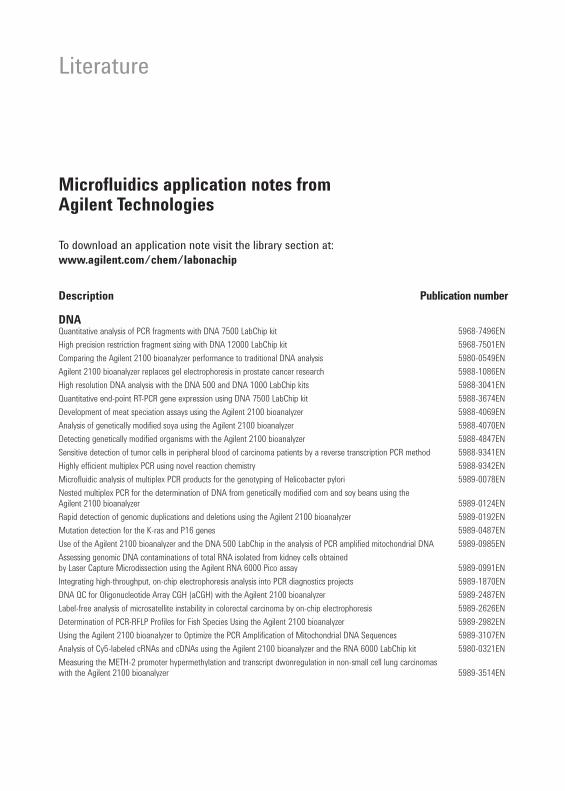
Literature
Microfluidics application notes from Agilent Technologies
To download an application note visit the library section at:www.agilent.com/chem/labonachip
Description Publication number
DNAQuantitative analysis of PCR fragments with DNA 7500 LabChip kit 5968-7496EN
High precision restriction fragment sizing with DNA 12000 LabChip kit 5968-7501EN
Comparing the Agilent 2100 bioanalyzer performance to traditional DNA analysis 5980-0549EN
Agilent 2100 bioanalyzer replaces gel electrophoresis in prostate cancer research 5988-1086EN
High resolution DNA analysis with the DNA 500 and DNA 1000 LabChip kits 5988-3041EN
Quantitative end-point RT-PCR gene expression using DNA 7500 LabChip kit 5988-3674EN
Development of meat speciation assays using the Agilent 2100 bioanalyzer 5988-4069EN
Analysis of genetically modified soya using the Agilent 2100 bioanalyzer 5988-4070EN
Detecting genetically modified organisms with the Agilent 2100 bioanalyzer 5988-4847EN
Sensitive detection of tumor cells in peripheral blood of carcinoma patients by a reverse transcription PCR method 5988-9341EN
Highly efficient multiplex PCR using novel reaction chemistry 5988-9342EN
Microfluidic analysis of multiplex PCR products for the genotyping of Helicobacter pylori 5989-0078EN
Nested multiplex PCR for the determination of DNA from genetically modified corn and soy beans using the Agilent 2100 bioanalyzer 5989-0124EN
Rapid detection of genomic duplications and deletions using the Agilent 2100 bioanalyzer 5989-0192EN
Mutation detection for the K-ras and P16 genes 5989-0487EN
Use of the Agilent 2100 bioanalyzer and the DNA 500 LabChip in the analysis of PCR amplified mitochondrial DNA 5989-0985EN
Assessing genomic DNA contaminations of total RNA isolated from kidney cells obtained by Laser Capture Microdissection using the Agilent RNA 6000 Pico assay 5989-0991EN
Integrating high-throughput, on-chip electrophoresis analysis into PCR diagnostics projects 5989-1870EN
DNA QC for Oligonucleotide Array CGH (aCGH) with the Agilent 2100 bioanalyzer 5989-2487EN
Label-free analysis of microsatellite instability in colorectal carcinoma by on-chip electrophoresis 5989-2626EN
Determination of PCR-RFLP Profiles for Fish Species Using the Agilent 2100 bioanalyzer 5989-2982EN
Using the Agilent 2100 bioanalyzer to Optimize the PCR Amplification of Mitochondrial DNA Sequences 5989-3107EN
Analysis of Cy5-labeled cRNAs and cDNAs using the Agilent 2100 bioanalyzer and the RNA 6000 LabChip kit 5980-0321EN
Measuring the METH-2 promoter hypermethylation and transcript dwonregulation in non-small cell lung carcinomas with the Agilent 2100 bioanalyzer 5989-3514EN
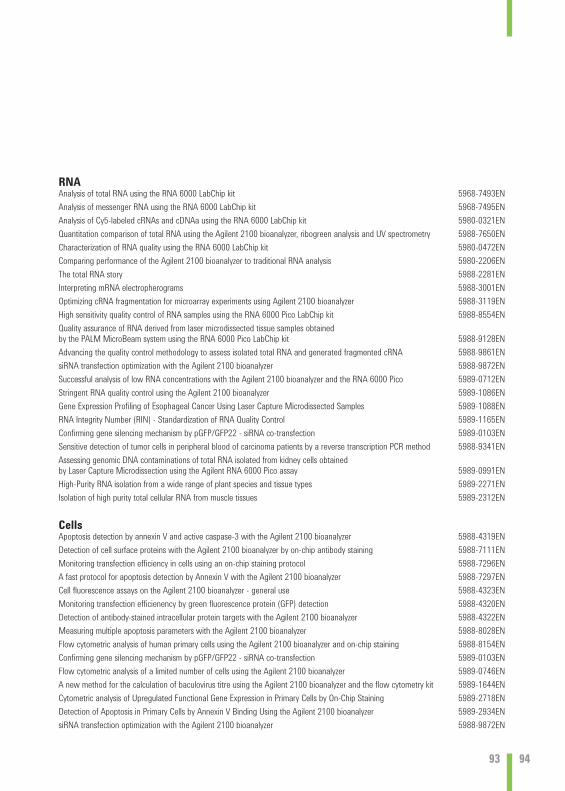
93 94
RNAAnalysis of total RNA using the RNA 6000 LabChip kit 5968-7493EN
Analysis of messenger RNA using the RNA 6000 LabChip kit 5968-7495EN
Analysis of Cy5-labeled cRNAs and cDNAa using the RNA 6000 LabChip kit 5980-0321EN
Quantitation comparison of total RNA using the Agilent 2100 bioanalyzer, ribogreen analysis and UV spectrometry 5988-7650EN
Characterization of RNA quality using the RNA 6000 LabChip kit 5980-0472EN
Comparing performance of the Agilent 2100 bioanalyzer to traditional RNA analysis 5980-2206EN
The total RNA story 5988-2281EN
Interpreting mRNA electropherograms 5988-3001EN
Optimizing cRNA fragmentation for microarray experiments using Agilent 2100 bioanalyzer 5988-3119EN
High sensitivity quality control of RNA samples using the RNA 6000 Pico LabChip kit 5988-8554EN
Quality assurance of RNA derived from laser microdissected tissue samples obtained by the PALM MicroBeam system using the RNA 6000 Pico LabChip kit 5988-9128EN
Advancing the quality control methodology to assess isolated total RNA and generated fragmented cRNA 5988-9861EN
siRNA transfection optimization with the Agilent 2100 bioanalyzer 5988-9872EN
Successful analysis of low RNA concentrations with the Agilent 2100 bioanalyzer and the RNA 6000 Pico 5989-0712EN
Stringent RNA quality control using the Agilent 2100 bioanalyzer 5989-1086EN
Gene Expression Profiling of Esophageal Cancer Using Laser Capture Microdissected Samples 5989-1088EN
RNA Integrity Number (RIN) - Standardization of RNA Quality Control 5989-1165EN
Confirming gene silencing mechanism by pGFP/GFP22 - siRNA co-transfection 5989-0103EN
Sensitive detection of tumor cells in peripheral blood of carcinoma patients by a reverse transcription PCR method 5988-9341EN
Assessing genomic DNA contaminations of total RNA isolated from kidney cells obtained by Laser Capture Microdissection using the Agilent RNA 6000 Pico assay 5989-0991EN
High-Purity RNA isolation from a wide range of plant species and tissue types 5989-2271EN
Isolation of high purity total cellular RNA from muscle tissues 5989-2312EN
CellsApoptosis detection by annexin V and active caspase-3 with the Agilent 2100 bioanalyzer 5988-4319EN
Detection of cell surface proteins with the Agilent 2100 bioanalyzer by on-chip antibody staining 5988-7111EN
Monitoring transfection efficiency in cells using an on-chip staining protocol 5988-7296EN
A fast protocol for apoptosis detection by Annexin V with the Agilent 2100 bioanalyzer 5988-7297EN
Cell fluorescence assays on the Agilent 2100 bioanalyzer - general use 5988-4323EN
Monitoring transfection efficienency by green fluorescence protein (GFP) detection 5988-4320EN
Detection of antibody-stained intracellular protein targets with the Agilent 2100 bioanalyzer 5988-4322EN
Measuring multiple apoptosis parameters with the Agilent 2100 bioanalyzer 5988-8028EN
Flow cytometric analysis of human primary cells using the Agilent 2100 bioanalyzer and on-chip staining 5988-8154EN
Confirming gene silencing mechanism by pGFP/GFP22 - siRNA co-transfection 5989-0103EN
Flow cytometric analysis of a limited number of cells using the Agilent 2100 bioanalyzer 5989-0746EN
A new method for the calculation of baculovirus titre using the Agilent 2100 bioanalyzer and the flow cytometry kit 5989-1644EN
Cytometric analysis of Upregulated Functional Gene Expression in Primary Cells by On-Chip Staining 5989-2718EN
Detection of Apoptosis in Primary Cells by Annexin V Binding Using the Agilent 2100 bioanalyzer 5989-2934EN
siRNA transfection optimization with the Agilent 2100 bioanalyzer 5988-9872EN

ProteinsProtein sizing and analysis using the Protein 200 LabChip kit 5988-0975EN
Differences and similarities between Protein 200 Assay and SDS-PAGE (technical note) 5988-3160EN
Comparison of different protein quantitation methods 5988-6576EN
Using the Agilent 2100 bioanalyzer for analysis of His-tag removal from recombinant proteins 5988-8144EN
Absolute quantitation with the Protein 200 LabChip kit 5988-4021EN
Optimization of protein purification using the Agilent 2100 bioanalyzer 5988-4022EN
Comparison of different methods for purification analysis of a green fluorescent strep-tag fusion protein 5988-5025EN
Fast analysis of proteins between 5-50 kDA using the Agilent 2100 bioanalyzer and Protein 50 assay 5988-8322EN
Using the Agilent 2100 bioanalyzer for analysis of His-tag removal from recombinant proteins 5988-8144EN
Protein purification and characterization using the 1100 Series purification system and the Agilent 2100 bioanalyzer 5988-8630EN
Characterization of Transgenic Soybean Seedlines by Protein Expression with the Agilent 2100 bioanalyzer 5988-9441EN
Quality control of antibodies using the Agilent 2100 bioanalyzer and the Protein 200 Plus assay 5988-9648EN
Analysis of bispecific antibodies using the Agilent 2100 bioanalyzer and the Protein 200 Plus assay 5988-9651EN
Evaluation of albumin removal using the Agilent 2100 bioanalyzer 5988-9911EN
Increased sensitivity by desalting protein samples prior to analysis on the Agilent 2100 bioanalyzer 5989-0228EN
Glycoprotein sizing on the Agilent 2100 bioanalyzer 5989-0332EN
Using the Agilent 2100 bioanalyzer for quality control of protein samples prior to MS-analysis 5989-0771EN
Quality Control for the Agilent 2100 Bioanalyzer Protein 200 Plus LabChip Kits (technical note) 5989-3336EN
Scientific publicationsThe Agilent 2100 bioanalyzer is used in virtually every kind of scientific laboratory. A list of existing scientific publications with more than 2000 citations from well-known and high- impact journals is continuously updated and can be viewed at:http://www.agilent.com/chem/2100publications.

Agilent 2100 bioanalyzerOrdering
Visit our online store at www.agilent.com/chem/store for the Agilent 2100 bioanalyzer products, accessories and services.
InstrumentsAgilent 2100 bioanalyzerAgilent 2100 electrophoresis bioanalyzer Agilent 2100 bioanalyzer desktop systemAgilent 2100 bioanalyzer laptop system
Cell solutionsCell Fluorescence Checkout kitCell Fluorescence LabChip kit
DNA solutionsDNA 500 LabChip kitDNA 1000 LabChip kitDNA 7500 LabChip kitDNA 12000 LabChip kit
RNA solutionsRNA 6000 Nano LabChip kitRNA 6000 Pico LabChip kit
Protein solutionsProtein 200 Plus LabChip kit Protein 50 LabChip kit
SoftwareAgilent 2100 expert software Agilent 2100 bioanalyzer security pack
ServicesDNA/RNA assays operational serviceProtein assays operational serviceCell assays operational serviceCompliance servicesAgilent 2100 bioanalyzer system IQAgilent 2100 bioanalyzer system OQ/PV
Accessories

Notes

97 98
Notes

Find out more:
LabChip® is a registered trademark of Caliper Life Sciences, Inc. in the US and other countries.
Copyright © 2002-2005 Agilent Technologies
All Rights Reserved. Reproduction, adaptation or translationwithout prior written permission is prohibited, except as allowed under the copyright laws.
Printed in Germany, August 1, 2005Publication Number: 5989-3542EN
US/Canada Phone: Toll-free 1 800 227 9770Email: [email protected]
EuropeEmail: [email protected]
JapanPhone: 0120 477 111Email: [email protected]
Other Asia PacificPhone: +81 422 56 9392Email: [email protected]
To download an application note visit:www.agilent.com/chem/labonachip
For online ordering visit our online store: http://www.agilent.com/chem/store
For more information about lab-on-a-chip products visit:www.agilent.com/chem/labonachip
For more information about microarray products visit:www.agilent.com/chem/dna