agile metrics
TRANSCRIPT

Why metrics
What to consider for agile metrics
Various examples
1
1Montag, 22. April 13

Why
2
2Montag, 22. April 13

To guide teams towards hyperproductivity
create reference points for changesfoster empirical approach
fact based and not solely rely on gut feeling
visibility and transparency
How do we really know it‘s working?
3
3Montag, 22. April 13

4
4Montag, 22. April 13
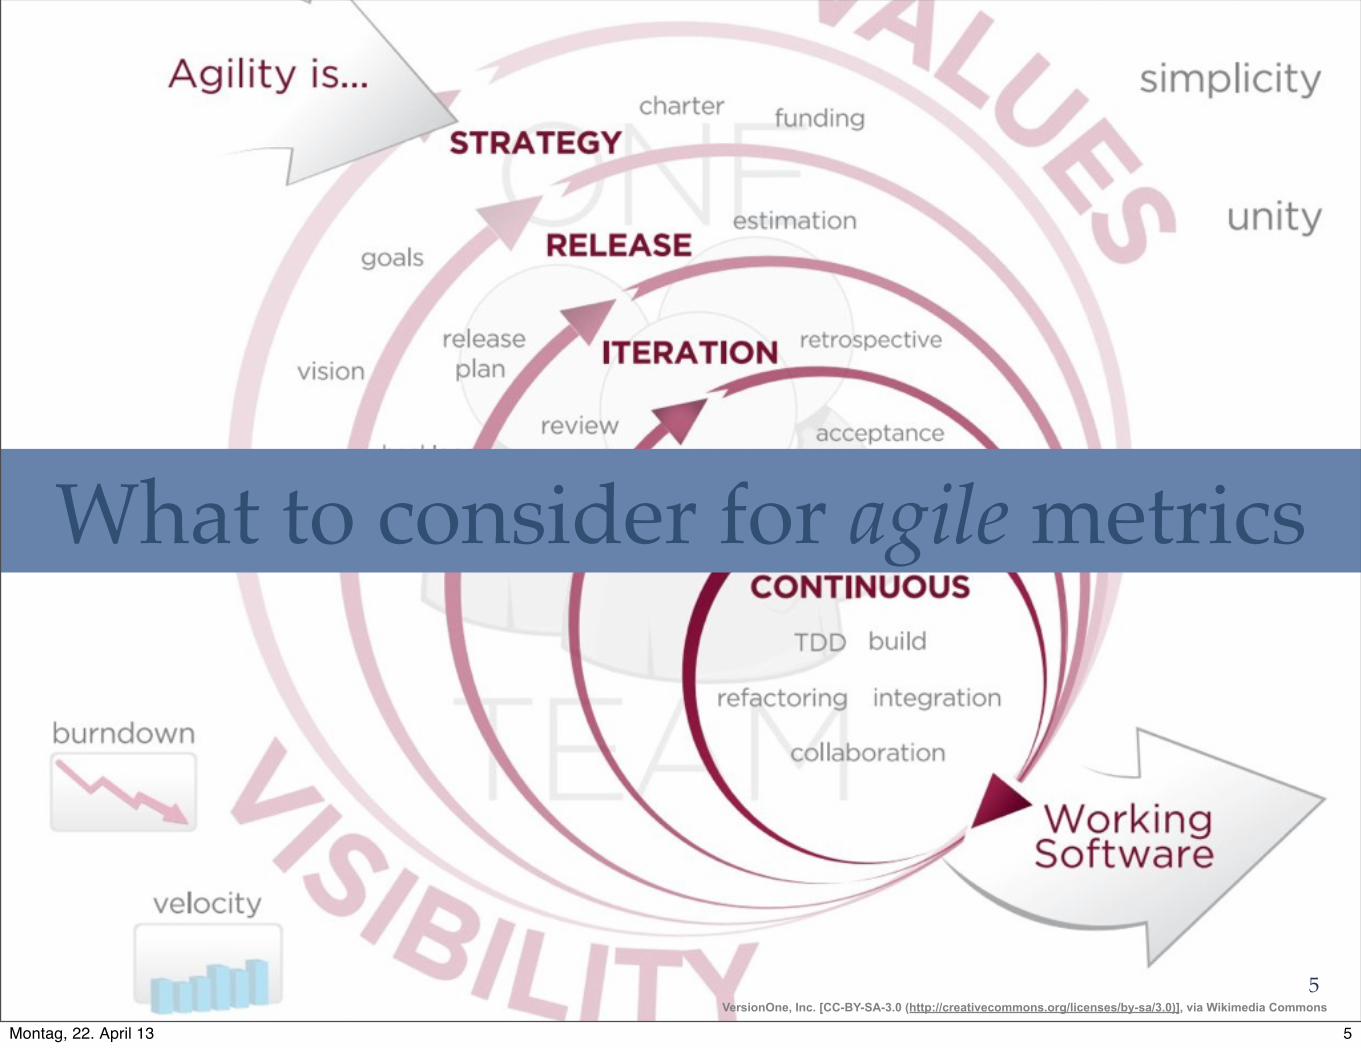
What to consider for agile metrics
VersionOne, Inc. [CC-BY-SA-3.0 (http://creativecommons.org/licenses/by-sa/3.0)], via Wikimedia Commons5
5Montag, 22. April 13

Choose a single economic driver as the key metric
e.g. Profit per customer visit
long term organizational metric set by executive management
Use diagnostics as local measurements to support the goal
set by teams under specific constraints (length, effort to track,...)
e.g. Measurements to improve the „Flow“ of stories
What is my one economical driver?
6
6Montag, 22. April 13

A good agile Metric or Diagnostic ...
7
7Montag, 22. April 13

Affirms and Reinforces Lean and Agile principles
small footprint
short tracking periods
fosters collaboration
8
8Montag, 22. April 13

Follows trends not absolute numbers
Measure aggregated data and not on individual level„a team“
„an iteration“
is it the right direction and are we fast enough
absolute numbers are artificial and can paralyze
why 80% and not 79.5%?
9
9Montag, 22. April 13

Misleading focus on numbers
Methods must be less than 15 lines.
You must not have more than 4 parameters to a method.
Method cyclomatic complexity must not exceed 20.
10
10Montag, 22. April 13

Extended with purpose
We would like our code to be less complex and easier to change.
Therefore we should aim to write short methods (less than 15 lines) with a low cyclomatic complexity (less than 20 is good).
We should also aim to have a small handful of parameters (up to four) so that methods remain as focused as possible.
11
11Montag, 22. April 13
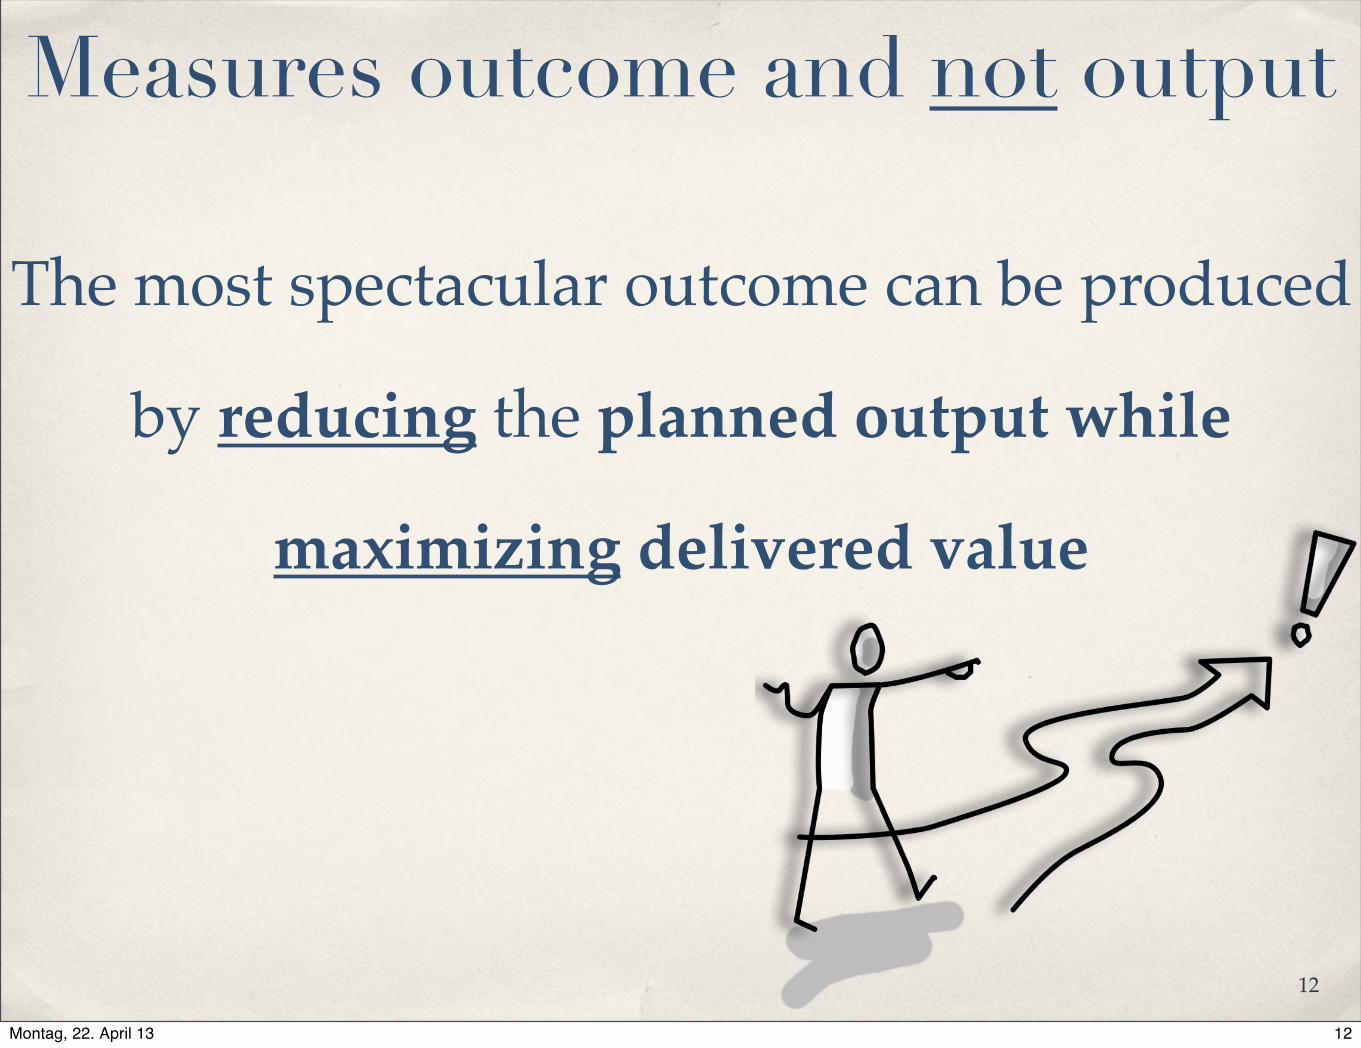
Measures outcome and not output
The most spectacular outcome can be produced
by reducing the planned output while
maximizing delivered value
12
12Montag, 22. April 13

Easy to collect
One button automation ...
Drawn from operational tools (Backlog, Acceptance Test Suite, Code Analyzers)
Easy aggregation and avoidance of management rework
13
13Montag, 22. April 13

Provides fuel for meaningful conversation
It‘s a good sign if people talk about what they‘ve learned
to amplify learning and accelerate process improvement
14
14Montag, 22. April 13

Provides feedback on a frequent and regular basis
available in each iteration retrospective and
to amplify learning and accelerate process improvement
key periodic management meeting
15
15Montag, 22. April 13

Measure Value or Process
document it‘s context or assumptions
consider appropriate audience
consider „what you measure is what you get“
16
16Montag, 22. April 13

Encourages good enough quality
must come from business owner and not developers
to avoid gold plating
17
17Montag, 22. April 13

Checklist for metrics or diagnostic
18
18Montag, 22. April 13

Name this should be well chosen to avoid ambiguity, confusion, oversimplification.
Questionit should answer a specific, clear question for a particular role or group. If there are multiple questions, design other metrics.
Basis of Measurement clearly state what is being measured, including units. Labeling of graph axes must be clear rather than brief.
Assumptions should be identified to ensure clear understanding of data represented.
Level and usage indicate intended usages at various levels of the organization. Indicate limits on usage, if any.
Expected Trendthe designers of the metric should have some idea of what they expect to see happen. Once the metric is proven, document common trends
When to use it what prompted creation or use of this metric? How has it historically been used?
When to stop using it when will it outlive its usefulness, become misleading or extra baggage? Design this in from the start.
How to game it think through the natural ways people will warp behavior or information to yield more ‘favorable’ outcomes.
Warnings recommend balancing metrics, limits on use, and dangers of improper use 19
19Montag, 22. April 13

Velocity as an example
Name Velocity
Question How much software can my team deliver per iteration?
Basis of Measurement story points
Assumptions The team is delivering software every iteration.
Level and usage Velocity is most useful at the project level. It allows the team to forecast how much work they can expect to complete based on prior efforts.
20
20Montag, 22. April 13

Expected TrendVelocity can be affected by many things: Changing team members, obstacles, toolsets,difficulty of feature or amount of learning required, etc. will lower the velocity of the team. However a stable team on the same project with the required resources will generally gain in velocity during the course of the project.
When to use itVelocity is a very useful metric for the team, and should be used during the course of the project once work has started.
When to stop using itWhen there is a longer project and the team, resources, and technology are all stable, velocity will also become stable. The team may suspend collecting velocity since it is “known.”
How to game it
Teams will estimate their work differently from other teams. For example one team might estimate 1000 hours while another 600 hours for the same work, and both will complete the work in the iteration. Comparing velocity of teams is problematic. If teams know they are getting compared, they can inflate their estimates, and hence increase their velocity while completing the same amount of work.
Warnings
Velocity is not the same as value. A team with excellent velocity could spend months quickly and effectively delivering software that does not have the investment potential. Comparing velocity of teams is problematic (see above). This diagnostic is a barometer for the team as a unit. Team member velocities are problematic, so velocity should be measured at the team level, since that is the unit that produces the value 21
21Montag, 22. April 13

Various metrics
22
22Montag, 22. April 13

Baseline Velocity
Velocity = Sum of original estimates of all accepted work
23
23Montag, 22. April 13

Work capacity
Sum of all reported work whether SBI was finished or not
Velocity > Work capacity indicates over estimations
Should be greater or equal to velocity
24
24Montag, 22. April 13

Focus Factor
Velocity
Should be around 80% for a healthy team
below indicates distraction
above indicates team is under forecasting to look perfect
Work Capacity
25
25Montag, 22. April 13

Percentage of adopted work
Sum of original estimates of adopted work
Adopted work = new work pulled into the sprint because team has completed it‘s forecast
Original forecast for the sprint
26
26Montag, 22. April 13

Percentage of found work
Sum of original estimates of found work
Found work = unexpected more work that is necessary to complete the SBI
Original forecast for the sprint
27
27Montag, 22. April 13

% Adopted Work + Found Work
20%smaller
28
28Montag, 22. April 13

Accuracy of Estimation
1 - (Sum of Estimate deltas / total forecast)
more than 88% indicate waste in the estimation
process
below 72% indicates poor story understanding or
missing PO support
Reflects team‘s ability to accurately estimate the body of work
29
29Montag, 22. April 13

Accuracy of Forecast
(∑Original Estimates)
Should be around 80% for a healthy team
100% indicates external pressure
below 80% indicates - team maybe not protected enough by Scrum Master
Reflects team‘s ability to accurately estimate the body of work they can achieve in a sprint
(∑Original Estimates + ∑Adopted Work + ∑Found Work)
30
30Montag, 22. April 13

Target value increase
Current sprint‘s velocity
Indicates when the Scrum Coach can step back from using the shock therapy (SHU-Level)
Baseline Velocity
31
31Montag, 22. April 13

Success at scale
(∑No. Accepted Attempts of scale Fp) (No. of All Attempts of scale Fp)
Indicates whether a story fits in a sprint
32
32Montag, 22. April 13
Win/Loss record
above 80% of original sprint forecast is accepted
AND
Found + Adopted work below 20% of original forecast
constantly remove unplanned work (waste) from a hyperproductive team
33
33Montag, 22. April 13

Running Tested Features
Happiness Metric
Cycle Time
Happiness Metric
WIP
Net Promoter System
34
34Montag, 22. April 13

Sources
http://jeffsutherland.com/ScrumMetricsHICSS2013BWSubmissionFinal.pdf
http://martinfowler.com/articles/useOfMetrics.html
http://www.innovel.net/wp-content/uploads/2007/07/appropriateagilemeasurementagilemetrics.pdf
http://www.leanessays.com/2003/01/measure-up.html
http://www.agileadvice.com/2008/06/15/scrumxplean/measuring-process-improvements/
http://agile2009.agilealliance.org/files/session_pdfs/Rawsthorne_AgileMetrics_v6d.pdf
35
35Montag, 22. April 13