agile plm business intelligence - oracle · refer the agile plm business intelligence installation...
TRANSCRIPT

Agile PLM Business Intelligence
Agile PLM BI User Guidev3.1
May 2009 Part No. E13963-01

Agile PLM BI User Guide
Copyright and Trademarks Copyright © 1995, 2009, Oracle and/or its affiliates. All rights reserved.
This software and related documentation are provided under a license agreement containing restrictions on use and disclosure and are protected by intellectual property laws. Except as expressly permitted in your license agreement or allowed by law, you may not use, copy, reproduce, translate, broadcast, modify, license, transmit, distribute, exhibit, perform, publish or display any part, in any form, or by any means. Reverse engineering, disassembly, or decompilation of this software, unless required by law for interoperability, is prohibited.
The information contained herein is subject to change without notice and is not warranted to be error-free. If you find any errors, please report them to us in writing.
If this software or related documentation is delivered to the U.S. Government or anyone licensing it on behalf of the U.S. Government, the following notice is applicable:
U.S. GOVERNMENT RIGHTS Programs, software, databases, and related documentation and technical data delivered to U.S. Government customers are "commercial computer software" or "commercial technical data" pursuant to the applicable Federal Acquisition Regulation and agency-specific supplemental regulations. As such, the use, duplication, disclosure, modification, and adaptation shall be subject to the restrictions and license terms set forth in the applicable Government contract, and, to the extent applicable by the terms of the Government contract, the additional rights set forth in FAR 52.227-19, Commercial Computer Software License (December 2007). Oracle USA, Inc., 500 Oracle Parkway, Redwood City, CA 94065.
This software is developed for general use in a variety of information management applications. It is not developed or intended for use in any inherently dangerous applications, including applications which may create a risk of personal injury. If you use this software in dangerous applications, then you shall be responsible to take all appropriate fail-safe, backup, redundancy and other measures to ensure the safe use of this software. Oracle Corporation and its affiliates disclaim any liability for any damages caused by use of this software in dangerous applications.
Oracle is a registered trademark of Oracle Corporation and/or its affiliates. Other names may be trademarks of their respective owners.
This software and documentation may provide access to or information on content, products and services from third parties. Oracle Corporation and its affiliates are not responsible for and expressly disclaim all warranties of any kind with respect to third party content, products and services. Oracle Corporation and its affiliates will not be responsible for any loss, costs, or damages incurred due to your access to or use of third party content, products or services.
ii Agile PLM Business Intelligence

Agile PLM BI User Guide
CONTENTS Copyright and Trademarks................................................................................................................... ii
About this guide................................................................................................................ 1 Objective...............................................................................................................................................1 Related documentation ........................................................................................................................1
Oracle Business Intelligence Infrastructure Installation and Configuration Guide..............................................................2 Oracle Business Intelligence Server Administration Guide ................................................................................................2 Oracle Business Intelligence Presentation Services Administration Guide........................................................................2 Oracle Business Intelligence Answers, Delivers, and Interactive Dashboards User Guide ...............................................2
Acronyms..............................................................................................................................................3 Common Elements Used in This Book.................................................................................................3
Dimensions.........................................................................................................................................................................3 Subject Areas .....................................................................................................................................................................4 Measures............................................................................................................................................................................4 Filters and Prompts ............................................................................................................................................................4 Folders................................................................................................................................................................................4 Guided Navigation..............................................................................................................................................................4 Key Performance Indicator (KPI)........................................................................................................................................5 Oracle Business Intelligence Answers (Oracle BI Answers) ..............................................................................................5 Oracle Business Intelligence Enterprise Edition (OBIEE) ..................................................................................................5 Oracle Business Intelligence Delivers (Oracle BI Delivers)................................................................................................5 Oracle Business Intelligence Interactive Dashboards (Oracle BI Interactive Dashboards)................................................5 Oracle Business Intelligence Presentation Catalog (Oracle BI Presentation Catalog).......................................................6 Requests (Reports) ............................................................................................................................................................6 Star Schema.......................................................................................................................................................................6
Understanding PLM Business Intelligence........................................................................ 7 Agile PLM Business Intelligence Architecture......................................................................................8 Oracle BI Administration Tool...............................................................................................................9
Repository File....................................................................................................................................................................9 Physical Layer ....................................................................................................................................................................9 Business Model and Mapping Layer ................................................................................................................................10 Presentation Layer ...........................................................................................................................................................10 Oracle BI Presentation Services.......................................................................................................................................10 Oracle BI Answers............................................................................................................................................................10 Oracle BI Dashboards ......................................................................................................................................................11 Web Catalog Folder..........................................................................................................................................................11
v3.1 Page - iii

Agile PLM BI User Guide
Roles ................................................................................................................................................. 11 Presentation Catalog groups Permissible Subject Area Folders......................................................................................11
Navigation.......................................................................................................................................... 12 Pre-built Reports................................................................................................................................ 12 Request Filters .................................................................................................................................. 12
Understanding PLM Business Intelligence Subject Areas .............................................. 13 Quality Management Subject Areas.................................................................................................. 13
PLM Quality - Customer Complaints ................................................................................................................................13 PLM Quality - NCR...........................................................................................................................................................14 PLM Quality - CAPA.........................................................................................................................................................14 PLM Quality - Audits.........................................................................................................................................................14 PLM Quality - Item Quality................................................................................................................................................14
Change Management Subject Areas ................................................................................................ 15 PLM Change - Change Orders.........................................................................................................................................15 PLM Change - Mfr Change Orders...................................................................................................................................15 PLM Change - Change Requests.....................................................................................................................................15 PLM Change - Stop Ships ................................................................................................................................................15 PLM Change - Item Changes...........................................................................................................................................15
Product Risk Management Subject Areas ........................................................................................ 16 PLM Product - Item...........................................................................................................................................................16 PLM Product - Item and AML ...........................................................................................................................................16 PLM Product - Manufacturer Parts ...................................................................................................................................16 PLM Product - Product Performance................................................................................................................................16
Folders............................................................................................................................................... 17 Time Dimension................................................................................................................................................................17 Non- time related dimensions...........................................................................................................................................18 Defined Fields...................................................................................................................................................................18 Workflow Dimensions .......................................................................................................................................................18 Measures..........................................................................................................................................................................19 Volume Measures.............................................................................................................................................................19 Aging Measures................................................................................................................................................................21 Cycle Time Measures.......................................................................................................................................................21 Work Flow Measures........................................................................................................................................................22 FTR Measures..................................................................................................................................................................24 Sign-off Measures ............................................................................................................................................................25 Redline Measures.............................................................................................................................................................26 Measures in Subject Areas...............................................................................................................................................27 Model Matrices .................................................................................................................................................................27 Additional Notes on Item AML and Product Performance Subject Areas.........................................................................30
iv Agile PLM Business Intelligence

Agile PLM BI User Guide
Item Age Calculations.......................................................................................................................................................32 How to interpret combinations ..........................................................................................................................................33
Understanding PLM BI Dashboards ................................................................................ 35 Dashboards ....................................................................................................................................... 35
Functional Dashboards.....................................................................................................................................................35 Sample Role-based dashboards ......................................................................................................................................35
Guided Navigation............................................................................................................................. 39 Security Groups................................................................................................................................. 40 User Authentication Details ............................................................................................................... 43
Appendix ......................................................................................................................... 45 Interpretation Matrix........................................................................................................................... 45
Item – AML Subject Area..................................................................................................................................................45 Item Subject Area.............................................................................................................................................................49 Product Performance Subject Area..................................................................................................................................50
v3.1 Page - v

Preface The Agile PLM documentation set includes Adobe® Acrobat PDF files. The Oracle Technology Network (OTN) Web site http://www.oracle.com/technology/documentation/agile.html contains the latest versions of the Agile PLM PDF files. You can view or download these manuals from the Web site, or you can ask your Agile administrator if there is an Agile PLM Documentation folder available on your network from which you can access the Agile PLM documentation (PDF) files.
Note To read the PDF files, you must use the free Adobe Acrobat Reader version 7.0 or later. This program can be downloaded from the Adobe Web site http://www.adobe.com.
The Oracle Technology Network (OTN) Web site http://www.oracle.com/technology/documentation/agile.html can be accessed through Help > Manuals in both Agile Web Client and Agile Java Client. If you need additional assistance or information, please contact support http://www.oracle.com/agile/support.html (http://www.oracle.com/agile/support.html) for assistance.
Note Before calling Oracle Support about a problem with an Agile PLM manual, please have the full part number, which is located on the title page.
TTY Access to Oracle Support Services
Oracle provides dedicated Text Telephone (TTY) access to Oracle Support Services within the United States of America 24 hours a day, 7 days a week. For TTY support, call 800.446.2398. Outside the United States, call +1.407.458.2479.
Readme
Any last-minute information about Agile PLM can be found in the Readme file on the Oracle Technology Network (OTN) Web site http://www.oracle.com/technology/documentation/agile.html
Agile Training Aids
Go to the Oracle University Web page http://www.oracle.com/education/chooser/selectcountry_new.html for more information on Agile Training offerings.
Accessibility of Code Examples in Documentation
Screen readers may not always correctly read the code examples in this document. The conventions for writing code require that closing braces should appear on an otherwise empty line; however, some screen readers may not always read a line of text that consists solely of a bracket or brace.
Accessibility of Links to External Web Sites in Documentation
This documentation may contain links to Web sites of other companies or organizations that Oracle does not own or control. Oracle neither evaluates nor makes any representations regarding the accessibility of these Web sites.

Chapter 1
About this guide
Objective The Agile PLM Business Intelligence User guide enables you to understand the scope and usage of PLM BI applications.
Note This document describes only the delivered pre-built dashboards, reports, subject areas, and security setup for PLM BI. We recommend you to read the Oracle Business Intelligence Enterprise Edition documentation in the Oracle Technology Website for information on the underlying architecture, before you proceed with this document.
Related documentation The Oracle Technology Network web site has the following documents related to PLM BI:
Agile PLM Business Intelligence 3.1 Readme
Agile PLM Business Intelligence Installation and Upgrade Guide
Agile PLM Business Intelligence User Guide
Agile PLM Business Intelligence Data Reference and Mapping Guide
Agile PLM Business Intelligence Capacity Planning Guide
Agile PLM Business Intelligence Configurator Guide
The Oracl e has the following documents related to PLM Datamart: e Technology Network web sit
Agile PLM Data Mart Setup Guide
Agile PLM Data Mart Data Reference Guide
Agile PLM Data Mart 3.0.1 Readme
The Oracle Technology Network web site has the following documents related to OBIEE:
Configuration Guide
Oracle Business Intelligence Answers, Delivers, and Interactive Dashboards User Guide
Oracle Business Intelligence Infrastructure Installation and
Oracle Business Intelligence Server Administration Guide
Oracle Business Intelligence Presentation Services Administration Guide
v3.1 Page - 1

Agile PLM BI User Guide
Oracle Business Intelligence Infrastructure Installation and Configuration Guide This guide provides information on installation and configuration of the infrastructure or platform components of Oracle Business Intelligence on certified Operating systems and deployments. This release of the User Guide applies to infrastructure (platform) releases of Oracle Business Intelligence Enterprise Edition.
Note The Oracle Business Intelligence Infrastructure Installer installs the platform components. Refer the Agile PLM Business Intelligence Installation guide for instructions to install the application components.
Oracle Business Intelligence Server Administration Guide This is an infrastructure guide that contains post-installation and configuration information that pertains to setting up the Oracle Business Intelligence Server (Oracle BI Server). The guide discusses how to plan, create, and administer the physical, business model, mapping, and presentation layers in the Oracle BI Repository. The guide primarily covers tasks that are performed in the Oracle BI Administration Tool utility.
Oracle Business Intelligence Presentation Services Administration Guide This guide provides post-installation configuration and administration procedures for Oracle BI Presentation Services, Oracle BI Answers, Oracle BI Delivers, Oracle BI Interactive Dashboards, and the Oracle BI Presentation Catalog and Catalog Manager. In addition, the guide discusses Oracle BI Presentation Services security, logging, user interface, and integration using HTTP.
Oracle Business Intelligence Answers, Delivers, and Interactive Dashboards User Guide This guide is for Oracle BI report and dashboard designers and end users of PLM BI Applications. This guide contains information about using Oracle’s Answers, Delivers, and Interactive Dashboards applications to organize and present data for making critical and timely business decisions.
2 Agile PLM Business Intelligence

Chapter 1: About this guide
Acronyms A list of acronyms used in this document is provided here for your reference.
Acronym Expansion BI Business Intelligence
DM Data Mart
ODM Operational Data Mart
ETL Extract-Transform-Load
MDS Multi-Dimensional Schema
OBIEE Oracle Business Intelligence Enterprise Edition
ODI Oracle Data Integrator
PLM Product Lifecycle Management
PLM DM Product Lifecycle Management Data Mart
PQM Product Quality Management
ECO Engineering Change Order
MCO Manufacturing Change Order
ECR Engineering Change Request
SS Stop Ship
PR Problem Report
NCR Non-Conformance Report
CAPA Corrective and Preventive Action
MTBF Mean Time Between Failures
MTBC Mean Time Between Cycles
Common Elements Used in This Book Dimensions Dimensions represent the organization of logical columns (attributes) that belong to a single logical dimension table. Examples of dimensions are Time periods, Product lines, Customers and Suppliers.
v3.1 Page - 3

Agile PLM BI User Guide
Subject Areas Oracle Business Intelligence presents data in subject areas. A subject area contains columns that represent information about the areas of your organization's business or about groups of users within your organization. Subject areas usually have names that correspond to the type of information they contain Example: Quality and Change Management.
Measures Measures refer to a measure or calculated data, such as number of problem reports or affected items that can be specified in terms of dimensions. For example, you might want to determine the number of new complaints for a product line in a given time period.
Filters and Prompts Filters are built into requests and are used to limit the results that appear on a dashboard. A report that appears on a dashboard shows only those results that match the filter criteria. Filters are applied on a column-level basis. Certain filters inherit the values that users specify in dashboard prompts.
A prompt is another type of filter that applies to all items in a dashboard. Some prompts, such as date or period, are common to some dashboards. Other prompts, such as CAPA type, are unique to a specific dashboard. Prompts are synonymous with parameters.
Note See Oracle Business Intelligence Answers, Delivers, and Interactive Dashboards User Guide, 'Filtering Requests in Oracle BI Answers' for further information.
Folders In the Oracle BI Presentation Services user interface, the Folders provide the ability to organize an Oracle BI Web Catalog and its contents, such as reports.
Guided Navigation These are links to navigate to the transaction processing application, another dashboard, or a URL. This link can be set up to appear conditionally based on the results of a report or Key Performance Indicator.
4 Agile PLM Business Intelligence

Chapter 1: About this guide
Key Performance Indicator (KPI) KPIs are key metrics that indicate how well the organization is performing an activity that is critical to success of organization. Example: Example
Current month performance in terms of Complaints Cycle time compared to last 12 months.
Oracle Business Intelligence Answers (Oracle BI Answers) Oracle BI Answers are components within the Oracle BI Enterprise Edition that provide answers to business questions. You can use Oracle BI Answers to create ad-hoc queries into an organization's data.
This interface allows PLM BI users with the appropriate permissions to build and modify Reports or Requests that enable PLM BI users to:
Explore and interact with information
Present and visualize information using charts, pivot tables, and reports.
Requests can be saved in the form of reports, and shared, modified, formatted, or embedded in a dashboard.
Oracle Business Intelligence Enterprise Edition (OBIEE) OBIEE is a comprehensive suite of enterprise business intelligence products that contain the programs, servers, and tools to support broad, self-service access across the organization. OBIEE is the foundation for Agile PLM Business Intelligence application.
Oracle Business Intelligence Delivers (Oracle BI Delivers) Oracle BI Delivers is the interface used to create Oracle Business Intelligence Alerts based on analytics results. This is a pro-active intelligence solution that enables monitoring of business activities. Results specific to out-of-tolerance situations can be detected within reports. The subscribers and target owners can be notified immediately through Web, Wireless, and Mobile communications channels.
Oracle Business Intelligence Interactive Dashboards (Oracle BI Interactive Dashboards) Oracle Business Intelligence Interactive Dashboards provide access points for analytics information. When a PLM BI user accesses Oracle BI, the user’s default dashboard appears. Dashboards display reports that contain content specific to the needs of individual PLM BI users or groups. You can merge the historical and current data sources into a single dashboard. PLM BI users with the appropriate permissions can place results from Oracle BI Answers into dashboards for use by PLM
v3.1 Page - 5

Agile PLM BI User Guide
BI users.
Oracle Business Intelligence Presentation Catalog (Oracle BI Presentation Catalog)
l. reated with
racle BI Answers and HTML content link to other images, documents, and sites.
Requests (Reports)
n a e established in the chart or table of a report to launch
guided analysis.
Star Schema l database schema which contains a fact table associated with a series of
ulti-dimensional tables.
The Oracle BI Presentation Catalog stores content created with Oracle BI Answers and Oracle BI Interactive Dashboards. Content can be organized into folders that are either Shared or PersonaTypes of content that can be stored in the Presentation Catalog include Requests cO
Requests are the building blocks of business intelligence dashboards. These requests are created using Oracle BI Answers to retrieve and display an organization's data. Data can be displayed ivariety of graphical formats. Links can banother report to offer
Star Schema is a relationam
6 Agile PLM Business Intelligence

Chapter 2
Understanding PLM Business Intelligence
The Agile PLM Business Intelligence contains interactive, comprehensive analytical applications that offer insight into your PLM data.
Agile PLM Business Intelligence contains role-based and functional dashboards that help you quickly analyze key performance indicators, spot trends using reports and metrics and determine the current state of product quality. They also provide a library of pre-built reports, dashboard prompts, and filters that present data in interactive charts, graphs, and grids. You can grant each role access to specific objects, such as subject areas, dashboards, and reports. In addition, you can control access to specific data rows by using secured dimensions.
Agile PLM Business Intelligence applications include a single, pre-built repository that contains the metadata for the Multi Dimensional Schema. The repository consists of physical, business mapping and presentation metadata layers that contain common definitions of metrics, hierarchies, and calculations against the data. For more details on the Multi-Dimensional Schema, see Agile PLM Business Intelligence Data reference Manual.
The servers, programs, and tools in Oracle BI Enterprise Edition provide the infrastructure foundation for Agile PLM Business Intelligence applications. The metadata repository file and Web Catalog file are objects in Oracle BI Enterprise Edition. Oracle BI Answers and Interactive Dashboards are used to create the dashboards, reports, and certain Key Performance Indicators.
v3.1 Page - 7

Agile PLM BI User Guide
Agile PLM Business Intelligence Architecture
8 Agile PLM Business Intelligence

Chapter 2: Understanding PLM Business Intelligence
Oracle BI Administration Tool Oracle BI Administration tool enables you to build, manage and maintain an Oracle BI Repository. It provides graphical representation of the Physical, Business model, and Presentation layers of the repository.
Repository File Pre-built metadata content is maintained in the metadata repository file named PLMA.rpd.
Following are the subject areas contained in the .rpd file:
PLM Quality-Customer Complaints
PLM Quality- NCRs
PLM Quality- CAPAs
PLM Quality-Audits
PLM Quality-Item Quality
PLM Change - Change Orders
sts
Orders
hips
ness Model and Mapping, and Presentation layers that are sections.
data necessary for Oracle BI server to access
PLM Change - Change Reque
PLM Change - Item Changes
PLM Change - Mfr Change
PLM Change - Stop S
PLM Product - Item
PLM Product - Item and AML
PLM Product - Manufacturer Parts
PLM Product - Product Performance
The Oracle BI Administration Tool is the user interface for the layers in the repository. The sitory contains the Physical, Busirepo
discussed in the following
Physical Layer Physical layer is the first later built in repository, which contains the objects representing the physical data sources (PLMBIMDS schema). The database object is the highest object in thephysical layer. Each database object in the physical layer contains a connection pool.
A connection pool has information about the connection between Oracle BI Server and data source. In addition, the connection pools also have schema folders which contain tables, columns, and keys
cal schema. These keys provide the metafor a physi
v3.1 Page - 9

Agile PLM BI User Guide
the actual physical source with SQL requests.
Business Model and Mapping Layer
layer also contains the
(reference) to all of the logical dimension and fact tables that are joined together in a star
Presentation Layer
a esentation layer objects are Presentation
atalog, Presentation table and Presentation column.
Oracle BI Presentation Services oards User Guide in
racle Technology Network: http://www.oracle.com/technology/index.html
Oracle BI Answers
the delivered dashboards or
olders and columns appear in a
Note iness
The Business Model layer represents the logical structure of the information in the repository. Thephysical schemas are simplified and reorganized based on the users' view of the data. The business models contain logical columns arranged in logical tables (logical dimension tables and logical fact tables), logical joins, and dimensional hierarchy definitions. Thismapping from the logical columns to the source data in the Physical layer.
The Business Model and Mapping layer appears in the middle pane of the Oracle BI Administration Tool. Generally, each logical display folder in this layer represents a business area. Each folder has a shortcutschema.
Presentation layer is the last layer of repository which contains presentation objects that provide a customized view of business model to PLM BI users. This layer organizes the business model in way that the PLM users can query it for information. Prc
See Oracle Business Intelligence Answers, Delivers, and Interactive DashbO
Oracle BI Answers provides user interface for creating and modifying ad-hoc reports.
Oracle BI Answers is the embedded reporting tool that allows users with the appropriate permissions to build and modify reports that let end users explore and interact with information, anddrill in place to source data. You can access these reports either from from the Oracle Answers Catalog pane on the Oracle Answers page.
On the Oracle Answers page, you can also access the subject area folders that coincide with Oracle BI Presentation Catalog folders. The fact and dimension fsubject area folder, just as they do in the Presentation Catalog.
See Also "Basics of Working with Requests in Oracle BI Answers" and Oracle BusIntelligence Answers, Delivers, and Interactive Dashboards User Guide in Oracle Technology Network: http://www.oracle.com/technology/index.html
10 Agile PLM Business Intelligence

Chapter 2: Understanding PLM Business Intelligence
Oracle BI Dashboards The Oracle BI Dashboards user interface is part of the Oracle BI Presentation Services component of Oracle BI Intelligence.
Interactive Dashboards provide points of access for analytics information. A dashboard is made up of sections of information that can contain items such as results from Oracle BI Answers, external Web content, HTML text, graphics, and links to other dashboards. Dashboard content is logically organized into pages. The pages appear as tabs across the top of the screen in Oracle BI Interactive Dashboards. A dashboard page is designed to meet the needs of a particular role.
To access a dashboard, your user ID must be assigned to the appropriate Presentation Catalog group in Oracle BI Intelligence 'Setting up Security'.
Every dashboard or report can have a set of prompts that determine the data that appears. When you change the value of a prompt on a dashboard, and click the Go button, the system automatically refreshes the data on the dashboard. Changing a prompt can affect the amount of data, the column headings, the KPI values, and the graph formats.
Note See Also 'Using Oracle BI Interactive Dashboards' in Oracle Business Intelligence Answers, Delivers, and Interactive Dashboards User Guide in Oracle Technology Network: http://www.oracle.com/technology/index.html
Web Catalog Folder The Oracle BI Web Catalog stores the application dashboards, report definitions, and contains information regarding permissions and accessibility of the dashboards by groups. The definitions or pre-built and customized dashboards and reports are available in Web Catalog folder.
Roles The role of a user in the organization controls the user's access to objects (such as dashboards, reports, and catalog folders) in the Oracle BI Presentation Catalog. Presentation Catalog groups are defined by the system or by a PLM BI administrator. You assign specific users to Presentation Catalog groups, and that group membership determines the users' access to Presentation Catalog object.
Presentation Catalog groups Permissible Subject Area Folders See 'Managing Oracle BI Presentation Services Security' in Oracle Business Intelligence Presentation Services Administration Guide.
v3.1 Page - 11

Agile PLM BI User Guide
Navigation Users with the appropriate permissions can log into PLM BI links to view Dashboards, Answers, More Products, Settings, and My Account. The views that you can access are determined by your membership in a Presentation Catalog group.
Note See 'Using Oracle BI Interactive Dashboards' in Oracle Business Intelligence Answers, Delivers, and Interactive Dashboards User Guide.
Pre-built Reports PLM BI delivers reports that provide end users with key metrics and measures for specific, pre-defined subject areas. These reports are available in the Oracle BI Answers Catalog and integrated into pre-built dashboards.
Note See Also Oracle Business Intelligence Answers, Delivers, and Interactive Dashboards User Guide, 'Basics of Working with Requests in Oracle BI Answers'
Request Filters During the creation of an Oracle BI request, you can use column filters to constrain the request to obtain results which answer a particular question. Together with the columns that you include on the answer, a column filter determines what the results will contain. For example, depending on the industry you work in, you can use column filters to find out who the top ten performers are, sales for a particular brand, most profitable customers, and so on.
A column filter consists of a column to filter, a value to use when applying the filter, and an operator that determines how the value is applied. You can also prevent the filter from being replaced during navigation and prompting.
Note See 'Filtering Requests in Oracle BI Answers' in Oracle Business Intelligence Answers, Delivers, and Interactive Dashboards User Guide, for additional information on using column filters in an Oracle BI request.
12 Agile PLM Business Intelligence

Chapter 3
Understanding PLM Business Intelligence Subject Areas
This section provides an overview of the subject areas in Agile PLM Business Intelligence.
When you click the Answers link from any location in an Agile PLM Business Intelligence application, the Oracle Answers start page appears with a list of subject areas in the workspace. A subject area contains columns that represent dimensions and measures that help analyze specific business processes.
Users with right levels of access can create new reports using these dimensions and measures. In addition, these users can save and share content. Subject areas contain columns that can be combined to create ad-hoc reports using the Answers. They can also use the graphical capabilities of Answers to create charts and graphs.
For more details on creating ad-hoc reports, see OBIEE User guide.
PLM Business Intelligence supports analysis in the following areas:
Quality management
Change performance
Product risk management
PLM Quality - Item Quality
volume ovides the Volume of complaints with CAPA and Volume of expected closed
Quality Management Subject Areas Quality Management Subject Areas are:
PLM Quality - Customer Complaints
PLM Quality - Non-Conformance Reports
tive and Preventive Actions PLM Quality - Correc
PLM Quality - Audits
PLM Quality - Customer Complaints This subject area provides the ability to analyze volume, cycle time and aging of Customer Complaints across customer, supplier, product lines, severity, status and resolution. Withinanalysis, it prcomplaints.
v3.1 Page - 13
Agile PLM BI User Guide
Cycle time analysis consists of 'Originate' to 'Release' and 'Workflow cycle time' between and within statuses. Aging analysis provides aging buckets of 5-90 days. The source data for this subject area omes from relevant cover page attributes of the PLM class, Problem Reports.
of
r this subject area comes from relevant over page attributes of PLM class Non-conformances.
-s from relevant cover page attributes of PLM
lass Corrective and Preventive Action.
PLM Quality - Audits
e
e source data for this subject area comes from relevant cover page attributes of PLM class udits.
and
A
relevant attributes on Agile PLM Affected Item tab of Problem Reports, NCR, CAPA and Audits.
c
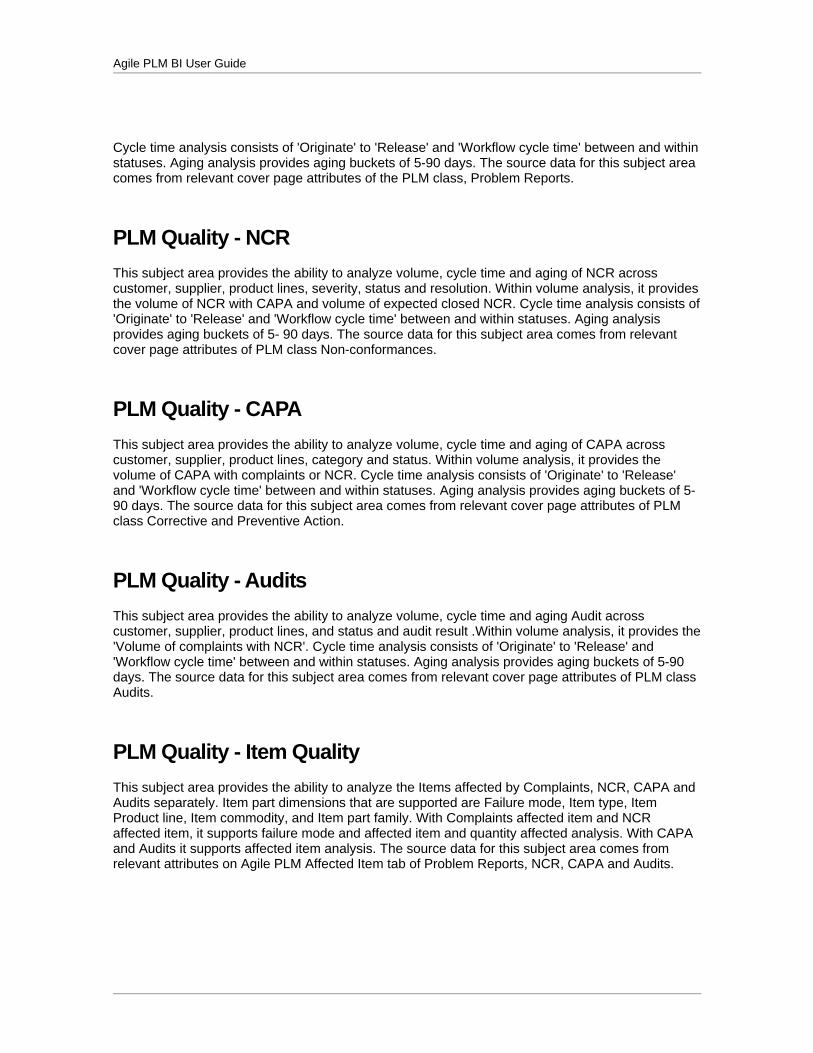
PLM Quality - NCR This subject area provides the ability to analyze volume, cycle time and aging of NCR across customer, supplier, product lines, severity, status and resolution. Within volume analysis, it provides the volume of NCR with CAPA and volume of expected closed NCR. Cycle time analysis consists'Originate' to 'Release' and 'Workflow cycle time' between and within statuses. Aging analysis provides aging buckets of 5- 90 days. The source data foc
PLM Quality - CAPA This subject area provides the ability to analyze volume, cycle time and aging of CAPA across customer, supplier, product lines, category and status. Within volume analysis, it provides the volume of CAPA with complaints or NCR. Cycle time analysis consists of 'Originate' to 'Release' and 'Workflow cycle time' between and within statuses. Aging analysis provides aging buckets of 590 days. The source data for this subject area comec
This subject area provides the ability to analyze volume, cycle time and aging Audit across customer, supplier, product lines, and status and audit result .Within volume analysis, it provides th'Volume of complaints with NCR'. Cycle time analysis consists of 'Originate' to 'Release' and 'Workflow cycle time' between and within statuses. Aging analysis provides aging buckets of 5-90 days. ThA
PLM Quality - Item Quality This subject area provides the ability to analyze the Items affected by Complaints, NCR, CAPAAudits separately. Item part dimensions that are supported are Failure mode, Item type, Item Product line, Item commodity, and Item part family. With Complaints affected item and NCR affected item, it supports failure mode and affected item and quantity affected analysis. With CAPand Audits it supports affected item analysis. The source data for this subject area comes from
14 Agile PLM Business Intelligence
Chapter 3: Understanding PLM Business Intelligence Subject Areas
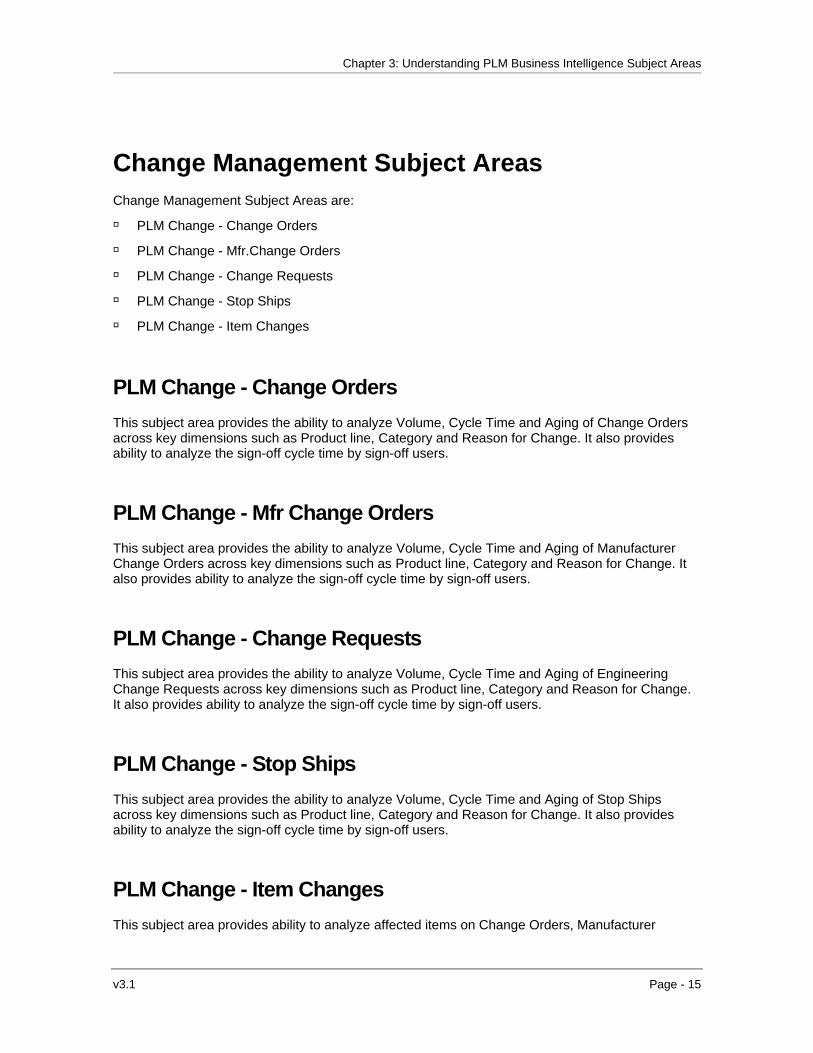
C ange Managemenh t Subject Areas
PLM Change - Mfr.Change Orders
PLM Change - Change Requests
LM Change - Change Orders , Cycle Time and Aging of Change Orders nd Reason for Change. It also provides
LM Change - Mfr Change Orders e, Cycle Time and Aging of Manufacturer ct line, Category and Reason for Change. It
LM Change - Change Requests lyze Volume, Cycle Time and Aging of Engineering uch as Product line, Category and Reason for Change.
LM Change - Stop Ships Volume, Cycle Time and Aging of Stop Ships tegory and Reason for Change. It also provides
PLM Change - Item Changes This subject area provides ability to analyze affected items on Change Orders, Manufacturer
Change Management Subject Areas are:
PLM Change - Change Orders
PLM Change - Stop Ships
PLM Change - Item Changes
PThis subject area provides the ability to analyze Volumeacross key dimensions such as Product line, Category aability to analyze the sign-off cycle time by sign-off users.
PThis subject area provides the ability to analyze VolumChange Orders across key dimensions such as Produalso provides ability to analyze the sign-off cycle time by sign-off users.
PThis subject area provides the ability to anaChange Requests across key dimensions sIt also provides ability to analyze the sign-off cycle time by sign-off users.
PThis subject area provides the ability to analyzeacross key dimensions such as Product line, Caability to analyze the sign-off cycle time by sign-off users.
v3.1 Page - 15

Agile PLM BI User Guide
Orders, ECR, and Stop Ship on key Item dimensions such as Product line and assess the impact of
ent Subject Areas as are:
PLM Product - Manufacturer Parts
ce
This Subject area provides the ability to analyze the Item Part Risk by key Item dimensions such as provides the ability to analyze the volume of nd Part Family.
ility to analyze key Item Measures such as volume by Manufacturer dimensions and Manufacturer measures such as number of manufacturer by Item dimensions
key risk metrics such as number of
cturer Part Risk & volume by key ly.
ect area provides the ability to analyze and benchmark Items and Affected Items by Mean time between changes and failure. It also provides an ability to analyze Change and Quality incidents by key Item dimensions such as Product line and Type based on certain rules
change.
Product Risk ManagemProduct Risk Management Subject Are
PLM Product - Item
PLM Product - Item and AML
PLM Product - Product Performan
PLM Product - Item
Life Cycle, Product line and Part Family. It also released items by their Life cycle, Product line a
PLM Product - Item and AML This subject area provides ab
based on certain rules. It also provides ability to analyze manufacturer parts per Item.
PLM Product - Manufacturer Parts This Subject area provides the ability to analyze the Manufadimensions such as Manufacturer, Life Cycle and Part Fami
PLM Product - Product Performance This Subj
16 Agile PLM Business Intelligence

Chapter 3: Understanding PLM Business Intelligence Subject Areas
Folders Every Subject Area has a corresponding Folder structure on the left Selection pane in the BI Answers window. The Column folder contains groups of folders within it which have two main categories: Dimensions and Measures.
Time dimension
Dimensions (non-time related)
Defined fields
Measures
Defined Measures
For information on valid combinations of the Measures and Dimensions in any category of Subject Area, refer Model Matrices.
For information on the Dimensions and Measures specific to PLM Quality – Item Quality Subject r Dimensions and Measures for Subject Area: PLM Quality-Item Quality Area, refe
Time Dimension Time dimension is common across all subject areas.
The Standard categories of Time Dimensions are:
Calendar
Time Utility Members
e depicts results as on the Gregorian calendar where the year begins on the first day of January.
en you install the application, you need to specify the Fiscal Calendar details for your organization.
h a Measure to obtain results for a chosen time bucket – Year, Quarter, Month, Week, and Day.
te.
ay. Rolling time provides results for the last N Months/Weeks/Quarters where N is a number.
Note iscussions assume knowledge of Agile PLM classes, workflow and their
Fiscal
The Calendar tim
The Fiscal time depicts results as on the Fiscal Calendar of your Organization. Wh
Use the Calendar and Fiscal Time columns in combination wit
The Time Utility Members have time buckets that provide results with reference to the current daFor example, select Previous Week Column in the Time Utility Members folder to obtain resultsspecific to the last seven days from the current d
Following dattributes.
v3.1 Page - 17

Agile PLM BI User Guide
Non- time related dimensions These dimensions are generally mapped to an Agile PLM class cover page attribute. Examples include Customer, Product lines and Type (Sub-class), Category, Supplier, User and Complaint
ter the reports.
opulated
Is Cancelled: Returns 'Yes' if the Object workflow is in 'Cancelled' state
other object in the ted.)
Aggregate PSR: Indicates if the object (PR or NCR) is an aggregate PSR and has child (PR or NCR respectively) associated with it.
ing BI Configurator. Once mapped, these dimensions can be used like any other dimension to
ate reports. For more information, refer Agile PLM BI MDS Configurator and Data Mapping .
ion with Workflow status cycle time measures ate cycl Workflow status cycle
Number.
Flags
These dimensions typically indicate 'Yes' or 'No' and can be used to fil
Following sample dimension flags indicate current state of the object:
Is Released: Returns 'Yes' if the Cover page 'Date Released' has been populated
Is Complete: Returns 'Yes' if the Cover page 'Date Complete' has been p
Following sample relationship flags indicate if the object has been linked with anrelationship tab (This flag indicates 'Yes' whether or not a rule has been associa
Has Audit: Indicates if the object (PR or NCR) has Audit associated with it.
Has CAPA: Indicates if the object (PR or NCR) has CAPA associated with it.
Defined Fields Defined fields are set of fields that can be mapped to an Agile PLM Page 2, Page 3 attribute usthe PLMcreGuide
Workflow Dimensions The following are the Workflow dimensions:
Workflow Status Cycle Time Dimension: Used in combinatto cre e time reports for individual statuses. For more information on time measure, see Workflow measures on page 22.
Note These dimensions work with Sign-off Cycle time measures.
Workflow Total Cycle Time Dimension: Used in combination with Workflow total cycle time measures to create cycle time reports between two steps in a workflow. For more information on Workflow total
18 Agile PLM Business Intelligence

Chapter 3: Understanding PLM Business Intelligence Subject Areas
cycle time measure, see Workflow measures on page 22.
Measures t areas. Similar measures from
rious subject areas are grouped into different types of measures.
ply to PLM Quality, PLM Change Subject Areas:
s
s apply to Change Order, Mfr Order, Stop Ship and Engineering Change
Redline Measures
ovide responses to
ing up?
t is the Trend?
2009?
ny Complaints are currently overdue?
as the following types of Volume Measures:
Agile PLM BI application has various measures in each of the subjecva
The following measures ap
Volume Measures
Cycle Time Measures
Work Flow Measure
Aging Measures
Defined Measures
Item-related Measures
The following measureRequests only.
FTR Measures
Sign-off Measures
Volume Measures Volume measures provide counts of objects by specified time buckets and help assess trends andnecessary action that needs to be taken.
For example, in Customer Complaints Subject Area, the Volume Measures prthe following questions:
How many new Complaints were reported last month? Is it trend
How many Complaints are currently open?
How many Complaints closed in Q3 2007? Wha
How many Complaints are expected to close in January
How ma
Agile PLM BI h
New
v3.1 Page - 19

Agile PLM BI User Guide
Closed
Expected Closed
Me
New measures indicate the trend of reported objects such as Customer complaints. Increasing or ecreasing trends are signs that an action needs to be taken or action taken was successful.
s the number of new objects originated (based on originate date) in a specific
Open
Overdue
New asures
d
Note New indicateperiod such as week, month, quarter, year arranged by originated date
Clos easures
asures provides count of objects that closed in a given period. Cumulative counts pr
ed M
These Me ovide count of all the objects till a specific time interval. Trend Charts of 'Closed' indicate if there is a rise or fall in the rate of closure.
'Closed' indicates the number of objects which are in 'Closed' status (based on release or Notecomplete date) in a specific period such as week, month, quarter, year arranged by release date.
Expected Closed Measures
ovide count of objects which are expected to close in a period. Expected closed vailable for CAPA and Audit objects since the Agile PLM class does not contain
M
These Measures provides count of objects which are in 'Open' status at the end of a period. The rend charts of 'Open' indicate if the rate of closure is parallel to the 'New' objects.
s the number of objects which are in 'Open' status (not released or not
These Measures prmeasures are not athe 'Expected Resolution Date'.
Open easures
T
Note 'Open' indicatecomplete) as on a date arranged by 'Originated date'.
Overdue Measures
These measures provide count of objects that are overdue with respect to the expected resolution date. These are available for Complaints and NCRs only.
20 Agile PLM Business Intelligence

Chapter 3: Understanding PLM Business Intelligence Subject Areas
Aging Measures Aging Measures enstatus for a pre-defi
able you to measure the number of objects that have been in a specific workflow ned period or Aging bucket. Examples of Aging buckets are 11-20 days, and < 5
gile PLM BI has the following types of Aging Measures:
Overdue' objects in each Aging bucket. The age is based on inate' date to 'Current' date when Release date is greater than
Expected Resolution Date. Overdue aging measures are available only for Customer Complaints
days.
A
Closed Aging
Open Aging
Overdue Aging
Open Aging
This measure provides count of 'Open' objects in each Aging bucket. Age is based on duration calculated from object 'Originate' date to 'Current' date.
Closed Aging
This measure provides count of 'Closed' objects in each Aging bucket. Age is based on the durationcalculated from object 'Originate' date to 'Release' date.
Overdue Aging
This measure provides count of the 'duration calculated from object 'Orig
and NCR.
Note Aging Measures cannot combine with Time Dimension.
Cycle Time Measures Cycle Time Measures enable you to analyze the average duration between various combinations of
f the workflow statuses of objects. Examples of such combinations are 'Originate to Release', 'Originate to Complete', 'Submit to Release' and 'Submit to Complete'.
These types of measures are called 'Cycle time based on system dates' to distinguish them from orkflow cycle time measures. The other Cycle Time measures in this category are:
ded.
the 'Start' and 'End' date o
w
Average days overdue
Expected cycle time
Note All cycle time measures are expressed in terms of calendar days. Weekends are inclu
v3.1 Page - 21

Agile PLM BI User Guide
Cycle Time based on System Dates
This Measure refers to the Cycle time calculations on the basis of 'Start' and 'End' Dates of various statuses in any business Work Flow. PLM system auto-populates the Start dates (Originate or Submit) and End dates (Released or Complete) on objects.
Note There are measures available that provide cycle time deducting the 'hold' duration. If an object has more than one Submit date then the cycle time calculation considers the latest submit date.
The Cycle Time Measures provide answers to questions such as 'What is the current status of Open Complaints? How long have they been in 'Current' status?'
' or
e Average Days for which any object is 'Overdue' is as on date for 'Open' cts and as on 'Released Date' for 'Released' objects.
ts and NCRs on the basis of 'Expected s
o measure durations for specific statuses in a workflow.
gile PLM BI has the following types of Workflow Measures:
e that the object is
enVal
Cycle time measures assume 'End' date to be Current date if the 'End' state such as 'Released'Complete' have not been reached for an object.
Average Days Overdue
This Measure refers to the Average number of Days that the objects are past the 'Expected Resolution Date'. Thobje
Expected Cycle Time
This Measure refers to the Expected Cycle time for ComplainRe olution Dates'.
Work Flow MeasuresW rkflow measures enable you to
A
Total Cycle Time
Total Cycle Time in-process
Status Cycle Time
Status Cycle Time in-process
Consider the following example workflow with statuses as given below. Assumcurrently in 'Investigated' step.
Id tified > Acknowledge > Define Issue > Determine Root Cause > Investigated > Implement > idate > Preventive Action > Close > Notify
22 Agile PLM Business Intelligence

Chapter 3: Understanding PLM Business Intelligence Subject Areas
Notes on Total Cycle Time:
ld status is included in the calculations
forward direction of workflow. Example: You can expect measure ot
Tot
ry valid combination of the ' and 'TO' statuses.
on:
select the start status dimension (FROM) and end status dimension (TO) in his measure.
Res
Tot d the ‘FROM’ state minus the Latest date on which the object exit from the ‘TO’ state.
Note The calculation does not consider rejections during the workflow.
Time spent in Ho
For statuses of Type ‘Complete’ and ‘Cancel’, Entry Date = Exit Date
Calculations are valid invalues when a workflow moves from ‘Pending’ to ‘Complete’ status. However, measures will nreturn results in 'reverse' direction. For example, if an object is demoted from Review to Pending, it returns incorrect results.
al Cycle Time
The Total Cycle Time Measure provides the average cycle time for eve'FROM
In the given example workflow, the duration between 'Acknowledge' status and ' Determine Root cause' status in a Workflow constitutes the 'Total Cycle Time'.
Conditi
You can combination with t
Statuses are the status names configured for a specific Workflow.
ult:
al Cycle Time = Earliest date on which the object entere
Special considerations:
When FROM = Any State and TO = Cancel, whether or not the Cancel state has an Exit Date,
n FROM = Any State and TO = Complete, whether or not the Complete state has an Exit Date, the Measures consider, Entry Date = Exit Date.
cess indicates the total time that an object has taken to reach the current
rk flow, total cycle time is the duration between 'Identified' and 'Investigated' tatus.
FROM status but no corresponding TO status are considered to be ‘In-
the Measures consider, Entry Date = Exit Date.
Whe
Total cycle time - in process
Total Cycle Time in-prostate from any other state. The object is assumed to be currently 'Open'.
In the given example wos
The objects that haveProcess’ and are considered for Total Cycle Time – In Process calculations.
Total Cycle Time – In Process = ETL Run Start Date – FROM Date
v3.1 Page - 23

Agile PLM BI User Guide
Special Considerations:
Objects in Complete and Cancel states, are also considered to be in the 'In-Process' state.
cycle time
tatus Cycle Time helps determine the cycle time for each status step. This is the response to questions such as 'How long was the object in 'Determine root cause' state?'
d states are considered for the Status Cycle Time
Time for a Status = Latest Exit date from the Status minus Earliest Entry Date into the
Status cycle time- in process
ork flow, the time spent in 'Investigated' state is the Status cycle time in-process.
sures enable you to identify the number of objects that are currently in a closed ction. When compared with total number of closed objects, this metric
out any rejection.
ble
mber of FTR objects which are in the ‘Open’ state. You can view the u the ‘Not Complete’ and ‘Not Released’ state.
Status
S
General Business Rule: Only the traverseCalculations.
A workflow can enter and exit states multiple times. In all conditions, the following formula applies:
Status Cycle Status
This measure returns the duration spent in state that the object is currently in.
Status cycle time in process for a status =ETL run start date minus the earliest entry date into the status.
In the example w
FTR Measures First Time Right Meastate without a single rejeprovides an insight on the agreement that the initiator and sign-off approver have on the routed document. Agile PLM BI has the following types of FTR Measures:
Closed FTR
These measures provide a count of the FTR objects in the ‘Closed’ state. You can obtain information about the Closed FTR objects which are in the ‘Complete’ and ‘Released’ state. In
se measures provide a count of the FTR objects that are closed withaddition, the
Cumulative FTR
These measures provide a cumulative count of the FTR objects. Cumulative counts are availafor ‘New’, ‘Complete’ and ‘Released’ states.
Open FTR
These measures list the nuco nt of Open FTRs which are in
24 Agile PLM Business Intelligence

Chapter 3: Understanding PLM Business Intelligence Subject Areas
Sign-off Measures Sign off Measures enable you to gain insight on the average time taken to sign-off the routed Change objects. In addition, they provide the following information:
Number of approvers
Number of reviewers
Percentage of approvers that signed off on the routed objects
These calculations are on the basis of general business rules or conditions specific to every sign-off
te
Number of approvals
Number of rejected objects
measure.
No Time stamps (combination of date and time) are used in the calculations. Sign-off cycle time takes into account the date only while Workflow cycle time considers Time stamps.
The various sign-off measures are:
Sign off Cycle Time
Sign off Cycle Time – in process
Sign-off Cycle time
1:
er is on the list of approvers or observers when the routable object enters the sign off status.
t
esult:
the date on which the object entered the sign-off status
n
stat
observers.
Condition
Us
The user is not removed from the list of reviewers from the date on which the routable objecenters the sign off status
R
Sign-off Duration = Sign-off date minus
Co dition 2:
User is added to the list of approvers or observers after the routable object enters the sign-off us.
Result:
Sign-off Duration = Sign-off date minus the date on which the user was last added to the list of approvers or
v3.1 Page - 25

Agile PLM BI User Guide
Sign-off Cycle Time – in Process
Condition 1
n the list of approvers or observers when the routable object enters the sign off status
t tus
rvers after the routable object enters the sign-off
Sign-off Du
For a Chan and
AMLs ad of the numbe
User is o
The user is not removed from the list of reviewers from the date on which the routable objecenters the sign off sta
Result:
Sign-off Duration = Current date minus the date at which the object entered the sign-off status.
Condition 2:
User is added to the list of approvers or obsestatus.
Result:
ration = Current date minus the date on which the user was last added to the list of approvers or observers.
Redline Measures ge or a set of Changes, Redline Measures provide a count of row modifications in the
Bill of Material or Approved Manufacturers List. These measures provide the number of BOMsded, modified, and deleted for a specific dimension. You can also obtain an average
r of items that change as a result of a redlining activity.
26 Agile PLM Business Intelligence

Chapter 3: Understanding PLM Business Intelligence Subject Areas
Measures in Subject Areas The following matrix displays the various Measures applicable to the Subject Areas:
l Matrices es illustra the va combin ion of Measures a Dimensio when y create
ports. This section consists of Model Matrices for all subject areas except Item-AML and Item ubject Areas.
rices for these two subject areas.
ModeThe Model Matric te lid at nd ns oureS
Note:
Refer the section ‘Working with Item AML and Item Subject Areas’ for detailed explanation and model mat
In the following matrices:
• x denotes valid combinations
v3.1 Page - 27

Agile PLM BI User Guide
• xx denotes valid combinations with restrictions. See Note below the matrix for explanation
• - denotes combinations that are not valid
The following matrix indicates valid combinations of Measures and Dimensions for a PLM Change
Model Matrix for PLM Change Subject Areas
Subject Area. Example: Change Orders Subject Area
Dimens ions >
Measures v
T ime Change Orders
Product Peop le Work f low F lags De f ined F ie lds
Volume x x x x x x x
Aging x x x x x x
Cycle Time x x x x x x x
Workflow x x x xx xx x x
FTR x x x x x x x
Sign-off x x x xx x x x
Redline x x x x x x x
Defined Measures x x x x x x x
Note
In the People dimensi r and Si r Groups are valid with Sign-off ure.
Workflow dimensi s folder,
cle me) dimension is valid with Wor ow Measure >S tus Cycle Time only
art (Total C le Time) and W w End (Total Cycle Time) dim nsions are valid with w > Total Cycle Time measures only
atrix for M Product Subject Areas
llowing matrix indicates valid comb ations of Measures and Dimens ct a. Example: PLM Product – Product Performan e
:
ons folder, Sign off Use gn off UseMeas
In the on
Workflow (Status Cy Ti kfl ta
Workflow StWorkflo
yc orkflo e
Model M PL
The fo in ions for a PLM ProduSubject Are c
28 Agile PLM Business Intelligence

Chapter 3: Understanding PLM Business Intelligence Subject Areas
Dimens ions >
Measures v
T ime I t ems F lags Peop le De f ined F ie lds
Item Volume x x x x x
Item s Ri k x x x x x
Mean Time x x x x x
Item e Ag x x x x x
Model Matrix for PLM Change – Item Changes Subject Area The llItem Changes Subject Area:
Item es
Orders Item Measures
Requests Item Measures
Item Measures
fo owing matrix indicates valid combinations of Measures and Dimensions for PLM Change –
Measures >
Dimensions v
Change OrdersMeasur
Mfr Change Change Stop Ships
Time x x x x
Items x x x x
Change Orders x - - -
Mfr. Change Orders
- x - -
Change equests
- - x - R
Stop Ships - - - x
Flags x x x x
People xx xx xx xx
Workflow xx xx xx xx
Defined Fields x x x x
Note:
The following is the list of valid combinations of the People and Work Flow dimensions with the
er
• Mfr Change Orders and Workflow (Mfr Change Orders) dimensions are valid with Mfr Change Orders Item measures only.
Measures:
• Change Orders and Workflow (Change Orders) dimensions are valid with Change OrdItem measures only.
v3.1 Page - 29

Agile PLM BI User Guide
• Change Requests and Workflow (Change Requests) dimensions are valid with Change Requests Item measures only.
• Stop Ships and Workflow (Stop Ships) dimensions are valid with Stop Ships Item measures only.
Additional Notes on Item AML and Product Performance Subject Areas It is important to understand the following common scenarios that form the basis of most of the Item, Mfr, and Item-AML reports. Scenario 1: When using Item-AML subject area, we recommend that you create Reports for the Global Items with latest effective revision that are not obsolete. Life cycle can be used as a dimension, but when there is more than one life cycle per revision, some aggregation of data may not be valid. Average of data may provide correct results in these use cases. Use the out of the box filter, ‘filter-latest item revisions’ to create reports that filter only the latest revision of the Item. The query used in the filter is as given below: Site is equal to / is in Global AND Change Class Type is equal to / is in Change Orders, Manufacturer Orders AND Is Latest Rev is equal to / is in YES AND Life Cycle is not equal to / is not in Obsolete AND REV is not null OR REV is not equal to / is not in Introductory Recommended Dimension: For simplified interpretation, we recommend you to use dimension and measure combinations from same dimension/measure group. For example Item dimensions with Item measures. For other combinations, interpretations may be necessary. The contexts within each measure provide explanation as required. Note:
Use Item Number, Rev, Site to get a detailed report by Item and revision. Use Item Number, Life cycle to get a detailed report of Items by life cycle.
30 Agile PLM Business Intelligence

Chapter 3: Understanding PLM Business Intelligence Subject Areas
Scenario 2: Some measures are appropriate for reports analyzing the trend over time. For example, AML split distribution in the past vs. present. In such situations, all versions of the Item need to be included with the Time dimension. Even obsolete items need to be included to get the correct analysis. Use the out of the box filter, ‘filter-all item revisions’ to create reports for all revisions of the Item. The query used in the filter is as given below: Site is equal to / is in Global AND Change Class Type is equal to / is in Change Orders, Manufacturer Orders AND REV is not null OR REV is not equal to / is not in Introductory Note: Inclusion of this filter does not automatically consider count of every revision of the item. For example, if there are two items with three released revisions each, the result for # Items released displays 2. When you combine the # Items released with Item number and revision, all revisions of every item are counted. Time dimension is not valid with measures such as Item Age within Item Subject Area and measures where aggregation is by averaging data. Life cycle can be used as a dimension, but when there is more than one life cycle per revision, some aggregation of data may not be valid. Summation of data gives correct result. Recommended filters: Site = Global; Class Type = Change Orders, Manufacturer Orders; Rev not equal to' Introductory' or not equal to NULL; Recommended Dimension: Time Use Item Number, Rev, Site to get a detailed report by Item and revision Use Item Number, Life cycle to get a detailed report of Items by life cycle. Note: You can also filter the detailed report by a specific item number, to view the trend of items over revision or life cycle. Important: Do not use the recommended filters and dimensions with the following measures: # Item with Pending Changes # Items (Prelim) # Items (All)
v3.1 Page - 31

Agile PLM BI User Guide
Note The filters in scenarios 1 and 2 may not give different results when combined with Item Measures and Item Dimensions. The results may be different when Item Measures are combined with Mfr or Mfr part dimensions. Similarly, the Mfr and Mfr Part measures exhibit different results when filters in scenarios 1 or 2 are used.
Agile PLM BI provides revision specific information for few measures and dimensions. Example: Description and AML. Calculations specific to the remaining Measures and Dimensions use the data specific to the latest revisions for all revisions.
Item Age Calculations This section explains the common implementation of Item Age Calculations.
Item Lifecycle Age (Effective Date) Aggregation Rule: Calculates the average across all the dimensions and the sum across Lifecycle State Dimension. For this measure, the value is calculated by averaging the values across all the dimensions such as Item, REV, Class type, and product families and summing across the life cycle state dimension. Example: 20547-D-003 has two life cycle states Pilot with age value of 38.89 and Production with age value of 49.00 20547-W-A1 has two life cycle states Obsolete with age value of -3.17 and Production with age value of 0.00 20547-W-B1 has two life cycle states Production with age value of 24.50 and Prototype with age value of 37.00 The expected value when lifecycle dimension is removed from the report is For 20547-D-003 - 87.89 (38.89+49.00) For 20547-W-A1 - -3.17(-3.17+0.00) For 20547-W-B1 - 61.50 (24.50+37.00)
Note The explanation is same for Item Lifecycle Age (Release Date).
32 Agile PLM Business Intelligence

Chapter 3: Understanding PLM Business Intelligence Subject Areas
Item Age (Effective Date) Aggregation Rule: Calculates the average across all the dimensions and the sum across REV Dimension. For this measure, the value is calculated by averaging the values across all the dimensions such as Item, Lifecycle, Class type, Product families and then it adds across the REV dimension. MCO not included. Example: 19024A80-005 has values 20, 29, 40 for revisions A, B and C respectively 19024A80-006 has values 29, 40 for revisions B and C respectively 19024A80-007 has values 20, 29, 40 for revisions A, B and C respectively The expected value when REV dimension is removed from the report is For 19024A80-005 - 89 (20+29+40) For 19024A80-006 - 69 (29+40) For 19024A80-007 - 89 (20+29+40)
Note The explanation is same for Item Age (Release Date).
How to interpret combinations For simplified interpretation, we recommend you to use dimension and measure combinations from the same dimension or measure group. Example: Item Dimensions with Item Measures. For interpretations on other combinations, refer the Appendix: Interpretation Matrix.
v3.1 Page - 33


Chapter 4
Understanding PLM BI Dashboards This section discusses
Dashboards
Guided Navigation
Out-of-the-box Security Groups
Role-based Dashboards
d functional Dashboards available in Agile PLM BI application:
rmances
Manufacturer Orders
ple role-based Dashboards available in Agile PLM BI application:
Dashboards Agile PLM BI provides various dashboards based on relevant measures and dimensions created using appropriate Agile PLM cover page attributes. These dashboards are classified into the following groups:
Product Changes
Product Engineering
Product Quality
The followi oards available: ng are the types of dashb
Functional Dashboards
Functional Dashboards The following are the Standar
Customer Complaints
Non-Confo
CAPA
Audits
Change Orders
Sample Role-based dashboards The following are the sam
v3.1 Page - 35

Agile PLM BI User Guide
Quality Executive
Quality Manager
Quality Analyst
Change Analyst
Component Engineer
Component Manager
Commodity Manager
Configuration Manager
VP Engineering
The le briefl ery stand board pa
following tab y describes ev ard Dash ge:
Dashboard Descr ipt ion Prompt Example Pages
Example Reports
Customer Complaints
and Cycle ailure
Complaints Type, Calendar Year
Overdue Complaints
complaints, Overdue complaints by Aging
Provides comprehensive and actionable insight into various aspects of Customer Complaints - trends, Open/Overdue volumes,time and Fmodes.
Complaint Trends,
Top 10 product lines based on closed
Non-Conformance Reports
ycle time
NCR Type, Calendar Year
ew – NCR, Item NCR
to
Affected Items by Trend
Provides comprehensive and actionable insight into various aspects of NCR's - trends, open/overdue volumes, cand failure modes.
Overvi Failure Mode PareAnalysis, NCR
Corrective and Preventive Actions
ends, A and
CAPA Type, Calendar Year
CAPA Trends, Cycle Time
CAPA Status Cycle Time by Dimensions
Provides comprehensive and actionable insight into various aspects of CAPA - tropen CAPcycle time.
Closed CAPA by Dimensions, Open
Audits Provides
t
Audit Type, Calendar Year
Audit Trends, Open Audits
comprehensive and actionable insigh
Audit CumulativeTrends,
36 Agile PLM Business Intelligence

Chapter 4: Understanding PLM BI Dashboards
into Audits- trends, Top 5 Suppliers open audits and
cycle time. based on OpenAudits
Change Analyst o track hanges
and pending
Change Analyst, Quarter
Change nts on e
Enables you tsubmitted c
approvals
Submitted Issues,
Documents
Open Change Orders by Status, DocumePending ChangOrders
Change Orders
s uests
Year, Quarter, Change Order Type
nge Orders, Item Changes arts
undergoing change by Part Type
Provides the ability to analyze volume, cycle time and trendsof Change Orders. It also provides the ability to analyze the trends and reasonfor Change Reqand Stop Ships.
Open Cha Open Change Orders Aging by Dimensions, P
Configuration Manager
ith
nary, Year, Quarter, Product Lines
Process Effectiveness Change
Orders by Workflow Type
Enables you to manage the Change Order process wthe ability to measure Cycle time and Volume. The analyses help you toidentify issues related to process.
Quarter, Prelimi
Team Effectiveness,
Change Orders Aging by Change Analyst, Number of Closed
Manufacturer Orders
e and trends
Quarter, Month, Mfr Change Type
Cycle Time, Item Mfr Order
cturer
Changes Cumulative Trends
Manufacturer Order functional dashboard provides the ability to analyze volume, cycle timof Manufacturer Orders.
Year, Mfr Order Trends, Open Mfr Orders,
Open ManufaChange Orders by Dimensions,
Quality Executive
d
ds, nd
e
Product Line, Calendar Year
Product Line Performance CAPA
Volume and Cycle Time
Provides Quality Executive with comprehensive anhigh-level view of complaint trenfailure modes aproduct linperformance.
Year and Item Failure Mode, NCR Affected Items by Failure Mode, Closed
Quality Manager
s of quality in
d Product line, Year Quarter Month Supplier
Performance
d Time,
NCR Trend by Supplier
Provides comprehensive visibility into all aspectone or more product lines.
Year an Product Line Performance,
Complaints Trenand Cycle
Quality Analyst o Not Applicable ed ts by Enables analysts t Submitt Open Complain
v3.1 Page - 37

Agile PLM BI User Guide
track and manage Issues, Open s
Status, Open NCRs open complaints, NCR and CAPA.
Issue by Days Open
Component Engineer
k
nd on
r, ator,
ear,
NPI Manufacturer
rt
rs nt
Enables you to tracprogress of newly created parts asign-off progress Manufacturer Change Orders.
Mfr Part CreatoItem CreManufacturer (AML), Manufacturer, YQuarter
Manufacturer pawithout Item, Top 10 Manufacturebased on AML couby Mfr part preference status
Component Manager
key Part
ager d
r, Product Lines, and Part family
NPI, Team Effectiveness
Part Family, Mfr Part Risk Effectiveness
Helps track risks such as AML (Approved Manufacturer List) risk, ManufacturerPart Risk, and Part risk. It also helps Component Mantrack newly createparts and their associated risks.
Year, Quarte New Mfr Parts and Risk coverage by
Commodity Manager
arts
of th
Commodity, Product Lines,
Commodity Analysis
dities by
Manufacturers based on AML Split
Enables you to trackManufacturer and Manufacturer Pbeing considered for New Product development. It helps in early visibilityrisks associated winew products.
Year, Quarter, NPI, Top Ten CommoPart Count,
Top N
VP Engineering
long h
between changes and design KPI.
Year, Product Lines Line Performance
with
Effectiveness, and Product Risk
Provides ability to monitor Product design, quality and risk information. It also helps evaluate effectiveness of Product lines akey parameters sucas mean time
NPI, Product ProductsPending Change, Design
38 Agile PLM Business Intelligence

Chapter 4: Understanding PLM BI Dashboards
The following table lists the standard Key Performance Indicators in Agile PLM BI 3.0 application:
KPI Descr ipt ion Page
Percentage Open Variance Indicates the variance between the expected and actual number of 'Open' items in Complaints, Audits, NCRs, CAPA, Change Orders, Change Analyst, Configuration Manager, and Manufacturing Orders dashboards.
Overview page in all functional dashboards
Percentage New Variance Indicates the variance between the expected and actual number of 'New' items in Complaints, Audits, NCRs, CAPA, Change Orders, Change Analyst, Configuration Manager, and Manufacturing Orders dashboards.
Overview page in all functional dashboards
Cycle Time Variance Indicates the variance between the expected and actual Cycle Time for items in Complaints, Audits, NCRs, CAPA, Change Orders, Change Analyst, Configuration Manager, and Manufacturing Orders dashboards.
Overview page in all functional dashboards
Guided Navigation Guided navigation aids users with insight into business issues and appropriate actions to take by guiding their exploration of results obtained from Oracle BI Answers. When based on common scenarios and best practices for your industry or organization, guided navigation allows users to see and analyze related issues by navigating to a related set of results, another dashboard, or a URL. Guided navigation is specified using the Dashboard Editor.
The functional dashboards contain a Guided Navigation section that appears conditionally based on certain Key Performance Indicators (KPIs). When the system detects that one of these KPIs has reached its pre-defined threshold, a link appears in the Guided Navigation section to guide you to a Summary report for further investigation.
v3.1 Page - 39

Agile PLM BI User Guide
The following table lists the sample alert names, threshold descriptions, and guided navigation target pages for the alerts that are delivered with the Agile PLM BI 9.2.1.5 application.
Guided Navigat ion L ink Name
Dashboard Page Condi t ion Navigat ion
Overdue Complaints Customer Complaints
Overview ("- Volume Measures"."# of Overdue Complaints - Not Released"/"- Volume Measures"."# of Open Complaints - Not Released")*100 >75
Customer Complaints --> Overdue Complaints Page
Open Complaints without Expected Resolution Date
Customer Complaints
Open Complaints
# of Open Complaints - without expected resolution date returns data
Open Complaints without Expected Resolution Date
Guided Nav Link 1 Quality Executive Overview Open Complaints are 10 % above last 12 month average
Open Complaints by Product Lines
Guided Nav Link 1 Quality Executive Overview New NCR last month are 10 % higher than the 12 month average
Open NCRs by Product Lines
Guided Nav Link 1 Quality Executive Overview CAPA cycle time is 10 % higher than the 12 month average
Closed CAPA Cycle Time by Product Lines
Guided Nav Link 1 Quality Executive Overview No Audits were conducted in last 6 months.
New Audits by Product Lines
Change Requests & Stop ships
Change Orders Overview Number of Open Change Requests and Stop Ships is greater than 90 days
Change Requests & Stop ships
Security Groups The following Groups are provided out of the box with Dashboard access as shown below:
Dashboard Dashboard pages Roles
Customer Complaints Overview
Complaint Trends
Open Complaints
Administrator, Engineering Manager, VP-Quality, Support Manager
40 Agile PLM Business Intelligence

Chapter 4: Understanding PLM BI Dashboards
Dashboard Dashboard pages Roles
Overdue Complaints
Cycle Time
Item Complaints
Support Manager does not have access to Item Complaints page and Item Quality subject area.
Non Conformance Reports Overview – NCR
NCR Trends
Open NCR
Overdue NCR
Cycle time
Item NCR
Administrator, Engineering Manager, VP-Quality
Corrective and Preventive Actions
Overview
CAPA Trends
Open CAPA
Cycle Time
Item CAPA
VP-Quality, Administrator
Audits Overview
Audit Trends
Open Audits
Cycle Time
Item Audits
VP-Quality, Administrator
Quality Executive Overview
Failure Mode
Product Line Performance
VP-Quality, Administrator
v3.1 Page - 41

Agile PLM BI User Guide
Dashboard Dashboard pages Roles
Quality Analyst Submitted Issues
Open Issues
Customer/Supplier Open
Quality Analyst , Administrator
Commodity Manager Summary
NPI
Commodity Analysis
Commodity Manager
Change Analyst Submitted Issues
Open Issues
Change Documents
Change Analyst
Change Orders Overview
Change Orders Trends
Open Change Orders
Cycle Time
Item Changes
Change Requests and Stop Ships
VP Engineering
Configuration Manager
Configuration Manager Summary
Team Effectiveness
Process Effectiveness
Configuration Manager
Manufacturer Orders Overview
Mfr Orders Trends
Open Mfr Orders
Cycle Time
Item Mfr Order
VP Engineering
Component Manager
Component Engineer
Component Engineer Summary
NPI
Manufacturer
Component Engineer
Component Manager Overview
NPI
Team Effectiveness
Component Manager
VP Engineering Overview
Product Line Performance
VP Engineering
42 Agile PLM Business Intelligence

Chapter 4: Understanding PLM BI Dashboards
Dashboard Dashboard pages Roles
NPI
User Authentication Details User Name Password
VP Quality vpq
Quality Manager Global qmg
Quality Manager ProductLine qmp
Quality Analyst qa
Engineering Manager em
Support Manager sm
VP Engineering null
Commodity Manager null
Component Manager null
Configuration Manager null
Component Engineer null
Change Analyst null
v3.1 Page - 43

Agile PLM BI User Guide
44 Agile PLM Business Intelligence

Appendix
Interpretation Matrix This matrix describes the interpretation of some combinations of Measures and Dimensions. The blank cells in the matrix indicate that the combinations are similar to the others in the same measure group.
Item – AML Subject Area
Dimens ions >
Measures v
I t em I tem.L i fecy le Mf r Mf r par t I t em-Mf r Par t junc t ion
Example : P re fer red S ta tus
T ime
Item Measures
Items (Released) Count of the released items in the system.
Count of the life cycles that the released items have traversed.
Count of the released items associated with the manufacturers. The association is by an ECO or MCO.
Count of the released items associated with the manufacturer parts.
Count of the released items associated with a preference status.
Count of the items released over time. When you combine Time dimension with a dimension in a different group such as Mfr.Part, it gives the number of item and revisions associated with this Mfr.Part.
Note:
For all Dimensions, except Time, the revision data (Latest revisions or all revisions) about an item in the result is based on the
v3.1 Page - 45

Agile PLM BI User Guide
Dimens ions >
Measures v
I t em I tem.L i fecy le Mf r Mf r par t I t em-Mf r Par t T ime junc t ion
Example : P re fer red S ta tus
recommended filters and dimensions used.
# Items with One Mfr only
Number of items associated with a single Manufacturer. When you combine with Product Line, it gives the number of Items within a Product Line that have only one Manufacturer.
Life cycle of Items that have one Mfr only
Mfr associated with the Item
Mfr Part associated with Item
Preferred status of the Mfr Part associated with the Item
# Items with One Mfr Part Only (Released Items)
Number of Items associated with a single Manufacturer Part. When combined with Product line, it gives number of Items within a Product line that has only one Manufacturer Part.
Life cycle of Items that have one Manufacturer Part only
Manufacturer associated with the Item
Manufacturer Part associated with Item
Preferred status of the Manufacturer Part associated with the Item
Mfr Part Measures
# Mfr. Parts Number of Mfr. Part associated with the Items belonging to a Product Line or any other Item dimension.
Example: How many Mfr.parts are
Number of Mfr Part associated with each life cycle transition of Item. This includes the current and past data.
Number of Mfr parts by Mfr dimension. This number considers only the Mfr.Parts associated to an Item.
Example: How
Number of Mfr.Parts by Mfr.Part dimension. Mfr.Part that is not associated with item is not considered. Example: How many Mfr.Parts are
Number of Mfr Part by Part preference status.
Example: How many Mfr Parts are preferred?
46 Agile PLM Business Intelligence

Chapter 4: Appendix
Dimens ions >
Measures v
I t em I tem.L i fecy le Mf r Mf r par t I t em-Mf r Par t T ime junc t ion
Example : P re fer red S ta tus
associated with the Product Line Leo?
many Mfr.Parts are manufactured by a specific manufacturer?
from Part family, 'Cable'?
# Mfr. Parts in Released Item
Number of Mfr. Part associated with the Released Items belonging to a Product Line or any other Item dimension.
Example: How many Mfr.parts are associated with the Product Line Leo?
Number of Mfr Part associated with each life cycle transition of Released Item. This includes the current and past data.
Number of Mfr parts by Mfr dimension. This count considers only the Mfr.Parts associated with a Released Item.
Example: How many Mfr.Parts are manufactured by a specific manufacturer?
Number of Mfr.Parts by Mfr.Part dimension. This count considers only the Mfr.Parts associated with a Released Item.
Example: How many Mfr.Parts are from Part family, 'Cable'?
Number of Mfr Part by Part preference status. This count considers only the Mfr.Parts associated with a Released Item.
Example: How many Mfr Parts are preferred?
# Mfr. parts on more than one Item
Item or Product Line to which Mfr.Parts that are on more than one Item is associated with.
Average Mfr. Parts per Released Item
Average number of Mfr. Parts per released revision of the Item by a specific dimension. Example : Product Line
Average number of Mfr Parts per Released Item by Life cycle.
Do not use Do not use Do not use
Mfr.Measures
v3.1 Page - 47
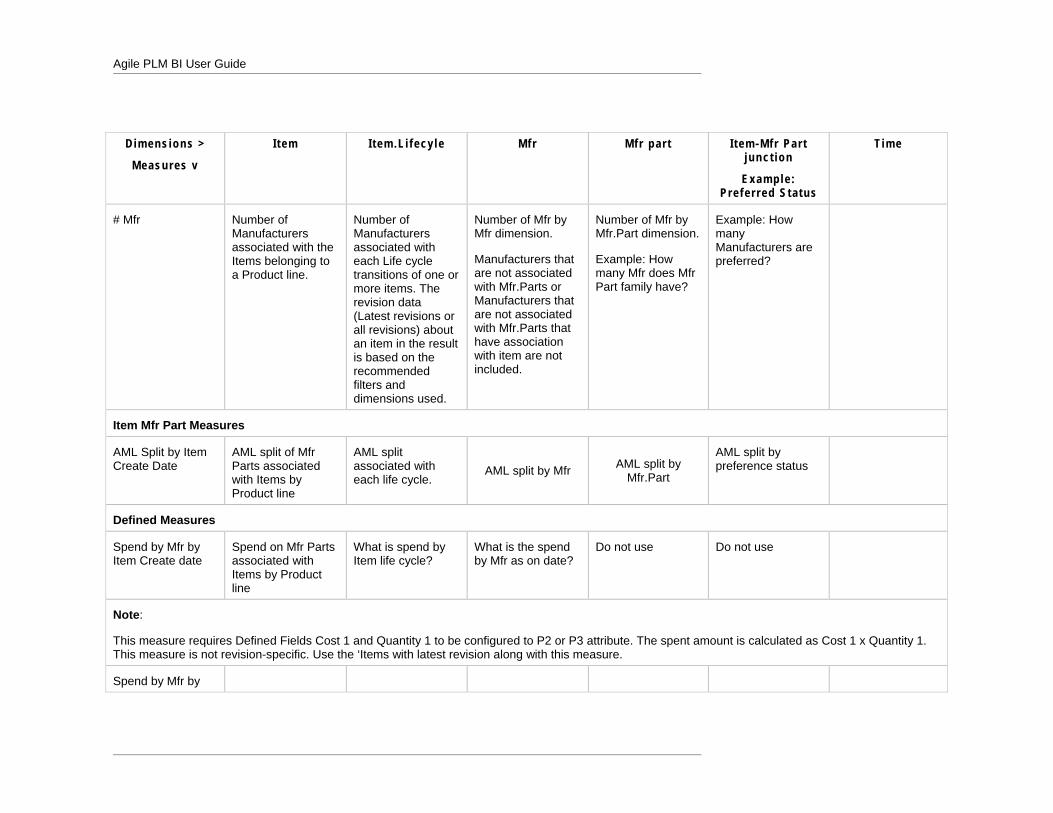
Agile PLM BI User Guide
Dimens ions >
Measures v
I t em I tem.L i fecy le Mf r Mf r par t I t em-Mf r Par t T ime junc t ion
Example : P re fer red S ta tus
# Mfr Number of Manufacturers associated with the Items belonging to a Product line.
Number of Manufacturers associated with each Life cycle transitions of one or more items. The revision data (Latest revisions or all revisions) about an item in the result is based on the recommended filters and dimensions used.
Number of Mfr by Mfr dimension.
Manufacturers that are not associated with Mfr.Parts or Manufacturers that are not associated with Mfr.Parts that have association with item are not included.
Number of Mfr by Mfr.Part dimension.
Example: How many Mfr does Mfr Part family have?
Example: How many Manufacturers are preferred?
Item Mfr Part Measures
AML Split by Item Create Date
AML split of Mfr Parts associated with Items by Product line
AML split associated with each life cycle.
AML split by Mfr AML split by Mfr.Part
AML split by preference status
Defined Measures
Spend by Mfr by Item Create date
Spend on Mfr Parts associated with Items by Product line
What is spend by Item life cycle?
What is the spend by Mfr as on date?
Do not use Do not use
Note:
This measure requires Defined Fields Cost 1 and Quantity 1 to be configured to P2 or P3 attribute. The spent amount is calculated as Cost 1 x Quantity 1. This measure is not revision-specific. Use the ‘Items with latest revision along with this measure.
Spend by Mfr by
48 Agile PLM Business Intelligence

Chapter 4: Appendix
Dimens ions >
Measures v
I t em I tem.L i fecy le Mf r Mf r par t I t em-Mf r Par t T ime junc t ion
Example : P re fer red S ta tus
Item Effective date
Item Subject Area
Dimens ions >
Measures v
I t em I tem.L i fecy le
Item - Age Sum of Item Age by revision.
Note:
For all the other dimensions, the result is an average of Item Age by revision.
Do not use with Life cycle.
Item Age by Life cycle Use this with Filter 1, for the latest revision. Sum of Item Age by Life cycle.
Note:
For all the other dimensions, the result is an average of Item Age.
For Item age, use the recommended filter 1, for the latest revision.
When using recommended filter 2 for latest revisions, use Item age in every instance except when you expose Life Cycle as a dimension. For the latter, use the Item Age by Life cycle.
Note Do not use Item and Revision in conjunction with Item age by Life cycle.
v3.1 Page - 49

Agile PLM BI User Guide
Product Performance Subject Area Dimens ions >
Measures v
I t em I tem.L i fecy le
Mean Time Between Cycles (MTBC) Recommend not to use with Life cycle since this is based on Item age.
Mean Time Between Design Failures (MTDF) Recommend not to use with Life cycle since this is based on Item age.
For Mean Time between Cycles, use the recommended filter 1 for latest revision. When using recommended filter 2 for all revisions, use Item-age only in all cases except when exposing life cycle as a dimension. If there are two repeating life cycles on an Item, the duration of each life cycle is averaged (not summed) thereby providing an inaccurate Mean Time Between Cycles, Mean Time Between Design Failures for Life cycle.
50 Agile PLM Business Intelligence