aging baby boomers 1 aging baby boomers anticipating boomers’ changing needs in cars pete montero
TRANSCRIPT

1
AGINGBABY BOOMERS
AGINGBABY BOOMERS
Anticipating Boomers’ Changing Needs in Cars
Pete Montero

2
AGINGBABY BOOMERS
Background
I. Societal TrendA. General Population Trends (“Age Wave”)
II. Market TrendA. DemographicsB. Purchase ReasonsC. Personal Attitudes
III. Effects of AgingA. Physiological ChangesB. Vehicle Safety C. Industry Efforts
IV. Attitudes Towards TechnologyA. Current Technology OwnedB. Future Feature PreferencesC. Research Results
V. RecommendationsA. SummaryB. Package LayoutC. FeaturesD. Execution
VI. Appendix
Contents

3
AGINGBABY BOOMERS
By 2010, the 65 & older age group will enter a period of accelerating growth, exceeding 40 million
I. Societal TrendA. Population Trend (“Age Wave”)
Population Trends (2000-2030)25.7%
24.9%24.1% 23.6%23.8%23.9%23.9%
19.7%
18.2%
16.3%
14.5%
13.0%12.4%12.4%
0
10,000,000
20,000,000
30,000,000
40,000,000
50,000,000
60,000,000
70,000,000
80,000,000
90,000,000
2000 2005 2010 2015 2020 2025 2030
0%
3%
6%
9%
12%
15%
18%
21%
24%
27%Under 18 (TTL)
Over 65 (TTL)
Under 18 (% of TTL)
Over 65 (% of TTL)
Population % of Total
SOURCE: U.S. Census Bureau

4
AGINGBABY BOOMERS
T tl Market A ge Dis tribution (2001-v-2006)
0%
2%
4%
6%
8%
10%
12%
14%
2001
2006
Shift in Large Car Age DistributionShift in Segment for Aging Buyer
Total Market Age Distribution shifting, with largest group now 55-59 yrs old. A high % of Large Car, Mid-size Car & Compact Van owners are Over 55 yrs old
Segment Age Distribution
0%
2%
4%
6%
8%
10%
12%
14%
16%
18%
Under
20
20-2
4
25-2
9
30-3
4
35-3
9
40-4
4
45-4
9
50-5
4
55-5
9
60-6
4
65-6
9
70-7
4
75-7
9
80-8
4
85-8
9
Compact CarMid-Size CarLarge CarCompact Van
SOURCE: Strategic Vision, 2006 NVES 3rd WAVE
II. Market TrendA. Demographics

5
AGINGBABY BOOMERS
Top 10 Most Important Purchase Reasons (by Age Group )
Older Large Car owners are more Price & Safety oriented, with Seat Comfort a unique Top 10; Younger owners are more Style, Image & Fun-To-Drive oriented
II. Market TrendB. Purchase Reasons
SOURCE: Strategic Vision, 2006 NVES 3rd WAVE
All Ages 60 & Over
Exterior Styling
12.04%A Well Made
Vehicle11.54%
A Well Made Vehicle
10.59%Price Or Deal
Offered11.26%
Price Or Deal Offered
9.36%Exterior Styling
9.43%
Value For The Money
7.17%Value For
The Money8.76%
Reliability 6.16% Reliability 6.21%
Riding Comfort
4.82%Safety
Features4.10%
Fuel Economy
3.69%Riding
Comfort3.70%
Power & Pickup
3.21%Power & Pickup
2.58%
Safety Features
2.81%Interior
Roominess2.34%
Interior Roominess
2.39%Seating comfort
2.06%
6
AGINGBABY BOOMERS
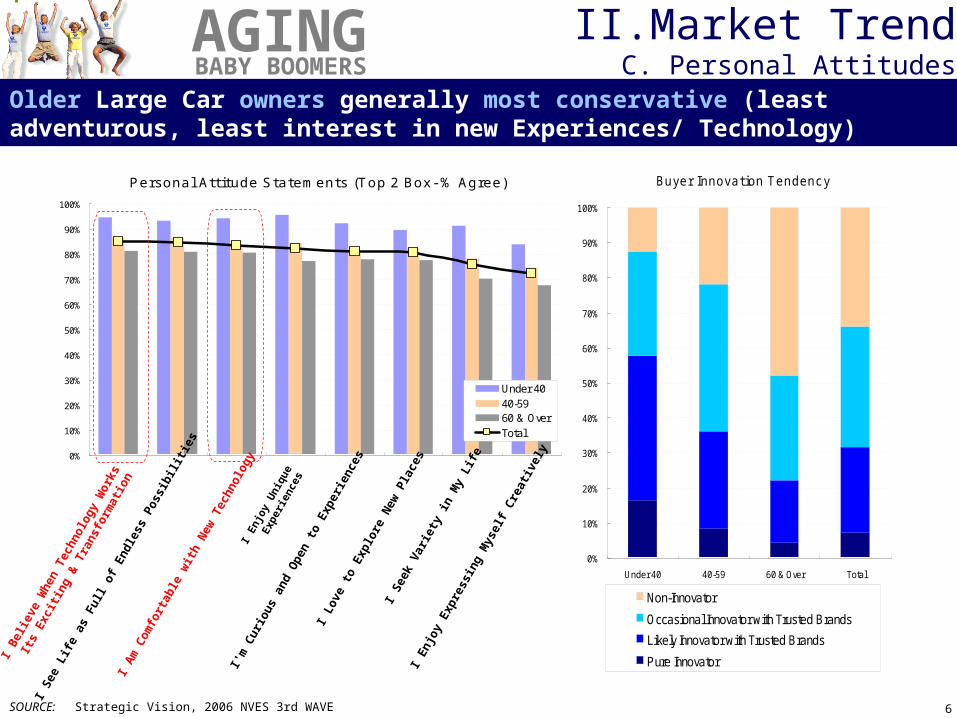
Personal Attitude Statements (Top 2 Box- % Agree)
0%
10%
20%
30%
40%
50%
60%
70%
80%
90%
100%
Under 4040-5960 & OverTotal
Older Large Car owners generally most conservative (least adventurous, least interest in new Experiences/ Technology)
II. Market TrendC. Personal Attitudes
I See
Life
as
Full
of E
ndle
ss P
ossi
bilit
ies
I Bel
ieve
Whe
n Te
chno
logy
Wor
ks It
s
Exc
iting
& T
rans
form
atio
nI A
m C
omfo
rtab
le w
ith N
ew T
echn
olog
y
I Enj
oy U
niqu
e E
xper
ienc
es
I'm C
urio
us a
nd O
pen
to E
xper
ienc
es
I Lov
e to
Exp
lore
New
Pla
ces
I See
k V
arie
ty in
My
Life
I Enj
oy E
xpre
ssin
g M
ysel
f Cre
ativ
ely
SOURCE: Strategic Vision, 2006 NVES 3rd WAVE
Buyer Innovation Tendency
0%
10%
20%
30%
40%
50%
60%
70%
80%
90%
100%
Under 40 40-59 60 & Over Total
Non-Innovator
Occasional Innovator with Trusted Brands
Likely Innovator with Trusted Brands
Pure Innovator
"Statements that best describe you…"
7
AGINGBABY BOOMERS
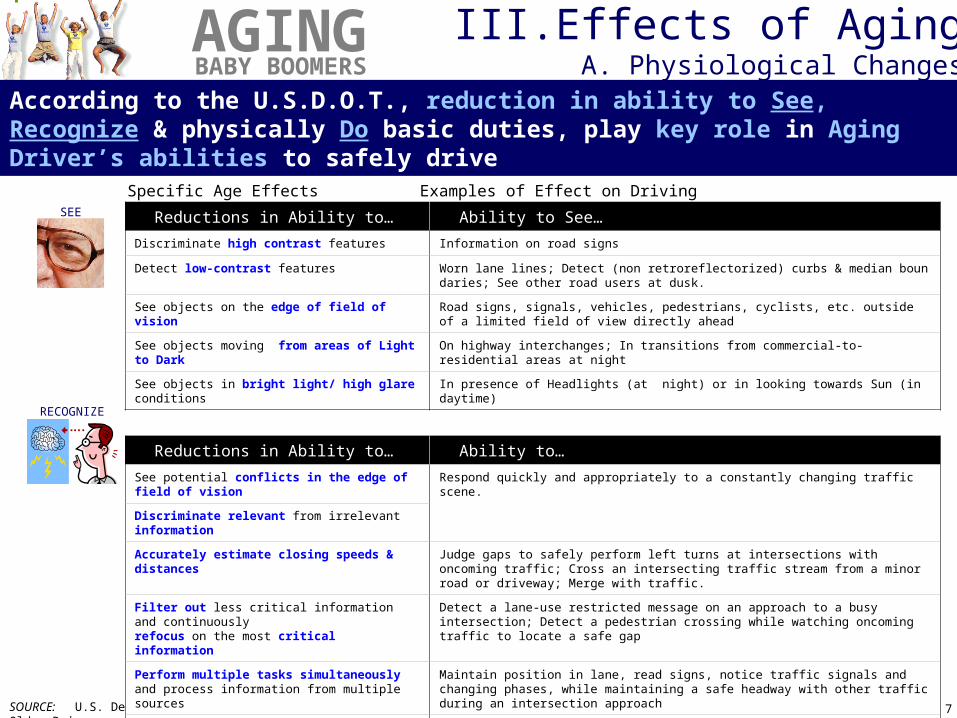
According to the U.S.D.O.T., reduction in ability to See, Recognize & physically Do basic duties, play key role in Aging Driver’s abilities to safely drive
III. Effects of AgingA. Physiological Changes
SOURCE: U.S. Dept. of Transportation, Federal Highway Administration- Guidelines & Recommendations to Accommodate Older Drivers and Pedestrians
SEE
RECOGNIZE
Reductions in Ability to… Ability to…
Ability to See…
Specific Age Effects Examples of Effect on Driving
Reductions in Ability to… Ability to See…
Discriminate high contrast features Information on road signs
Detect low-contrast features Worn lane lines; Detect (non retroreflectorized) curbs & median boundaries; See other road users at dusk.
See objects on the edge of field of vision Road signs, signals, vehicles, pedestrians, cyclists, etc. outside of a limited field of view directly ahead
See objects moving from areas of Light to Dark On highway interchanges; In transitions from commercial-to-residential areas at night
See objects in bright light/ high glare conditions In presence of Headlights (at night) or in looking towards Sun (in daytime)
Reductions in Ability to… Ability to…
See potential conflicts in the edge of field of vision Respond quickly and appropriately to a constantly changing traffic scene.
Discriminate relevant from irrelevant information
Accurately estimate closing speeds & distances Judge gaps to safely perform left turns at intersections with oncoming traffic; Cross an intersecting traffic stream from a minor road or driveway; Merge with traffic.
Filter out less critical information and continuously refocus on the most critical information
Detect a lane-use restricted message on an approach to a busy intersection; Detect a pedestrian crossing while watching oncoming traffic to locate a safe gap
Perform multiple tasks simultaneously and process information from multiple sources
Maintain position in lane, read signs, notice traffic signals and changing phases, while maintaining a safe headway with other traffic during an intersection approach
Store & retrieve information for later use Carry out a series of navigational instructions while negotiating in heavy traffic
Quickly understand & respond to changing conditions
Make a decision about what response is appropriate for specific road & traffic conditions, and then make a vehicle control movement such as steering and/or braking

8
AGINGBABY BOOMERS
Reductions in … Ability to…
Head/Neck Flexibility Rapidly glance in each direction from which a vehicle conflict may be expected in a given situation ; Comfortably execute "left-right-left" check before crossing an intersection ; Look over shoulder before merging with traffic or changing lanes
Spinal (Shoulder, Back & Pelvic) Flexibility
Arm & Leg Strength Quickly shift (the right foot) from accelerator to brake pedal when the situation demands ; Apply correct pressure for appropriate speed control ; Smooth, accurate arm movements to safely maneuver the car around obstacles ; Quickly, accurately reach for interior controls
Arm & Leg Flexibility & Range of Motion
Sensitivity of Motion of Arms / Hands / Fingers & Legs / Feet
DO
Specific Age Effects Examples of Effect on Driving
Older Drivers’ Common Counter-measures (U.S. Department of Health and Human Services Administration on Aging)
• Most older persons avoid rush hour and drive fewer miles, shorter distances, and less at night.
• 2/3 of older adults who stop driving say it was because of physical impairments.
Older Drivers’ Common Counter-measures (U.S. Department of Health and Human Services Administration on Aging)
• Most older persons avoid rush hour and drive fewer miles, shorter distances, and less at night.
• 2/3 of older adults who stop driving say it was because of physical impairments.
Reach
III. Effects of AgingA. Physiological Changes
During night driving, I have difficulty reading road signs
Rear visibility on my vehicle is a concern
The simpler the displays and gauges are the better
I prefer gentle acceleration over a quick acceleration
I try to maintain a generous distance between my carand the vehicles around me
Strongly Agree Somewhat Agree
About 50%
According to the U.S.D.O.T., reduction in ability to See, Recognize & physically Do basic duties, play key role in Aging Driver’s abilities to safely drive

9
AGINGBABY BOOMERS
Drivers Over 65 have increasing rates of fatal vehicle crashes, higher than other age groups except teenagers & young adults (‘Per 100-million miles traveled’)
Driver Fatality Rate
(per 100-Million Vehic le Miles Traveled)
0
2
4
6
8
10
12
16 17 18 19
20-2
4
25-2
9
30-3
4
35-3
9
40-4
4
45-4
9
50-5
4
55-5
9
60-6
4
65-6
9
70-7
4
75-7
9
80-8
4
85+
Driver Age Group
Fa
talit
y R
ate
Older Driver Safety Facts & StatisticsMore susceptible to medical complications from crash injuries & more likely to die from injuries.
Crash Types• About half of fatal crashes involving drivers 80 years and older
occur at intersections and involve more than one vehicle. This compares with 23 percent among drivers up to age 50.
• Older drivers don't deal as well as younger ones with complex traffic situations, and multiple-vehicle crashes at intersections increase markedly with age.
III. Effects of AgingB. Vehicle Safety
SOURCE: FARS 2001National Highway Transportation Safety Administration (NHTSA)
Injuries

10
AGINGBABY BOOMERS
UNIVERSAL DESIGN (Industrial Design principle)
Clearly distinct from designing Adaptive Equipment only for the physically handicapped• Helps people with limitations lead a more “normal” life but also makes product easier to use for general public a
nd, just as importantly, does so with beautiful aesthetics.• Instead of just providing products that are needed, provide aspirational product that is wanted
SOURCE: 2002 IDSA National Education Conference (Published Paper by Michael A. Kahwaji)Universal Design- How Do we Understand It? An Establishment of Tools to Understand Universal Design(QUOTE)- Center for Universal Design
Automatic DoorDoor HandleDoor Knob
Difficult to grip & open, especially while carrying objects
Most “universal”; No strength or
dexterity required
Easy opening door for those with limited grip strength
LEAST MOST
“Design of products, communications & built environments to be usable by all people, to the greatest extent possible, without adaptation or specialized design.”
III. Effects of AgingC. Industry Efforts
CORPORATE EXAMPLE

11
AGINGBABY BOOMERS
SOURCE: GfK NOP 2007AutoWeek (April 2, 2007); Ford Motor Company, North Carolina State University (ncsu.edu
OEMs beginning to study physical limitations and evaluate vehicle design with Older Driver’s needs in mind
“Third Age Suit” helps Ford engineers to understand Older Driver’s maneuverability & design vehicle appropriately
• Added bulk to restrict movement in knees, elbows, stomach and back• Gloves which reduce the sense of touch• Goggles that simulate cataracts
The 2000 Focus was the first Ford product to benefit from extensive use of the suit (Package & Ergonomics)
• More Headroom than any competitor Ease of Ingress/Egress, Comfort• Class-leading H-point Ease of Ingress/Egress, Visibility
Weights on wrists limit
movement & generate fatigue
Goggles simulate different eye conditions
Ear plugs reduce hearing
Gloves reduce tactile sensation and dexterity
Weights on ankles limit movement & generate fatigue
Armbands & bulky clothing restrict arm
movement
III. Effects of AgingC. Industry Efforts (Automotive)
12
AGINGBABY BOOMERS
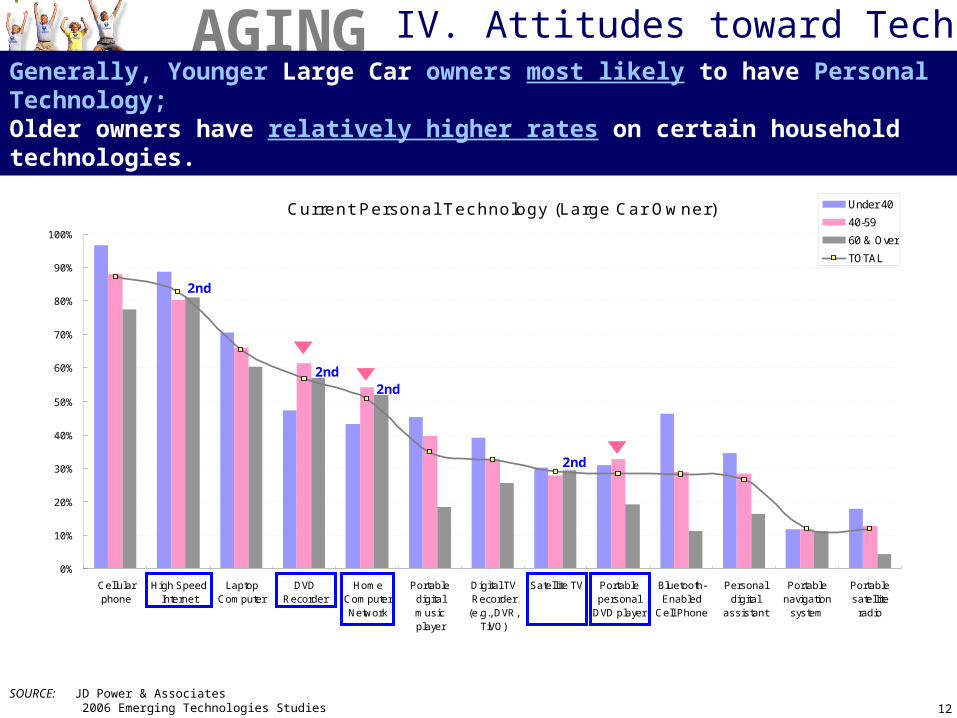
SOURCE: JD Power & Associates 2006 Emerging Technologies Studies
IV. Attitudes toward TechA. Current Technology Owned
Current Personal Technology (Large Car Owner)
0%
10%
20%
30%
40%
50%
60%
70%
80%
90%
100%
Cellularphone
High SpeedInternet
LaptopComputer
DVDRecorder
HomeComputerNetwork
Portabledigitalmusicplayer
Digital TVRecorder
(e.g., DVR,TiVO)
Satellite TV Portablepersonal
DVD player
Bluetooth-Enabled
Cell Phone
Personaldigital
assistant
Portablenavigation
system
Portablesatellite
radio
Under 40
40-59
60 & Over
TOTAL
2nd
2nd2nd
2nd
Generally, Younger Large Car owners most likely to have Personal Technology;Older owners have relatively higher rates on certain household technologies.

13
AGINGBABY BOOMERS
SOURCE: JD Power & Associates 2006 Emerging Technologies Studies
IV. Attitudes toward TechA. Current Car Technology Owned
Older Large Car owners most likely to have Safety related Feature such asESC, On-star (Emergency call), Side A-bags and Comfort feature (Heated Seats)
• But least likely to have New audio related Technology and Navi.
T ec hnology on Current Car (L arge Car Ow ner)
0%
10%
20%
30%
40%
50%
60%
70%
CD player capableof playing
additional form ats
Prem ium audiosys tem
Satellite radio Auxiliary Input Navigation sys tem(ins talled into
vehicle)
Heated seats Side im pactairbags
Stability control Personalass is tance safety
services
Under 40
40-59
60 & Over
TOTAL
14
AGINGBABY BOOMERS
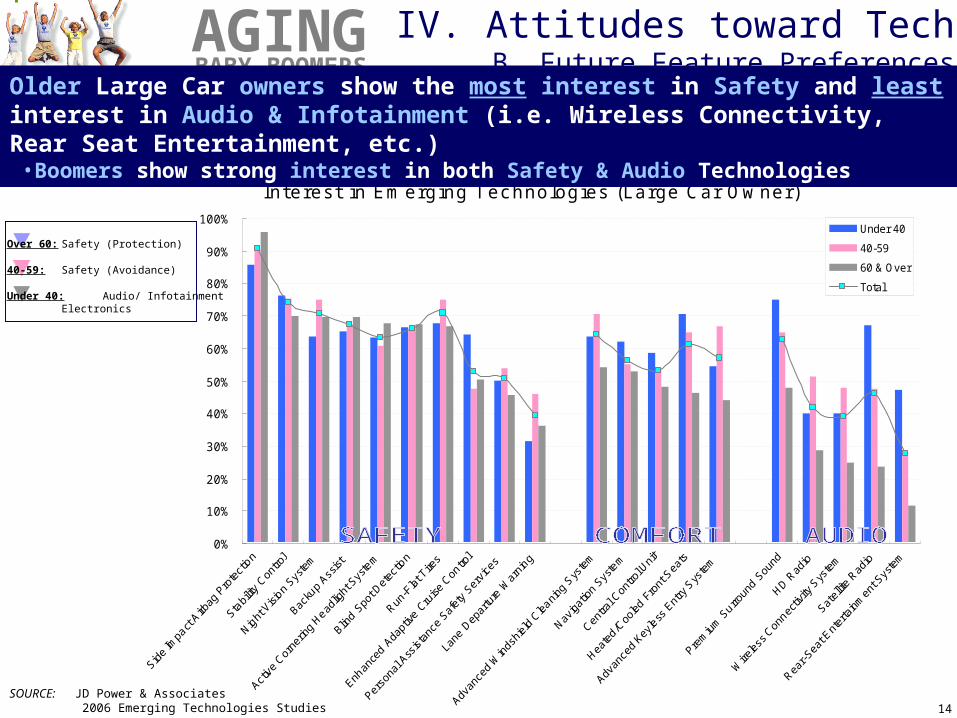
Interest in Emerging Tec hnologies (Large Car Ow ner)
0%
10%
20%
30%
40%
50%
60%
70%
80%
90%
100%Under 40
40-59
60 & Over
Total
SOURCE: JD Power & Associates 2006 Emerging Technologies Studies
Over 60: Safety (Protection)
40-59: Safety (Avoidance)
Under 40: Audio/ InfotainmentElectronics
Older Large Car owners show the most interest in Safety and least interest in Audio & Infotainment (i.e. Wireless Connectivity, Rear Seat Entertainment, etc.)
• Boomers show strong interest in both Safety & Audio Technologies
IV. Attitudes toward TechB. Future Feature Preferences

15
AGINGBABY BOOMERS
IV. Attitudes toward TechC. Research Results
Though all Ergonomic Areas are important to Older Drivers, Exterior Visibility, Enty/Exit & Interior Visibility are Most Important
Driver’s EnvironmentAdjustability
Entry/ Exit
Exterior Visibility
Interior Visibility
Switch & StorageAccessibility
MOSTIMPORTANT
1. Rear & Right Side Visibility (Parking & Lane Changes)MERITS: Five Hundred Tall Seating Position, Commanding View
DEMERITS: Avalon Thick C-pillar, Low-profile Rear Window, Tall Rear Deck 11
22
33
2.Side Sill Depth, Seat Height, A-pillar Intrusion & Reach to Door to CloseMERITS: Five Hundred Tall Seating Position, Tall Roof, Shallow/Narrow Side Sill
DEMERITS: All Others Long reach to Door (Women), Low Seat Height, Tall Side Sill
3.Quick identification of various Controls & DisplaysMERITS: Five Hundred Simple, Clear Display and Controls
DEMERITS: All Others Clutter, Controls look too much alike
Top 3 Important Ergonomic Areas
Inter-related

16
AGINGBABY BOOMERS
Though Safety, Comfort & Convenience are all important to Older Drivers, Safety is generally considered most important
MOSTIMPORTANT
SAFETY• Strong appeal, particularly to those with past accidents • Many recognize their driving ability has deteriorated • Many “crazy” drivers on the road, increasing danger
COMFORT• Some appeal because “I deserve creature comforts”
at this stage in life• “Older- Get tired sooner”
CONVENIENCE• Limited appeal for Communications features due to opposition to Phone usage while Driving• Some approval of “Hands-Free” tech (i.e. OnStar)
HOWEVER,“Flashy Technology would have been more important when I was Younger…”
OVERLAP
Safety & Comfort features overlap.
• “If I’m not comfortable, I’m probably not as safe of a driver.”
• “When you feel protected, you are naturally going to relax more and be more comfortable.”
IV. Attitudes toward TechC. Research Results

17
AGINGBABY BOOMERS
Recommendations

18
AGINGBABY BOOMERS
V. RecommendationsA. Summary
Focus first on Safety that provides triple layer protection (Warning, Avoidance & Protection), Comfort that helps Customer remain Alert yet Relaxed & Convenience that supports both
Overlap
1. SAFETY WARNINGAVOIDANCEPROTECTION
Active
Passive
Reactive
2. COMFORT ALERT (related to SAFETY-WARNING)
RELAXENTERTAIN
3. CONVENIENCE “DO FOR ME”EASE (related to COMFORT-RELAX)
INFORM (related to SAFETY-WARNING)
19
AGINGBABY BOOMERS
V. RecommendationsB. Package Layout
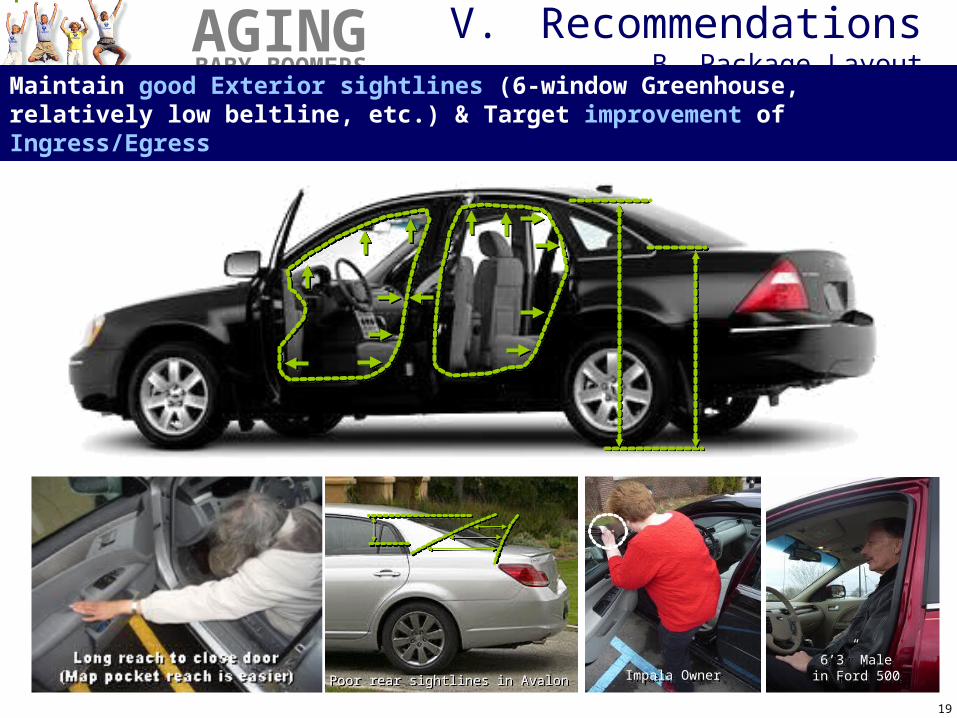
Maintain good Exterior sightlines (6-window Greenhouse, relatively low beltline, etc.) & Target improvement of Ingress/Egress
Poor rear sightlines in AvalonPoor rear sightlines in Avalon6’3” Male
in Ford 5006’3” Male
in Ford 500Impala OwnerImpala Owner

20
AGINGBABY BOOMERS
Improve Interior Reach and Visibility, with some re-location of key Interior components (Shifter, Console Armrest, Seat Controls, etc.)
V. RecommendationsB. Package Layout
Infiniti EX Concept
Shifter to same level as Center ArmrestShifter to same level as Center Armrest
Shifter back to same plane asSteering WheelShifter back to same plane asSteering Wheel
Seat Controls to Door Panel (as in Amanti)Seat Controls to Door Panel (as in Amanti)
Top of Center Stack back towards DriverTop of Center Stack back towards Driver
Raised height of ConsoleRaised height of Console
Extend front edge of Center Armrest to equal Door ArmrestExtend front edge of Center Armrest to equal Door Armrest
Toyota Avalon
Ford 500Offset Shifterto Driver side
of Console & Cupholder
alongside it (Avalon & 500)
Offset Shifterto Driver side
of Console & Cupholder
alongside it (Avalon & 500)
Kia AmantiSeat Controls to
Door PanelSeat Controls to
Door Panel
RELOCATE:Accessory controls out from behind S/W
RELOCATE:Accessory controls out from behind S/W
21
AGINGBABY BOOMERS
V. RecommendationsD. Execution
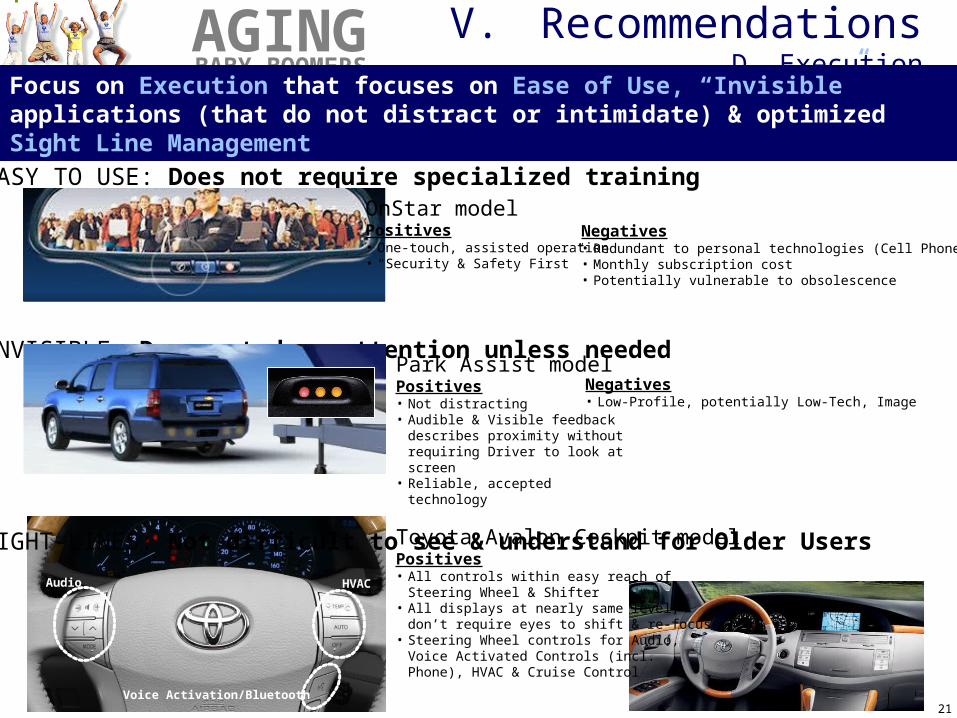
Focus on Execution that focuses on Ease of Use, “Invisible” applications (that do not distract or intimidate) & optimized Sight Line Management
1. EASY TO USE: Does not require specialized training
2. INVISIBLE: Does not draw attention unless needed
3. SIGHT-LINES: Not difficult to see & understand for Older Users
HVACAudio
Voice Activation/Bluetooth
OnStar modelPositives• One-touch, assisted operation• “Security & Safety First”
Negatives• Redundant to personal technologies (Cell Phone)• Monthly subscription cost• Potentially vulnerable to obsolescence
Park Assist modelPositives• Not distracting• Audible & Visible feedback
describes proximity without requiring Driver to look at screen
• Reliable, accepted technology
Negatives• Low-Profile, potentially Low-Tech, Image
Toyota Avalon Cockpit modelPositives• All controls within easy reach of
Steering Wheel & Shifter• All displays at nearly same level,
don’t require eyes to shift & re-focus• Steering Wheel controls for Audio,
Voice Activated Controls (incl.Phone), HVAC & Cruise Control

22
AGINGBABY BOOMERS
23
AGINGBABY BOOMERS
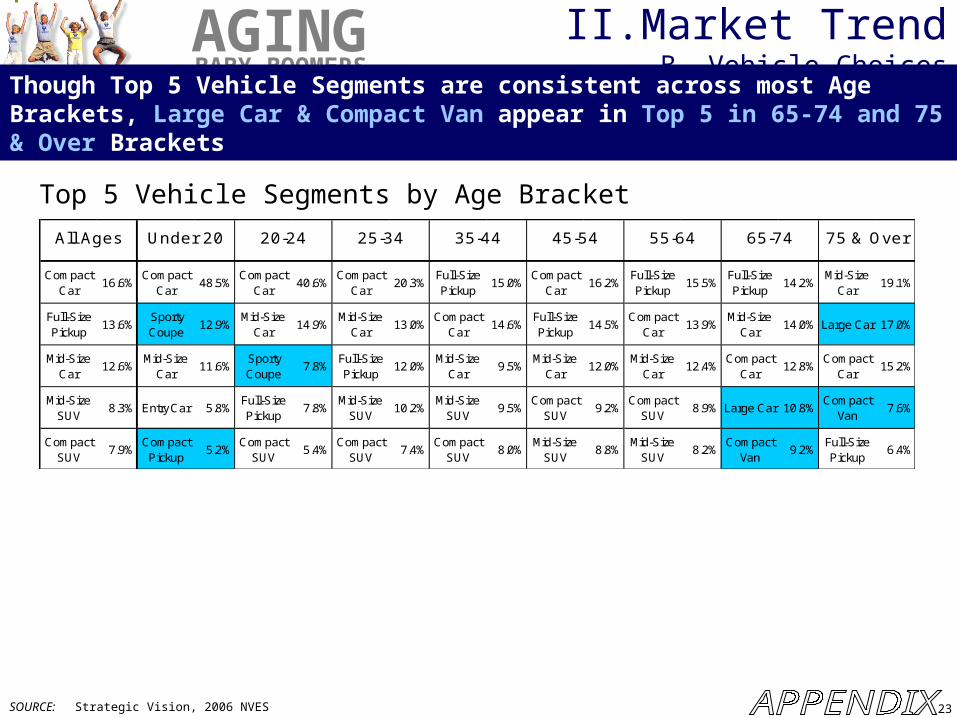
Top 5 Vehicle Segments by Age Bracket
SOURCE: Strategic Vision, 2006 NVES
Compact Car
16.6%Compact
Car48.5%
Compact Car
40.6%Compact
Car20.3%
Full-Size Pickup
15.0%Compact
Car16.2%
Full-Size Pickup
15.5%Full-Size Pickup
14.2%Mid-Size
Car19.1%
Full-Size Pickup
13.6%Sporty Coupe
12.9%Mid-Size
Car14.9%
Mid-Size Car
13.0%Compact
Car14.6%
Full-Size Pickup
14.5%Compact
Car13.9%
Mid-Size Car
14.0% Large Car 17.0%
Mid-Size Car
12.6%Mid-Size
Car11.6%
Sporty Coupe
7.8%Full-Size Pickup
12.0%Mid-Size
Car9.5%
Mid-Size Car
12.0%Mid-Size
Car12.4%
Compact Car
12.8%Compact
Car15.2%
Mid-Size SUV
8.3% Entry Car 5.8%Full-Size Pickup
7.8%Mid-Size
SUV10.2%
Mid-Size SUV
9.5%Compact
SUV9.2%
Compact SUV
8.9% Large Car 10.8%Compact
Van7.6%
Compact SUV
7.9%Compact Pickup
5.2%Compact
SUV5.4%
Compact SUV
7.4%Compact
SUV8.0%
Mid-Size SUV
8.8%Mid-Size
SUV8.2%
Compact Van
9.2%Full-Size Pickup
6.4%
Under 20 20-24 25-34 35-44All Ages 45-54 55-64 65-74 75 & Over
Though Top 5 Vehicle Segments are consistent across most Age Brackets, Large Car & Compact Van appear in Top 5 in 65-74 and 75 & Over Brackets
II. Market TrendB. Vehicle Choices
24
AGINGBABY BOOMERS
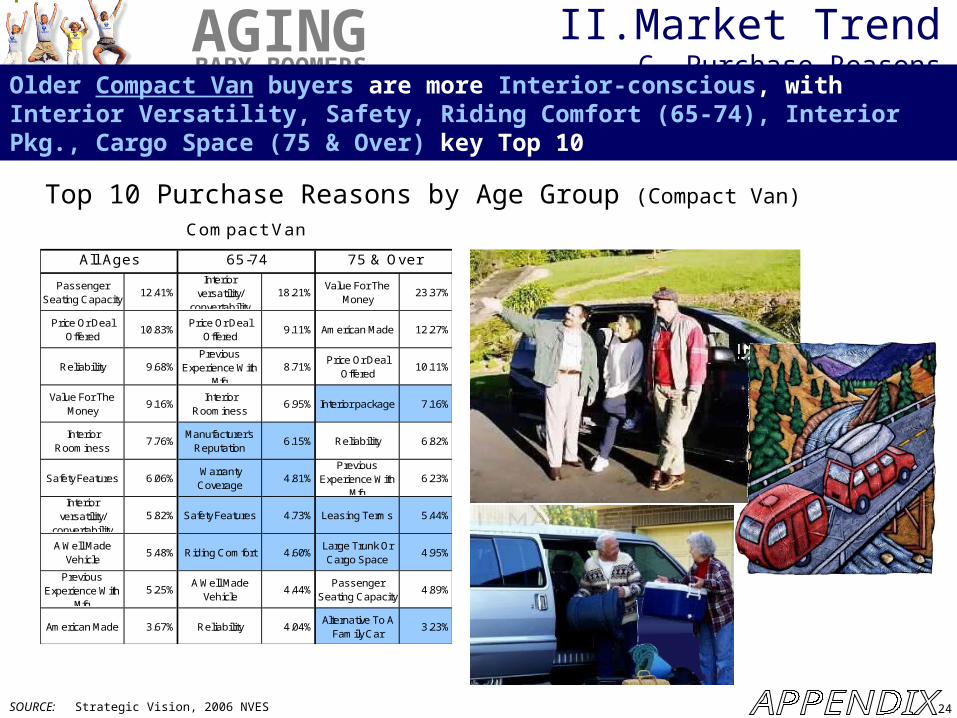
Top 10 Purchase Reasons by Age Group (Compact Van)
SOURCE: Strategic Vision, 2006 NVES
Older Compact Van buyers are more Interior-conscious, with Interior Versatility, Safety, Riding Comfort (65-74), Interior Pkg., Cargo Space (75 & Over) key Top 10
Passenger Seating Capacity
12.41%Interior
versatility/ convertability
18.21%Value For The
Money23.37%
Price Or Deal Offered
10.83%Price Or Deal
Offered9.11% American Made 12.27%
Reliability 9.68%Previous
Experience With Mfg
8.71%Price Or Deal
Offered10.11%
Value For The Money
9.16%Interior
Roominess6.95% Interior package 7.16%
Interior Roominess
7.76%Manufacturer's
Reputation6.15% Reliability 6.82%
Safety Features 6.06%Warranty Coverage
4.81%Previous
Experience With Mfg
6.23%
Interior versatility/
convertability
5.82% Safety Features 4.73% Leasing Terms 5.44%
A Well Made Vehicle
5.48% Riding Comfort 4.60%Large Trunk Or Cargo Space
4.95%
Previous Experience With
Mfg
5.25%A Well Made
Vehicle4.44%
Passenger Seating Capacity
4.89%
American Made 3.67% Reliability 4.04%Alternative To A
Family Car3.23%
Compact Van
All Ages 65-74 75 & Over
II. Market TrendC. Purchase Reasons

25
AGINGBABY BOOMERS
Personal Emotional Des ires
3.003.103.203.303.403.503.603.703.803.904.004.104.204.304.404.504.604.704.804.905.00 Under 40
40-5960 & OverTotal
Top Emotional Desires (What Owners Want for Themselves & in Their Vehicles)
SOURCE: Strategic Vision, 2006 NVES
Older Large Car owners are most likely to want to feel Safe, Free & Confident while also most likely to want Sophisticated Style & Refinement in their vehicle
P ersonal Vehic le Emotional Des ires
3.003.103.203.303.403.503.603.703.803.904.004.104.204.304.404.504.604.704.804.905.00 Under 40
40-5960 & OverTotal
II. Market TrendD. Personal Attitudes
26
AGINGBABY BOOMERS
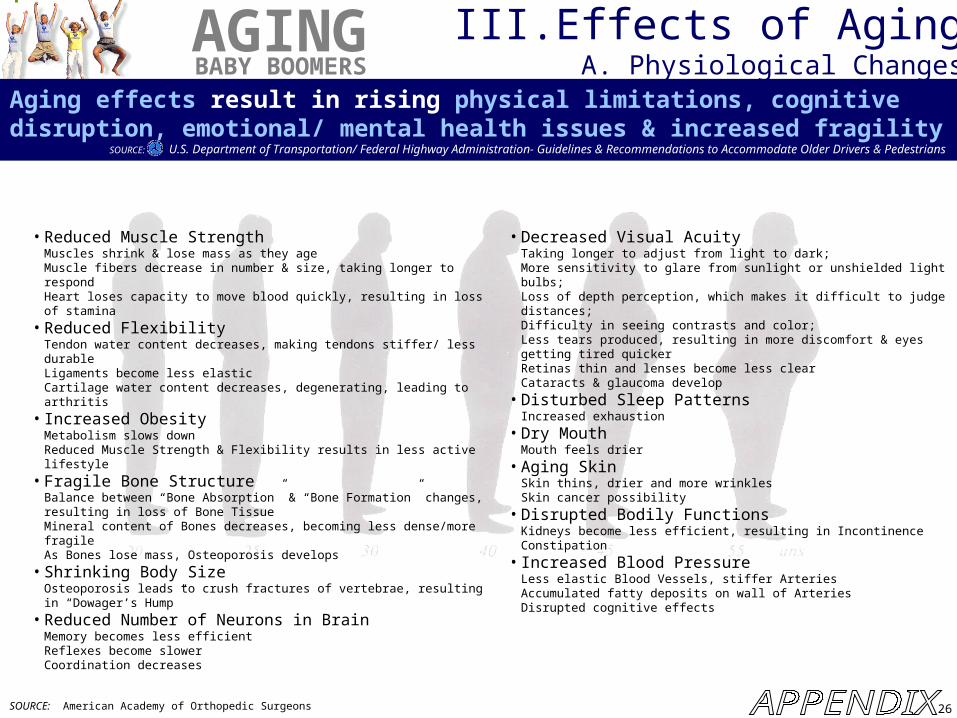
• Reduced Muscle StrengthMuscles shrink & lose mass as they ageMuscle fibers decrease in number & size, taking longer to respondHeart loses capacity to move blood quickly, resulting in loss of stamina
• Reduced FlexibilityTendon water content decreases, making tendons stiffer/ less durableLigaments become less elasticCartilage water content decreases, degenerating, leading to arthritis
• Increased ObesityMetabolism slows downReduced Muscle Strength & Flexibility results in less active lifestyle
• Fragile Bone StructureBalance between “Bone Absorption” & “Bone Formation” changes, resulting in loss of Bone TissueMineral content of Bones decreases, becoming less dense/more fragileAs Bones lose mass, Osteoporosis develops
• Shrinking Body SizeOsteoporosis leads to crush fractures of vertebrae, resulting in “Dowager’s Hump”
• Reduced Number of Neurons in BrainMemory becomes less efficientReflexes become slowerCoordination decreases
SOURCE: American Academy of Orthopedic Surgeons
Aging effects result in rising physical limitations, cognitive disruption, emotional/ mental health issues & increased fragility
SOURCE: U.S. Department of Transportation/ Federal Highway Administration- Guidelines & Recommendations to Accommodate Older Drivers & Pedestrians
III. Effects of AgingA. Physiological Changes
• Decreased Visual AcuityTaking longer to adjust from light to dark; More sensitivity to glare from sunlight or unshielded light bulbs; Loss of depth perception, which makes it difficult to judge distances; Difficulty in seeing contrasts and color; Less tears produced, resulting in more discomfort & eyes getting tired quickerRetinas thin and lenses become less clearCataracts & glaucoma develop
• Disturbed Sleep PatternsIncreased exhaustion
• Dry MouthMouth feels drier
• Aging SkinSkin thins, drier and more wrinklesSkin cancer possibility
• Disrupted Bodily FunctionsKidneys become less efficient, resulting in IncontinenceConstipation
• Increased Blood PressureLess elastic Blood Vessels, stiffer ArteriesAccumulated fatty deposits on wall of ArteriesDisrupted cognitive effects

27
AGINGBABY BOOMERS
SOURCE: Medical Conditions and Driving: A Review of the Literature (1960-2000), September 2005US Department of Transportation, National Highway Traffic Safety Administration
According to the U.S.D.O.T., Visual & Cognitive factors, along with Motor Skill degradation play key role in Aging Driver’s abilities to safely drive
III. Effects of AgingB. Relevance to Driving Performance
Begins to deteriorate around 40, Sharp deterioration after age of 60
20% between 45 & 54 experience difficulties hearing vs. 75% between 70 & 79
Individuals with hearing loss tend to compensate with increase visual attentiveness
No significant association demonstrated between impaired hearing & injury collision
Estimated that 90% of information required for driving is acquired visually
Decreased static & dynamic visual acuity
- Static visual acuity occurs at later age and progresses slowly
- Deterioration in dynamic visual acuity
begins earlier & accelerates faster
- Dynamic visual acuity may be more reliable predictor for crash probability
Decreased temporal fields
Decreased resistance to Glare
Reduced low luminescence vision
Strongest predictor of crashes was size of useful field of vision (UFOV)
Neck & Trunk Mobility, Range of Motion (Extremities)lead to correlated reductions in physical driving abilities
Ability to place self in “space” without applying other senses;A motorist would not be able to steer or use the foot pedals while looking at the road ahead, without Proprioception
Motor Response & Reaction Times are known to increasewith Age, though studies suggest that central processing changes are major contributor to slowing response times.
The ability to selectively attend to target stimulus in presence of distracters - Significant age differences, with older
adults affected by presence ofirrelevant stimulus
- Age differences in ability to locate task
relevant information on visual field
The process of alternately monitoring two or more sources of input - Though relationship to normal aging
needs further study, patients with mild Alzheimer’s have impaired ability to
disengage
Tied to Useful Field of Vision, the ability todistill information in dynamically changingconditions, recognizing emerging inputs early in orderto respond appropriately - Visual attention at Pre-Attentive level one of better
predictors for Crash frequency.
Alzheimer’s is the most common form of dementia - Degenerative disorder impairs multiple cognitive funtions - Early symptoms include difficulties in recent memory,
orientation and concentration - Slowed rates of information processing, attention deficits
impairments in language & perception eventuallyinterfere with driving ability
Aging
Driver
Dementia
Motor Decline
Cognitive
Decline
Sensory
Decline
Vision
Flexibility
Range of
Motion
Stre
ngth
Proprio-ceptionR
eact
ion
Tim
eMot
orRe
spon
ses
Pre-
Attentio
n
Selective
Attention
AttentionSwitching
Hea
ring

28
AGINGBABY BOOMERS
SOURCE: Avoiding Crashes: Older Drivers and Sports Cars, Daniel Formosa, Ph.D. , Smart Design USA, New York, NYAutomobile Instrument Panel Design: Reach Capabilities of Younger and Older Drivers. Daniel Formosa, Doctoral thesis at New York University
Every reach to an Instrument Panel target results in some loss of control & is less accurate for Older Drivers, though all ages experience this to some degree
• Reaches closest to & furthest from the steering wheel are most accurate while those to areas in-between – areas where most instrument panel controls are typically located – exhibit less accuracy
– Proprioceptors, sensors in the arm that detect and signal back to the brain the positions of the arm and hand, appeared to be more accurate at closer, flexed arm positions, and at further, more extended positions
• Older drivers made slightly faster (and less accurate) reach movements in order to more quickly return hand to wheel • Reaches, across all age groups, tended to consistently be below and to the right of actual target location (“over-reaching”)
Study with New York University• Timing & Accuracy of In-Vehicle reaches to I/P• Glance times• Effect on Steering Accuracy• 23 intended targets positioned at intersections of
grid lines shown here• Left-side steering wheels• Each driver reached with his or her right hand
20-40 yr olds) 60-80 yr olds
NOTE: Bigger Ellipses= Larger variance of Reaches= More innacurate
Steering Wheel Steering Wheel
III. Effects of AgingB. Relevance to Driving Performance

29
AGINGBABY BOOMERS
August, 2003 Public Site for Self-Assessment
Assessing Your Driving Skills
Answer the following questions for a quick, initial
assessment of your driving performance. Do you sometimes or frequently:
• Neglect to buckle up?• Have difficulty working the pedals?• Have difficulty merging onto freeways, or turning
onto busy streets?• Have trouble seeing other vehicles, cyclists or
pedestrians, especially at night?• Ignore or miss stop signs & other traffic signals?• React slowly to sirens and flashing lights of
emergency vehicles?• Weave, straddle lanes, drift into other lanes or
change lanes without signaling?• Get lost or disoriented easily, even in familiar
places?• Have near misses or collisions or get more traffic
tickets?• Take new medications or over-the-counter
medicines that may affect your driving?
November, 2004 Public Site for Care-Giver Assessment
Older Persons And Driving
• The number of older persons making trips is rapidly increasing, as is the frequency of those trips and the distance traveled.
• Most older persons avoid rush hour and drive fewer miles, shorter distances, and less at night.
• Collision rates decrease steadily with age. By the time a driver is 65, the risk of a major accident drops to less than 1%.
• Two-thirds of older adults who stop driving say it was because of physical impairments.
U.S. Department of Health and Human ServicesAdministration on Aging
Aging results in recognized degradation of driving skills, oftentimes resulting in drivers limiting themselves
III. Effects of AgingC. Vehicle Safety

30
AGINGBABY BOOMERS
Key Facts• Injuries brought on by Chest Compression & Rate of Compression (high)• Observed Age Effects contributing to injury risk are changes in Rib Angle, loss of Bone Density, reduction in Rib Cross-sectional Area an
d Decreases in Lung Elasticity• Hemo/Pneumothorax Injury is a punctured Chest cavity, with bleeding and air accumulation, often leading to collapsed lungs
SOURCE: Alterations in Body Compostion and Injury Patterns with AgingJonathan D. Rupp, Ph. D. of the Universtiy of Michigan Transportation Research Institute (UMTRI) and Stewart Wang, M.D., Ph.D. of the University of Michigan Trauma Burn CenterPresented at March, 2006 meeting of Crash Injury Research and Engineering Network (CIREN), Office of Human-Centered Research National Highway Traffic Safety Admin (NHTSA)
20 30 40 50 60 70 80Age
20 30 40 50 60 70 80Age
Though there is a correlation between Age & Severity of all injuries in Accidents, the greatest risk is for serious Thoracic Injuries (such as Rib Fractures, Hemo/ Pneumothoraces & Pulmonary Contusions)
III. Effects of AgingC. Vehicle Safety
31
AGINGBABY BOOMERS
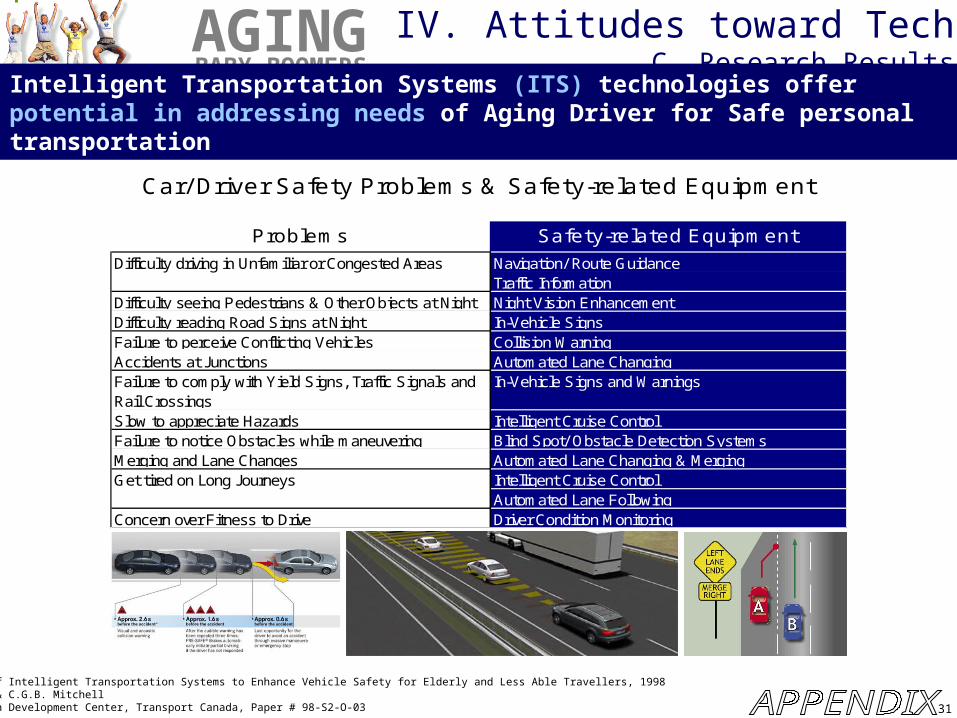
Problems Safety-related EquipmentNavigation/ Route GuidanceTraffic Information
Difficulty seeing Pedestrians & Other Objects at Night Night Vision EnhancementDifficulty reading Road Signs at Night In-Vehicle SignsFailure to perceive Conflicting Vehicles Collision WarningAccidents at Junctions Automated Lane ChangingFailure to comply with Yield Signs, Traffic Signals and Rail Crossings
In-Vehicle Signs and Warnings
Slow to appreciate Hazards Intelligent Cruise ControlFailure to notice Obstacles while maneuvering Blind Spot/ Obstacle Detection SystemsMerging and Lane Changes Automated Lane Changing & Merging
Intelligent Cruise ControlAutomated Lane Following
Concern over Fitness to Drive Driver Condition Monitoring
Get tired on Long Journeys
Difficulty driving in Unfamiliar or Congested Areas
Car/ Driver Safety Problems & Safety-related Equipment
SOURCE: Application of Intelligent Transportation Systems to Enhance Vehicle Safety for Elderly and Less Able Travellers, 1998S. Ling Suen & C.G.B. MitchellTransportation Development Center, Transport Canada, Paper # 98-S2-O-03
Intelligent Transportation Systems (ITS) technologies offer potential in addressing needs of Aging Driver for Safe personal transportation
IV. Attitudes toward TechC. Research Results

32
AGINGBABY BOOMERS
Projected
Number of People 65 and Over, 1960-2050 (Projected 2010-2050)
16.220.1
25.5
31.235
40.2
54.6
71.5
80
86.7
1.5 2.2 3.1
20.9
15.4
9.67.3
4.20.9
6.1
0
10
20
30
40
50
60
70
80
90
100
Years
Nu
mb
er
(x 1
,000,0
00)
65 and Over85 and Over
65 and Over 16.2 20.1 25.5 31.2 35 40.2 54.6 71.5 80 86.7
85 and Over 0.9 1.5 2.2 3.1 4.2 6.1 7.3 9.6 15.4 20.9
1960 1970 1980 1990 2000 2010 2020 2030 2040 2050
SOURCE: Older Americans (Update 2006) Key Indicators of Well BeingFederal Interagency Forum on Aging: Related Statisics
US Census Bureau, Decennial Census and Projections
Projected
By 2050, the 65 & older age group will total 86.7 million
I. Societal TrendA. Population Trend (“Age Wave”)
33
AGINGBABY BOOMERS
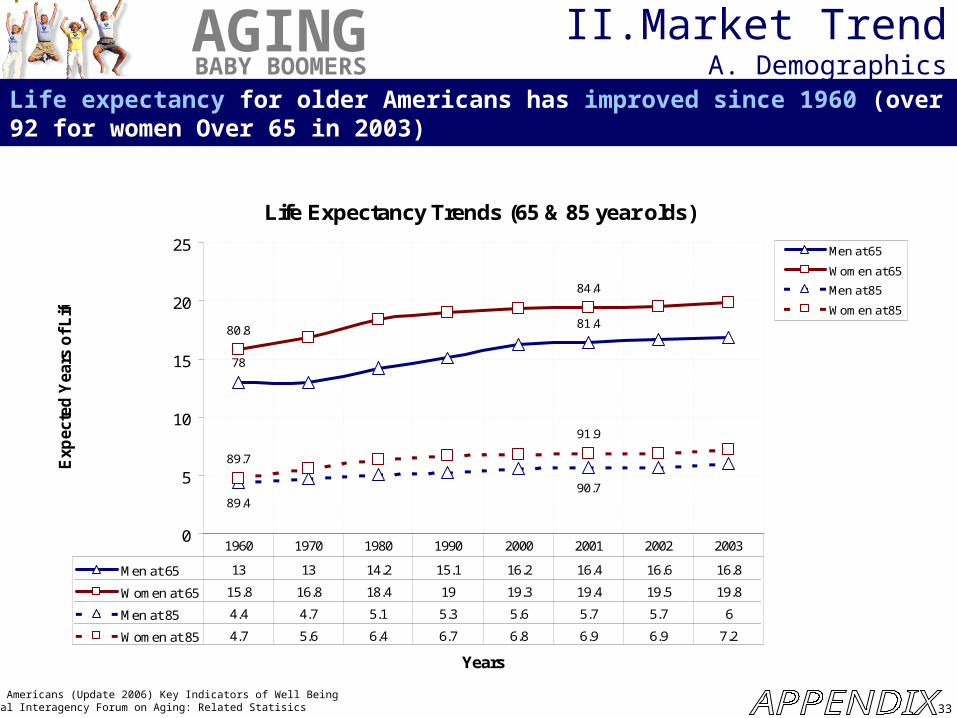
Life Expectancy Trends (65 & 85 year olds)
78
81.480.8
84.4
90.789.4
91.9
89.7
0
5
10
15
20
25
Years
Exp
ecte
d Y
ear
s o
f L
ife
Men at 65
Women at 65
Men at 85
Women at 85
Men at 65 13 13 14.2 15.1 16.2 16.4 16.6 16.8
Women at 65 15.8 16.8 18.4 19 19.3 19.4 19.5 19.8
Men at 85 4.4 4.7 5.1 5.3 5.6 5.7 5.7 6
Women at 85 4.7 5.6 6.4 6.7 6.8 6.9 6.9 7.2
1960 1970 1980 1990 2000 2001 2002 2003
SOURCE: Older Americans (Update 2006) Key Indicators of Well BeingFederal Interagency Forum on Aging: Related Statisics
Life expectancy for older Americans has improved since 1960 (over 92 for women Over 65 in 2003)
II. Market TrendA. Demographics

34
AGINGBABY BOOMERS
% of People Over 65 reporting any trouble Hearing or Seeing, 2004
0
10
20
30
40
50
60
%
Men Women
Men 47.7 14.4
Women 33.9 18.7
Any Trouble Hearing Any Trouble Seeing
SOURCE: Older Americans (Update 2006) Key Indicators of Well BeingFederal Interagency Forum on Aging: Related StatisicsCenters for Disease Control and Prevention, National Center for Health Statistics, National Health Interview Survey
Vision problems are more common with Women Over 65 than with Men; Hearing problems are more common with Men Over 65 than with Women
III. Effects of AgingA. Physiological Changes

35
AGINGBABY BOOMERS
% of People Over 65 with Moderate or Severe Memory Loss, 2002
0
2
4
6
8
10
12
14
16
18
20
%
65 and Over65-6970-7475-79
65 and Over 14.9 11.2
65-69 7.8 3.1
70-74 10.9 6.1
75-79 17.2 11.2
Men Women
SOURCE: Older Americans (Update 2006) Key Indicators of Well BeingFederal Interagency Forum on Aging: Related StatisicsHealth and Retirement Study
Memory loss increase significantly among Men & Women over the age of 75
III. Effects of AgingA. Physiological Changes
36
AGINGBABY BOOMERS
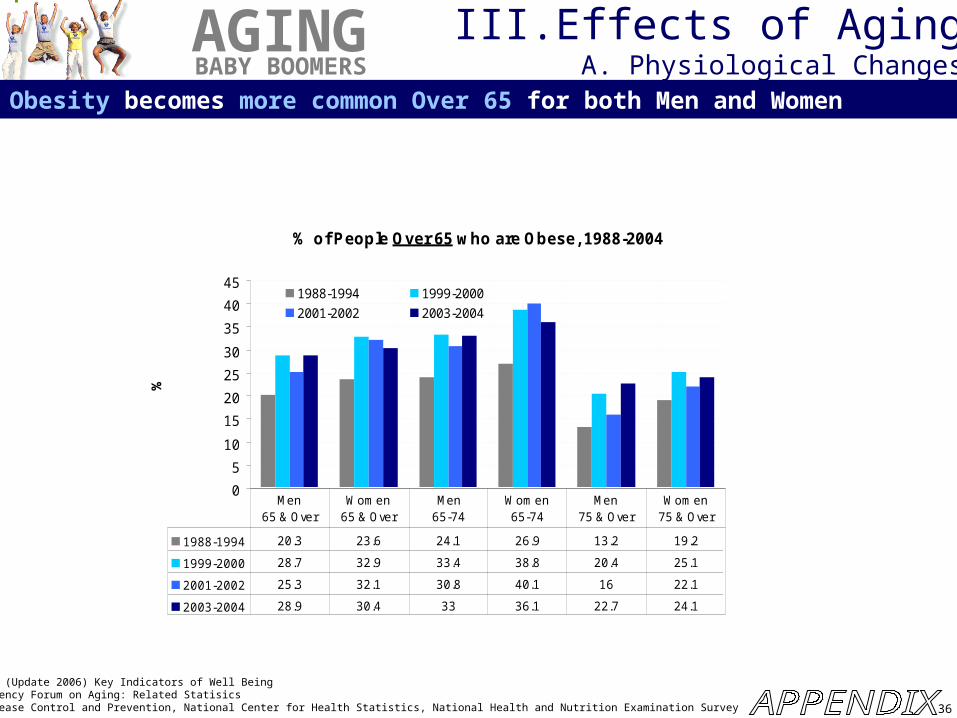
% of People Over 65 who are Obese, 1988-2004
0
5
10
15
20
25
30
35
40
45
%
1988-1994 1999-2000
2001-2002 2003-2004
1988-1994 20.3 23.6 24.1 26.9 13.2 19.2
1999-2000 28.7 32.9 33.4 38.8 20.4 25.1
2001-2002 25.3 32.1 30.8 40.1 16 22.1
2003-2004 28.9 30.4 33 36.1 22.7 24.1
Men65 & Over
Wom en65 & Over
Men65-74
Wom en65-74
Men75 & Over
Wom en75 & Over
SOURCE: Older Americans (Update 2006) Key Indicators of Well BeingFederal Interagency Forum on Aging: Related StatisicsCenters for Disease Control and Prevention, National Center for Health Statistics, National Health and Nutrition Examination Survey
Obesity becomes more common Over 65 for both Men and Women
III. Effects of AgingA. Physiological Changes
37
AGINGBABY BOOMERS
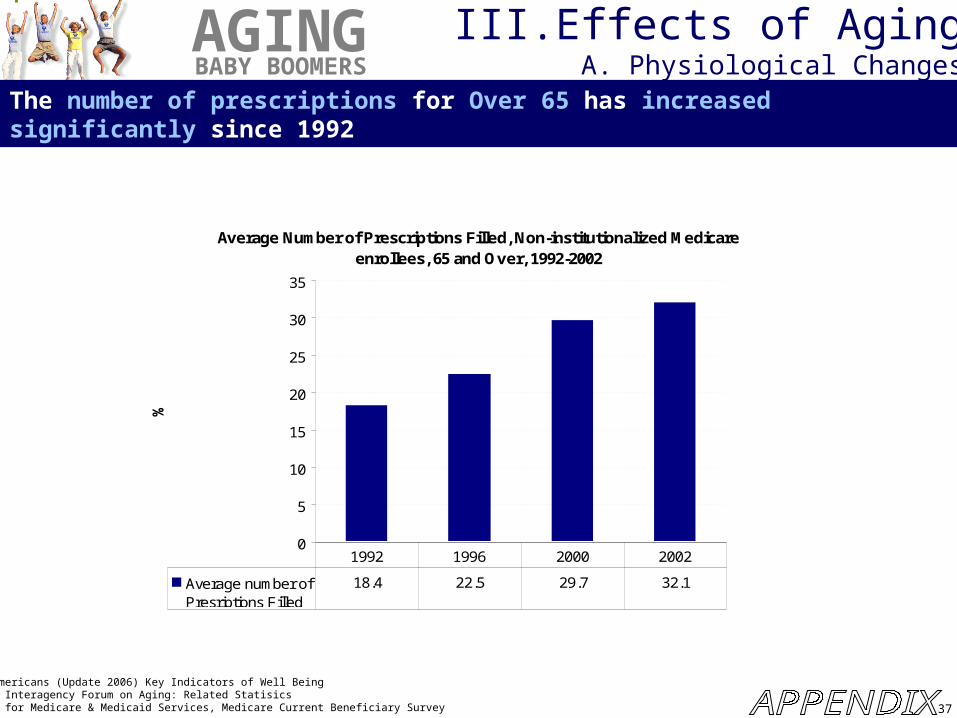
Average Number of Prescriptions Filled, Non-institutionalized Medicare enrollees, 65 and Over, 1992-2002
0
5
10
15
20
25
30
35
%
Average number ofPresriptions Filled
18.4 22.5 29.7 32.1
1992 1996 2000 2002
SOURCE: Older Americans (Update 2006) Key Indicators of Well BeingFederal Interagency Forum on Aging: Related StatisicsCenters for Medicare & Medicaid Services, Medicare Current Beneficiary Survey
The number of prescriptions for Over 65 has increased significantly since 1992
III. Effects of AgingA. Physiological Changes

38
AGINGBABY BOOMERS
According to the U.S. Dept. of Transportation, "per mile driven, drivers 75 years & older have higher rates of fatal vehicle crashes than other age groups except teenagers."
U.S. Department of TransportationFederal Highway Administration
AGING AND DRIVER CAPABILITIESReductions in AcuityThe ability to discriminate high contrast features
• Necessary for reading information on road signs.
Visual acuity of 20/40 with or without corrective lenses for both eyes or one blind eye is the predominant minimum standard for licensing for passenger car drivers throughout the U.S.
• An increasing number of states (including Pennsylvania, Maryland, New Jersey, Florida, Illinois, and others) grant restricted license to low-vision drivers with acuities as poor as 20/70 to 20/100
• Restrictions may include daytime only, area, and speed limitations.
Aging is also associated with yellowing of the eyes' lenses and increased density (or thickening). • Affects the way color is perceived • Reduces the amount of light reaching retina, making low light vision more difficult

39
AGINGBABY BOOMERS
According to the U.S. Dept. of Transportation, "per mile driven, drivers 75 years & older have higher rates of fatal vehicle crashes than other age groups except teenagers."
U.S. Department of TransportationFederal Highway Administration
AGING AND DRIVER CAPABILITIESReductions in Contrast SensitivityThe ability needed to detect low-contrast features
• Necessary for seeing worn lane lines, detect (non retro-reflectorized) curbs & median boundaries and see other road users at dusk.
Begins to decline after about age 40, as a result of normal aging• Age 61and Over have an increasing risk for the development of cataracts & other eye conditions
that reduce contrast sensitivity. • Many people with reductions in contrast sensitivity are not aware that their vision is impaired
Some people with “perfect” 20/20 visual acuity still have “cloudy” or washed out vision• Standard vision testing for vehicle licensing does not identify this condition
40
AGINGBABY BOOMERS
According to the U.S. Dept. of Transportation, "per mile driven, drivers 75 years & older have higher rates of fatal vehicle crashes than other age groups except teenagers."
U.S. Department of TransportationFederal Highway Administration
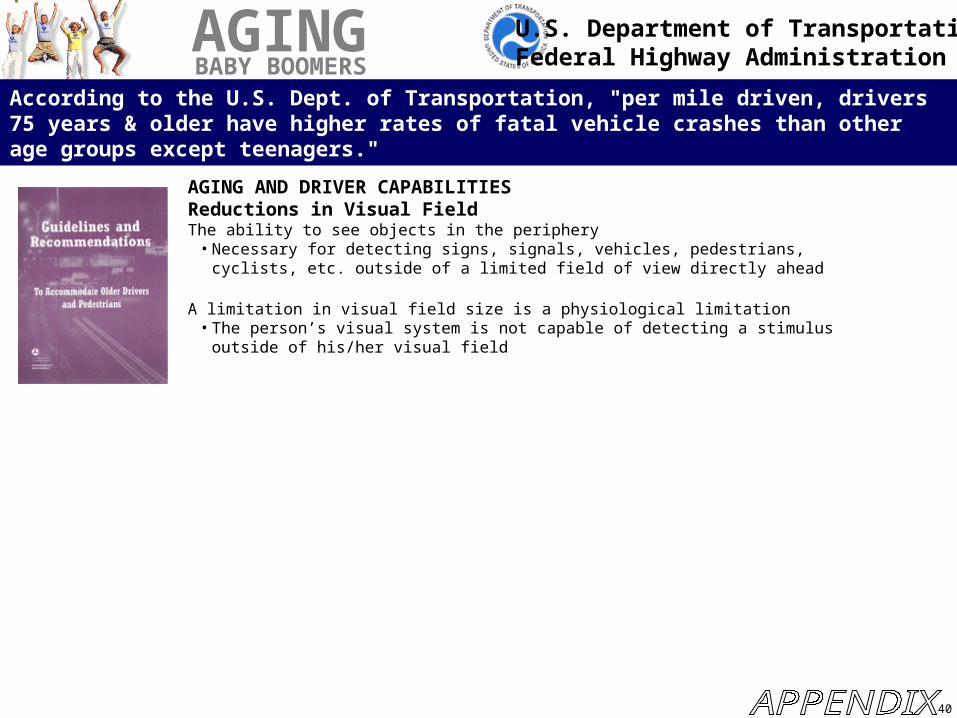
AGING AND DRIVER CAPABILITIESReductions in Visual FieldThe ability to see objects in the periphery
• Necessary for detecting signs, signals, vehicles, pedestrians, cyclists, etc. outside of a limited field of view directly ahead
A limitation in visual field size is a physiological limitation• The person’s visual system is not capable of detecting a stimulus outside of his/her visual field
41
AGINGBABY BOOMERS
According to the U.S. Dept. of Transportation, "per mile driven, drivers 75 years & older have higher rates of fatal vehicle crashes than other age groups except teenagers."
U.S. Department of TransportationFederal Highway Administration
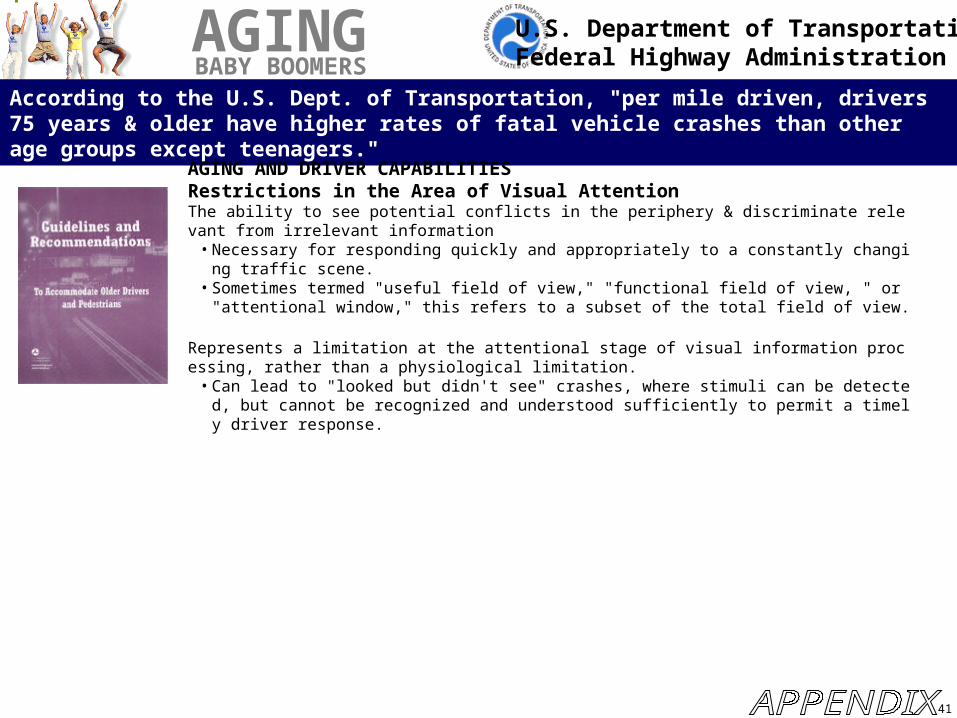
AGING AND DRIVER CAPABILITIESRestrictions in the Area of Visual AttentionThe ability to see potential conflicts in the periphery & discriminate relevant from irrelevant information
• Necessary for responding quickly and appropriately to a constantly changing traffic scene. • Sometimes termed "useful field of view," "functional field of view, " or "attentional window," this refe
rs to a subset of the total field of view.
Represents a limitation at the attentional stage of visual information processing, rather than a physiological limitation.
• Can lead to "looked but didn't see" crashes, where stimuli can be detected, but cannot be recognized and understood sufficiently to permit a timely driver response.

42
AGINGBABY BOOMERS
According to the U.S. Dept. of Transportation, "per mile driven, drivers 75 years & older have higher rates of fatal vehicle crashes than other age groups except teenagers."
U.S. Department of TransportationFederal Highway Administration
AGING AND DRIVER CAPABILITIESIncreased Sensitivity to GlareThe ability to see in the presence of oncoming headlights (at night) or sun glare in daytime
• Introduces stray light into the eye, reducing contrast of important safety targets.

43
AGINGBABY BOOMERS
According to the U.S. Dept. of Transportation, "per mile driven, drivers 75 years & older have higher rates of fatal vehicle crashes than other age groups except teenagers."
U.S. Department of TransportationFederal Highway Administration
AGING AND DRIVER CAPABILITIESSlower Dark AdaptationThe ability needed to see targets when moving from areas of light to dark
• Enables vision on highway interchanges, commercial-to-residential areas at night

44
AGINGBABY BOOMERS
AGING AND DRIVER CAPABILITIESDecreased Motion SensitivityThe ability needed to accurately estimate closing speeds and distances
• Enables driver to judge gaps in oncoming traffic in order to safely perform left turns at intersections, merge with traffic & cross traffic from a minor road or driveway
Age-related deficits in visual performance compounded by overall slowing of mental processes over the age of 70
• Declines demonstrated in attentional, decisional and response-selection functions
Selective AttentionThe ability to filter out less critical information & continuously re-focus on the most critical information
• Enables driver to detect lane-use restricted message on approach to busy intersection, a pedestrian crossing while watching oncoming traffic to locate a safe gap.
Divided AttentionThe ability to perform multiple tasks simultaneously and process information from multiple sources
• Enables accurate lane-keeping, reading signs, noticing traffic signals and changing phases, while maintaining a safe headway with other traffic during an intersection approach.
Perception-Reaction Time (PRT)The time required to make a decision about what response is appropriate for specific road and traffic conditions, and then make a vehicle control movement such as steering and/or braking.
• As mental processing of information slows with aging, PRT increases. As the complexity of the driving situation increases, PRT increases disproportionately for older motorists.
According to the U.S. Dept. of Transportation, "per mile driven, drivers 75 years & older have higher rates of fatal vehicle crashes than other age groups except teenagers."
U.S. Department of TransportationFederal Highway Administration

45
AGINGBABY BOOMERS
AGING AND DRIVER CAPABILITIESWorking MemoryThe ability to store, manipulate, and retrieve information for later use while driving
• Enables driver to carry out a series of navigational instructions while negotiating in heavy traffic; or remembering, integrating, and understanding successive phases of a changeable message sign
According to the U.S. Dept. of Transportation, "per mile driven, drivers 75 years & older have higher rates of fatal vehicle crashes than other age groups except teenagers."
U.S. Department of TransportationFederal Highway Administration
46
AGINGBABY BOOMERS
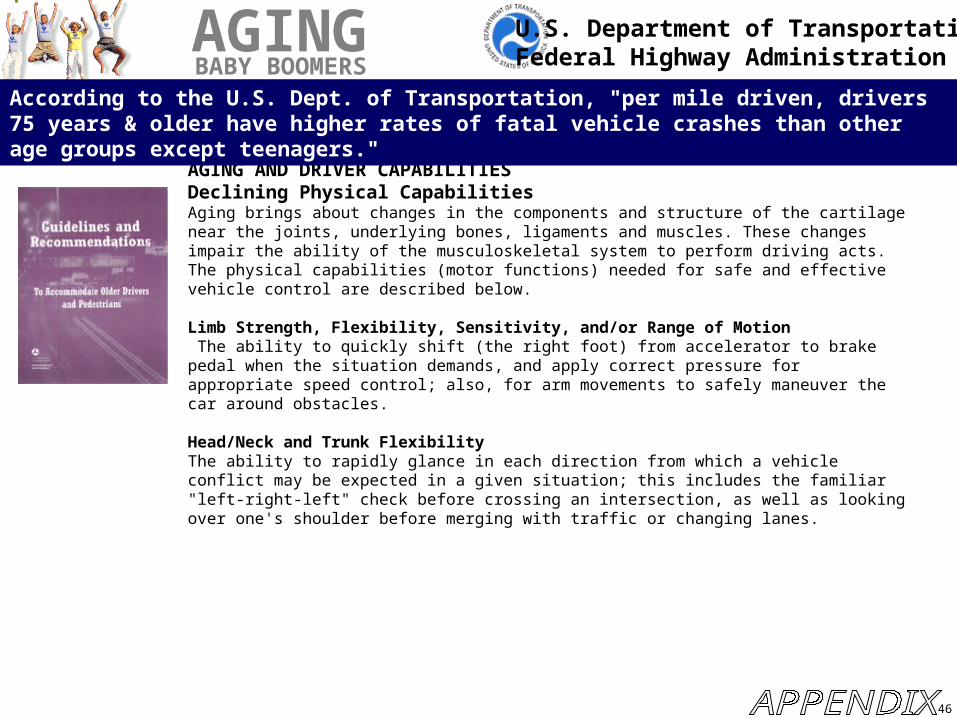
AGING AND DRIVER CAPABILITIESDeclining Physical CapabilitiesAging brings about changes in the components and structure of the cartilage near the joints, underlying bones, ligaments and muscles. These changes impair the ability of the musculoskeletal system to perform driving acts. The physical capabilities (motor functions) needed for safe and effective vehicle control are described below.
Limb Strength, Flexibility, Sensitivity, and/or Range of Motion The ability to quickly shift (the right foot) from accelerator to brake pedal when the situation demands, and apply correct pressure for appropriate speed control; also, for arm movements to safely maneuver the car around obstacles.
Head/Neck and Trunk FlexibilityThe ability to rapidly glance in each direction from which a vehicle conflict may be expected in a given situation; this includes the familiar "left-right-left" check before crossing an intersection, as well as looking over one's shoulder before merging with traffic or changing lanes.
According to the U.S. Dept. of Transportation, "per mile driven, drivers 75 years & older have higher rates of fatal vehicle crashes than other age groups except teenagers."
U.S. Department of TransportationFederal Highway Administration