aging, health systems and health outcomes: the world cities project cadenza symposium on...
TRANSCRIPT

Aging, Health Systems and Health Outcomes: The World Cities Project
Cadenza Symposium on Age-Friendly World Cities & Environment
October 8-9, 2010
Victor G. RodwinProfessor of Health Policy and Management
Wagner School, New York University

Growth of Urbanization Worldwide
Virtually all population growth projected by UN between 2010 until 2030 will be concentrated in cities.
In 2000, 47% of world’s population lived in cities; in 2030, 60% will live in cities.

Growth of Megacities
2000 - 20 “Megacities” Over 10Million People
All in Developing World Except NYC and Tokyo
In 2015, there will be 23 Megacities

Tokyo, New York, London and Paris: Units of
Analysis

New York City 8.0 million (2000); 65+ = 937,857
Central Tokyo 8.1 million (2000)65+ =1,336, 289
Paris and First Ring 6.2 million (1999)65+ = 848,723
Greater London 7.3 million (2000)65+ = 908,175
4.74.72.62.6 2.12.16.06.0
4.04.0 2.12.1
Hauts-de-Seine
Val-de-Marne
Seine-SaintDenis
Bronx
ManhattanQueens
BrooklynStaten Island
1.51.5
6.56.5
InnerTokyo
OuterToky
o
OuterLondon Inner
London

Manhattan
Inner London
Paris Inner Tokyo
# of teaching hospitals
19 13 25 9
# of medical schools
5 4 7 7
Acute hospital beds per1000 population
5.5 (2002) 4.1 (1990) 7.0 (2002)
12.8 (2000)1
Physicians per 10,000Population
85.5 (2004) 36.9 (2000) 85 (2002) 70.0 (2000)
Health Care Resources: Manhattan, Inner London, Paris
and Tokyo (1995-2000)

Life Expectancy at 65 Years
(Male)
Life Expectancy at 65 Years (Female)
New York City (2000) US (2000)
17.0
16.3
20.1
19.2 Tokyo 23 wards (2000) Japan (2000)
17.7
17.5
22.2
22.5 Paris+First Ring (1999) France
17.7
16.5
21.7
21.0 Greater London (1997-99) UK (1999-2001)
15.6
15.7
19.2
18.9
Source: Rodwin, Gusmano, Montero(2003) Etudes et Résultats, DRESS, Paris.
LE at 65: National and City Levels

Men & Women 85+ Living Alone: Manhattan, Paris, Inner London, & Inner Tokyo


Institutional Long-Term Care Beds Per 1,000 Persons Over
65+
Urban Core First Ring
London (2001) 9.9 12.5
New York (2000)
33.3 48.4
Paris (2001) 13.3 22.3
Tokyo (1997) 9.7 12.3

Nursing Home Care: Similarities
• Nursing home rates are lower in the urban cores than in the first rings
• High price of real estate in the urban cores tends to restrict investment in institutional long-term care facilities compared to first ring
• In NYC and Paris, persons over 65 who live alone have higher levels of educational attainment than those who live in institutions

Home Help Users 65 Years and Home Help Users 65 Years and Over Over
London, New York, Paris and London, New York, Paris and TokyoTokyo
(2000-2002)(2000-2002) Urban Core First Ring Total
London (2001)
8.1% 4.7% 5.8%
New York (2000)
7.4% 7.0% 7.1%
Paris (2002)
6.0% 5.8% 5.7%
Tokyo (2002)
7.3% 6.5% 6.8%

Globalization and policy Globalization and policy convergence??
• Evidence of convergence: significant and growing inequalities of income, housing, health and health care within all four cities.
• Evidence that “politics matters”: Japan’s LTCI; France’s recent expansion of home care services
• Evidence captured by neither: New York, the “hardest” global city provides twice as many nursing home beds and as much home help as the “soft” cities in our analysis

Challenges and Lessons
• Can we afford to allow frail older persons to remain in the urban core of world cities?
• Local policies fill the residuals left by higher levels of government
• Local administrative discretion is significant• Cities cope with diverse older persons• Providing information to older persons and
giving them greater voice• Supporting the oldest old living alone and
identifying the most isolated and vulnerable

- Life expectancy at birth- Probability of survival given diseases- Premature Mortality- Avoidable Mortality- Access to Primary Care - Access to Specialty Care
Health Outcomes and Health System Performance

Premature Mortality Rate per 1,000 by Neighborhood Quartile
1999-2003
Age-Standardized, UN World Population 2004
Q1, 449
Q1, 280
Q1, 427
Q4, 210
Q4, 95
Q4, 314
0
50
100
150
200
250
300
350
400
450
500
Manhattan Paris Inner London
Q1
Q2
Q3
Q4

Defining “Avoidable Mortality”
• “Avoidable Mortality” premature death (prior to 75 years) from diseases amenable to screening and medical intervention
• Examples include: – ischemic heart disease– several malignancies: breast, colon, cervix, skin– tuberculosis– Maternal deaths

Avoidable Mortality in Five World Cities
1.11
0.56
0.910.85
1.27
0.0
0.4
0.8
1.2
1.6
Manhattan Paris InnerLondon
Tokyo Hong Kong
Ag
e-a
dju
ste
d r
ate
/10
00
Average rate, 1999-2003
From Chau, PH, Woo, J et. al. Avoidable Mortality Pattern..European J. Public Health

Avoidable Hospital Conditions
Examples:
• Pneumonia
• Congestive Heart Failure
• Asthma
• Cellulitus
Marker Conditions
Examples:
• Acute Myocardial Infarction
• Appendicitis
• GI obstruction
• Hip fracture
Comparing Access to Primary Care
We use the list of ICD-9/ICD-10 Codes from the definition used by Dr. Joel Weissman and colleagues. The Weissman definition includes the following conditions: pneumonia, congestive heart failure, asthma, cellulitis, perforated or bleeding ulcer, pyelonephritis, diabetes with ketoacidosis or coma, ruptured appendix, malignant hypertension, hypokalemia, immunizable conditions, and gangrene.

Hospital Discharges for Avoidable Hospital Conditions and Marker Conditions: Manhattan, Paris and Inner London
1998-2001average
4.66.9
4.8
10.2
4.1
16.1
0
5
10
15
20
AHC marker conditionsAg
e A
dju
sted
Rat
es/1
000
po
pu
lati
on
18+
Manhattan
Paris
Inner London

Characteristics of Residents by Income Quartile of Neighborhood
Socioeconomic Status: Manhattan, Inner London, Paris
Total
Population Education Level 1 Median Household Income Range Deprivation
Score
Manhattan
Q1 529,882 17.00% $20,111 - $27,693 N/A
Q2 320,135 48.14% $41,335 - $54,051 N/A
Q3 304,415 64.16% $57,597 - $65,038 N/A
Q4 371,749 71.09% $68,355 - $73,816 N/A
Paris
Q1 778,982 21.71% € 20,061 - € 22,470 N/A
Q2 417,795 28.68% € 22,575 - € 25,971 N/A
Q3 566,629 23.80% € 26,506 - € 28,551 N/A
Q4 361,840 40.22% € 28,572 - € 36,161 N/A
Inner London
Q1 642,821 28.23% N/A 58.26
Q2 903,339 38.38% N/A 42.6
Q3 612,184 39.19% N/A 34.97
Q4 607,770 47.50% N/A 21.02
1. Bachelors degree or higher
Sources: U.S. Census 2000; French Census 1999; National Office of Statistics, UK 2001

Avoidable Hospital Conditions per 1,000 by Neighborhood Quartile
1999-2003
Age-Standardized, UN World Population 2004
Q1, 19.9
Q1, 9.4Q1, 11.1
Q4, 7.2Q4, 5.3
Q4, 8.4
0
5
10
15
20
25
Manhattan Paris Inner London
Q1
Q2
Q3
Q4
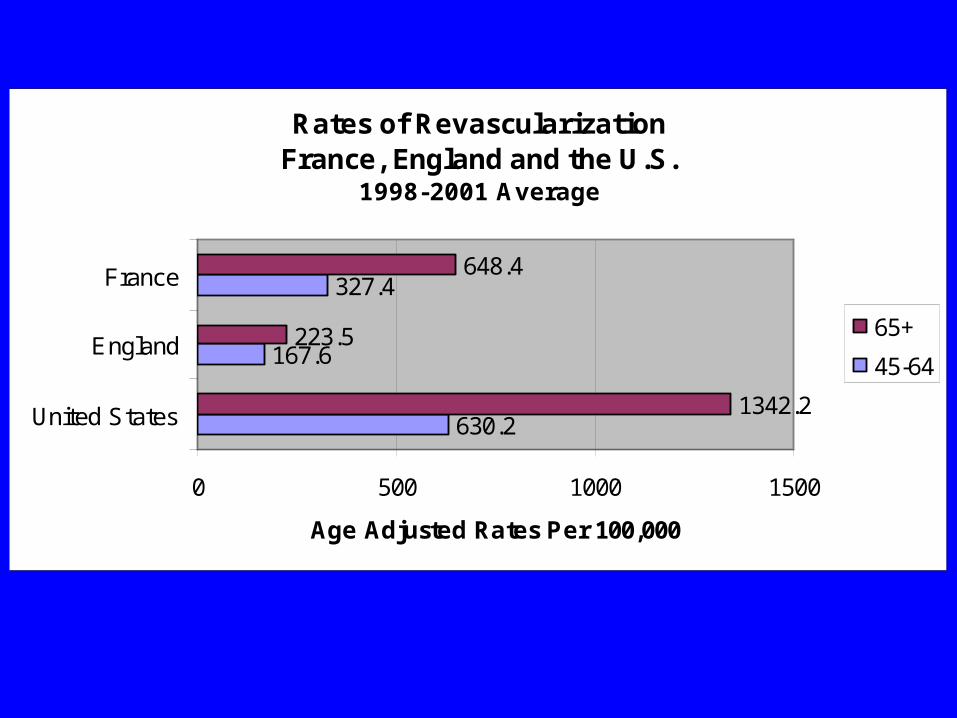
Rates of Revascularization France, England and the U.S.
1998-2001 Average
630.2
167.6
327.4
1342.2
223.5
648.4
0 500 1000 1500
United States
England
France
Age Adjusted Rates Per 100,000
65+
45-64

RatioRates of Revascularization : Rates of AMI Mortality
Paris, Inner London, Manhattan1998-2001 Average
13.2
4.7
16.8
2.4
0.8
3.5
0 5 10 15 20
Manhattan
Inner London
Paris
Age Adjusted Rates Per 100,000
65+
45-64

Revascularizations per 100,000 (35+), by Neighborhood Quartile
1999-2003
Age-Standardized, UN World Population 2004

Lower Joint Replacement Rate per 100,000 by Neighborhood Quartile
1999-2003
Age-Standardized, UN World Population 2004
Q1, 121
Q1, 91
Q1, 133
Q4, 171
Q4, 74
Q4, 139
0
20
40
60
80
100
120
140
160
180
Manhattan Paris Inner London
Q1
Q2
Q3
Q4