aging in sport and exercise. chapter 18 overview height, weight, and body composition physiological...
TRANSCRIPT

Aging in Sport and Exercise

CHAPTER 18 CHAPTER 18 OverviewOverview
• Height, weight, and body composition
• Physiological responses to acute exercise
• Physiological adaptations to exercise training
• Sport performance
• Special issues

Introduction to Aging and SportIntroduction to Aging and Sport
• Number of individuals over age 50 engaged in sport and exercise increased compared to 30 years ago– Recreation– Competition– More fit compared to older sedentary counterparts
• Performance declines with age

Introduction to Aging and SportIntroduction to Aging and Sport
• Exercising into old age an unusual pattern– Natural tendency to be sedentary– Motivating factors?
• Primary aging versus comorbidities of age– Cross-sectional versus longitudinal studies– Medical care, diet, lifestyle factors– Selective mortality– Applicability of findings to larger aged population?
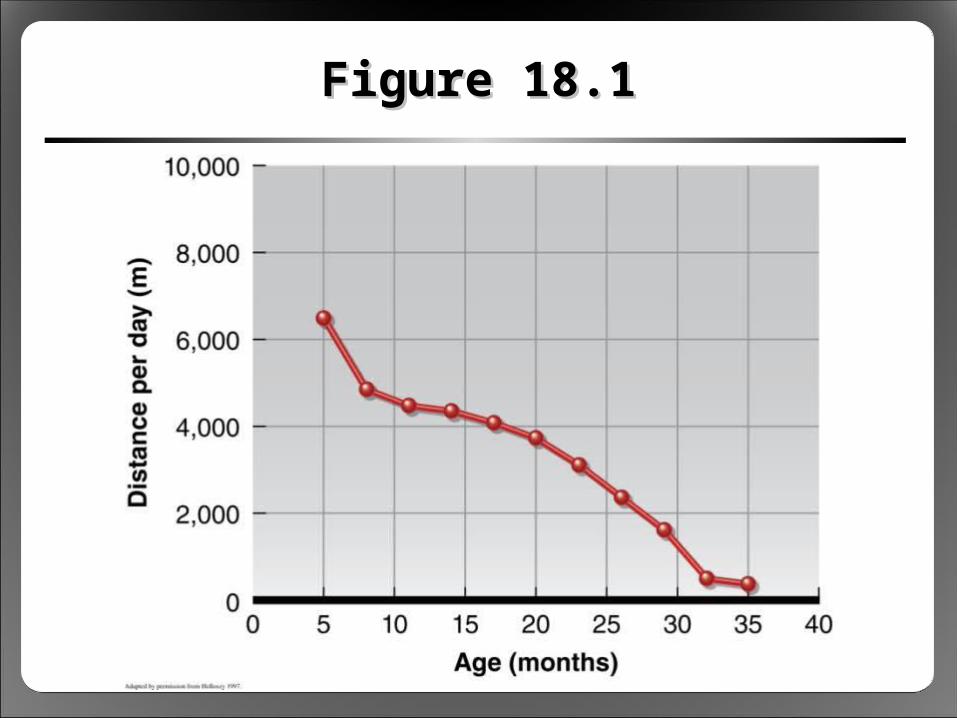
Figure 18.1Figure 18.1

Height, Weight, and Height, Weight, and Body CompositionBody Composition
• Height with age– Starts at 35 to 40 years– Compression of intervertebral discs– Poor posture– Later, osteopenia, osteoporosis
• Weight , then – 25 to 45 years: physical activity, caloric
intake
– 65+ years: loss of body mass, appetite

Figure 18.2Figure 18.2

Height, Weight, and Height, Weight, and Body CompositionBody Composition
• Body fat content tends to increase– Active versus sedentary older adults vary – Older athletes body fat content– Older athletes central adiposity
• Fat-free mass starting around age 40– Muscle, bone mass– Sarcopenia (protein synthesis )– Due (in part) to lack of activity
– Growth hormone, insulin-like growth factor 1

Figure 18.3Figure 18.3

Height, Weight, and Height, Weight, and Body CompositionBody Composition
• Bone mineral content – Bone resorption > bone synthesis– Due to lack of weight-bearing exercise
• Body composition variables– Body weight– Percent body fat– Fat mass– Fat-free mass (FFM)

Figure 18.4Figure 18.4aa

Figure 18.4Figure 18.4bb

Figure 18.4Figure 18.4cc

Figure 18.4Figure 18.4dd

Height, Weight, and Height, Weight, and Body CompositionBody Composition
• Training alters age-related body composition changes– Weight, percent body fat, fat mass
– FFM (more likely with resistance training than with aerobic training)
– Men > women
• Biggest results with diet + exercise

Physiological Responses Physiological Responses to Acute Exerciseto Acute Exercise
• Strength and neuromuscular function with age– Interferes with activities of daily living– Manifests ~age 50 to 60 years– Results from muscle mass
• Strength offset by resistance exercise

Figure 18.5Figure 18.5

Figure 18.6Figure 18.6

Physiological Responses Physiological Responses to Acute Exerciseto Acute Exercise
• Type II fiber loss with aging– Decrease in type II motor neurons– Type I neurons innervate old type II fibers?– Higher percent type I fibers
• Training slows or stops fiber-type change

Figure 18.7Figure 18.7

Physiological Responses Physiological Responses to Acute Exerciseto Acute Exercise
• Size and number of muscle fibers with age– Size of both type I and type II – Lose 10% per decade after age 50
• Endurance training no impact on decline in muscle mass with age
• Resistance training reduces muscle atrophy, muscle cross-sectional area

Physiological Responses Physiological Responses to Acute Exerciseto Acute Exercise
• Reflexes slow with age– Exercise preserves reflex response time– Active older people ≈ young active people
• Motor unit activation with age– Exercise retains maximal recruitment of muscle
– Some studies show strength due to local muscle (not neural) factors
• Exercise maintains muscle physiology– Number of capillaries unchanged– Oxidative enzyme activity only mildly reduced

Physiological Responses Physiological Responses to Acute Exerciseto Acute Exercise
• Central and peripheral cardiovascular decrements with age
• Reduced maximal HR– Reduction varies considerably– Electrical and receptor changes with age– Same for active and sedentary people
• HRmax = [208 – (0.7 x age)]

Physiological Responses Physiological Responses to Acute Exerciseto Acute Exercise
• Maximal stroke volume (SV) with age– Contractility, response to catecholamines– Partial loss of Frank-Starling mechanism– LV, arterial stiffening
– Exercise attenuates decline in SVmax
• VO2max with age due to Qmax
– Due more to HRmax, less to SVmax
– Exercise attenuates decline in VO2max

Physiological Responses Physiological Responses to Acute Exerciseto Acute Exercise
• Sedentary habits risk for vascular aging– Cardiac and arterial compliance– Endothelial dysfunction– Reduced vasodilation
• Exercise risk– Less arterial stiffening, endothelial dysfunction– Preserved vasodilator signaling– Research ongoing on proper exercise dose for
cardiovascular benefit

Physiological Responses Physiological Responses to Acute Exerciseto Acute Exercise
• Peripheral blood flow with age– ~10 to 15% reduction even with exercise– Due to vasoconstriction, vasodilation
– (a-v)O2 difference compensates for flow
• Effects of primary aging versus cardiovascular deconditioning– Which changes result from aging alone?– Which changes result from reduced activity?

Figure 18.8Figure 18.8

Physiological Responses Physiological Responses to Acute Exerciseto Acute Exercise
• Respiratory function with sedentary aging– Vital capacity and FEV1.0, residual volume, total
lung capacity unchanged– Less air exchanged
– Lung and chest wall elasticity with age– But does not limit exercise capacity
• Exercise maintains ventilatory capacity– Pulmonary ventilation does not limit aerobic capacity– Oxygen saturation remains high

Physiological Responses Physiological Responses to Acute Exerciseto Acute Exercise
• VO2max changes with aging– Measured in L/min or ml/kg/min?– Absolute versus relative decrement
• VO2max in normally active older people– Declines steadily from 25 years to 75 years– ~1% per year (~10% per decade)

Table 18.1Table 18.1

Physiological Responses Physiological Responses to Acute Exerciseto Acute Exercise
• VO2max in older male athletes– 5 to 6% decline per decade in active adults– 3.6% decline over 25 years in elite athletes– 15% decline per decade in previously active adults
• VO2max in older female athletes– Fewer studies but similar to men– ~1% decline per decade– Longitudinal changes > cross-sectional changes

Figure 18.9Figure 18.9

Table 18.2Table 18.2

Physiological Responses Physiological Responses to Acute Exerciseto Acute Exercise
• Percent decline in VO2max related to intensity of training before and during aging
• Factors that affect rate of decline– Genetics– General activity level– Intensity and volume of training– Age-related body composition changes– Age range

Figure 18.10Figure 18.10

Figure 18.11Figure 18.11

Physiological Responses Physiological Responses to Acute Exerciseto Acute Exercise
• Lactate threshold (as % VO2max) – Not predictive of running performance with aging
– Percent VO2max may not be best measure
– Remember: absolute VO2 with age
• Lactate threshold (as absolute VO2)
Physiological Adaptations Physiological Adaptations to Exercise Trainingto Exercise Training
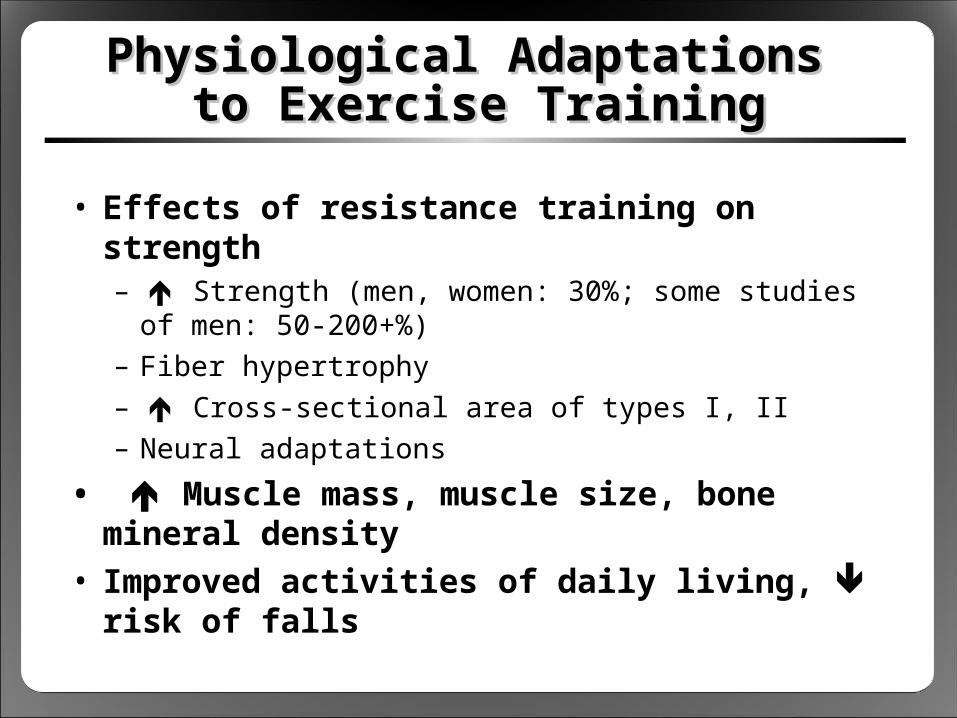
• Effects of resistance training on strength– Strength (men, women: 30%; some studies of
men: 50-200+%)– Fiber hypertrophy
– Cross-sectional area of types I, II– Neural adaptations
• Muscle mass, muscle size, bone mineral density
• Improved activities of daily living, risk of falls

Physiological Adaptations Physiological Adaptations to Exercise Trainingto Exercise Training
• VO2max improvement with training– Independent of sex, age, initial fitness– Young: maximal cardiac output (central)– Older: oxidative enzymes (peripheral)
• Anaerobic capacity with training– Less known than aerobic training results– Lactate threshold bad predictor of performance

Sport PerformanceSport Performance
• Running performance with age– Rate of decline independent of distance– Both 100 m, 10 km records slow with age
• Decline accelerates past age 60

Figure 18.12Figure 18.12

Sport PerformanceSport Performance
• Swimming performance with age
• Decline accelerates past age 70
• Decline in women > decline in men

Sport PerformanceSport Performance
• Cycling performance– Peaks between 25 and 35 years– Speed then decreases by 0.7% per decade
• Weight-lifting performance– Peaks between 25 and 35 years– Sum of power lifts then declines 1.8% per year

Figure 18.13Figure 18.13

Special IssuesSpecial Issues
• Higher risk of death from hyperthermia– Higher core temperature than young subjects
– Metabolic heat gain related to absolute VO2
– Heat loss related to relative percent VO2max
• Physical training affects thermoregulation– Improves skin vasodilation (convection)– Improves sweat rate (evaporation)– Improves redistribution of cardiac output

Figure 18.14Figure 18.14

Special IssuesSpecial Issues
• Exercise in cold risk of hypothermia– Risk not as great as hyperthermia– Reduced ability to generate metabolic heat– Excessive convective heat loss– Core temperature can drop even with mild cold
stress
• Must add behavioral thermoregulation

Special IssuesSpecial Issues
• Exercise and longevity– Mild caloric restriction increases longevity– Exercise may contribute to caloric balance– Exercise compression of mortality
• Exercise can lead to injury– Tendon injury (rotator cuff, Achilles)– Cartilage injury (meniscus, focal injuries)– Stress fractures
• Exercise can reduce risk of falls