aging in thailand - un
TRANSCRIPT

A gin g in
T h a ila n d
Vipan PrachuabmohCollege of Population Studies,Chulalongkorn University
Using Different Measure of aging: Country Case Studies

Outline
Conventional Measures of Aging
New Measures of Aging
Conclusion and Suggestions
Conventional Measures of Population Aging
• Over the past 30 years, scholars and policy analysts have used conventional measures that rely on chronological age to examine trends in Thailand’s population aging.
• According to these conventional measures (such as proportion of older persons, median age, old age dependency ratio), Thailand is considered one of the world’s rapidly aged societies.
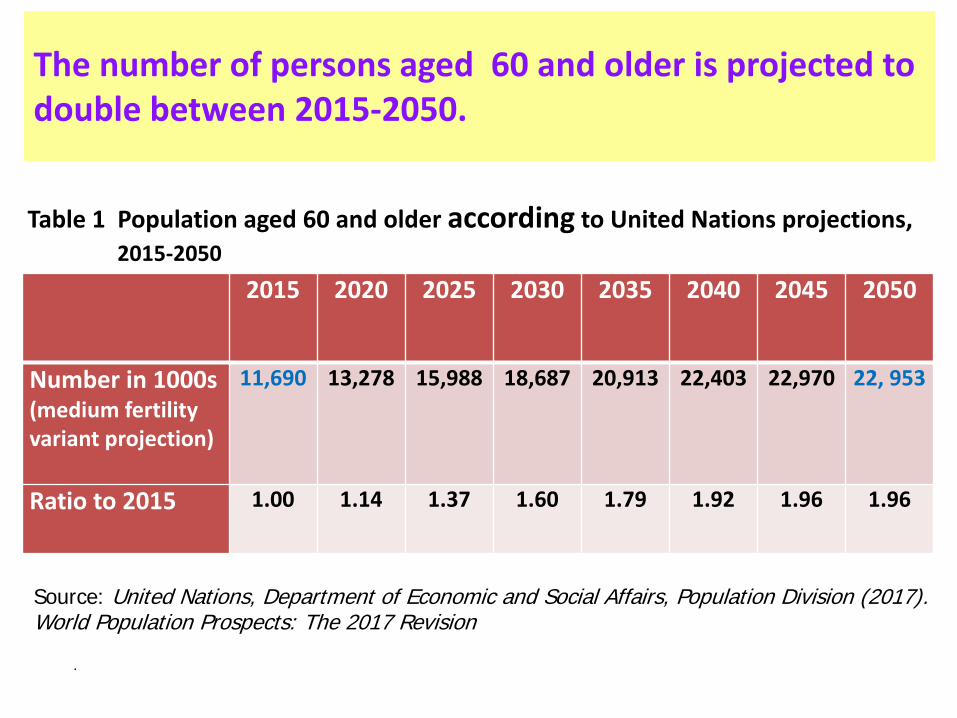
2015 2020 2025 2030 2035 2040 2045 2050
Number in 1000s (medium fertility variant projection)
11,690 13,278 15,988 18,687 20,913 22,403 22,970 22, 953
Ratio to 2015 1.00 1.14 1.37 1.60 1.79 1.92 1.96 1.96
Source: United Nations, Department of Economic and Social Affairs, Population Division (2017). World Population Prospects: The 2017 Revision
The number of persons aged 60 and older is projected to double between 2015-2050.
Table 1 Population aged 60 and older according to United Nations projections,2015-2050
.

0.051
0.192
0.352
0.032
0.290
0.00
0.05
0.10
0.15
0.20
0.25
0.30
0.35
0.40
1950 1960 1970 1980 1990 2000 2010 2020 2030 2040 2050
Proportion of older person, Thailand 1950-2050
65+
60+
Est
imat
esP
roje
ctio
ns
Both Sex
The share of the population age 60 and older is about 20% at present and is projected to constitute 30% by 2050.

Proportion of Population age 60+
Source: United Nations, Department of Economic and Social Affairs, Population Division (2017). World Population Prospects: The 2017 Revision
2015 % 2035 %1 Japan 32.8 Japan 39.92 Hong Kong, China 21.8 Korea 35.53 Georgia 20.3 Hong Kong, China 35.34 Chinese Taipei 18.6 Singapore 34.15 Korea 18.4 Chinese Taipei 33.16 Singapore 17.9 Thailand 30.27 Cyprus 17.7 Macao 28.88 Israel 15.8 China 28.59 Arminian 15.8 Cyprus 2610 Thailand 15.6 Georgia 25.9
Very fast speed of population aging: Thailand will become super aged society within the next 15 years. Changing from rank 10th in 2015 to 6th in 2035 among all Asia.
in Asia

18.621
40.147
49.171
0
10
20
30
40
50
60
1950 1960 1970 1980 1990 2000 2010 2020 2030 2040 2050
Median age, Thailand 1950-2050
Both SexFemale
Male
Est
imat
esP
roje
ctio
ns
Source: United Nations, Department of Economic and Social Affairs, Population Division (2017). World Population Prospects: The 2017 Revision
• Looking at another conventional measure, median age or the age that divides a population into two equal numerically groups.
• The median age has been rising sharply from about 18 years old in 1950 to about 40 years old at present, and is projected to be nearly 50 years old by the mid of 21st century

0.080
0.164
0.544
0.00
0.10
0.20
0.30
0.40
0.50
0.60
0.70
1950 1960 1970 1980 1990 2000 2010 2020 2030 2040 2050
Old Age dependency ratio, Thailand 1950-2050
BothFemale
Est
imat
esP
roje
ctio
ns
Male
Source: United Nations, Department of Economic and Social Affairs, Population Division (2017). World Population Prospects: The 2017 Revision
• Changes in age structure that are taking place in Thailand translate into changes in dependency ratios defined in terms of age groups. The old-age dependency ratio has steadily increased since 1990. This means that fewer younger cohorts to support old adults.

Increasing burden place on working population:Steady declines of the potential support ratio reflects a shrinking support base of economically productive persons upon whom older persons can depend.
Note: Potential Support Ratio = Population 15-64/65+Source: United Nations, Department of Economic and Social Affairs, Population Division (2017). World Population
Prospects: The 2017 Revision
7.0
4.2
3.7
2.5
1.7
2000
2017
2000
2030
2020
2050

These conventional measures, especially proportion of OPs and potential support ratio make government and public seriously concerns about population aging. Recently, Thai government has been giving very serious attention to ageing issues.
• National Agenda for Aging Society
• Thailand’s National Strategy (2018-2037)
• Mater Plan on Aging Society
• National Plan for Older Person (2002-2020)

•These conventional measures do not account for health and social aspects of aging that may impact on the wellbeing and social inclusion of the older persons and the nation's sustainable development.
•Therefore, we need multidimensional approaches to better measure and understand the aging process and provide more informed aging policy and programs.
•Recently, Scherbov and Sanderson have introduced the new way to remeasure population aging by taking into account life expectancy instead of chronological age.
• “Prospective age” measures how old people, not only from the date of their birth, but also in relation to their lengthening life expectancies.

51.2
4…
25
30
35
40
45
50
55
2000 2010 2020 2030 2040 2050
Median Age and Prospective Median Age, Females
Conventional Median Age
Prospective Median Age
47.0
41.9
25
30
35
40
45
50
55
2000 2010 2020 2030 2040 2050
Median Age and Prospective Median Age, Males
Prospective Median Age
• The prospective median age is a median age accounting for the expected remaining years of life.
• Although the Thai population will grow older as projected by both the conventional and prospective median age, the latter measure shows a slower pace of population aging. Female has a higher median age due longer life expectancy.
Conventional Median Age

62.682
69.989
73.080
50.00
55.00
60.00
65.00
70.00
75.00
80.00
1960 1970 1980 1990 2000 2010 2020 2030 2040 2050
Old-age Threshold in ThailandBothFemale
Male
Est
imat
esP
roje
ctio
ns
13
Another new measure is old-age threshold or age when remaining year of life is 15 years or less.According to this graph, someone in 1960 in Thailand is considered old at the age of 62, but by 2020 someone at aged 70 would be considered old.

0.790
0.645
0.00.10.20.30.40.50.60.70.80.91.0
2000 2020 2040 2050
Proportion of people above old-age threshold among population 65+, Thailand 2000-2050
both male female
The proportion of the population aged 65 and older that is above old-age threshold (age when remaining years of life are ≤ 15 years) is projected to decrease from 80 % in 2000 to 65 % in 2050.Base on this measure that accounting for increasing life expectancy, so it capture the declining trend in the proportion of people with≤ 15 years of life remaining at the age 65.

0.389
0.587
0.00
0.10
0.20
0.30
0.40
0.50
0.60
0.70
0.80
1950 1970 1990 2010 2030 2050
Conventionalold age dependency ratio,
Thailand
0.202
0.298
0.00
0.10
0.20
0.30
0.40
0.50
0.60
0.70
1950 1970 1990 2010 2030 2050
Prospective old age dependency ratio, Thailand
Both
Female
Male
Est
imat
esP
roje
ctio
ns
Both
Female
Male
Est
imat
esP
roje
ctio
ns
Both the conventional and prospective old age dependency ratios show the trend of increasing population aging. The prospective old age dependency ratio show a slower increase.
Prospective old age dependency = the number of people at least 20 year old in age group with life expectancies 15 or fewer yearsdivided by the number of people at least twenty years old in age groups with life expectancies greater than 15 years.

• These new measures seem to offer a ray of hope for successful aging in Thailand.However, “healthy, productive, and happy aging” can happen only on the following conditions:
1) Thailand has to make older persons live longer and healthier. At present, it looks like there is a tendency toward expansion of morbidity and higher prevalence of disability as life expectancy increases;
Conclusion and Suggestions

Percentage of Population age 60 having difficulties with ADLs
3.7% in 2001 6.3% in 2016
Source: 1) Prachuabmoh,V. and others. 2011. The Project on Monitoring and Evaluation of the Second National Plan for Older Person (2002-2021) Round 2.
2) Pothisiri, W. and others. 2016. The Project on Monitoring and Evaluation of the Second National Plan for Older Persons (2002-2021) Round 3.
There is a tendency toward expansion of morbidity and a higher prevalence of disability as life expectancy increases.

Per cent of OPs with ADL in Thailand,2001 and 2016
2011 2016
Total 3.7 6.4
Age
60-64 1.4 2.4
65-69 2.0 3.5
70-74 2.6 4.7
75-79 4.8 9.4
80+ 15.4 20.7
Sex
Male 3.0 4.1
Female 4.1 7.1

Source: Elke Loichinger & Wiraporn Pothisiri (2018) Health prospects of older persons in Thailand: the role of education, Asian Population Studies.
• The number of persons aged 50+ with ADL is at projected to more than double between 2015-2050.
0.6million
1.6million

2) Thailand needs to reduce inequality in human capital investment. Differences in Education attainment are strongly associated with differences in productive and healthy aging.

Table 4. Unadjusted and adjusted proportions working in prior year, proportions providing assistance to
family members and proportions of caregiving among older persons aged 60 and over in Thailand.
No education Some primary
Complete primary
Beyond primary
WorkingUnadjusted 0.27 0.35 0.48 0.30Adjusted* 0.35 0.40 0.42 0.18
Financial provision for childrenUnadjusted 0.12 0.12 0.15 0.25Adjusted* 0.13 0.12 0.13 0.25
Household choresUnadjusted 0.74 0.77 0.83 0.86Adjusted* 0.84 0.84 0.86 0.90
Grandchild care(care for grandchild<10, past year)Unadjusted 0.27 0.23 0.31 0.21Adjusted* 0.29 0.24 0.29 0.22
Care for adult household membersUnadjusted 0.09 0.09 0.12 0.13Adjusted* 0.09 0.09 0.11 0.12
Source: Teerawichitchainan, Prachuabmoh, Knodel, Social Science & Medicine, https://doi.org/10.1016/j.socscimed.2018.09.053
*Adjusted proportions are calculated based on binary logistic regression models that control for gender, age, marital status, number of children, location of residence, work status, and functional limitation index

•Chronological age represents only one dimension of the population aging. In order to better measure aging, we need to measure different characteristics of people. The multidimensional measures would provide better information for policy options.
•To make this multidimensional measures more informative in Thailand, we need to collect and disaggregate data on population characteristics such as education attainment, objective health status (including disability, frailty, chronic conditions), area of residence, technological literacy and access, etc.
.

• In addition, Thailand needs to collect longitudinal data in order to:
•monitor demographic trends especially morbidity and mortality.
•to identify the determinants of older person’s well-being and productive aging.
•provide clearer evidence for future policy formation and evaluation.