agonistic behaviour and electric signalling in a mormyrid fish, … · 2011-07-20 · agonistic...
TRANSCRIPT

Behav. Ecol. Sociobiol. 1, 45-61 (1976) Behavioral Ecology and Sociobiology �9 by Springer-Verlag 1976
Agonistic Behaviour and Electric Signalling in a Mormyrid Fish, Gnathonemus petersii
Bernd Kramer* and Richard Bauer**
Laboratoire de Physiologie Nerveuse, D+partement de Neurophysiologie Sensorielle, C.N.R.S., Gif-sur-Yvette, France, and Universitgt Konstanz, Fachbereich Biologie, Konstanz, Federal Republic of Germany
Summary. 1. Agonistic motor behaviour and concurrent electric signalling were studied in individually held, residential Gnathonemus petersii. Aggressive behaviour was elicited by presenting a specimen of a closely related species, Mormyrus rume, for 3 min a day.
2. The principal agonistic motor patterns are described (Fig. 2). Among them head butt, approach and lateral display were further analysed.
3. The electrical activity displayed during agonistic behaviour was found to differ fundamentally both from isolated resting and swimming conditions. The mean discharge rate recorded during aggressive behaviour (31 Hz, Fig. 3 c) is approximately twice the rate observed in an isolated swimming fish (Fig. 3b) and three times the rate displayed by a resting animal (Fig. 3a). An attacking G. petersii exhibits a much greater range of electric organ discharge (EOD) intervals than isolated swimming or resting individuals. EOD-intervat histograms recorded from attacking fish show two sharp modes at high discharge rate; there are no intermediate intervals.
4. During the course of an attack, the initially low and variable discharge rate increases fairly linearly as the distance from the attacked fish diminishes (Fig. 9). The EOD rate associated with physical contact (head butt) comprises between 60 and 80 Hz in 24 of 28 attacks analysed; the dominant mode of the distribution is 61 Hz (Fig. 8).
5. During subsequent lateral display, G. petersii emits a high discharge rate pattern consisting of two types of "steady-state" activities which may last up to a few seconds: the first is a fairly regular alternation of approx. 16 and 8 ms intervals (paired pulses); this pattern gives rise to the two peaks of high discharge rate in the interval histogram (Fig. 3 c). The second is a regular sequence of either 16 or 8 ms intervals (Fig. 4A). The only female among the animals used in our study showed the same display but did not exhibit the highest possible discharge rate (i.e. a regular sequence
* Present address: Universit/it Konstanz, Fachbereich B~ologie, Postfach 7733, D-7750 Konstanz, Federal Republic of Germany. ** Deceased.

46 B. Kramer and R. Bauer
of 8 ms intervals; Fig. 4 B). The high discharge rate is terminated by a sudden discharge break (Figs. 4A and 6).
6. It is suggested that the attack-associated EOD rate increase is a remnant of an ordinary locomotory pattern which has changed its function to a ritualised aggressive signal that occurs in ~r socially significant and well- defined context. The high discharge rate might serve three functions: (i) behavioural isolation of closely related, sympatrically living mormyrids (per- haps by character displacement); (ii) recognition of sexes; (iii) synchronisa- tion of mates during courtship.
Introduction
The electric organ of weakly electric fish is known to be part of an elaborate electricity-generating and detecting system, which enables the fish to orientate themselves in their environment (reviews by Bennett, 1971; Szabo, 1973; Szabo and Fessard, 1974; Scheich and Bullock, 1974). On the other hand, in gymnotids, there exists well-documented evidence for an additional communicative role of the electric organ discharge (EOD) (review by Scheich and Bullock, 1974; additional literature in Westby, 1975, and Hopkins, 1975). Several isolated obser- vations (M6hres, 1961; Lissmann, 1958; Szabo, as cited by Lissmann, 1961) and results obtained by stimulation experiments (Moller, 1970) seem to indicate that this might be the case in mormyrids as well. High discharge rate patterns in pairs ofmormyrid fishes related to aggression and establishment of dominance were seen by Bauer (1972) and Belt et al. (1974). An interaction of the EOD activities of two mormyrids, one being passively moved towards the other, has been shown by Moller and Bauer (1973). In freelymoving fishes, a latency relationship of the pulses of a G. petersii to the pulses of a specimen of a closely related species was first described by Bauer and Kramer (1974). Similar results, obtained in different conditions, were reported by Russell et al. (1974). The preferred latency response and other aspects of EOD interaction during agonistic behaviour have been subsequently analysed in detail (Kramer, 1974).
Detailed quantitative information about a relationship between motor behav- iour of freely swimming interacting fish and their electric displays is, however, lacking. For this reason, an analysis of simultaneous EOD and video recordings of the agonistic behaviour of the mormyrid G. petersii was undertaken. Since the pulses of two unrestrained mormyrids of the same species close in physical size (and hence in pulse amplitude) cannot be reliably separated electronically, pairs of two different species (G. petersii and M. rurne), whose pulse lengths are different, were chosen for this study. The pulses could thus be reliably separated electronically.
The two species of fish are known to live sympatrically in the upper Chad (Blache, 1964), and lower Niger basins (Belbenoit, pers. comm,), as well as in the lower Congo river (Poll, 1954).
Some of the results reported in this paper were communicated in two short articles (Bauer, 1972; Bauer and Kramer, 1973).

Agonistic Behaviour in a Mormyrid Fish 47
Material and Methods
Animals and Apparatus. Six G. petersii (15.5-20.5 cm, measured from the mouth to the fork of the tail, one of them a female, as determined post mortem) and two M. rume (15 and 20.5 cm) were used in this study. Unfortunately, no other specimens of M. rume could be obtained. Normally, they were maintained in individual compartments of-approximately 70 1, formed by dividing a large aquarium with plastic partitions (no electrical isolation). Water temperature of the experimental and the home tanks was maintained at between 26 and 27 ~ electrical resistivity ranged from 920 to 740 ohm-cm. A 12h/12h light-dark cycle was used both for the experimental and the home tanks. For further details, see Kramer (1974).
The experimental tank measured 1.0 x 0.4 x 0.5 m (2001). A cage of coarse plastic mesh kept the animals at more than 5 cm from the three pairs of electrodes which were used to record the EODs (see Kramer, 1974). An electronic window circuit separated the pulses of the two fishes; the discrimination criterion was the discharge duration (G. petersii: approx. 300 gs, M. rume: approx. 750 gs). Only the discharge of the bigger M. rume could be separated reliably from the concurrent G. petersii discharges by the circuit, because the pulse amplitude of the smaller M. rume was lower and hence the length of pulses shorter at the triggering level. An 800-address digital analyser (Didac, Intertechnique) was used to measure the length of intervals and to compute histograms. The movements of the two interacting fishes were recorded with a video camera, the lateral view directly, and the bottom view by reflection from a 40 x 80 cm mirror placed at an angle of 45 ~ Camera pictures were monitored and taped on a Sony video-recorder, at 50 pictures/ s. Still video pictures were observed and photographed on the video monitor. The fine analysis was made on film. Video and audio recordings were synchronised by the EOD which triggered a signal that blanked several lines of the TV picture, visible as a horizontal black bar (see Fig. 1). Since one picture represents a time interval of 20 ms, there may be more than one black bar, indicating the occurrence of two or more EODs during that interval. By measuring the distances between the bars on the same or on successive pictures, the EOD intervals could be estimated, and the video recordings synchronised with the Didac-analysed audio recordings.
In order to represent the concurrent discharge activities of the two fishes, the sequences of times of occurrence of EODs were analysed on the Didac according to a method which compensates
clock purse former
J't~j'J vide~ camera _-- TRIGGER[ J
tape recorder
~ window circuit
8c
Fig. 1. Experimental set-up. Before an aggression experiment, each fish's electrical activity, displayed in its home tank, was recorded on magnetic tape for 3 rain on separate tracks. Then M. rume was put into the tank of G. petersii. Simultaneously to the audio recording of the two fishes' electrical activity, monitored on an oscilloscope, their behaviour was monitored and taped by a video recorder equipment
video recorder

48 B. Kramer and R. Bauer
for cumulative flutter of tape recorders (Kramer, 1974). Interval vs. time of occurrence plots (Figs. 5 and 7 B) were made by a plotter connected to a computer.
The inter-fish distances observed at various EOD rates (Fig. 9) were tested for significance of differences by the use of the paired t statistic:
/ 3 / p a i r e d ~ - - sb
where/3 = the mean of the various differences or the average difference between paired values, and
s~--- the standard error of the differences. Experimental Procedure. Successive five days' series of one experiment per day were performed
with six G. petersii, each of which had been habituated to the experimental tank for at least three days prior to the experiment, Hiding places were provided in the experimental tanks as well as in the fishes' home tanks. The hiding place in the experimental tank (a tube of coarse plastic mesh 20 cm long and 7 cm wide) was readily accepted by all the animals used.
An experiment consisted of three periods: (a) the discharges of a G. petersii in the experimental tank, and of a M. rume in its home tank were amplified and recorded on magnetic tape on separate tracks for 3 min. (b) Then the M. rume was carefully introduced into the experimental tank for 3 rain, and the simultaneous activity of the two fishes was recorded. Recording started just before the moment the M, rume was introduced. (c) The M, rume was transferred back into its home tank. Starting immediately after the separation, another record of 3 min of the two fishes' discharges, on separate tracks, concluded the experiment.
Results
In the present paper we have a t tempted to s tudy the agonist ic behaviour, espe- cially aggressive behaviour in relat ion to electric signalling. Our app roach was hampered in two ways: firstly, w e did not record under natural condi t ions but in an aquar ium. We tried to limit a possible bias, in t roduced by this c ircum- stance, by choosing a fairly big tank (200 1) and by not restricting the animals in any way within it (except that we did not al low them to approach nearer than 5 cm to the electrodes, placed against the wal ls ) . The second restriction is tha t we did not study intra-, but rather interspecific behaviour , since we used a M. rume to elicit aggressive behaviour . In a parallel series o f intraspecific aggression experiments made with nine G. petersii we could not observe any difference in the repertoire or in the intensity o f the agonist ic m o t o r pat terns displayed by a G. petersii towards a conspecific.
1. The Principal Agonistic Motor Patterns
The principal agonistic m o t o r pat terns are: H e a d Butt. The fish rushes at its opponen t and butts it (Fig. 2a). F r o m
small wounds on the b o d y o f the par tner fish and scales f loating in the water it is clear that G. petersii is capable o f inflicting serious damage in spite o f its small mouth ,
Approach. This is a m o v e m e n t directed at ano ther fish which stops before physical contact would occur.

Agonistic Behaviour in a Mormyrid Fish 49
Fig. 2. (a) Head butt. The residential G. petersii below butts the intruder above which is about to enter the hiding place of the former by swimming backwards. (b) Lateral display. The two fish display mutually in an antiparallel position. Note that the chin appendix of the fish in the rear is curved upwards and points into the direction of the opponent. (c) Rolling in the chin appendix. The G. petersii at right which is fleeing from an aggressive, residential conspecific, rolls in its chin appendix
50 B. Kramer and R. Bauer
Lateral Display. Two fish are orientated in parallel in a head-to-tail position (Fig. 2b). The head may be bent inwards to the tail of the other fish.
Extending the Chin Appendix. When attacking another fish, or during lateral display, the chin appendix may be stretched out like a spear. Typically, it is curved slightly upwards during this behaviour-(Fig. 2b).
Rolling in the Chin Appendix. The chin appendix may also be rolled in. This was observed during approaches, and when fleeing from an attacking fish (Fig. 2c).
2. Electrical Activity Observed during Agonistic Behaviour
As mentioned above, an experiment consisted of recording the electrical activity of G. petersii just before, and during an introduction of a M. rurne in its tank for 3 min, respectively. Then the activity which was displayed by G. pe ters i i after the M. rume had been removed was recorded.
The three histograms in Fig. 3 represent the discharge activity exhibited by a G. petersii during these three experimental periods. Before the introduction of a M. rume, three modes at around 32, 90 and 140 ms can be observed (Fig. 3a). The mean discharge rate is about 10 Hz. When attacking a M. rume, this changes to a mean 31 Hz (Fig. 3c); only two modes at 6.5 and 14.5 ms are found in a distribution which is very much skewed to the left. An outstanding feature of this distribution is the fact that there is a gap between 9 and 11 ms, i.e. intervals are either shorter than 9 ms or longer than 11 ms, This gap as well as the modes vary slightly from fish to fish in the order of magnitude of 1 ms. Another characteristic feature of an interval histogram acquired during agonistic behaviour is the wide range of interval lengths (see overflow Fig. 3), which is by far greater than the range displayed during any other behaviour (cf. Bauer, 1974).
After having removed the M. rume, the interval histogram displayed by G.petersii is of still another shape: it is unimodal. The mode at about 50 ms is identical with the first minimum in Fig. 3a (cf. Bauer, 1974). The mean discharge rate is about 17 Hz.
The difference between the two control histograms (Fig. 3a and 3b) is explained by the fact that before the presentation of a M. rume, G. petersii stays almost motionless in its hiding place for most of the recording time. On the contrary, after the aggression experiment, the fish swims restlessly (see Discussion).
It is not so easy to explain the difference between the histograms recorded during the aggression experiment (Fig. 3 c) and the period following it (Fig. 3b), since G. petersii was swimming in both cases. Consequently, the discharge pat- terns displayed during aggressive behaviour must be different from those recorded in a swimming, isolated fish.
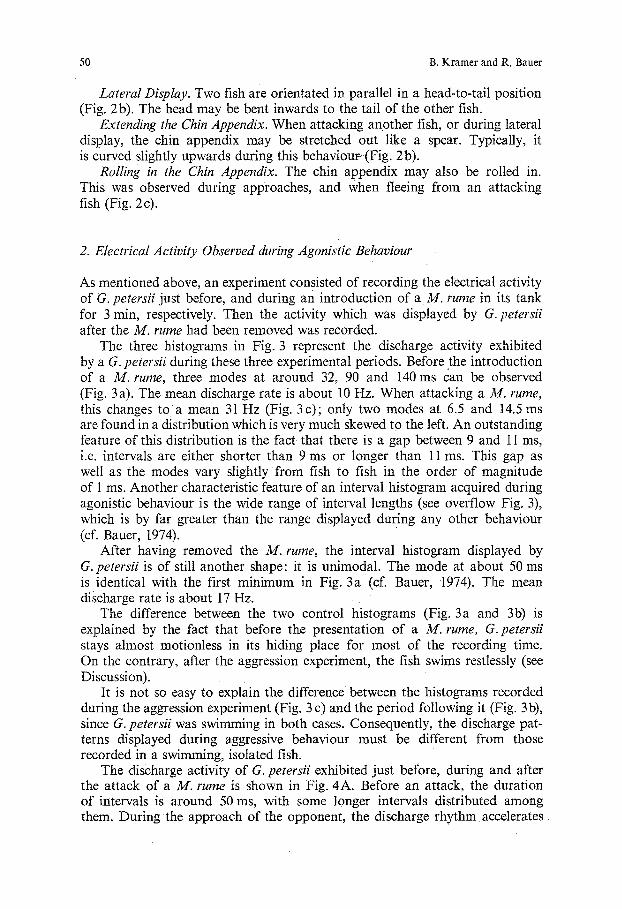
The discharge activity of G. petersii exhibited just before, during and after the attack of a M. rume is shown in Fig. 4A. Before an attack, the duration of intervals is around 50 ms, with some longer intervals distributed among them. During the approach of the opponent, the discharge rhythm accelerates

Agonistic Behaviour in a Mormyrid Fish 51
~ 0 - - �9 i i i i
0 50 100 150 200
(a) LL O
to w
u z w 0.10 rr
O~
D 0.05
U u
0 0 0 I 50
t~
N=3033 ~ b . . I I n- • W Cbl S.E
100 150 200
[107 LO
>
- 0.06
-J 0.05 I L l
127
[104 I
o.o3, ~ q~ 00 lll
0 50 100 150 200
N T E R - D I S C H A R G E I N T E R V A L [ms]
0.15
0.14
0.13
0.12
0.11
0.10
0.09
0.08
0.07
0.06
0.05
0.04
0.03
0,02
0,01
0
Fig. 3(a-c). Inter-discharge interval histogram of a G. pe ters i i , (a) resting isolated in its habitual hiding place; (c) attacking a M . r u m e put into the tank; (b) immediately after the intruder had been removed. The recording time is exactly 3 rain in each case. N total number of intervals analysed. The three histograms are normalised to cover the same area, i.e. equal areas are the same densities of probability. Note the trimodal distribution in (a), the bimodal histogram in (c) with a gap between the two modes, and the unimodal histogram in (b). The range of intervals is greatest in (c) (i~.x=tongest interval recorded)
1000:
E
tO0
C
"10
I
O~
1 0
-m looo- E
-5 ,> loo. {u
.c
10-
" O t
C
52 B. Kramer and R. Bauer
3311,0 ms . . . . . . . . ,
-7t2.7ms -,- 581.4 ms ~,- 369.1ms -,- 3772ms. ,-12706msq
@
(A)
' " ~ ; o " 1 6 o
Number of i n te r -d i schGrge intervGt in the order of occurrence
1 0
(B)
~o 16o ' ~o Number of in ter- discharge interval in the order of occurrence
Fig. 4(A and B). Sequential representation of a G. petersi i 's discharge activity during agonistic behaviour. Each point is one interval, plotted sequentially on the abscissa. The ordinate is the length of each interval (logarithmic scale). (A) Display of a male. The whole series represents 3.3 s chosen from a 180 s record. During overt attack, interval length gradually declines (i.e. discharge rate increases). During subsequent antiparallel lateral display, a highly stereotyped discharge pattern, consisting of paired pulses and equally spaced pulses, is displayed. This high discharge rate pattern is terminated by a discharge break (350 ms in the present case). Note that this long interval is directly preceded by an 8 ms interval. (B) Displays of a female, associated with attacks. Note that there are no 8 ms interval sequences. The whole series represents 4.4 s chosen from a 180 s record
(interval length diminishes). After the head butt, G. petersii may veer away or--as in the case of Fig. 4A- - i t orientates itself alongside the other fish in a head to tail position. It is at this moment that a rather stereotyped discharge pattern of a high rate is emitted. It consists of two types of activity: the first is a very regular alternation of approx. 8 and approx. 16 ms intervals, the second is a sequence of equally spaced intervals either at the 8 or the 16 ms level. There are no intermediate intervals, explaining why there is a gap in the interval histogram (Fig. 3 c). The relative proportion of the two types of activity is variable (examples see Fig. 5). The only female among the animals
Agonistic Behaviour in a Mormyrid Fish
fOOl A
53
0 1 2 3 4 5 6 7
200,
"- 100. Q 0 uJ
i
: 0
t /~ ...-- G. petersii A
M. rume
8
9 10 11 12 13 14 15' 16
200:
100
17 ~8 19 20 21 22 23 2/,
Time [s]
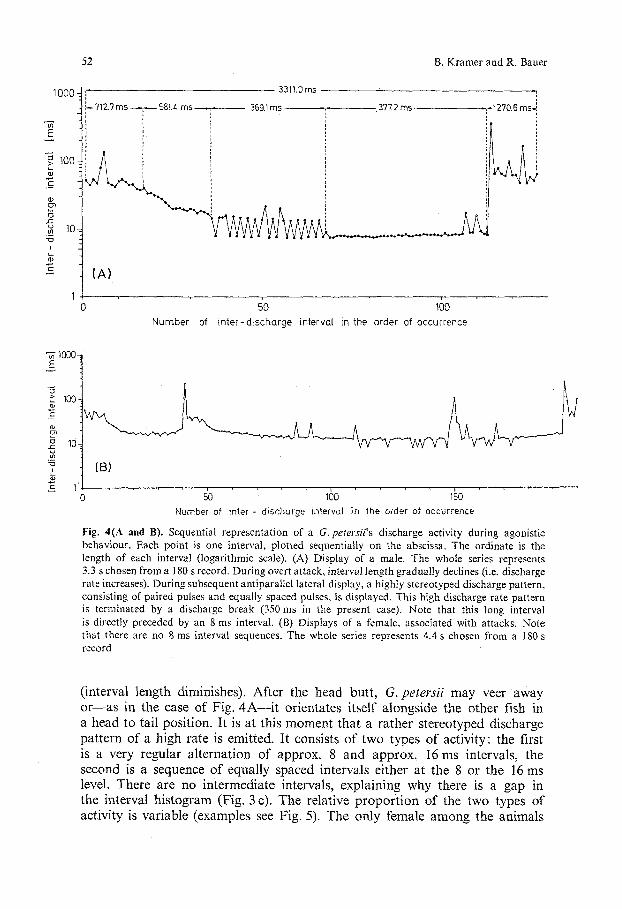
Fig. 5. Interval vs. time of occurrence plot of the concurrent discharge activities of a G. petersii and a M. fume during agonistic behaviour. The abscissa of each point is the time of occurrence (in s) of each discharge, and the ord!nate is the interval (in ms) from the previous discharge. The whole sequence of about 24 s is cut into three parts. Note the variation in high discharge rate patterns, displayed by G.petersii, as far as its corn ponents" paired pulses" and" equally spaced pulses" (see text) are concerned
15 -
=~'-' 10-5_
0
I .~,.. I ~ 0 80 160 2~0 320 400 480 800
EOD interval following high f pattern [ms] Fig. 6. Histogram of intervals terminating high discharge rates, displayed by G. petersii during agonistic behaviour. Note that intervals exhibited by a resting as well as a swimming, isolated G. petersii are below 300 ms (see Fig. 3a and b)

54 B. Kramer and R. Bauer
. . . . . . . . .
L
(A)
Fig. 7(A and B). Agonistlc motor behaviour and the concurrent electrical activities of a G. petersii and a M. rume. (A) Each picture shows the lateral and the bottom views of the experimental aquarium. The scale is marked at 5 cm intervals. The pictures are drawn from photographs of still TV pictures, reproduced from video-tape recordings. The intervals between two successive pictures are 200 ms (except for f and g, where it is shorter, and p and q, where it is twice that interval). The occurrence of each picture is indicated on the time scale of (B) by arrows, a to b is an approach of G. petersii (at left, with a chin appendix) directed at the M. rume; in c another attack starts which results in a head butt in f Subsequently, G. petersii glides into an antiparallel position with respect to the M. rume. In (B) an interval vs. time of occurrence plot is shown for the concurrent discharge activities of both fishes. Note that the discharge rate, displayed by G. petersii, increases during overt attack. Physical contact occurs just before a stereo- typed, high discharge rate pattern starts. This pattern is associated with an antiparallel lateral display
u sed in this s t ud y exh ib i t ed s o m e w h a t d i f fe ren t d i sp l ays (Fig. 4B) . The re were n o equa l ly spaced in t e rva l s e q u en ces at t he 8 m s (i.e. t he h ighes t d i scharge rate) level. I f this f i n d i n g c o u l d be genera l i sed , m a l e a n d f ema le d i sp lays c o u l d c o n s e q u e n t l y be d i s t i n g u i s h e d by the i r d i scharge rates .
W h e n the fish swims away , the h i g h d i scharge ra t e does n o t g r a d u a l l y dec l ine as it does in the s p o n t a n e o u s bu r s t s o f r e s t ing G . p e t e r s i i (Bauer , 1974) n o r

Agonistic Behaviour in a Mormyrid Fish 55
3~176 l 25o- 1
200
. -&
g iso~
.s
m
' 100
so j
0- 0
(B)
G. petersii ~ / I / t
~ M. rurne / , v .V
t t t t l t t t t t t ~ t ~ t t 3 t t a b c d e f g h i k [ m n o p q
Fig. 7 (B)
does it decay exponentially as in Gymnotus carapo (Black-Cleworth, 1970); on the contrary, it is terminated by a discharge break (350 ms in Fig. 4A). A histogram of these very long terminating intervals (or breaks) is shown in Fig. 6. The range of these intervals is beyond the range of intervals normally displayed by a swimming G. petersii (compare Fig. 6 with Fig. 3b).
3. Agonistic Motor Behaviour Associated with Electrical Discharge Patterns
One of the major aims of this study was to analyse the exact relationship between agonistic motor behaviour and the concurrently emitted discharge activ- ity. Fig. 7 A shows a .series of still pictures taken during an attack of a M. rurne by a G. petersii in regular intervals of 200 ms 0c= the moment of physical contact has been inserted additionally; the last two intervals are 400 ms). The moment when each picture was taken is indicated on the abscissa (=time scale) of Fig. 7B, which shows the concurrent discharge activities of the two fishes.
In Fig. 7A (a) G. petersii displays a brief approach associated with a transient discharge-rate acceleration, both terminated in Fig. 7A (b). Fig. 7A (c) coincides with the beginning of a new attack; at the same moment, the discharge rhythm accelerates (Fig. 7B), During 7A (d) and (e) the discharge rate increases as the distance from the attacked M. rume, which does not move, diminishes. Physical contact occurs in (f), i.e. shortly before the characteristic high discharge rate, discussed above, starts. During 7A (g) to (i) G. petersii glides into an antiparallel position with respect to the M. rume, while emitting a high discharge rate which lasts until 7 A (o). The antiparallel position is maintained beyond the discharge break.

56 B. Kramer and R, Bauer
140
120
:5 100- i
g
80-
~ 60- ~6
n,- 40 "
15
~ " ~,;// " 'r
1 i I / t
'1 / / ', / / I I �9 l/ l i �9 z i ! 52/
�9 ,ee lle
... ~..... ......... ..'. Lateral , , . . . . . , , , . . . . ~ display
t0 5 0 after Distance from attacked fish [ c m ] ~ head butt
Fig. 8. Relationship between the rate of EOD of an attacking G. pe ters i i and the distance from its mouth to the body of a M . rume. Twenty-eight attacks are represented as displayed by four different G.petersii, whose initial distances from the M . rume varied between approximately 1
and 15 cm. The dotted lines connect points which represent three individual attacks. Note that in all but three attacks, the EOD rate displayed at the moment of physical contact (=zero distance) is below 80 Hz. During subsequent lateral display, the maximum EOD rates exhibited are above 110 Hz in most cases
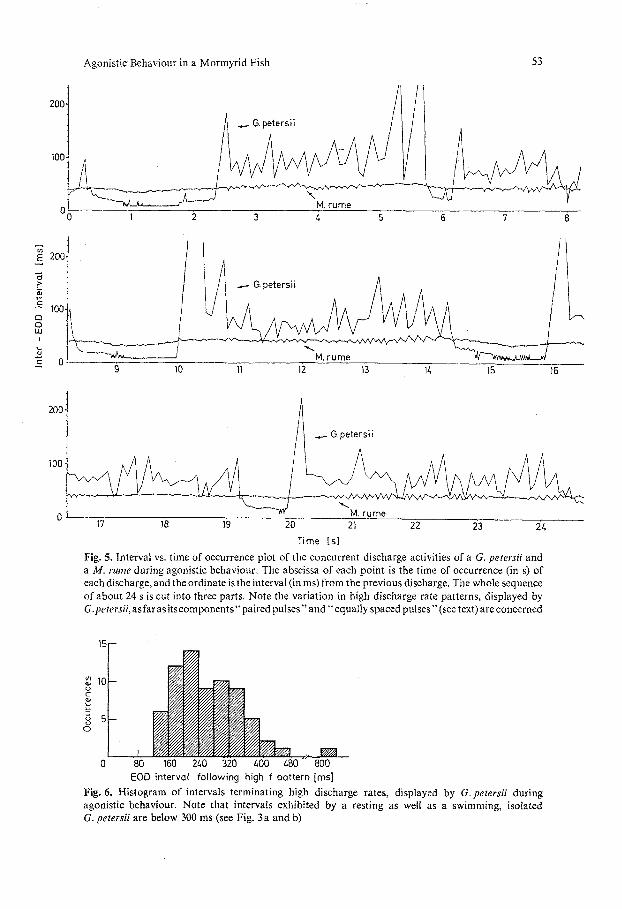
From these observations the question arises whether or not a relationship exists between the discharge rate of an attacking G. petersii and its distance from the attacked fish during the initial period of attack. In order to find an answer to this question, twenty-eight attacks, displayed by four different individuals, were analysed (Fig. 8). The initial moment of an attack was defined by the occurrence of a discharge rate of or above 40 Hz (25 ms interval), since in our experiments G. petersii attacked invariably when it displayed that EOD rate. At this moment, the distance between the mouth of G. petersii and the body of the attacked M. rume was comprised between 1 and about 15 cm; the mean is 6.5 cm (Fig. 9). At 50 Hz, this distance was smaller in each case analysed (mean: 4.5cm, p<0.001). At 60 Hz, physical contact occurred (or had already occurred) in six attacks; the mean distance is 2.2 cm (p<0.001 with respect to the distance observed at 50 Hz). In all but three attacks, the EOD rate associated with physical contact was below the 80 Hz level; the mode of distribution is 61 Hz. The extreme values are 52 and 141 Hz. The distribution of EOD rates, displayed at the moment of physical contact, is significantly different (p < 0.001, sign test) from the distribution of the maximal discharge rates, exhibited during the subsequent lateral displays. The modes are 61 and about 135 Hz, respectively.
Fig. 10 shows a tendency of the mean EOD rate to rise as the number of attacks per unit time increases.
Agonistic Behaviour in a Mormyrid Fish 57
r - isl
2 O
o
E o
c fJ
.0 123
I 1 40 50 60
Rate of Electric Organ Disch~arge ~Hz]
Fig. 9. Relationship between the rate of EOD of an attacking G. petersii and the distance from its mouth to the body of a M. fume. The dots represent the mean distances with their associated standard errors which were measured when four different G. petersii displayed a rate of EOD of 40, 50 and 60 Hz, respectively, in twenty-eight attacks
20' �9 X �9 W
~715
Z 10 �9 �9
W n -
O 5 0 �9
0 . . . . , . . . . . . . . . , . . . . 10 15 20 25 Fig. 10. Relationship between the aggressivity of G. petersii and its mean EOD rate. Each point represents one individual. The ordinate is the number of head butts (each tallied as 1) plus the number of approaches (each tallied as 0.5) per min (Fiedler 1967), Recording time: 3 min

58 B. Kramer and R. Bauer
Discussion
In the previous Section it was shown that during an aggressive rush, i.e. a sudden movement of the fish towards an opponent, a dramatic acceleration of the discharge rate takes place. In fact, any increase in swimming speed (Belbenoit, 1972), or, more general, the onset of any intense motor activity (e.g. probing an object with the chin appendage) is accompanied by a discharge rate increase. However, a spontaneous increase of discharge rate above 40 Hz (25 ms intervals) was not observed in our studies (see Fig. 3 a and b).
According to the results presented above, an attack, resulting in a head butt, is a motor pattern which is characterised firstly by a rush, secondly by this rush being directed at an opponent (taxis component), and thirdly by a dramatic discharge-rate increase. These three elements together form the fixed action pattern "head butt". Between its elements, the temporal relationships and the orderly sequence of display are maintained. A head butt may vary in intensity, and it may be interrupted at any time (this has been called an approach in the present study); then the discharge-rate increase is also stopped (Figs. 7A (a) and 7B (a)). This indicates that the discharge-rate increase during an attack is not just an irrelevant phenomenon associated with this behaviour, but rather forms an integral part of the fixed action pattern head butt. Thus it seems likely that these patterns are signals, in other words they probably communicate socially relevant messages.
The hypothesis that the attack-associated discharge-rate increase is an aggres- sive display may be inferred from indirect and direct evidence: (1) the aggressivity of the signal emitter is correlated positively with its EOD mean rate (Fig. 10); (2) a defeated fish ceases to discharge altogether; (3) the receiver of an EOD-rate increase lowers its own EOD rate (Moller and Bauer, 1973) with minimal latency (Kramer, 1974); (4) if the other fish lowers its EOD rate, G. petersii responds by an increase (Kramer, 1974); (5) a dipole model (consisting of small ball electrodes mounted on a transparent plastic rod), devised to imitate as closely as possible the electric field of a G. petersii (Boudinot, 1972), was severely attacked by G. petersii when pulse sequences were played back which had pre- viously been taped from an attacking individual (Kramer, unpublished). The model was attacked less often when it "displayed" the EOD pattern recorded from a resting animal; (6) a G. petersii without discharge (efferent motor control had been destroyed by a section of the spinal cord just cranial to the electric organ) elicited about the same, low amount of attacks as a non-electric fish (Xenomystis sp.). These observations demonstrate that the signal receiver indeed qualifies discharge rate increase, (and, as shown in (4), also discharge rate decrease) as signals, since it reacts to these discharge patterns.
Discharge rate acceleration and high discharge rate are presumably controlled by endogenous programmes. This may be inferred from a study of EOD interac- tion during agonistic behaviour of G. petersii and M. fume (Kramer, 1974). G. petersii exhibits a tendency to delay its pulse by a fixed latency with respect to the previous discharge of the M. rume only when not attacking or displaying; in other words, the information about another fish's discharges, transmitted by the electroreceptors, does not influence the timing of an EOD during attacks and lateral displays.

Agonistic Behaviour in a Mormyrid Fish 59
The question arises why the electric organ is involved in an aggressive fixed action pattern and how this particular behaviour evolved. The power emitted by the electric organ of G. petersii is not sufficient, of course, to stun prey or rivals even at its highest discharge rate..Another possible function for the increase in the discharge rate of this nocturnal animal during the approach of an opponent might be to raise electroreceptor input, since only when G. peter- sii discharges does it obtain information about impedance inhomogenities in its environment by the etectrosensory channel (cf. Lissmann and Machin, 1958; Machin and Lissmann, 1960). However, electroreceptor (mormyromast) res- ponse is frequency-dependent (Kramer-Feil, in prep.); signal detection would be much more accurate at a low and constant discharge rate because of a greater dynamic range and a stable response. Gnathonemus niger is thought to orientate when it discharges in regular intervals at a low rate of around 10 Hz (Moller, 1970). When swimming around and probing the corners o f the aquarium (a situation in which, if at all, the fish may be expected to regulate EOD rate such that it is optimal for electrolocation), G. petersii displays a marked tendency for consecutive intervals to be similar in length (Kramer, 1974, Fig. 3e). Compared with rest, the EOD rate is considerably increased (see p.50). However, that rate is low when compared with the EOD rate displayed by an attacking animal (p.50). Another reason which appears to argue against the above hypothesis is that the electric field is greatly distorted during an attack by lateral tail movements and/or by bending the body (Figs. 2, 7A); under these conditions, object location by means of distortions of the fish's own field must be a difficult-if not impossible-task. For these reasons, it can hardly be imagined that the attack-associated discharge-rate acceleration serves the fish to improve the power of its active electrolocating system.
An alternative hypothesis considers that the electric organ and its command structures are derived from the ordinary neuromuscular locomotor system (Szabo, 1957; Bennet, 1971). As may be inferred also from behavioural results (see p. 58), the command center(s) for locomotion did not lose their connection to what is today the electromotor system. According to this, the increase of the electric-organ discharge rate, which occurs in association with a swimming speed increase, is considered as a remnant of an ordinary locomotor pattern.
When the fish attacks an opponent, the EOD attains a higher rate, however, than if it increased swimming speed without attacking. In other words, an aggressively motivated locomotion is accompanied by an "exaggerated" dis- charge-rate increase which makes the display more conspicuous and distinguishes it from an "ordinary" discharge-rate increase (" ritualisation "). Therefore it is suggested that the attack-associated EOD-rate increase is a remnant of an ordinary locomotory pattern which changed its function to a ritualised aggressive signal that occurs in a socially significant and well-defined context.
An attack, associated with a discharge rate increase, is the prelude for the high discharge rate, exhibited during lateral display. It is interesting to note that during lateral display-when the fish discharges at its maximal r a t e -moto r activity is very much reduced (note that G. petersii barely changes position in Fig. 7A beginning from (g), i.e. after the head butt). In other words, a high intensity but steady state of discharging the electric organ (either of the

60 B. Kramer and R. Bauer
paired pulse or the equally spaced pulse type) is associated with a relatively inactive state of motor behaviour.
Bell et al. (1974) suggest that our observation of the regular succession of 8 and 16 ms intervals may not be typical. Their results showed an irregular succession of the two interval sizes in most cases. It should be emphasized, however, as Bell et al. (1974) did themselves, that their experimental conditions, imposed by technical reasons, were much more restrictive than ours. Another difference which we consider to be very important is that we did not handle our fish for at least three days prior to an experiment. It was the individuals in the apparently best general condition which displayed the longest paired-pulse periods during their high discharge rates.
The high discharge rate might serve three functions: (1) behavioural isolation of closely related, sympatrically living mormyrids (e.g. the two species used in this study); (2) recognition of sexes, as discussed p. 54; (3) synchronisation of mates during courtship. In order to test these hypotheses, data collected under natural conditions in the original biotopes are needed.
Acknowledgements. Both authors were sponsored by DFG (Deutsche Forschungsgemeinschaft) fellowships and research grants. We are especially indebted to Dr. T. Szabo for the invitation to join his staff in Paris and later Gif-sur-Yvette, for his helpful discussions and critical comments. Likewise, we wish to thank Prof. Dr. H. Markl, University of Konstanz, and Dr. M. Westby, C.N.R.S. Gif-sur-Yvette, for their critical reading of the manuscript. We gratefully acknowledge the expert technical aid of M. Boudinot.
References
Bauer, R.: High electrical discharge frequency during aggressive behaviour in a mormyrid fish, Gnathonemus petersii. Experientia 28, 669 (1972)
Bauer, R. : Electric organ discharge activity of resting and stimulated Gnathonemus petersii (Mormyri- dae). Behav. 50, 306-323 (1974)
Bauer, R., Kramer, B.: Relations entre le comportement agressif du Mormyrid~ Gnathonemus petersii et sa d~charge ~lectrique. J. Physiol. (Paris) 67 (2), 240--241 A (1973)
Bauer, R., Kramer, B.: Agonistic behaviour in mormyrid fish: latency-relationship between the electric discharges of Gnathonemus petersii and Mormyrus rume. Experientia 30, 5t-52 (1974)
Belbenoit, P. : Relations entre la motricit6 et la d~charge ~lectrique chez les Mormyridae (Teleostei). J. Physiol. (Paris) 65 (2), 197A (1972)
Bell, C.C., Myers, J.P., Russell, C.J.: Electric organ discharge patterns during dominance related behavioral displays in Gnathonemus petersii (Mormyridae). J. comp. Physiol. 92, 201-228 (1974)
Bennett, M.V.L.: Electrolocation in Fish. Ann. New York Acad. Sci. 188, 242-269 (1971) Bennett, M.V.L.: Electric organs. In: Fish physiology, Vol. V (ed. W.S. Hoar, D.J. Randall),
p. 347-491. New York-London: Academic Press I971 Blache, J.: Les poissons du bassin adjacent du Mayo Kebbi. Etude syst~matique et biologique.
Paris: Orstom 1964 Black-Cleworth, P.: The role of electrical discharges in the non-reproductive social behaviour
of Gymnotus carapo (Gymnotidae, Pisces). Anim. Behav. Monogr. 3, 1-77 (1970) Boudinot, M.: Contribution ~ l'&ude des caract+ristiques ~lectriques de l'organe effecteur de Gna-
thonemus petersii. M+moire pr6sentb au conservatoire national des Arts et M&iers pour obtenir le dipl6me d'ing6nieur C.N.A.M., Paris 1972
Fiedler, K.: Ethologische und neuroanatomische Auswirkungen von Vorderhirnexstirpationen bei Meerbrassen (Diplodus) und Lippfischen (Crenilabrus, Perciformes, Teleostei). J. Hirnforsch. 9, 481-563 (1967)

Agonistic Behaviour in a Mormyrid Fish 61
Hopkins, C.D.: Electric communication in the reproductive behavior of Sternopygus maerurus. Z.Tierpsychol. 35, 518-535 (1975)
Kramer, B.: Electric organ discharge interaction during interspecific agonistic behaviour in freely swimming mormyrid fish. A method to evaluate two (or more) simultaneous time series of events with a digital analyser. J. comp. Physiol. 93, 203-235 (1974)
Lissmann, H.W.: On the function and evolution of electric organs in fish. J.Exptl. Biol. 35, 156-191 (1958)
Lissmann, H.W.: Ecological studies on gymnotids. In: Bioelectrogenesis (ed. C. Chagas, A. Paes de Carvalho), p: 215-226. Amsterdam: Elsevier 1961
Lissmann, H.W., Machin, K.E.: The mechanism of object location in Gymnarchus niloticus and similar fish. J. Exptl. Biol. 35, 451486 (1958)
Machin, K.E., Lissmann, H.W.: The mode of operation in the electric receptors in Gymnarchus niloticus. J. Exptl. Biol. 37, 801-811 (1960)
M6hres, F.P.: Die elektrischen Fische. Natur und Volk 9i, 1-13 (1961) Moiler, P.: 'Communication' in weakly electric fish, Gnathonemus niger (Mormyridae). I. Variation
of electric organ discharge (EOD) frequency elicited by controlled electric stimuli. Anim. Behav. 18, 768-786 (1970)
Moller, P., Bauer, R.: 'Communication' in weakly electric fish, Gnathonemus petersii (Mormyridae) II. Interaction of electric organ discharge activities of two fish. Anita.. Behav. 21, 501-512 (1973)
Poll, M.: Recherches sur la faune ichthyologique de la r+gion du Stanley-Pool. Ann. Mus. Congo, s6r. in-8 ~ Zool., vol. 71 (1959)
Russell, C.J., Myers, J.P., Bell, C.C.: The echo response in Gnathonemus petersii (Mormyridae). J. comp. Physiol. 92, 181-200 (1974)
Scheich, H., Bullock, T.H.: The detection of electric fields from electric organs. Handbook of sensory physiology, Vol. III/3 (ed. A. Fessard), p. 201-256. Berlin-Heidelberg-New York: Sprin- ger t974
Szabo, T.: Anatomo-physiologie compar6e de divers organes +lectriques et de leurs centres nerveux de commande. Paris: Th~se 1957
Szabo, T.: Orientierungsmechanismen bei elektrischen Fischen. Fortsehr. Zool. 21, 190-210 (1973) Szabo, T., Fessard, A.: Physiology of electro-receptors. In: Handbook of sensory physiology,
Vol. III/3 (ed. A. Fessard), p. 59-124. Berlin-Heidelberg-New York: Springer 1974 Westby, G.W.M.: Has the latency-dependent response of Gymnotus carapo to discharge triggered
stimuli a bearing on electric fish communication? J. comp. Physiol. 96, 307-341 (1975)
Received August 15, 1975
Bernd Kramer Universit/it Konstanz, Fachbereich Biologie Postfach 7733 D-7750 Konstanz Federal Republic of Germany