agr water pricing japan and korea - oecd.org - oecd the oecd study (2010) sustainable management of...
TRANSCRIPT

Agricultural Water Pricing: Japan and Korea

2
ORGANISATION FOR ECONOMIC CO-OPERATION AND DEVELOPMENT
The OECD is a unique forum where the governments of 30 democracies work together to address the economic, social and environmental challenges of globalisation. The OECD is also at the forefront of efforts to understand and to help governments respond to new developments and concerns, such as corporate governance, the information economy and the challenges of an ageing population. The Organisation provides a setting where governments can compare policy experiences, seek answers to common problems, identify good practice and work to co-ordinate domestic and international policies.
The OECD member countries are: Australia, Austria, Belgium, Canada, the Czech Republic, Denmark, Finland, France, Germany, Greece, Hungary, Iceland, Ireland, Italy, Japan, Korea, Luxembourg, Mexico, the Netherlands, New Zealand, Norway, Poland, Portugal, the Slovak Republic, Spain, Sweden, Switzerland, Turkey, the United Kingdom and the United States. The Commission of the European Communities takes part in the work of the OECD.
© OECD 2010
Agricultural Water Pricing: Japan and Korea
JAMES E. NICKUM AND CHISA OGURA
JAPAN OFFICE, ASIAN WATER AND RESOURCES INSTITUTE

4
Note
This document, Agricultural Water Pricing in Japan and Korea, by James E. Nickum and Chisa Ogura, of the Japan Office of the Asian Water and Resources Institute, is one of the background reports supporting the OECD study (2010) Sustainable Management of Water Resources in Agriculture, which is available at www.oecd.org/water.
The report was carried out under the auspices of the OECD Joint Working Party on Agriculture and the Environment of the Committee for Agriculture and the Environment Policy Committee. The report is published under the responsibility of the author and does not necessarily reflect the views of the OECD or its member countries.
The other background reports (also available at www.oecd.org/water) are:
An Economic Analysis of the Virtual Water Concept in Relation to the Agri-food Sector Dennis Wichelns, Hanover College, United States http://dx.doi.org/10.1787/786736626756 Agriculture’s Role in Flood Adaptation and Mitigation – Policy Issues and Approaches Joe Morris, Tim Hess and Helena Posthumus, Cranfield University, United Kingdom http://dx.doi.org/10.1787/786804541573 Environmental Effectiveness and Economic Efficiency of Water Use in Agriculture: The Experience of and Lessons from the Australian Water Reform Programme Michael D. Young, University of Adelaide, Australia http://dx.doi.org/10.1787/786732081512 Financing Water Management and Infrastructure Related to Agriculture across OECD Countries Frank A. Ward, New Mexico State University, United States http://dx.doi.org/10.1787/786788524232 Agricultural Water Pricing: EU and Mexico Alberto Garrido, Universidad Politécnica de Madrid; and Javier Calatrava, Universidad Politécnica de Cartagena, Spain http://dx.doi.org/10.1787/787000520088 Agricultural Water Pricing in Turkey Erol H. Cakmak, Middle East Technical University, Turkey http://dx.doi.org/10.1787/787034266022 Agricultural Water Pricing: Australia Seamus Parker, Council of Mayors (South-East Queensland); and Robert Speed, Freelance Consultant, Australia http://dx.doi.org/10.1787/787105123122
Agricultural Water Pricing: United States Dennis Wichelns, Hanover College, United States
http://dx.doi.org/10.1787/787165082115

5
ACKNOWLEDGEMENTS
Preparing this report involved the accumulation of a large number of materials from involved parties, plus one field trip each to Korea (Icheon) and Japan (Niigata). The authors wish to acknowledge with gratitude the contributions, assistance and guidance in these matters from Mr. Hideaki Tanaka, Mr. Jun Shobu, Mr. Motofumi Tone, Mr. Shunichi Hoshino, Mr. Sadao Tsuchida, and Ms. Shin Mingjeong in Japan, and Mr. Lee Bong-Hoon, Mr. Kim Chun-Gie, Dr. Jo Jin-Hoon, Mr. Park Chang-Kyoo, Mr. Young D. Kim, Mr. Han Sang Soo, Mr. Kim Yong Su and Dr. Jin Soo Kim. We have no doubt neglected to include some people in this list, and for that we apologise. Needless to say, the opinions expressed and the arguments employed in this document are the sole responsibility of the authors and do not necessarily reflect those of the OECD or the governments or organisations of Japan or Korea.

6
Table of Contents
Executive Summary ....................................................................................................... 7
1. Scope and objectives of this study and background on Japan and Korea .................. 7 2. The definition and components of the costs of supplying water for irrigation in Japan and Korea ................................................................................................... 8 3. Country case studies .................................................................................................. 9 4. Review of recent literature on agricultural water pricing in Japan and Korea ......... 25 5. Main Policy Conclusions ......................................................................................... 29
Appendix: Conversion rates ........................................................................................ 32 Bibliography ................................................................................................................ 33

7
Executive Summary
Agricultural water use in Japan and Korea is dominated by a mature, water-intensive paddy field rice sector that relies on the natural supply of the summer monsoon as well as on irrigation, primarily from surface sources. Rice self-sufficiency, achieved by both countries, has potent symbolic and political weight, especially since the import ratio of all grains in both countries is among the highest in the OECD. At the same time, farm populations and infrastructure are aging, domestic rice consumption is falling, and the area under cultivation is shrinking.
Japan and Korea rank seventh and eighth respectively among OECD countries in the share of freshwater abstractions going to agriculture, which accounts for over 60% of the total. Because of similarities in climate, cropping, and population trends, there are many similarities in institutions and policies in the two countries. At the same time, there are important differences, for historical and policy reasons, and because water availability is much more limited in Korea. For example, there is stronger horizontal separation of irrigation projects operating at different scales in Korea. Especially since 2000, there has been a significant difference in water pricing as well.
In principle, Japanese farmers pay operations and maintenance costs and a portion of capital recovery in fees to land improvement districts (LIDs), which serve as semi-autonomous basic-level irrigation districts. At 500 USD/ha and 8% of monetized costs, plus mandatory labour contributions, these fees are significant to a farm budget and high in international comparison. At the same time, they are based on area, not volume. Because of high and, until 1998, growing per hectare application of water on rice fields (passing 20,000 m3/ha), the amount paid per cubic meter is more in line with international practice. Water charges in Japan include drainage fees.
In Korea, the 60% of rice lands in larger schemes under the management of the Korea Rural Community Corporation (KRC) have been exempted from agricultural water charges (excluding mandatory labour levies) since 2000. The smaller schemes outside KRC domain, managed under the oversight of local governments by Irrigation Associations (IAs) or by individual farmers, remain largely responsible for covering all their capital, O&M and labour costs.
Water rights in both countries are segmented into customary rights and permitted rights. In principle, these rights are inalienable. In Japan, the government instituted a program to transfer water from agriculture to domestic uses in 1972, and intersectoral water competition was prominent during the period of rapid growth that ended in 1991. Few transfers have occurred in the past decade, however, because overall water use in all sectors has been in decline since 1996, and competition over use is highly localized and rare. In Korea, there is lower water availability and continuing growth in domestic water use, as well as in river maintenance. Water transfers from agriculture to other uses are rare, however.
1. Scope and objectives of this study and background on Japan and Korea
The key objective of the study is to provide an empirical study of agricultural water pricing for irrigation in Japan and Korea, examining agricultural water price ranges and characteristics, and the extent to which the price paid by irrigators for water recovers operation and maintenance costs and capital costs for water delivery to the farm. Although it is commonly argued that monsoonal East Asia or rice (paddy) dominant agricultures have distinctive features that limit the applicability of pricing or market mechanisms (e.g., Renault and Facon, 2004, Hur et al, 2004), we do not address that issue here, one way or the other.

8
Along the way we touch upon institutional arrangements; types of water property rights; pricing agencies; use of economic instruments in water pricing; and the extent of intersectoral water competition. Where appropriate, we show variations in agricultural water pricing and characteristics across Japan and Korea, with consideration of presenting such information in a standardized fashion to make it comparable with data in other countries.
2. The definition and components of the costs of supplying water for irrigation in Japan and Korea
2.1 Japan
Water charges on agricultural users in Japan are almost all levied by one of the 6,000 land improvement districts (LIDs) that serve as irrigation districts. The focus is on recovery of LID costs, not efficiency pricing. Most irrigation is by gravity, although in some low-lying reclaimed areas, pumps are used for both irrigation and drainage, and an area-based surcharge is levied for this purpose. In well over 90% of LIDs, charges are based exclusively on area; volumetric charges are applied in fewer than 100 LIDs and then on a supplemental basis (Fujimoto and Tomosho, 2004). Charges are based on area with facilities for irrigation, differentiated between paddy and upland, but without consideration as to actual use. Rice (paddy) dominates irrigated land, and virtually all paddy fields are considered to be irrigated. The government has a policy of restricting rice-growing area; currently, 40% of paddy fields are not used for rice, but LIDs charge them as paddy fields nonetheless. Farmers are obligated to provide unpaid labour (e.g., for cleaning and maintaining field channels) as well as funds. Formal changes of registered land use require permission of the local agricultural committee and are subject to a charge by the LID that is high relative to the annual charge.
A typical LID in Japan separates charges to members into the following components: administrative costs (un’ei jimu), maintenance (iji kanri), and redemption of loans for projects within the district (based on field visit to Niigata, August 2008). Charges on farmers on average provide over one-third of LID current income (one quarter including carryover from previous years) and as of 2004 were roughly equal to LID expenditures for O&M, construction and rehabilitation (table [8]). There are no direct subsidies to LIDs from government for recurrent operations and maintenance of facilities. In larger systems, principal components are usually owned by the central or local (prefecture or municipal) government, which pay the bulk of construction costs. Most of these are delegated to LIDs without financial assistance for operations and maintenance. Some of the larger facilities such as major dams or headworks are managed by central, prefectural or municipal governments (Table 6). Some government-owned components such as pumps are physically located within the area of an LID.
2.2 Korea
Since the year 2000, water has been provided with full financial subsidy to users in all systems with a beneficial area over 50 ha, under the oversight of the KRC. Smaller schemes, operated by irrigation associations (IAs) or private farmers, covering less than 40% of the land, are operated on an entirely independent and self-funded basis from the central government or KRC, although with some construction subsidies from local governments, but apparently without standardized cost categories or reliable reporting systems. As in Japan, mandatory unpaid labour for activities such as the maintenance and cleaning of field channels is still required of farmers.
2.3 Resource and opportunity costs
Currently, there is no resource cost charge in Japan and Korea. There have been several attempts to calculate the opportunity cost in Japan (Takada, Tsuboi, & Shigeno, 2002) (Kunimitsu, 2006) (Yamaoka, 2004), but this is not reflected in user charges.

9
2.4 Environmental effects
Adverse environmental effects of farming are difficult to link to water use, and appear to be on the decline in Japan with reductions in cultivated area, pesticide applications and nutrient surpluses. Korea has rising levels of nutrient surpluses, but mainly due to growth in the livestock industry, a relatively minor direct user of water (OECD, 2008a, 2008b). Chemical fertilizer and pesticide applications on paddy fields are declining significantly from high levels in the 1990s. Koh et al. (2004) find significant nitrogen contamination of groundwater in cultivated areas, although J.H. Kim et al (2004) observe in a 2-year sample that nitrogen levels in groundwater are generally higher under upland fields and greenhouse areas than under less permeable paddy fields. They also find that water contamination in most rivers is higher in upstream sections, an observation that is consistent with the finding by H.J.Kim et al (2004) that there are significant watershed effects on COD levels and eutrophication in Korea’s agricultural reservoirs, many of which are increasingly used for local water supply as well. Hur et al (2006) argue for improved watershed management and consideration of the flood retaining capacity of agricultural land in Korea. As living standards and urbanization rise near agricultural facilities, the problem of clearing trash from the channels adds to the burdens of management (field observations, both Japan and Korea).
Positive environmental effects (multifunctionality) of paddy farming are estimated by both Japanese and Korean sources to be substantial. To date, these do not appear to have been explicitly introduced into water pricing or targeted beneficiary charges (e.g., to residents of flood plains), so we do not deal with these estimates in detail here. They are mentioned in the individual country sections, with references.
3. Country case studies
3.1 Overview of common features
Japan and Korea rank seventh and eighth respectively among OECD countries in the share of freshwater abstractions going to agriculture (Kristensen 2004). Average annual precipitation is the highest in the OECD in Japan (1718 mm), while Korea’s 1162 mm is comparable to that of the UK. Rainfall is strongly concentrated in the summer months, during the growing season for rice. At the same time, due to high population density, per capita water withdrawal is low, especially in Korea (Table 1). Paddy farming dominates agriculture in both countries, consuming more than three-quarters of agricultural water (Table 7; H.-S. Kim 2004). The import ratio of grain in both countries is among the highest in the OECD, imparting to rice self-sufficiency a potent symbolic weight.
At the same time, rice farming incomes are falling with the relaxation of price supports, the area under cultivation is declining, and farm populations are probably the oldest in the world. Also, rice consumption per capita is falling throughout East Asia. In Japan it had fallen to 64 kg by 2007, nearly half of its peak of 126 kg in 1960. Korea’s consumption is higher (94 kg in 2007), but has been falling steadily for the past 30 years (derived from US Department of Agriculture, PS&D Online Database and US Census Bureau, International Data Base). Water rights, de jure and de facto, are vested in the state for major projects, while use rights are only minimally transferred, if at all, not only due to institutional rigidities, but also because of the physical separation of agricultural and other users (in Korea) and by the softness of demand by other users (in Japan).
The following are elaborations on background conditions:
3.1.1 High but declining share of agricultural water use
The share of agricultural water use is high, but declining. Agriculture is the dominant water user in both countries, accounting for an estimated 66.1% of total water withdrawals in Japan and for 61.1% of total water use in Korea (Table 1). Nonetheless, this share has remained stable in Japan while both agricultural and total withdrawals have declined since 1996-1997 (Table 2). Since household and industrial water use have also declined during the same period, and droughts are rare and localized, competition for the water resource has not been widespread.

10
There is more competition among water uses in Korea, which has a lower supply per capita (Table 3). Nonetheless, agricultural use has stabilized and is likely to decline. According to official statistics, estimated total agricultural water use increased from 14.7 km3 in 1990 to 16.0 km3 in 2003, but has apparently peaked at this level and is expected to begin a slow decline to 15.6 km3 in 2020 (Table 3). Total urban and industrial water use is estimated to continue to increase modestly, from 10.7 km3 to 11.6 km3, as is water supplied for river maintenance.
In both countries, the primary factor behind decline in agricultural water use is a decrease in the area under cultivation, which is associated with the aging farm population. Water use per hectare (estimated from Table 7) increased in Japan until 1998, when it reached over 20,000 m3/ha, but has declined since then. In Korea, water use per hectare has shown a steady increase, from less than 11,400 m3/ha.in 1980 (estimated from Table 13) to 13,800 m3/ha in 2001 (supplied by Korean reviewer), reflecting changes in cultivation methods and increases in facilities supplying water as well as changes in the rules governing water charges.
Table 1. Basic figures on water sector and irrigation for Japan and Korea (with comparisons to Greece)
Japan Korea Greece
Total population, July 2008 (est) 127,288,419 49,232,844 11,120,000
Average precipitation 1960-2007 (mm/year) 1718 1162 652
Total renewable water resources (km3/yr) 420 64.85 74.25
Total renewable water resources (m3/cap/yr) 3300 1491 8370
Total water withdrawal, 2004(J), 2003(K) (km3/yr) 83.5 26.2 7.75
Total water withdrawal per capita (m3/person/yr) 657 393 702
Agricultural water withdrawal as % of total water withdrawal, 2004(J) 2003(K)
66% 61% 81%
Domestic water withdrawal as % of total withdrawal, 2004(J) 2003(K)
19% 29% 16%
Industrial water withdrawal as % of total water withdrawal, 2004(J) 2003(K)
14% 10% 3%
Arable & permanent crops, 2007 (ha) 3,759,000
Area equipped for irrigation, 2001 (J, est) 1999(K) (ha) 3,027,000 889,000 1,593,780
Area actually irrigated (ha) na na 1,312,650
Area of paddy fields (ha) 2,543,000 1,105,000
Actual crop area for rice, 2007 (ha) 1,669,000 950,000
% of area equipped for irrigation that is actually irrigated na na 82%
% of irrigated to arable land 63.70% 47.40% 35%
Note: Greece included for comparison as one of the most intensively irrigated other OECD countries. Sources: Japan: Tokei de miru Nihon 2008: 9 (127,768,000 for 2005); Nihon no mizu shigen 2007: 51, 53, 56; www.maff.go.jp/www/info/bunrui/bun01.html and …bunrui/bun02.html; www.cia.gov/library/publications/the-world-factbook/geos/ja.html; USDA PS&D Online Database Korea: www.cia.gov/library/publications/the-world-factbook/geos/ks.html; Table 3; www.fao.org/nr/water/aquastat/data/factsheets/aquastat_fact_sheet_kor.pdf: USCD PS&D Online Database Greece: www.fao.org/nr/water/aquastat/data/factsheets/aquastat_fact_sheet_grc.pdf

11
3.1.2 Dominance of surface water sources
Groundwater is not a major source of agricultural water in either country, nor is its usage increasing. Groundwater is a minor source for agriculture in Japan and Korea, respectively 5.9% and 10% of total agricultural water use, and is not growing (Table 3 and Table 4). Agriculture uses less groundwater than either domestic or industrial users in Japan. In Korea, industry is not a significant user, so the weight of agriculture is somewhat higher.
Table 2. Annual Groundwater Use in Japan Unit: km3
Total Agricultural Domestic Industrial Aquaculture Construction,
etc.
2000 12.9 3.3 3.7 4.0 1.3 0.6
2001 12.7 3.3 3.7 3.8 1.3 0.6
2002 12.6 3.3 3.6 3.7 1.3 0.6
2003 12.4 3.3 3.6 3.6 1.3 0.7
2004 12.4 3.3 3.6 3.6 1.3 0.7
Source: Ministry of Land, Infrastructure, Transport and Tourism, 2008.
Table 3. Annual Groundwater Use in Korea Unit: km3
Total Agricultural Domestic Industrial Miscellaneous
2000 3.1 - - - -
2001 3.2 - - - -
2002 3.5 1.6 1.6 0.2 0.1
2003 3.7 - - - -
2004 3.7 1.6 1.8 0.2 0.0
2005 3.7 1.7 1.8 0.2 0.0
Source: Korean Water Resources Corporation, Ministry of Land, Transport and Maritime Affairs, 2006.
3.1.3 Rice and food security
Rice farming is seen as an endangered food security sector. Rice (paddy) farming accounts for more than 80% of agricultural water use in both countries. The national average production cost of rice exceeds the national average gross income of rice in Japan, if farmers’ own inputs are factored in (Table 4). Even though producer prices remain well above world market levels, incomes from rice growing are declining. Farm populations are aging and in long-term decline. Occupying more than 50% of total farm land, rice farming is recognized by the governments of both countries as the primary sector in agriculture, and the governments have adopted a variety of support policies. Among the latter is Japan’s Basic Law on Shokuiku (Food and Nutrition Education), promulgated in 2005, that has as one of its underpinnings the promotion of an “awareness and appreciation of traditional {rice-based} Japanese food culture as well as food supply/demand situations” (www.maff.go.jp/e/topics/pdf/shokuiku.pdf).
With the 2008 uptick in world food prices, the collapse of WTO talks and growing concern about the safety of imported rice, there is some hope for a revival of Japan’s rice industry, allowing the Japanese government to relax its rice area restriction policy (currently idling 40% of paddy land).

12
Table 4. Production cost and income/producer price comparison in Japan and Korea for rice
Japan Korea
Production cost
excluding shadow cost
(USD/ha)
Of which, irrigation
and drainage
Production cost
including shadow
cost* (USD/ha)
Gross income
(USD/ha)
Production cost
including farmer inputs
(USD/ha)
Of which, irrigation
Gross receipts
(USD/ha)
1998 10,520 618 13,281 11,040 549.75 23.27 965.50
1999 11,841 681 14,840 11,837 481.80 28.68 857.52
2000 11,675 654 14,575 11,639 365.14 5.16 536.06
2001 10,137 555 12,631 10,325 439.43 5.12 704.81
2002 10,107 562 12,600 10,352 475.71 5.33 778.79
2003 10,789 566 13,439 13,447 415.02 3.52 715.06
2004 11,123 557 13,784 11,025 423.28 5.98 660.87
2005 10,471 514 12,951 10,276 497.30 5.46 664.97
2006 9,939 500 12,274 9,666 513.45 6.04 775.04
Notes: 1) The figures are converted from JPY to USD using the exchange rates in Attachment A. 2) *Shadow cost includes rent for own capital, etc. Source: Japan: (MAFF, various years) Production Cost of Rice and Wheat (annual report); Korea: Calculated from ROK, MAF (2007): 154, 160, 187.
3.2 Country case study –Japan
3.2.1 The institutional arrangements for agricultural water pricing
Types of water property rights: The River Law of 1896 (revised 1997) governs water rights in Japan from surface sources. Formally, such water is public property (administered by the Ministry of Land, Infrastructure, Transport and Tourism [MLIT] or prefectures). Customary water use rights are recognized, and currently apply to 64% in the number of irrigation facilities and 32% of the irrigated area (Table 5) (Shichinohe, 2003) (Nakai, 2007). Most of the remainder are licensed (“authorized”) by MLIT, in its role as the designated river master for larger flows. The rights are subject to periodic renewal.
Table 5. Types of Water Rights in Japan (1999)
No. of facilities [1,000]
(% of total) Irrigation area [1,000ha]
(% of total)
Authorized Water Rights 23.0 (20%) 1,606 (53%)
Customary Water Rights 72.6 (64%) 962 (32%)
Others* 18.2 (16%) 455 (15%)
Total 113.8 (100%) 3,023 (100%)
Note: *Rights to sources not covered by the River Law, e.g., rain-fed storage reservoirs or springs. Source: (Shichinohe, 2003) Table 1 on p.15, originally from the MAFF
13
The River Law prohibits the direct exchange of water rights for money. Another factor that has inhibited the explicit exchange of water rights is that if water use is not used for its designated purpose, the use right may be rescinded (Takada et al. 2002). Agricultural water rights for surface water are allocated to LIDs, not to individual farmers.
The Civil Law stipulates that the ownership of groundwater under private land belongs to its land owner. Laws and regulations of central and local governments restrict groundwater exploitation in designated areas. (Nakashima, 1997, p. 1)
Roles of vertically related bodies (the central government, local governments, municipalities, and LIDs): In Japan, responsibilities for the construction of a given irrigation scheme are distributed among the central government, prefecture, municipality, and LIDs, as shown in Figure 1. This is quite in contrast with the horizontally bifurcated system of Korea (Figure 3). For example, in a large reservoir-based scheme, the central government may construct, and sometimes manage, a large dam in the upper catchment, while one of the 47 prefectures builds, and sometimes manages, a smaller dam, pumping station, or large river diversion headworks, and the basic level of government (the municipality) may construct and sometimes remain in charge of feeder canals or facilities such as pumping stations and monitoring and control works, while LIDs construct and oversee the delivery canals and drainage systems. In principle, responsibilities for O&M of these government-built facilities are delegated to LIDs in accordance with the Land Improvement Act without financial assistance, although, as noted, different levels of government also manage some key facilities, especially large multipurpose reservoirs (Table 6).
A complicated set of rules, derived from a number of separate acts, governs the allocation of construction costs in Japan. The central government may cover 70% of the cost of the dam or headworks of a project with a beneficial area over 5,000 ha. When the expected beneficial area of a project exceeds 3,000 ha, construction can be carried out by the central government, which covers two-thirds of the capital cost. The cost allocation of the remainder is left in the hands of prefectural governments. MAFF sets guidelines for local governments’ cost sharing for national irrigation projects as follows:
• the central government 66.6% • prefectural governments 17.0 % • municipalities 6.0% • farmers (charged by LIDs) 10.4%
Projects with beneficial areas over 200 ha can be constructed by prefectural governments. Smaller facilities are built by municipalities or LIDs themselves. In those cases, subsidies from the central government are available. MAFF guidelines provide the following ratios for prefectural irrigation projects:
• the central government 50% • prefectural governments 25% • municipalities and farmers (through LIDs) 25%
Although there is considerable variation among projects based on the prefecture or municipality and the size and type of project, farmers’ contributions to the construction of irrigation facilities average 3 to 25% (from field visits).

14
Figure 1. Typical patterns of layered responsibility in Japan
Source: Interviews.
The central government
Prefecture
Municipality
Land Improvement Districts (LIDs)
A irrigation scheme
B irrigation scheme
C irrigation scheme
Large core facilities (dam, reservoir, etc.)
Large facilities (dam, large headwork, etc.)
Medium facilities (headwork, canal, etc.)
Most other facilities
D irrigation scheme

15
Once constructed, actual operation of an irrigation facility is often delegated to a lower level. LIDs operate nearly 60% of the length of canals built by the central government, and 60% of other facilities (Table 6).
Table 6. Delegated operation of centrally constructed irrigation and drainage facilities
Core irrigation and drainage facilities constructed by the central government*
Total
Operated by:
CG PF MP LIDs Others
Canals (km) 22,967 94 633 8,849 13,338 53
Share 100% 0.4% 3% 39% 58% 0%
Other facilities (numbers) 1,761 20 296 356 1,079 10
Share 100% 1.1% 17% 20% 61% 1%
Notes: 1) * As of 2006. The core facilities constructed and owned by the state, basically with beneficial area of more than 3,000 ha. 2) ** As of 2001. 3) CG: Central government; PF: Prefectures; MP: Municipalities. 3) Other facilities include 1089 pumping stations, 338 diversion headworks, 219 dams and reservoirs and 115 sluice gates. Source: MAFF, 2007, Division of responsibilities between central government and local government on land improvement projects. Rural Development Bureau, Irrigation Division, MAFF.
3.2.2 Pricing agencies
In certain places, historical water user groups remain as voluntary organizations mainly for preventing irrigation facilities from disasters, and charge a fee on farmers. Also in some areas, water pump associations were established independently from LIDs, and charge farmers for pumping costs (Table 9). With these minor exceptions, LIDs, which are non-profit, tax-exempt organizations (Kobayashi, 2006), are the authorized pricing agencies for farmers under the Land Improvement Act of 1949.
Almost all LIDs charge water fees based on land area, often without consideration of what the crop is or even whether it is fallow due to the government policy of cutting rice acreage (Kuramoto et al., 2002). The water fee for upland fields is usually set around 20-50% of that for paddy fields. Charges on farmers sometimes vary by provisions such as area (timing of land improvement, level of access, productivity, historical antecedent basis, etc.) or delivery system (pipeline vs. canal). Volumetric charges are extremely uncommon, charged by only 0.4% of LIDs which use sophisticated pumping and pipe systems. Even in these cases, volumetric charges are combined with a basic area levy (Fujimoto & Tomosho, 2004). LIDs also require contributions of labour to maintain irrigation facilities, including cleaning channels. These obligations are distributed equally among households, without any financial incentives.
3.2.3 Intersectoral water competition
Most new water rights applications are based on developing new facilities to intake water above the base flow in rivers (already nearly all allocated to agriculture), usually for non-agricultural uses. The government introduced a rice acreage reduction policy and, in 1972, a scheme called the Water Rationalization Project to transfer water from agriculture to domestic uses by improving irrigation facilities so as to release water thereby saved (Nakashima 1998). Takada et al. (2002) estimated the shadow prices of residential and agricultural water in 1997 as 142 JPY/cu.m. and 17.55 JPY/cu.m. respectively.
With the Water Rationalization Project and other local government-led projects, a total of 40.1 cubic meters per second of water has been transferred to other uses, particularly around the Tokyo metropolitan area (Ministry of Land, Infrastructure, Transport, and Tourism, 2007). Few transfers have occurred since the end of the period of rapid growth in 1991, however. The transfer program is not expanding, and may be in decline as older arrangements lapse without renewal. Takada et al (2002) give a total of 45.9 cu.m./s. for transferred rights up to 1996, somewhat higher than the current figure.

16
One reason for the stalling of this transfer program would appear to be that overall water use including agriculture, industry, and urban sector has been in decline since 1996 (Table 7 on the next page). Intersectoral water competition has become rare and localized to a limited number of areas that are still urbanizing, such as the northern Kanto plain. Although permanent transfers have become less frequent, the government still supports them to increase the security of supply to nonagricultural users during drought periods and to provide additional releases for environmental purposes.
3.2.4 Multifunctionality
There are a number of efforts to evaluate the environmental benefits of multifunctionality of paddy fields in Japan (e.g. Science Council of Japan, 2001; Yamaoka, 2004) and compensatory payments are made for a limited number of these, such as the use of farm drains by non-farm users and for ecologically beneficial farming. Numerous benefits to the ecosystem have been identified, including flood mitigation, frequently cited as a major benefit of paddy fields, groundwater recharge and erosion control. MAFF hosts the secretariat of the International Network for Water and Ecosystem in Paddy Fields (INWEPF), established in 2004 as a forum for those involved in rice growing to network in areas such as giving consideration to multiple uses of agricultural water, including environmental aspects (Yamaoka, 2004).
3.2.5 Stock management
There are growing fiscal pressures on the public portions of irrigation management. While the stock of irrigation facilities and their replacement value have grown over the years, renewal costs have taken a growing share of a rapidly declining central government budget devoted to irrigation. MAFF implemented a new scheme called “Stock management” for important facilities. Through implementing a standard procedure to check and evaluate the ageing of facilities, and to carry out rehabilitations under the budget constraint, this approach aims to reduce the cost of major rehabilitation.
3.2.6 Cost structure and subsidies
Cost structure of LIDs and charge on farmers. In principle, LIDs add O&M costs and their share of capital recovery, then allocate those costs to members based on the area of farmland. However, the actual accounts are quite complicated because of carryover, loans, subsidies, and other source of incomes, in addition to the lack of a unified accounting entry system.
Table 8 summarizes the average cost structure of LIDs. LID expenditure categories consist of O&M cost (14% of total in 2004), LID share of capital recovery for their own construction & rehabilitation projects (7%), LID contribution to state (including prefectural) construction & rehabilitation projects (8%), redemption of loans (25%), reserve funds (9%), miscellaneous expenditures (7%), and carryover (25%). Considering that the redemption of loans are also primarily for construction & rehabilitation, as much as 67% of LID expenditures excluding funds carried forward are for capital recovery. It should be noted that construction projects include not only those for irrigation, but also other forms of land improvement projects, such as subfield drainage.
On the other side of the ledger, LID income comes from charges on farmers (26% of total in 2004), subsidies (17%), loans (9%), other income (18%), and carryover (29%). On average, the charge on farmers covers a bit over one-quarter of total expenses including carryover and about one-third of current expenses. In order to lessen LID burden for capital recovery, the central government and municipalities provide several subsidy schemes. LIDs receive loans for their shares of construction costs from a public bank, formerly the Agriculture, Forestry and Fisheries Corporation, which was merged into the new Japan Finance Corporation in October 2008. The interest rate is favourable and fixed, with a term of 25 years, including a grace period of 10 years or less on repayment of capital. The loans are mainly for construction and rehabilitation projects, but some LIDs incur debt to cover shortages. Some LIDs have additional sources of income, such as the lease of ponds for fish farming, and fees for drainage service.

17
Table 7. Estimated Annual Water Withdrawals by Type and Irrigated Area in Japan
Estimated annual water withdrawals by type (km3) Area (ha)
Year Total Agriculture House-hold
Industry Cultivated land Total
Paddy field
Upland field Irrigated share****
Total Share Paddy Up-land
Live-stock
(Irrigated) Total Irrigated
1980 86.0 58.0 67.4% 56.5 1.1 0.4 12.8 15.2 5,461,000 3,055,000 2,406,000 *10.6
% 60.6%
1990 88.9 58.6 65.9% 55.9 2.2 0.5 15.8 14.5 5,243,000 2,846,000 2,397,000 - -
1995 88.9 58.5 65.8% 55.5 2.5 0.5 16.3 14.0 5,038,000 2,745,000 2,294,000 **14.8
% 61.2%
1996 89.1 59.0 66.2% 55.9 2.6 0.5 16.4 13.8 4,994,000 2,724,000 2,268,000 - -
1997 89.1 58.9 66.1% 55.6 2.7 0.5 16.5 13.8 4,950,000 2,701,000 2,248,000 - -
1998 88.7 58.6 66.1% 55.4 2.8 0.5 16.4 13.7 4,905,000 2,679,000 2,226,000 - -
1999 87.8 57.9 65.9% 54.6 2.9 0.5 16.4 13.5 4,868,000 2,660,000 2,207,000 - -
2000 87.0 57.2 65.7% 53.9 2.9 0.5 16.4 13.4 4,832,000 2,641,000 2,189,000 - -
2001 85.5 56.4 66.0% 53.2 2.7 0.5 16.3 12.9 4,793,000 2,623,000 2,170,000 19.0% 63.3%
2002 84.6 56.0 66.2% 52.9 2.7 0.5 16.3 12.3 4,763,000 2,607,000 2,156,000 - -
2003 83.9 55.7 66.4% 52.5 2.8 0.5 16.1 12.1 4,736,000 2,592,000 2,144,000 - -
2004 83.5 55.2 66.1% 52.0 2.8 0.5 16.2 12.1 4,714,000 2,575,000 2,139,000 - -
2005 - - - - - - - - 4,692,000 2,556,000 2,136,000 - -
2006 - - - - - - - - 4,671,000 2,543,000 2,128,000 20.3% 63.7%
Notes: 1) The value is rounded. 2) The water use values are for withdrawals, and do not deduct for return flows, so some double counting may be present between uses, and the share of agriculture in consumptive use might be expected to be higher. 3) Estimated by MAFF * 1983, **1993, ***2006 4) ****Estimated using the irrigated share of upland field, and assuming that paddy field is totally irrigated. Water application rates differ between paddy and upland fields, and possibly between the paddy fields that grow rice (currently restricted to 60%) and those that have alternative uses. Source: (Ministry of Land, Infrastructure, Transport and Tourism, 2007, p.56, 215, 216); (MAFF, 2006); personal communication, MAFF.

18
Table 8. Status of Land Improvement Districts (LIDs) in Japan, and their Cost Structure
1996 2000 2004
The number of LIDs 7,573 7,004 6,103
Number of members (million) 4.51 - -
Covered beneficial area (million ha) 3.14 3.01 -
Average beneficial area per LID (ha) 415 430 -
Cost Structure of LIDs (Unit: USD/ha)
Income 2,539 2,282 2,027
Charge on farmers O&M cost 249 265 264
Capital investment recovery 458 363 272
Subsidies From the central government 203 180 153
From local governments 253 223 193
Loans 449 257 184
Other income 439 423 374
Carryover 488 572 587
Expenditure 2,539 2,282 2,027
O&M Operation 220 222 209
Management 167 178 183
Construction & rehabilitation 273 189 145
Contribution to the state (or local gov.’s) projects 280 225 159
Redemption of loan 831
622 501
Reserve fund 216 234 181
Other expenditure 154
159 144
Carried forward 398 453 506
Note: 1) *Including fee for other use and support from the state, the prefectures, and municipalities. 2) The cost structure does not count labour levy of farmers. Source: Provided by MAFF.
Table 9 summarises average LID charge on farmers in Japan. In 2006, this came to 258 USD/ha for O&M alone, and 430 USD/ha including capital recovery and incorporating charges for land improvement. The average total levy has been declining since 1999, due largely to a fall in the portion attributed to capital recovery. The charge varies considerably from district to district, and even between areas within a single LID. Water fees, including land improvement charges, averaged 7.6% of material costs in 2006 (MAFF 2008b).
The table does not include obligatory unpaid labour. A study done by MAFF in 2005 showed that a typical paddy farm spent 18.3 hrs/ha on these activities for irrigation facilities (MAFF, 2006). Using the labour cost of 13.0 USD/hr which was used in the MAFF’s production cost calculation, the cost for these activities can be estimated at 237USD/ha. Then, the total charge on farmers for O&M including monetized labour, was 586 USD/ha in 2005. By this calculation, nearly half of O&M compensation by farmers is in non-monetized obligatory labour.

19
O&M cost sharing. In keeping with the policy to not subsidize O&M, almost all O&M costs of irrigation facilities under the control of LIDs are covered by themselves from charges on farmers, including obligatory labour. Relevant facilities include major ones constructed by the central or prefectural government, which delegates their management and operation to LIDs without financial assistance. As noted previously, one exception to this rule are very large facilities, such as reservoirs and main canals, that remain under governmental management (Table 6).
Capital recovery and sharing. While figures are available on cost shares for individual construction projects or the government guideline on the share of construction projects, these are not combined to give a comprehensive set of figures on various costs and their allocations on a system-wide basis. Reliable figures are not available indicating the shares of cost recovery paid by different parties for the entire system because of the differences in times of construction of different projects, interest rate changes and refinancing, and the time lags between construction and repayment. It is also difficult to separate irrigation projects from land improvement projects in general.
In addition, several grant schemes are available to reduce the cost recovery share of LIDs. As shown in Table 9, on the average, 14% of the income of LIDs is covered by subsidies from the central government and the local government. In keeping with the policy to not subsidize O&M, these subsidies are provided for a variety of other purposes, such as construction/rehabilitation program, use of farm drains for household discharges, nature conservation, and training for implementing new facilities. Because of these complexities, it is impossible to calculate cost recovery rates or shares for entire irrigation schemes.
3.2.7 Regional differences in water user charges
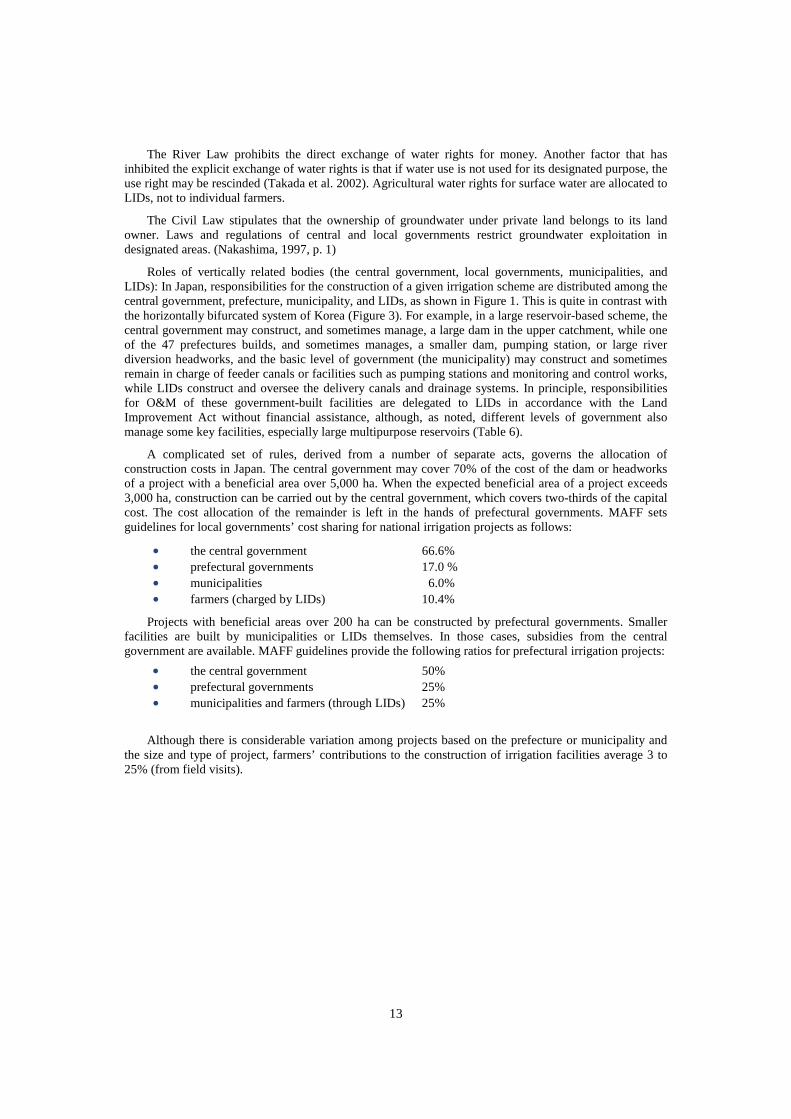
Table 10 shows the range of charges on farmers for irrigation and drainage by regions in Japan. The highest average cost in 2006 was 707 USD/ha in Hokuriku, a water rich region with paddy land constituting over 90% of agricultural area; while the lowest was 205 USD/ha in the economically developed Tokai region, which has a significant amount of farmland in irrigated dryland crops. This difference of over 3:1 clearly cannot be explained by lower water charges for lower water-using dryland. Converted to USD per cu.m., water fees are also lowest in the Tokai region, averaging a bit over USD 0.01/cu.m. while Hokuriku would be one of the highest in Japan, at roughly USD 0.035/cu.m, maintaining the same ratio found with area-based charges (using the data in Table 10 and figures for agricultural area and water use in agriculture by region found in Nihon no mizu shigen 2007: 104). In our limited field research (in poldered lands in Hokuriku), we found that much investment goes into drainage, and that recent land improvement investments are focusing on drainage, especially under paddy fields to allow their conversion to multiple uses. Most likely, the greater expense of pumping for irrigation and drainage is one reason for regional differences, as may be the size and perhaps age of systems, but without further investigation any attribution of causes would be speculative. It can be noted with some certainty, however, that the difference in water charges cannot be explained by a relative scarcity of water.

20
Table 9. Farmers’ Payments for Irrigation and Drainage in Japan, 1998-2006
Unit: USD/ha
Fiscal year 1998 1999 2000 2001 2002 2003 2004 2005 2006
LID charge and
other charge and fee related to
land improvement
and irrigation
LID charge 539 590 562 475 486 479 471 435 430
O&M cost 248 291 284 246 260 266 263 249 258
Capital investment recovery
291 299 278 230 226 213 208 187 173
WUA* charge 63 73 74 64 59 71 72 66 60
Pump association charge
10 10 12 10 9 10 9 9 6
Other 06 7 6 7 8 7 5 4 4
Sub total 618 680 654 555 562 566 557 514 500
Own capital recovery cost
Drain construction
1 1 2 0 0 0 0 0 1
Water lifting pump
1 1 2 1 1 1 1 1 1
Total payments for irrigation excluding labour cost
620 683 657 556 563 567 558 515 501
Share in the production cost excluding labour cost
10.2% 9.9% 9.6% 9.3% 9.2% 8.5% 8.1% 7.8% 7.9%
Total production cost excluding labour cost
6,069 6,927 6,870 6,001 6,153 6,653 6,899 6,596 6,348
Total production cost including labor cost
10,520 11,841 11,675 10,137 10,107 10,789 11,123 10,471 9,939
Note: 1) The figures are converted from JPY to USD using the exchange rates in the Appendix. 2) *Most water user associations (WUAs) have been reorganized into LIDs, but some have remained as voluntary organizations, mainly for preventing disasters. Source: MAFF, Annually, Production Cost of Rice and Wheat; MAFF, personal communication
21
Table 10. Differences between Regions - Farmers’ Payments for Irrigation and Drainage by Region in Japan, 2006
Unit: USD/ha
Region Grand total
LID charge and other charge and fee Own capital recovery cost
Ref.
LID charge
WUA charge
Water pump assoc. charge
Other Drain
construct-ion
Water lifting pump
Paddy field area (000ha)
Yield (kg/10a)
Total
Manage-ment cost
Capital recovery
Average 502 430 258 173 60 6 4 1 1 - 529
Hokkaido 522 507 348 159 9 1 4 0 0 227 530
Tohoku 578 533 308 225 36 6 2 - 1 629 557
Hokuriku 707 654 366 289 39 10 4 0 - 289 533
Kanto・ Tozan
467 356 271 85 95 8 6 0 3 426 534
Tokai 205 98 88 10 94 3 10 - - 165 502
Kinki 413 251 156 96 138 13 11 - - 185 508
Chugoku 282 239 51 188 40 2 1 - - 197 518
Shikoku 275 90 90 - 159 - 1 25 - 94 484
Kyushu 270 174 84 89 89 5 1 - 3 330 502
1) Figures are converted from JPY to USD using the exchange rates in the Appendix. 2) Regions are classified as follows: Source: MAFF, 2008a, Production Cost of Rice and Wheat.

22
3.3 Country case study – Korea
Since 2000, it has become much easier to describe agricultural water pricing in Korea than in Japan: for most farmers, there is no water price. It was not always so; thirty years ago, irrigation operated on a principle of full cost recovery, like industrial and municipal uses. The logic of this policy shift is that it is necessary to lower costs of inputs such as water to rice farmers in exchange for requiring them to continue to grow rice to meet food security objectives (current levels of self-sufficiency are near 100% for rice, but only 26% for total food and feed in total). The abandonment of cost recovery from key users has constrained the options available to water managers, but makes it politically difficult to reverse course. Reductions in agricultural water use to meet growing alternative uses, when the total water use rate is already high, are to be effected through technical rather than economic means, including rehabilitation, similar to Japan’s stock management program. In the meantime, at the local level, facilities designated for agricultural use are increasingly tapped for local water supply.
3.3.1 The institutional arrangements for agricultural water pricing
For purposes of agricultural water management in Korea, paddy farms are divided into two categories: those managed by the Korea Rural Community Corporation (KRC), a semi-public corporation closely affiliated with the Ministry for Food, Agriculture, Forestry and Fisheries that is primarily tasked with managing the 60% of the land under larger schemes (>50 ha); and smaller schemes under the supervision of local governments (Table 11). The farms under the KRC have favourable conditions for cultivation, and are termed “superior farms”. For food security reasons, superior farms are banned by law from uses other than agriculture. To counter strong opposition by farmers to this restrictive policy, in 2000, the Korean government yielded to the farmers’ long-standing demands for a full exemption from water charges. This policy appears to be one of taking a short-term path of least resistance in order to maintain a policy of self-sufficiency in staple grains, but it is clearly unsustainable in the medium- to long-term.
Table 11. Numbers of Irrigation Facilities and Beneficial Area by Operating Organization in Korea
(as of the end of 2005) Total KRC Non-KRC Number Area
(ha)* Number Area
(ha)** Number Area (ha)
Total IAs Other Total 68,306 827 12,965 522 55,341 305 152 153
Reservoir 17,699 470 3,320 340 14,379 130
Pumping & drainage station
7,139 199 3,912 17 3,227 32
Dam and headworks
18,005 94 4,066 15 13,939 79
Infiltration gallery 2,870 14 329 1 2,541 13
Tube well 22,593 50 1,338 0.2 21,255 50
Note: 1) *Beneficial area 2) **Only includes the area covered by the KRC. Source: KRC, MAF [MFAFF], 2006.
Types of water property rights: Similar to Japan, water rights in Korea are both customary, recognized under the Civil Law, and based on permits under the authority of the River Law. In practice, the two rights are intermingled in rural water use. In areas under its supervision, the KRC manages the water rights of agriculturalists; elsewhere, rights belong directly to the farmers. Many academics and involved organizations contend that a revision of water rights is necessary, especially to deal with the environment.

23
Disputes are common between ministries and levels of government over bureaucratic “property rights” over water, especially before construction between the construction-oriented ministries of Construction and Agriculture and the Ministry of Environment and environmental NGOs, who severely inhibit the construction of large dams. In the past, the ministries of Construction and Agriculture did not conflict, as they produced dams of different scales for different purposes.
Organizational roles: The Rural Development Corporation (RDC), Farmland Improvement Associations (FIAs), and Federation of Farmland Improvement Associations (FFIA) were merged into the KRC on 1 January, 2000. Unlike the vertically differentiated schemes in Japan, the facilities under the KRC and local governments (overseeing Irrigation Associations (IAs) and individual farmers) are divided horizontally, by the irrigation districts. All irrigation facilities with a beneficial area of more than 50ha are constructed, operated and managed by the KRC from head to the community level, where basic-level water user bodies called “heungnonggye” represent farmers to the KRC and, presumably, vice versa. Kim (2004) notes that these organizations lack authority or representativeness to provide active bottom-up participation from farmers.
When the beneficial area is under 50ha, but includes more than 5 farmers, irrigation facilities are primarily constructed and managed by more representative, and financially responsible IAs (or Irrigation Clubs). IAs are under the supervision of the local government, which sometimes provides subsidies upon request, but are basically in charge of their own irrigation facilities. IAs charge farmers for nearly all financial costs, on the basis of area (Table 12). Where fewer than 5 farmers are involved, no organization is mandatory (Figure 3). Such individual or small group ownership and operation accounts for approximately 19% of irrigated land, a much higher figure than in Japan.
Figure 3. Schematic of horizontal separation of irrigation responsibilities
Source: Field interviews.
3.3.2 Intersectoral water competition
Korea has abundant water supply in terms of rainfall per unit surface area, but one of the lowest in monsoon Asia in per capita terms. The share of total fresh water resources used (utilization intensity) is one of the highest in the OECD at 35%, considerably above that of Japan (Kim, 2004). The seasonality of Korea’s monsoon is more favourable to rice production than in Japan, so supplemental irrigation is often less essential. A relatively high percent of rice fields are perennially upland, and water cannot be guaranteed to most rice fields in a ten year drought.
Private farmers
IAs
KRC
Irrigation district under KRC
Irrigation district under local governments
Irrigation districts with command areas over 50 ha, from the main facilities (dam, diversion) to the community level
More than 5 members Less than 5 members
24
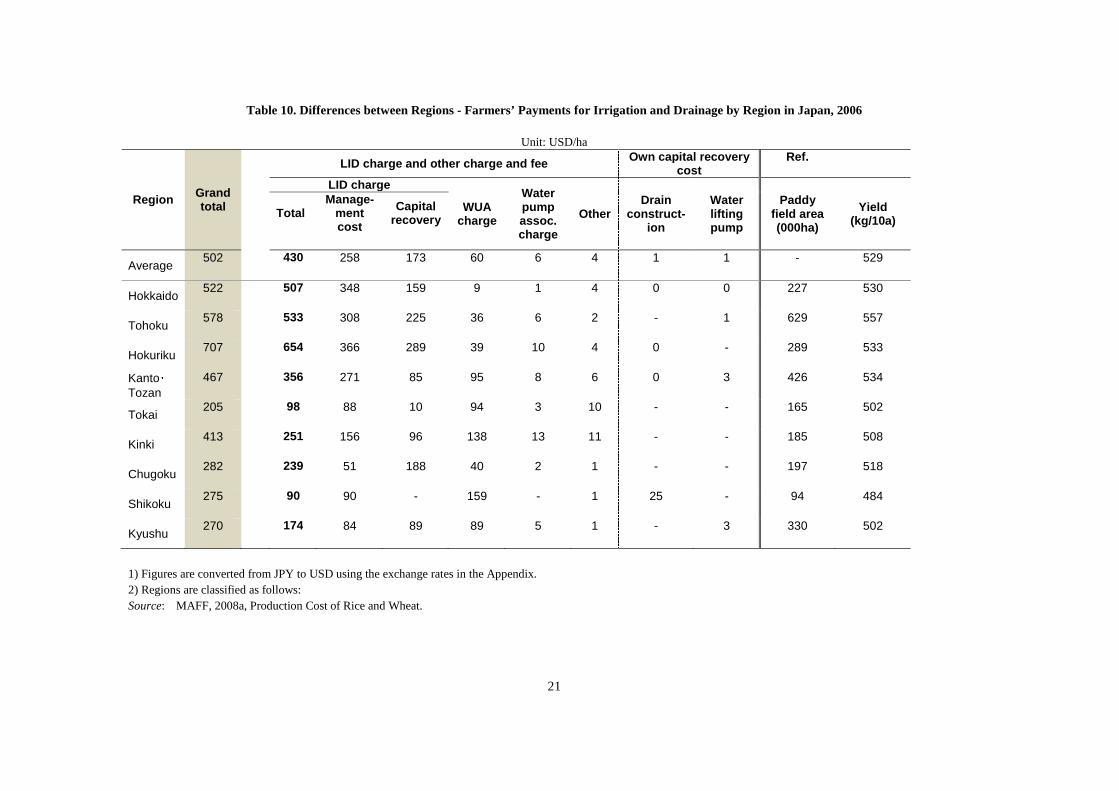
Table 12. Status of Irrigation Associations (IAs) in Korea
Unit: 000 USD
2000 2001 2002 2003 2004 2005
Number of IAs 415,517 410,734 408,121 339,901 312,446 274,245
Benefitted area (000ha)
190 187 180 177 164 152
Charged area (000ha) 137 122 128 108 118 71
Total charge on farmers in charged area
5,593 4,820 5,094 4,025 4,222 2,222
Collected 5,148 4,119 4,250 3,322 4,026 2,146
Uncollected 445 674 845 678 196 75
Total cost 6,704 5,050 5,152 4,354 4,385 *39,937
O&M 3,326 2,696 2,750 1,927 2,377 37,832
Repair 2,056 1,608 1,540 1,707 1,500 1,689
Reserve 1,043 505 562 371 232 320
Others 280 240 300 123 276 97
Average unit charge on farmers (USD/ha)
41 40 40 37 36 31
Note: 1) The figures are converted from KRW to USD using the exchange rates in the Appendix. 2) *Total cost increased significantly in 2005 due to irrigation policy reform. Source: KRC, and MAF [MFAFF], 2006, Statistical Yearbook of Land and Water Development for Agriculture, pp. 504, 505.
There is more potential for intersectoral competition and joint use of water in Korea than in Japan, both because of the greater overall scarcity and intensity of use and because all uses, including river maintenance, are continuing to increase (Table 13). This competition appears to be concentrated within urbanizing rural areas, rather than between urban and rural areas or agriculture and industry. The share of agriculture is falling, however, and the absolute amount of water used is expected to begin a slow decline from now on. In some areas, facilities for non-agricultural uses in effect remove water from agriculture by lowering groundwater or make it more expensive. There is some concern over deteriorating groundwater quality, but largely due to growing non-agricultural uses. While groundwater still provides a minor share of agricultural water, a significant proportion of new water comes from tubewells, causing seawater intrusion in coastal areas (Lee et al., 2008).
3.3.3 Multifunctionality
As in Japan, there have been a number of studies of the positive externalities (multifunctionality) of paddy farming in Korea (e.g., KRC 2007a; Jung et al. 2003). Kim et al (2006) list the positive effects as: flood alleviation (due to 16,000 small irrigation ponds as well as the retaining capacity of bunded rice fields); groundwater recharge (estimated to be as high as 80% of the rate of surface runoff), water purification of paddy soils acting as nutrient sinks; soil erosion control on sloped lands; air purification and cooling; and biodiversity and amenity. Estimates vary widely as to the value these functions, severally and in the aggregate, but are generally high, possibly higher than the value of rice produced. Kim et al. also

25
note a number of negative externalities, including methane emissions; disturbance of the ecosystem by land improvement measures such as canal linings and independent drainage canals; and excessive use of fertilizers and pesticides. Valuation of these effects is far less advanced, however. With active government encouragement, the use of farm chemicals has declined significantly, by 22% for nitrogen fertiliser, 33% for phosphate fertilizer, and 8% for pesticides (from 1990-92 to 2001-03), but nutrient use efficiency remains among the lowest in the OECD and intensity of pesticide use per unit area among the highest (OECD 2008b).
3.3.4 Agricultural water charges and subsidies
In the former state-managed areas that KRC inherited, water fees declined steadily from 1988, when they were cut from 260 kg of paddy per hectare to 100 kg. The following year they were cut in half, to 50 kg/ha. In 1996, they were converted to cash and further reduced, to 60,000 won (75 USD/ha). With the abolition of all charges, financial as well as in kind, on farmers in KRC areas in 2000, average financial charges for all farmers have fallen from 29 USD/ha to 6 USD/ha. (Table 14) IA charges on farmers were 31 USD/ha in 2005, but fees were collected on less than 50% of total benefited lands in part due to waivers because of damages from the severe floods that year, but also because of falling numbers of IAs and growing passivity on the part of rural residents due to declining populations and aging (Table 12; field interview).
Mandatory labour contributions are estimated to offset approximately 35% of total irrigation O&M costs (including KRC). The national government contributes a comparable amount in management subsidies, with KRC, as the water management company, picking up the rest.(Table 15). Approximately half the KRC contribution comes from sales of assets, such as farm roads and easements, which it inherited in abundance. The government provides a number of direct and indirect payments to farmers, including low electricity rates for agriculture (OECD 2008b).
4. Review of recent literature on agricultural water pricing in Japan and Korea
4.1 Recent literature on agricultural water pricing relevant to Japan
The discussion of water pricing in OECD, the Third World Water Forum (held in Kyoto in 2003) and other international conferences have stimulated some academic discussion of water pricing in Japan. Most of this discussion is reactive, concluding that full-cost pricing is not applicable to Japan. The focus of these works tends to be on the efficiency aspects of pricing and markets rather than their role in cost recovery and system maintenance. We will not seek to do more than present a brief summary of these arguments here, since our focus is limited to a description of the characteristics and levels of existing pricing.
Fujimoto and Tomosho (2004) provide a variety of arguments against the introduction of water pricing and markets, at least in the near future, in the “Asian humid tropics,” which in their scheme includes non-tropical but monsoonal Japan and Korea. Among these arguments is that the high variation of precipitation in such a monsoonal climate during the growing season would generate extreme fluctuations in spot markets for water.
With water use stable or declining in all sectors, declining population, and movement from suburban areas into core urban districts, intersectoral conflict is only salient in Japan during local and infrequent droughts. During those times, ad-hoc Water Utilisation Adjustment Councils are convened under the direction of the river administration agencies of the Ministry of Land, Infrastructure and Transportation to negotiate cutbacks in water use by all sectors; in practice, this often entails temporary transfers from agriculture to municipal users (Fujimoto, 2004). Kobayashi (2006: 131-132) terms these “quasi-markets”. Sugiura (2007b) sees these as more community-based and more effective in practice than a full-fledged market. In other work (Sugiura, 2005, 2007a) she identified factors behind historical water trades between farmers, but sees these trades as exceptional cases. Tanji (2008) reviewed historical agricultural water prices and instances of trade in Japan.

26
Table 13. Annual Water Use by Type and Irrigated Area in Korea
Annual water use by type (km3) Area (ha)
Year Agriculture
Domestic Industry Total
extractive uses
River maintenance Total Cultivated
land
Paddy Field
Share Total Irrigated Share
1980 10.2 79.7% 1.9 0.7 12.8 2.5 15.3 1,307,000 893,000 68.0%
1990 14.7 69.0% 4.2 2.4 21.3 3.6 24.9 2,090,000 1,345,000 987,000 73.4%
1994 14.9 62.9% 6.2 2.6 23.7 6.4 30.1 2,033,000 1,267,000 941,000 74.2%
1998 15.8 60.8% 7.3 2.9 26.0 7.1 33.1 1,910,000 1,157,000 881,000 76.0%
2003 16.0 61.1% 7.6 2.6 26.2 7.5 33.7 1,845,000 1,127,000 878,000 77.8%
2005 1,825,000 1,105,000 867,000 78.4%
p) 2006 16.0 59.9% 7.9 2.8 26.7 7.7 34.4
p) 2011 15.8 58.3% 8.1 3.2 27.1 8.4 35.5 - - - -
p) 2016 15.7 57.3% 8.2 3.5 27.4 8.4 35.8 - - - -
p) 2020 15.6 57.4% 8.2 3.4 27.2 8.4 35.6 - - - -
Note: 1) p: projection by Ministry of Land, Transport and Maritime Affairs. 2) * Ministry of Land Transport and Maritime Affairs includes river maintenance as a component of water use. Source: (Ministry of Land, Transport and Maritime Affairs, 2006), (Ministry of Agriculture and Forestry [MAF, subsequently MFAFF], 2007).

27
Table 14. Farmers’ Payments for Irrigation in Korea
Unit: USD/ha
Fiscal year 1998 1999 2000 2001 2002 2003 2004 2005 2006
Irrigation 23 29 5 5 5 4 6 5 6
Share in the direct cost excluding labour cost
3.1% 2.3% 0.4% 0.4% 0.4% 0.2% 0.3% 0.3% 0.3%
Direct cost excluding labour cost 751 1,240 1,342 1,185 1,211 1,539 1,720 2,112 2,393
Imputed labour cost 887 1,003 1,019 897 901 1,058 922 1,037 1,085
Direct cost including labour cost 1,638 2,242 2,362 2,082 2,112 2,598 2,642 3,148 3,477
Overall production cost* 3,553 4,293 4,652 4,066 4,141 4,857 5,019 5,586 6,107
Notes: 1) The figures are converted from KRW to USD using the exchange rates on Appendix. 2) *The figure includes direct cost, land service and interests, but excludes by-products’ production cost. 3) The amount for irrigation has significantly changed between 1999 and 2000 due to the irrigation policy reform. Source: MAF, 2007, Agricultural & Forestry Statistical Yearbook.

28
Table 15. Cost sharing for management including labour (2005)
Unit: million KRW
Total Share KRC managed area
Local government managed area
Total 397,400 100% 290,500 106,900
National support 148,300 37% 148,300 -
KRC support 110,600 28% 110,600 -
Farmers’ share 138,500 35% 31,600 106,900
- In cash 4,800 - 4,800
- In obligatory labour 133,700 31,600 102,100
Source: provided by KRC
4.3.5 Regional water price variation
Table 16 shows the range of IA charges on Korean farmers for irrigation by region. The average varies substantially, from 19 USD/ha in mountainous, little irrigated northeastern Gangwon-do to 85 USD/ha in southwestern Jeollabuk-do, with a substantial area of irrigated paddy.
Table 16. Differences between Regions – Average IA Charge on Farmers by Region in Korea, 2005
Unit: USD/ha Average Highest Ref. Irrigated paddy field
(000 ha)* National average 31 387 -
Incheon- gwangyeoksi 45 75 8
Gwanju-gwangyeoksi 36 247 8
Gyeonggi-do 30 185 80
Gangwon-do 19 103 38
Chungcheongbuk-do 24 78 50
Chungcheongnam-do 54 387 139
Jeollabuk-do 85 156 128
Jeollanam-do 32 59 151
Gyeongsangbuk-do 24 68 135
Gyeongsangnam-do 26 222 98
Note: 1) Figures are converted from KRW to USD using the exchange rates in the Appendix. 2) Regions are classified as follows: 3) * Numbers are as of 2006. Source: MAF [MFAFF], KRC, Yearbook of Agricultural and Water Development Statistics, 2006.

29
Kunimitsu estimated the water value for paddy farmers using a stochastic choice model in Japan, finding that i) irrigation water demand is inelastic, ii) the WTP of water by farmers is far less than the full-cost of the water supply, and iii) the value of water is affected by rice price and productivity. He concluded that a water pricing policy would not be not well accepted by farmers in Japan. (Kunimitsu, 2006)
There have been several cases of permanent water transfer from agricultural to residential uses since the 1970s, especially in growing urban peripheries, under the “agricultural water rationalization program” led by the Ministry of Agriculture, Forestry and Fisheries (MAFF). Takada, Tsuboi and Shigeno estimated the shadow prices of residential and agricultural water involved in these transfers and showed the differences between them (Takada, Tsuboi, & Shigeno, 2002). Takeda also worked on the water transfer program from the water pricing view through an experimental case study in Saitama Prefecture, a suburb of Tokyo (Takeda, 2005).
4.2 Recent literature on agricultural water pricing relevant to Korea
Because most paddy farms (those under the management of the Korea Rural Community Corporation, or KRC) have been exempted from water charges in Korea (see country case study), there is little literature on agricultural water pricing, aside from reports to the OECD (notably Kim 2003, who is highly critical of the exemption). In KRC (2007b), the deleterious effects of the exemption (combined with the top-down method that underlies it) on irrigation management are detailed: inequity between KRC and non-KRC users, reduced effectiveness of management, deterioration of irrigation facilities, and excessive emphasis on infrastructure approaches (especially. pp. 56-57).
5. Main Policy Conclusions
5.1 Observations and conclusions
1. Agricultural water use in Japan and Korea is characterized by the dominance of rice, the secular decline of the agricultural sector, the stability of total water use by all sectors, the aging and impoverishment of the farm sector based on small farms, and the political cost of raising farmer burdens.
2. In Japan, a simplification of the pricing and cost-sharing systems on a system-wide basis would improve transparency and make it possible to make more precise estimates of how much of total irrigation capital costs are covered by central and local governments as well as farmers.
3. In Korea, the subsidization of larger schemes supported in part by decumulation of KRC assets is not sustainable in the long-run. The Korean government recognizes this, and is preparing to reduce costs by improving the efficiency of maintenance.
4. In both countries, there is a pressing need to upgrade and repair the massive stock of aging irrigation facilities accumulated in earlier decades. In Japan, the stock management program is aimed at this problem. In Korea, such upgrading may involve renovation for multipurpose uses.
5. In Korea, the dual system of full subsidies for larger schemes and no subsidy for smaller ones is asymmetric in terms of water management, and may be damaging to the smaller schemes. At the same time, “superior farms” are restricted by law to grain production, while smaller farms are not so constrained in their production options.
6. Given the secular decline in farm incomes, the political and welfare costs of increasing water prices are likely to be significant in both countries unless compensatory income offsets are made.

30
7. Full-cost pricing analyses should consider the environmental and other multifunctional benefits of paddy basin agriculture and the costs imposed on agricultural water users by urban and industrial users as well as vice-versa. Estimates of these benefits and costs vary widely and can never be precise, however, as they depend on choice of specific factors to analyze and the analytical techniques used. They could nonetheless perhaps be used as a basis for beneficiary charges (e.g., to residents and dwellers of flood zones) to offset the costs of water provision. At the same time, focus in both Japan and Korea appears to be heavily on estimating multifunctional benefits; these need to be balanced by cost estimates.
8. An understanding of the possibilities and limitations of water pricing under East Asian monsoon conditions would be enhanced by incorporation of the rich and well-documented experience of China in agricultural and resource water pricing. Although it is not an OECD country, policy makers in China have embraced (but not always implemented) pricing and market principles for water.

31
Appendix: Conversion rates
Exchange rates used to convert Japanese yen and Korean won to US dollar
JPY/USD KRW/USD
1995 96.5 771.0
1996 112.7 804.8
1997 122.7 951.1
1998 128.0 1,398.9
1999 111.5 1,189.5
2000 110.5 1,130.6
2001 125.1 1,290.8
2002 121.9 1,251.2
2003 113.0 1,191.9
2004 107.5 1,144.7
2005 113.3 1,024.3
2006 116.9 955.5
Source: Economic and Social Research Institute, Cabinet Office, Government of Japan; Economic Statistics System, The Bank of Korea.

32
Bibliography
Fujimoto, N. (2004). Water Pricing and Agricultural Water Management in Monsoon Asia. Journal of the Japanese Society of Irrigation, Drainage and Reclamation Engineering , 72-3, pp 213-216 (Japanese).
Fujimoto, N., & Tomosho, T. (2004). A viewpoint to apply water pricing to Asian humid tropics. Paddy and Water Environment , Volume 1, Number 2, pp75-83 (Japanese).
Garrido, A. (2002). Transition to Full-Cost Pricing of Irrigation Water for Agriculture in OECD Countries. OECD, Paris.
Hur, S.-O., Oh, D.-S., Jung, K.-H., & Ha, S.-K. (2004). An Application of Agricultural Water Use Indicator in Korea. p. 218-233. In: Parris, K. and P. K. Jung (Ed.), Agricultural Water Quality and Water Use: Developing Indicators for Policy Analysis Proceedings of an OECD Expert Meeting-Gyeongju, The Republic of Korea, October 2003, 310p.
Hur, S.O., Jung, K.H., Sonn, Y.K., Hong, S.Y., & Ha, S.K. (2006). Water and Soil Management for Water Conservation in a Watershed. p 508-527. In: OECD, Water and Agriculture: Sustainability, Markets and Policies. OECD Press.
Jung, K.H., Oh, D.S., Kang, K.K., Hur, S.O., Jung, P.K. & Ha, S.K. (2003) Water-Retaining Capacity of Agricultural Lands in Korea. p 103-122. In: Agriculture and Land Conservation: Developing Indicators for Policy Analysis. Proceedings of Japan/OECD Expert Meeting, Kyoto, Japan, May 2003. Tokyo: MAFF. 237p.
Kim, H.J., Lee, K.S., Lee, S.S., Shin, H.B. & Yoon, K.S. (2004). Classification and Water Quality Management of Agricultural Reservoirs in Korea. p. 134-143. In: Parris, K. and P. K. Jung (Ed.), Agricultural Water Quality and Water Use: Developing Indicators for Policy Analysis Proceedings of an OECD Expert Meeting-Gyeongju, The Republic of Korea, October 2003, 310p..
Kim, H.-S., (2004). Irrigation Development and Water Management Systems in Korea. p. 234-250. In: Parris, K. and P. K. Jung (Ed.) Agricultural Water Quality and Water Use: Developing Indicators for Policy Analysis. Proceedings of an OECD Expert Meeting-Gyeongju, The Republic of Korea, October 2003, 310p.
Kim, J.H., Lee, J.S., Yun, S.G., Koh, M.H., & Shim, J.C. (2004). Development of Agricultural Water Quality State Indicators in Korea. p. 125-133. In: Parris, K. and P. K. Jung (Ed.), Agricultural Water Quality and Water Use: Developing Indicators for Policy Analysis Proceedings of an OECD Expert Meeting-Gyeongju, The Republic of Korea, October 2003, 310p.
Kim, T.C., Gim, U.S.,Kim, J.S. & Kim, D.S. (2006). The Multi-functionality of Paddy Farming in Korea. Paddy and Water Environment 4(4), pp 169-179.
Kobayashi, H. (2006). Japanese Water Management Systems from an Economic Perspective: The Agricultural sector. Water and Agriculture: Sustainability, Markets and Policies. Paris, France: OECD, pp 121-136.
Koh, M.-H., Lee, J.-S., Ha, S.-G., Jung, P.-K., & Kim, J.-H. (2004). Status of Agricultural Water in Korea: Water Use and Water Quality. p. 85-94. In: Parris, K. and P. K. Jung (Ed.), Agricultural Water Quality and Water Use: Developing Indicators for Policy Analysis Proceedings of an OECD Expert Meeting-Gyeongju, The Republic of Korea, October 2003, 310p..
Korean Water Resources Corporation, Ministry of Land, Transport and Maritime Affairs, (2006), Research on ground water

33
Korea Rural Community Corporation (KRC), MAF [MFAFF]. (2006) Statistical Yearbook of Land and Water Development for Agriculture.
KRC (2007a) A Study on the Multi-functionality of Rural Water Resources. Ansan, Gyeonggi, Republic of Korea: KRC. 261 pp. (Korean).
KRC (2007b) Study of Water Right Rearrangement for Efficiency Use and Distribution of Agriculture Water. Ansan, Gyeonggi, Republic of Korea: KRC. 157pp. (Korean).
Kristensen, P. (2004). Overview of Agricultural Water Use and Water Quality Indicators across OECD Countries, p 40-63. In: Parris, K. and P. K. Jung (Ed.), Agricultural Water Quality and Water Use: Developing Indicators for Policy Analysis Proceedings of an OECD Expert Meeting-Gyeongju, The Republic of Korea, October 2003, 310p..
Kunimitsu, Y. (2006). Pricing for irrigation water on Japanese paddy-fields: applicability of stochastic choice model. In K. Aravossis et al.(Ed.), Environmental Economics and Investment Assessment, Ecology and the Environment Vol 98, (pp. 285-293). WIT press. 368 pp.
Kuramoto, N., Inagaki, J., Hoshi, T., Morita, K., Ozawa, W., & Fuchino, Y. (2002) Trends and issues of land improvement burden on leading farms (Ninaite Inasaku Noka niokeru Tochi Kairyo Futan no Genjyo to Kadai), Choki Kinyu, Volume 87, 185p, Norinsuisan Choki Kinyu Kyokai (in Japanese).
Lee, J.Y., Yi, M.J., Song, S.H. and Lee, G.S. (2008). Evaluation of seawater intrusion on the groundwater data obtained from the monitoring network in Korea. Water International 33(1), pp. 127-146.
Ministry of Agriculture and Forestry (MAF) [MFAFF]. (2007), Statistical Yearbook of land and water development for agriculture (Anyang, MAF) (Korean) http://opac.ide.go.jp/webopac2/ctlsrh.do?bibid=ZY00011809&listcnt=10&maxcnt=100
Ministry of Agriculture, Fisheries and Forestry (MAFF). (2006). Research on Resource Conservation Activities (Shigen Hozen Jittai Chosa no Torimatomenitsuite.) (Japanese) www.maff.go.jp/www/counsil/counsil_cont/nouson_sinkou/yousui/04/shiryou01.pdf.
MAFF. Production Cost of Rice and Wheat (Tokyo: Norin Tokei Kyokai). Annual (Japanese).
MAFF (2008a). Yearbook of Food, Agriculture and Rural Areas (Shokuryou nogyou noson hakusho) (Tokyo: Jijiga Hosha)(Japanese).
MAFF (2008b). Production Cost of Rice in 2007 (Heisei 19nensan kome seisanhi) www.maff.go.jp/toukei/sokuhou/data/seisanhi-kome2007/seisanhi-kome2007.xls (Japanese).
Matsuno, Y., Giardano, M., & Barker, R. (2007a). Transfer of water from irrigation to other uses: lessons from case studies. Paddy and Water Environment , Volume 5, Number 4 p211.
Matsuno, Y., Hatcho, N., & Shindo, S. (2007b). Water transfer from agriculture to urban domestic users: a case study of the Tone River Basin, Japan. Paddy and Water Environment , Volume 5, Number 4 239-246.
Ministry of Land, Infrastructure, Transport, and Tourism, Government of Japan. (MLIT) (2007). Water Resources in Japan (Nihon no Mizu Shigen) (Tokyo: Saiki insatsu kabushiki kaisha). (Japanese)..
Ministry of Land, Transport and Maritime Affairs, Republic of Korea. (2006). National Water Resource Plan (in Korean) http://waterplan.kwater.or.kr
Nakai, M. (2007). Experiences on Water Rights System in Japan. Network of Asian River Basin Organizations 4th Thematic Workshop on Water Allocation and Water Rights. Saitama, Japan: ADB www.adb.org/Documents/Events/2007/NARBO/workshop-water-rights/Nakai-Experiences-Water-Rights-System-Japan.pdf.
Nakashima, Y. (1998). Japan: Sustainable Water Use in Agriculture - Existing Systems and the Possibility of Introducing Market Mechanisms. OECD www.olis.oecd.org/olis/1998doc.nsf/LinkTo/NT000029CA/$FILE/05E95276.PDF.
Nakashima, Y. (1997). Water Allocation Methods and Water Rights in Japan. www.intl.hiroshima-cu.ac.jp/~nakashim/Nakashima/Water Rights in Japan.pdf

34
OECD. (2008a). Japan Country Section. In Environmental Performance of Agriculture in OECD countries since 1990 p 366-376 Paris: OECD
OECD. (2008b). Korea Country Section. In Environmental Performance of Agriculture in OECD countries since 1990 p 377-385.. Paris, OECD.
Renault, D., & Facon, T. (2004). Beyond Drops for Crops: The system approach for water value assessment in rice-based production systems. FAO Rice Conference. Rome, Italy, 12-13 February 2004: FAO.
Science Council of Japan. (2001). Evaluation of multifunctionarily of agriculture and forestry in the relation of global environment and human life (Chikyukankyo Ningenseikatsu ni Kakawaru Nogyo oyobi Shinrin no Tamentekina Kino no Hyoka ni Kansuru Chosa Hokokusho) (Japanese). www.scj.go.jp/ja/info/kohyo/pdf/shimon-18-1.pdf
Shichinohe, K. (2003). Recent issues on water property rights (Gendai no Suiriken wo meguru Shomondai). Kasen Review , pp11-17 (Japanese).
Sugiura, M. (2005). Factors for water transaction in the history of Bansuikabu Baibai (Bansuikabu Baibai no Rekishi ni miru Mizutorihiki no Yoin). Journal of Japanese Association for Water Resources and Environment , Vol.18. pp1-14 (Japanese).
Sugiura, M. (2007a). Study on the factors of trade of water rights in Kagawa (Jinushimizu niokeru Suiriken Baibai no Yoin ni Kansuru Kenkyu). Journal of Japanese Association for Water Resources and Environment , Vol. 20, pp115-124 (Japanese).
Sugiura, M. (2007b). Water use practice in social aspect: A case of paddy field in Japan. OECD Expert Meeting on "Sustainable Financing for Affordable Water Service: From Theory to Practice". Paris, France: OECD.
Takada, S., Tsuboi, N., & Shigeno, R. (2002). Shadow Price and Reallocation of Water Resources in Japan: Transfer from Agricultural Water to Residential Water. Mem. Inst. Agr. & For. Univ. Tsukuba, Vol. 19, pp1-29 (Japanese).
Takeda, M. (2005). Cost burden and intersectoral reallocation of water resource - I and II (Mizushigen no Yotokan Saihaibun to Hiyo Futan). Irrigation Science (Suiri Kagaku) , No. 283, pp57-84; No. 282, pp90-120 (Japanese).
Tanji, H. (2008). Historical discussion of price and market of Japanese agricultural water (Nihon no Nogyoyosui no Kakaku to Shijyokeisei ni kansuru Rekishiteki Kosatsu). Journal of Japan Society of Hydorology and Water Resources , Vol 15, No. 5 pp522-532 (Japanese).
Yamaoka, K. (2004). The Relationship between Water Use in Paddy Fields and Positive Externalities: a Japanese Perspective and Proposal. p. In: Parris, K. and P. K. Jung (Ed.), Agricultural Water Quality and Water Use: Developing Indicators for Policy Analysis Proceedings of an OECD Expert Meeting-Gyeongju, The Republic of Korea, October 2003, 310p.