agricultual rent survey to april 2013
DESCRIPTION
Rents rise by 30% - the fastest rate we have recordedTRANSCRIPT

smithsgore.co.uk
Market Intelligence Report
Agricultural Rent SurveyYear to 30 April 2013
Rents rise by 30% - the fastest rate we have recorded

Cover image - passing storm near Shap, Cumbria, England, UK

Rents rise by an average of 30%
Rents for all tenancy types have risen at the fastest rate we have seen since 2007, when this period of rent reviews started. It demonstrates the strong demand and resilience in farming, despite significant economic challenges in other sectors.
As a firm, we agreed more rents in this 12 month period than in any other ‘year’ since 2007.
Given the volume of settlements we agree, we can now use our database to break the market down further, and look at rent reviews of existing and new tenancies.
Rents for existing tenancies rose by 25%, up from 23% for the year ending 30 April 2012.
Rents for new Farm Business Tenancies, with ‘new’ tenants and new tenancies with existing tenants, rose by 59% compared with the previous rent; it was 74% for the year ending 30 April 2012.
This illustrates the competitiveness of the market; rents have soared because of strong demand from farmers due to underlying profitability and relatively few rental opportunities.
The average FBT rents in this report are well below some of the rents that grab the headlines. This reflects the diversity of holdings and land, and that many landlords consider other factors than the highest rent when selecting tenants, such as supporting existing tenants.
Rupert ClarkHead of Rural Practice Petworth officet 01798 345999e rupert.clark @smithsgore.co.uk
Simon Blandford Head of Farm ManagementWinchester officet 01962 857405e simon.blandford @smithsgore.co.uk
Average percentage change in year to 30 April (all farm and tenancy types)
0%
5%
10%
15%
20%
25%
30%
35%
40%
45%
50%
Overall averageScottish TenanciesFBTAHA
2010-2013201320122011
Key points
• Arable FBT rents are the highest and are increasing fastest
• Rents for higher quality soil continue to increase most
• Scottish rents continue to rise more slowly than elsewhere in Great Britain


Growth by Farm Type2013 High rises in all sectors
Rents for all types of existing tenancies increased by an average of 25% in the year to 30 April 2013, up from 23% in 2012 and the 22% average for 2009 to 2012.
Arable and livestock rents continued to increase the most. Arable rents rose by 34%, up from 26% in 2012, and livestock rents by 26%, the same as in 2012.
These figures are averages and, as stated before, there is considerable variation around the averages, as illustrated by the graph at the end of the existing tenancies section.
Rent review results by farm type in year to April 2013
New rent (£/acre)
Old rent (£/acre)
Percentage change
Number of reviews
Area reviewed (ac)
Arable £99 £73 34% 149 40,414
Dairy £81 £69 17% 73 18,554
Livestock £53 £44 26% 179 64,578
Mixed £77 £64 21% 173 38,905
Overall average
£76 £61 25% 574 162,451
2010 - 20131 24% increase on average
Rents have risen by 24% on average in the three years to 30 April 2013.
For the average sized farm in the database, this has meant an increase in rent of £3,800 a year – so £11,400 over a three-year rent review cycle.
All sectors have experienced increases, with the largest being in the arable sector, and the lowest for mixed and dairy farms.
Rent review results by farm type 2010 – 2013
New rent (£/acre)
Old rent (£/acre)
Percentage change
Number of reviews
Area reviewed (ac)
Arable £91 £70 30% 367 90,230
Dairy £81 £69 17% 146 32,854
Livestock £52 £43 25% 444 183,354
Mixed £74 £63 19% 383 86,405
Overall average
£72 £59 24% 1,340 392,843
1 “2010 – 2013” and “last three years” relates to the period between 1 May 2010 and 30 April 2013.
Rents for existing tenancies

Growth by Tenancy Type
2013 FBTs continue to show greatest rises
FBT2 rents rose by 35% compared with 22% for AHA and 13% for Scottish tenancies. This is as rent review clauses in FBTs allow rents to be revised to current open market levels while AHA and Scottish rent tenancies have a less open market nature, although this should change following the Moonzie case, which will apply across Great Britain.
Rent review results by tenancy type in year to April 2013
New rent (£/acre)
Old rent (£/acre)
Percentage change
Number of reviews
Area reviewed (ac)
AH
A
Arable £77 £64 20% 80 26,835
Dairy £80 £70 16% 47 11,240
Livestock £48 £40 34% 70 30,702
Mixed £75 £64 18% 101 23,218
AHA average £70 £59 22% 298 91,996
FBT
Arable £134 £89 55% 60 11,183
Dairy £105 £82 28% 16 4,308
Livestock £76 £62 25% 62 9,159
Mixed £90 £72 28% 53 10,731
FBT average £101 £75 35% 191 35,381
Scot
tish
te
na
nci
es
Arable £59 £51 15% 8 2,353
Dairy £49 £46 5% 10 3,006
Livestock £27 £24 14% 43 24,417
Mixed £48 £42 16% 19 4,956
Scottish average £38 £34 13% 80 34,733
Overall average £76 £61 25% 569 162,109
Rent review results by tenancy type in year to April 2013
£0
£20
£40
£60
£80
£100
£120
£140
£160
New rent (£/acre)Old rent (£/acre)
Ove
rall
Scot
tish
Ave
rage
Mix
ed
Live
stoc
k
Dai
ry
Ara
ble
FBT
Ave
rage
Mix
ed
Live
stoc
k
Dai
ry
Ara
ble
AH
A A
vera
ge
Mix
ed
Live
stoc
k
Dai
ry
Ara
ble
AHA FBT Scottish Tenancies All
Rents for existing tenancies
2 NB This data excludes ‘new’ FBTs, which are covered in the rents for new Farm Business Tenancies section.

2010 - 2013 Growth lowest in dairy sector
In these three years, FBT rents have increased by 31%, compared with 22% for AHAs and 14% for Scottish tenancies.
For both FBTs and AHAs, livestock rents have increased particularly strongly in percentage terms.
Dairy rents have risen less than other farm types, which is expected given the tight margins and long-term economic challenges faced by the sector. Industry figures show that only the top 25-33% of dairy farmers are making sustainable profit margins.
Rent review results by tenancy type 2010 - 2013
New rent (£/acre)
Old rent (£/acre)
Percentage change
Number of reviews
Area reviewed (ac)
AH
A
Arable £80 £66 22% 233 66,435
Dairy £81 £70 18% 90 20,017
Livestock £52 £43 29% 175 78,734
Mixed £72 £62 18% 250 58,142
AHA average £71 £60 22% 748 223,328
FBT
Arable £117 £80 47% 117 20,378
Dairy £93 £79 18% 40 8,111
Livestock £75 £61 27% 139 25,690
Mixed £92 £76 24% 95 17,213
FBT average £94 £72 31% 391 71,392
Scot
tish
Te
na
nci
es
Arable £67 £59 14% 16 3,374
Dairy £45 £43 6% 16 4,727
Livestock3 £24 £21 15% 115 77,183
Mixed £44 £38 15% 38 11,050
Scottish average £34 £30 14% 185 96,334
Overall average £72 £59 24% 1,324 391,054
3 One reason Scottish livestock rents per acre are lower than in England is as the average farm size is much larger in Scotland.
Rent review results by tenancy type 2010 - 2013
£0
£20
£40
£60
£80
£100
£120
£140
£160
New rent (£/acre)Old rent (£/acre)
Ove
rall
Scot
tish
Ave
rage
Mix
ed
Live
stoc
k
Dai
ry
Ara
ble
FBT
Ave
rage
Mix
ed
Live
stoc
k
Dai
ry
Ara
ble
AH
A A
vera
ge
Mix
ed
Live
stoc
k
Dai
ry
Ara
ble
AHA FBT Scottish Tenancies All
Rents for existing tenancies
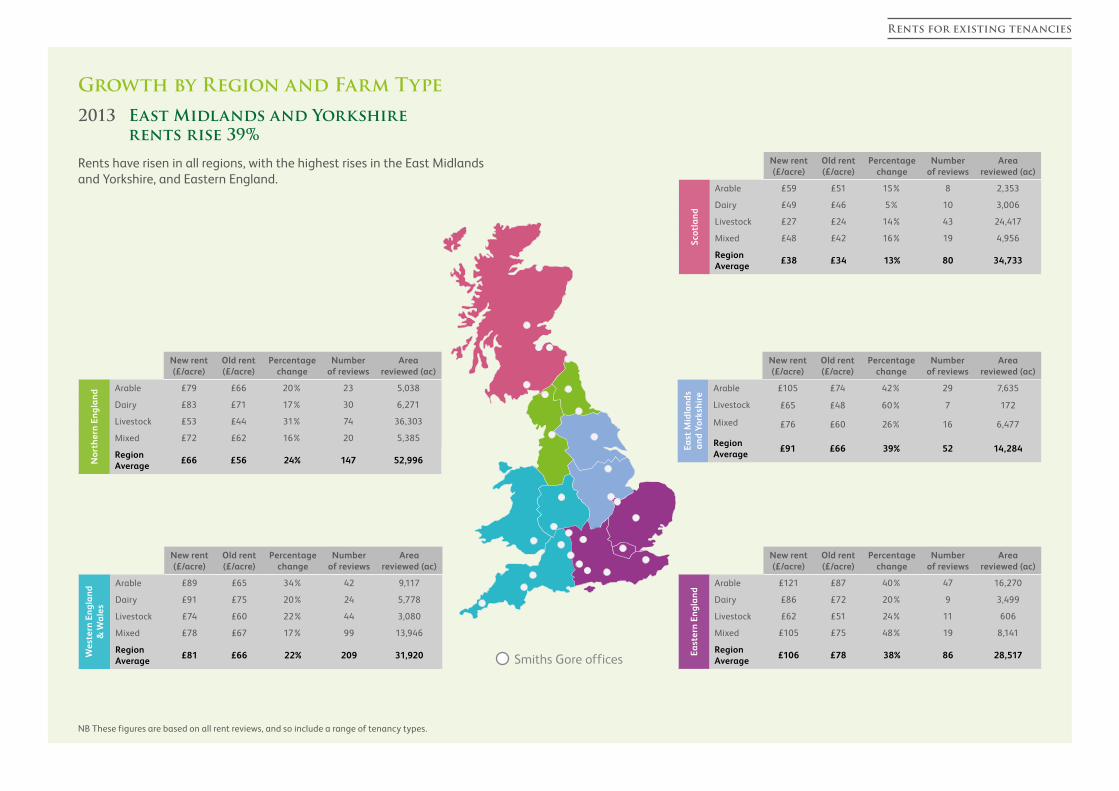
Growth by Region and Farm Type
2013 East Midlands and Yorkshire rents rise 39%
Rents have risen in all regions, with the highest rises in the East Midlands and Yorkshire, and Eastern England.
New rent (£/acre)
Old rent (£/acre)
Percentage change
Number of reviews
Area reviewed (ac)
Scot
lan
d
Arable £59 £51 15% 8 2,353
Dairy £49 £46 5% 10 3,006
Livestock £27 £24 14% 43 24,417
Mixed £48 £42 16% 19 4,956
Region Average
£38 £34 13% 80 34,733
New rent (£/acre)
Old rent (£/acre)
Percentage change
Number of reviews
Area reviewed (ac)
East
Mid
lan
ds
an
d Yo
rksh
ire
Arable £105 £74 42% 29 7,635
Livestock £65 £48 60% 7 172
Mixed £76 £60 26% 16 6,477
Region Average
£91 £66 39% 52 14,284
New rent (£/acre)
Old rent (£/acre)
Percentage change
Number of reviews
Area reviewed (ac)
East
ern
Eng
lan
d
Arable £121 £87 40% 47 16,270
Dairy £86 £72 20% 9 3,499
Livestock £62 £51 24% 11 606
Mixed £105 £75 48% 19 8,141
Region Average
£106 £78 38% 86 28,517
New rent (£/acre)
Old rent (£/acre)
Percentage change
Number of reviews
Area reviewed (ac)
Nor
ther
n En
gla
nd Arable £79 £66 20% 23 5,038
Dairy £83 £71 17% 30 6,271
Livestock £53 £44 31% 74 36,303
Mixed £72 £62 16% 20 5,385
Region Average
£66 £56 24% 147 52,996
New rent (£/acre)
Old rent (£/acre)
Percentage change
Number of reviews
Area reviewed (ac)
Wes
tern
En
gla
nd
&
Wa
les
Arable £89 £65 34% 42 9,117
Dairy £91 £75 20% 24 5,778
Livestock £74 £60 22% 44 3,080
Mixed £78 £67 17% 99 13,946
Region Average
£81 £66 22% 209 31,920
NB These figures are based on all rent reviews, and so include a range of tenancy types.
Smiths Gore offices
Rents for existing tenancies
Smiths Gore offices
New rent (£/acre)
Old rent (£/acre)
Percentage change
Number of reviews
Area reviewed (ac)
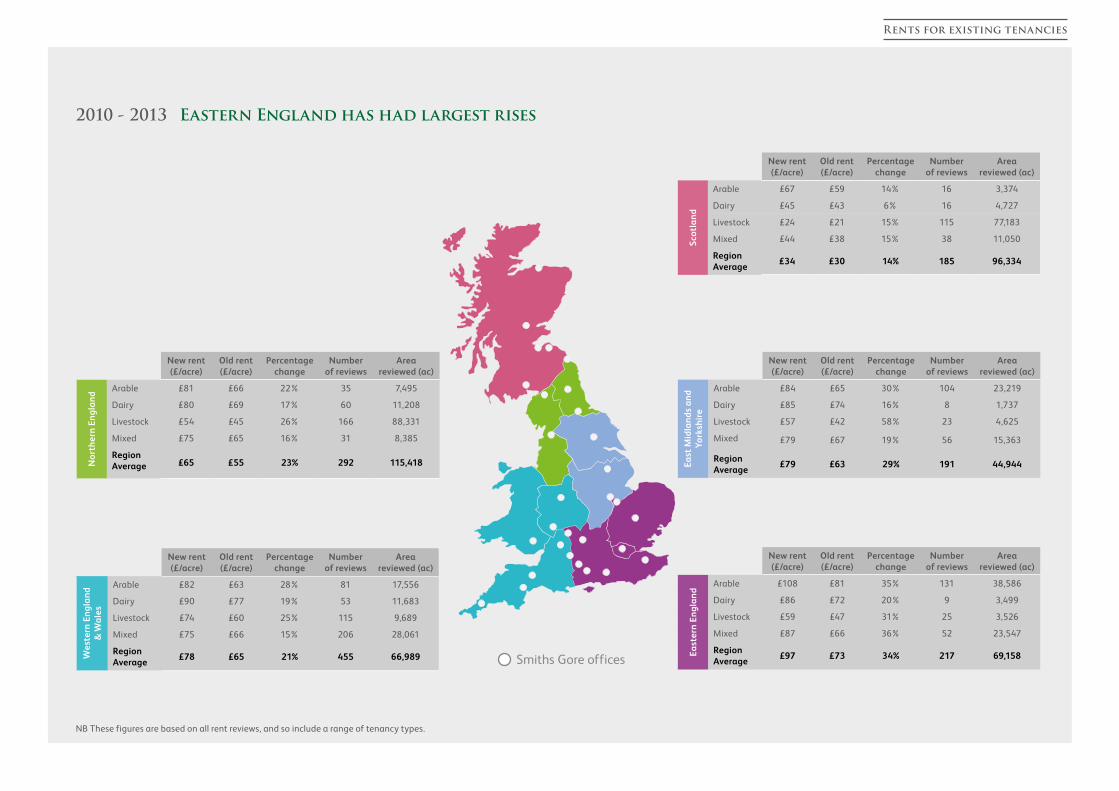
Scot
lan
d
Arable £67 £59 14% 16 3,374
Dairy £45 £43 6% 16 4,727
Livestock £24 £21 15% 115 77,183
Mixed £44 £38 15% 38 11,050
Region Average
£34 £30 14% 185 96,334
New rent (£/acre)
Old rent (£/acre)
Percentage change
Number of reviews
Area reviewed (ac)
East
Mid
lan
ds
an
d Yo
rksh
ire
Arable £84 £65 30% 104 23,219
Dairy £85 £74 16% 8 1,737
Livestock £57 £42 58% 23 4,625
Mixed £79 £67 19% 56 15,363
Region Average
£79 £63 29% 191 44,944
New rent (£/acre)
Old rent (£/acre)
Percentage change
Number of reviews
Area reviewed (ac)
East
ern
Eng
lan
d
Arable £108 £81 35% 131 38,586
Dairy £86 £72 20% 9 3,499
Livestock £59 £47 31% 25 3,526
Mixed £87 £66 36% 52 23,547
Region Average
£97 £73 34% 217 69,158
New rent (£/acre)
Old rent (£/acre)
Percentage change
Number of reviews
Area reviewed (ac)
Nor
ther
n En
gla
nd
Arable £81 £66 22% 35 7,495
Dairy £80 £69 17% 60 11,208
Livestock £54 £45 26% 166 88,331
Mixed £75 £65 16% 31 8,385
Region Average £65 £55 23% 292 115,418
New rent (£/acre)
Old rent (£/acre)
Percentage change
Number of reviews
Area reviewed (ac)
Wes
tern
En
gla
nd
&
Wa
les
Arable £82 £63 28% 81 17,556
Dairy £90 £77 19% 53 11,683
Livestock £74 £60 25% 115 9,689
Mixed £75 £66 15% 206 28,061
Region Average
£78 £65 21% 455 66,989
2010 - 2013 Eastern England has had largest rises
NB These figures are based on all rent reviews, and so include a range of tenancy types.
Rents for existing tenancies

The effect of land quality – premium rents for premium land
Not only is the rental value of better quality land higher, rents for Grade 1 and 2 land have risen by the greatest percentage over the last three years. Average Grade 1 rents are now 62% higher than Grade 3, compared with 47% before these reviews were undertaken.
New rent (£/acre)
Old rent (£/acre)
Percentage change
Number of reviews
Area reviewed (ac)
Grade 1 £131 £96 39% 25 10,992
Grade 2 £94 £72 30% 155 43,638
Grade 3 £78 £65 23% 904 174,828
Grade 4 £45 £37 20% 186 75,090
Grade 5 £12 £10 20% 79 90,733
Overall average £72 £59 23% 1,349 395,280
2010 - 2013 The effect of houses and farm buildings
Equipped AHA holdings with houses and buildings continue to have higher rents than bare land lettings4.
There is very little difference in FBT rents being paid for bare or equipped land. We think this is because the buildings and equipment being offered frequently do not suit the tenants’ needs.
Rents for equipped holdings are affected by the quality and quantity of buildings available. Tenants will pay more for better buildings and equipment.
New rent (£/acre)
Old rent (£/acre)
Percentage change
Number of reviews
Area reviewed (ac)
Well equipped £71 £60 21% 197 89,671
Averagely equipped £73 £61 20% 435 183,331
Poorly equipped £59 £48 21% 174 67,222
Overall average £69 £58 20% 806 340,224
4 There is one exception to this which is livestock farms, where extensive equipped holdings mean the average equipped rent is lower.
£0
£20
£40
£60
£80
£100
£120
£140
Overall averageMixedLivestockDairyArable
Equipped FBTBare FBTEquipped AHABare AHA
Rent review results by tenancy type and equipped 2010 - 2013
Rents for existing tenancies
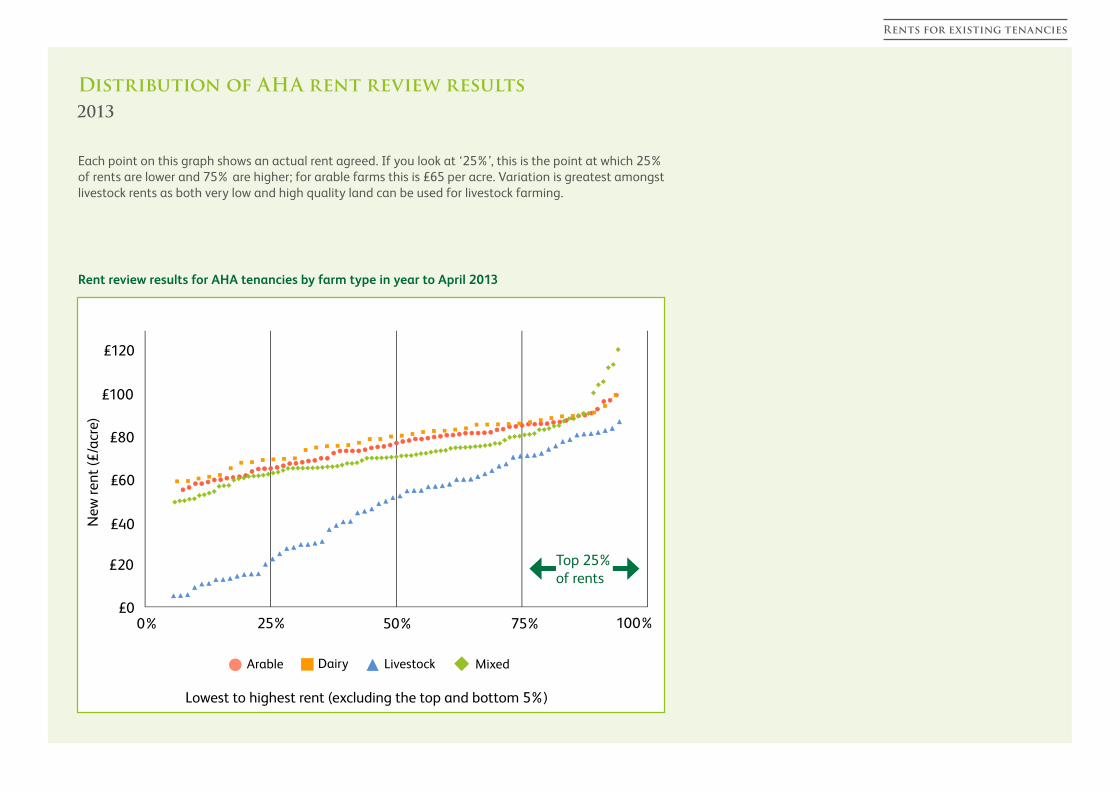
Each point on this graph shows an actual rent agreed. If you look at ‘25%’, this is the point at which 25% of rents are lower and 75% are higher; for arable farms this is £65 per acre. Variation is greatest amongst livestock rents as both very low and high quality land can be used for livestock farming.
Distribution of AHA rent review results
£0
£20
£40
£60
£80
£100
£120
0% 25% 50% 75% 100%
Arable Dairy Livestock Mixed
New
rent
(£/a
cre)
Lowest to highest rent (excluding the top and bottom 5%)Arable Dairy Livestock Mixed
Lowest to highest rent (excluding the top and bottom 5%)
New
rent
(£/a
cre)
0% 25% 50% 75% 100%£0
£20
£40
£60
£80
£100
£120
Top 25% of rents
Rent review results for AHA tenancies by farm type in year to April 2013
Rents for existing tenancies
2013

2013 Strong rental uplift for all farm types
We let just under 12,000 acres on new FBTs in the year to 30 April 2013, which is an average size of 115 acres. The arable lettings averaged 122 acres, whilst livestock lettings averaged 55 acres; mixed lettings at an average of 174 acres were largest. 18% of the lettings were over 200 acres, and there were 13 equipped farms let.
Rents for new FBTs are 57% higher on average than they were under the previous letting of the holding.
New rent (£/acre)
Old rent (£/acre)
Percentage change
Number of lettings
Area let (ac)
Arable £135 £90 48% 60 7,305
Livestock £83 £50 74% 24 1,329
Mixed £103 £65 67% 18 3,129
Overall average £117 £76 57% 102 11,763
New tenancies – FBT rents agreed by farm type in year to April 2013
New rent (£/acre)
Old rent (£/acre)
Percentage change
Number of lettings
Area let (ac)
Arable £123 £84 42% 115 14,266
Livestock £89 £53 77% 69 6,741
Mixed £98 £69 66% 33 5,408
Overall average £108 £73 56% 217 26,416
New tenancies – FBT rents agreed by farm type 2010 – 2013
5 Scottish tenancies have been excluded as there were not enough new tenancies to produce robust data.
2010-2013
Rents have risen by 56% on average in the three years to 30 April 2013.
New rent (£/acre)
Old rent (£/acre)
Percentage change
Number of lettings
Area let (ac)
East Midlands and Yorkshire
£129 £82 78% 26 1,520
Eastern England £125 £89 39% 35 5,349
Northern England £110 £64 77% 21 3,078
Western England & Wales
£99 £69 35% 21 2,131
Overall average £118 £76 59% 103 12,078
New rent (£/acre)
Old rent (£/acre)
Percentage change
Number of lettings
Area let (ac)
East Midlands and Yorkshire
£112 £74 55% 65 5,339
Eastern England £123 £83 48% 61 10,300
Northern England £99 £69 60% 48 7,147
Western England & Wales
£100 £64 60% 50 5,110
Overall average £110 £73 56% 224 27,896
New tenancies – FBT rents agreed by region in year to April 2013 New tenancies – FBT rents agreed by region 2010 – 2013
Rents for new Farm Business Tenancies5

English & Welsh viewPositive outlook for rents
We have continued to settle rents, for both AHAs and FBTs, in 2013 with no evidence of tenants or their agents seriously holding out for standstills or reductions, despite some clouds on the horizon.
The difficulties of last year’s weather may be tempering landlords’ ambitions in some cases, where cropping has been affected, but parties are generally aware that the rent being agreed applies for three years and so needs to reflect more than just one bad (or good) year.
Given the above, and the generally positive outlook for farming, there is little down-side risk for landlords serving notice for reviews in 2014.
However, both landlords and tenants should take care with holdings where the rent is heavily reliant on an agri-environment scheme which is due to expire in 2014 or 2015. There is potentially a 1-2 year period with no grant income and no guarantee of future agri-environment income thereafter.
Toby Metcalfe PartnerEdinburgh officet 0131 344 0885e toby.metcalfe @smithsgore.co.uk
Scottish viewThirst unquenched
It will not come as a surprise to anyone that the weather last summer had a significant impact on agriculture in Scotland. At the time the impact was felt most immediately by the arable sector but there was also a big impact on the livestock sector which has spilled over into this year. In our experience the challenges created by the weather were fully understood by all of our clients and there was a realism about any rent review discussions scheduled for this year. Increases have come about as a result of constructive negotiations and in the main simply reflect the inflationary increase experienced over the preceding three years.
It is interesting to reflect on whether the slight slow down in the pace of rental increases in Scotland is driven only by the weather or if other factors are at play. It is I think fair to report that the mood of farming tenants generally remains buoyant. There is an expectation that the historically long and almost uninterrupted increase in farming incomes will continue on the back of a growing population. This mood is reflected by the rental offers received as a result of open market reletting exercises we have undertaken for clients this year. There is no doubt that the thirst for more land to rent is a very long way from being quenched and this will undoubtedly continue until there is a game changer either in terms of the supply of land to rent or the underlying economics. Neither show any sign of changing in the near future. In broadest summary the drivers continue to be the desire of tenant farmers to grow and spread fixed costs and landowners wish to rationalise the asset. Behind all the headlines there are plenty of constructive examples of the two parties working together to agree rent reviews, consider ways of improving performance and delivering their objectives to mutual advantage.
Stephen Spencer PartnerLichfield officet 01543 266403 e stephen.spencer @smithsgore.co.uk
Our experience over the past year

About the agricultural rent survey
This report provides details of average rents agreed at rent reviews,re-lettings and new lettings in:
(i) 2013: the 12 months to 30 April 2013 (691 rent settlements covering 176,000 acres)
(ii) 2010 - 2013: the 36 months to 30 April 2013 (1,610 rent settlements covering 428,000 acres)
The complete database now contains details of over 2,700 rent settlements, covering over 750,000 acres of land in England, Scotland and Wales with a rent roll in excess of £39 million per annum. It is one of the most comprehensive databases available in Great Britain.
Average rents
Please note that the rents shown are averages and that there can be considerable variation in rent either side of the average depending on the location and quality of the holding and its fixed equipment. Some rents have dropped, usually when properties are taken out of the tenancy agreement, and others increased by well over 100%. This analysis focuses on what might therefore be described as trends.
How we use the database
Our surveyors use the database as a source of information when they are conducting reviews, and we carry out performance reviews for estates and portfolios against the database.
Demand for farmland for rent remains very strong, due to competition between farmers seeking to expand and spread fixed costs.
If you are a landowner, landlord, tenant or are looking to contract or share farm land, please contact our local team to discuss the options available to you. They can advise you on the best course of action to suit your circumstances. They will also have details of land in your area that is available to rent. Their contact details are at the end of this report.
The Outlook for 2014 and 2015Should I serve a rent review notice?
Our view on the main sectors is positive but we recommend, as we have said before, careful assessment of the current rent, what level a new rent might be and your attitude to risk.
Arable 2013 has been a better autumn and input costs have eased. Although there are some challenges in terms of commodity prices, we think there is a positive outlook. Strong rents at reviews and for new tenancies are likely to continue.
Beef and sheep
After a tough start to the year, a good summer and better forage stocks have given the sector a boost. We expect UK supply of beef and sheep to remain tight, which will support prices. The upwards pressure on feed costs has eased. Key to profitability is control of fixed costs. There is a more positive outlook than there was last year and there is still scope for rent increases but pick the unit!
Dairy
There has been downward pressure on prices but this is now changing and lower feed costs and better quality forage has made the outlook more positive. We expect consolidation of the industry to continue as only the top slice of producers are making sustainable margins. The amount of capital investment needed on a unit is a key factor in determining rental levels but for good units we continue to expect strong rent settlements.
Simon Blandford Head of Farm ManagementWinchester officet 01962 857405e simon.blandford @smithsgore.co.uk

Giles WordsworthNational Head of Farm Agencyt 01865 733302e [email protected]
To discuss the sale or purchase of agricultural land, please contact:
Contacts
If you would like to discuss rent reviews or options for letting land, please contact:
ScotlandToby Metcalfe t 0131 344 0885e [email protected]
NorthPhilip Colest 01325 370511e [email protected]
East Midlands and Yorkshire & HumberDavid Goodsont 01733 559306 e [email protected]
Western England and WalesStephen Spencert 01543 251221e [email protected]
South East and East of EnglandRupert Clarkt 01798 345999e [email protected]
South WestCharles Dixont 01392 294892 e [email protected]
Smiths Gore offices

smithsgore.co.uk