agricultural economics research v26 n3 - agecon search
TRANSCRIPT
o
AGRICULTURAL ECONOMICS RESEARCH VOL. 26, NO. 3, JULY 1974
Exchangeable Coupon Gas Rationing By Clarlt Edwards
During the gas shortage in the winter of 1973-74, farmers were high on the priority listfor gasoline allocations. Under the proposed exchangeable coupon gasoline rationing, thisallocative machinery and priority system would be superseded by a coupon resale market.The exchangeable coupon resale market is examined from the perspective of a consuminghousehold and of a producing iu;m. The conclusion is that the coupon resale market willration gas among the same uses that a higher market price would-the difference being notone of allocation of gas among alternative uses, but one of redistribution of income. Theamount of income to be redistributed is estimated in the neighborhood of $28 billion peryear.
Keywo2"ds: Economic theory, Income distribution, Gasoline, Rationing.
Harbingers of a gasoline shortage have been spring to make rationi'I'J.g appear unlikely.around for a year or two. In the early months of Even so, rationing had bE'~n a distinct possibi.1974, most Americans became acutely aware of lity (one which some ('Jnsumers wished hadthe prospect. Retail outlets started running out already been imposed e...; they waited an hour orof gas, price gouging was reported, a trucker's two in line for a tankful) and could become onestrike was declared, limits were placed on sales, again. Several plans were proposed for dealingand queues at retail outlets grew several blocks with the gasoline shortage. One of the rationinglong. Speed limits, alternate-day sales, and vol plans considered by the Federal Energy Officeuntary rationing helped consumers adjust to the was an exchangeable coupon rationing system. Itproblem. was a contingency plan and, as such, was neverBefore the shortage, the quantity of gasoline formally approved or "endorsed" by the Federalsupplied to the economy had been increasing Energy Office. What was this contingency planaround 6 percent per year. Prices were relatively like?stable until early 1973 when they inched up to The basic ingredients of the planned gasolinearound $0.37 per gallon (including taxes) for rationing program were price controls below theregular gas. The steady rise in utilization re market level, exchangeable coupons, and rationflected a growing population, rising income, and banking. Suppose we are in equilibrium witha changing technology of production and con utilization of 105 billion gallons of gas per yearsumption. The trend was halted abruptly in the at $0.60 per gallon when a shortage of 10fall of 1973, and utilization of gasoline during percent is suddenly experienced. Market. forcesthe first quarter of 1974 was around 6 percent will immediately exert an upward pressure onbelow a year earlier. The shortage put a strain on prices. Estimates of the price elasticity ofthe economy and raised the specter of rationing. demand for gas consistently confirm an inelasticTwo events can obviate the need for rationing market. Oil companies have prorationed f:uppliesif demand remains unchanged: Increased sup over the past half-century to avoid lower pricesplies and increased prices. Both events were which could drop total rev~nue below totaloccurring or in prospect by the spring of 1974. costs. With an inelastic demand, a small percentIn March 1974, the average selling price of gas age increase in quantity would induce a relaexceeded $0.50 per gallon, including taxes, and tively large percentage decrease in price and awas some 38 percent above a year earlier. The loss in total revenue. Statistical analyses point toforecast at the time was for some continued market changes consistent with a short-run priceupward pressure on prices, possibly to $0.60, elasticity between -0.10 and -0.25. Assuming aand for some increase in supplies through price elasticity of demand of -0.2, the 94.5imports and domestic production. The import billion gallons available would clear the marketembargo was relaxed. Utilization was down and at $0.90 per gallon.prospective supply was up by the first day of The proposed rationing program, in this situa
55

tion, would freeze prices at $0.60 and distribute exchangeable coupons for 94.5 billion gallons to private and commercial users. These coupons could be used by the recipient or traded in the market. It is shown in a sub~quent section that the market might value coupons at about $0.30 per gallon. Post offices couId allocate coupons to licensed drivers and to commercial users, (Bulk users might use negotiable drafts instead of small-denomination coupons.) Retailers (or wholesaiers to final users) would require coupons (or drafts) to sell gas. The final seller would bank coupons along with cash receipts and use drafts against such coupon bank deposits to obtain gas from wholesalers. Thus coupon banking would move wholesale gas into the regional markets where coupons evidenced demand. Gas would follow coupons as reorders were made by retailers. There would be enough gas to fill such orders because the amount of coupons out would equal the amount of gas available. The $0.90 opportunity cost of a gallon of gas under the proposed rationing program would distribute the available gas among approximately the same uses that an actual pump price of $0.90 would. However, the income distribution would be different.
The Theory of Consumer Demand
From the point of view of an individual, private, licensed driver, the problem may be regarded as one of seeking to maximize utility (U) from gas (G) and from nongas goods (M) subject to a budget constraint reflecting income adjusted for purchase or sale of coupons. That is, maximize:
(1) U = f(M, G)
subject to
(2) M =1 - pG + q(R-G)
where I is income per time period, R is the ration allotted by coupons under the program, p is the price of gas, and q is the price of coupons. If the consumer uses exactly his ration, then (R - G) = 0 and M is independent of q. If the consumer buys coupons, then (R - G) < 0 and less money is used for nongas goods (M). If the consumer sells coupons and uses less gas then his allotment, then (R - G) > 0 and more money is
available for nongas goods (M). The marginal condition for maximum utility is
au au . (3) aG = (p + q) aM
which says that gas is acquired up to the point that the utility of one more gallon equals the marginal utility of p + q. That is, p + q is the relevant choice indicator regardless of whether the consumer buys or sells coupons or refrains from the coupon market. p + q reflects the opportunity cost of using a gallon of gas. Ifp is $0.60 and q is $0.30, one gives up $0.90 in purchasing power to gain a gallon of gas.
Without rationing, and with no gas shortage, we may consider q equal to zero. The consumer allocates his income between G and M so that au/a G =pea u/aM). This is shown in figure 1 as the point of tangency of the initial budget line Eo with the initial indifference curve 10 , The consumer uses the combination (Mo, Go).
If there is a shortage and the price of gas is raised until the reduced quantity of gas just clears the market, then the budget line rotates to BJ from Eo to reflect the higher price (figure 1). Consumption becomes (M 1 , 'Gl ): The consumer buys less gas (and with an inelastic demand spends more for it) so that indifference level II is attained instead of 10 , The higher gas price achieves the goal of reduced gas consumption, but, as a side effect, real income or purchasing power is reduced.
It is to prevent the hardships of this loss in purchasing power that rationing is imposed (19), For example, if the consumer were given cou pons (R) with which to buy G t gallons of gas and the price were frozen at the preshortage level, then the consumer could obtain (M2 , G )
l and reach indifference curve 12 (figure 1). While this is worse for him than 10 , it is better than /1
and still achieves the program target of reduced gas consumption. This allocative kind of rationing avoids the loss in utility due to the income effect of the gas shortage, but imposes a loss from the SUbstitution effect of using more M and less G than is preferred at prevailing market prices. Consumers with other preference patterns might find that R > Go, in which case they would continue to consume (M0 , Go).
This allocative form of rationing with nonnegotiable coupons is the type imposed during World War II. Reder (20) discusses the welfare economics of rationing. He points out that the

i
M
, ,
;,
10
12
----~------------~~---11 o R =G1 G
Figure 1
combination achieved under allocative rationing (M2' G1 ) is superior to that under higher market prices (M 1, G1 ) but inferior to the initial equilibrium (Mo, Go). Reder goes on to prove that allocative rationing results in a preferred equilibrium to rationing by means of a tax on gas (which is the same to the consumer as a higher market price), but that the latter is preferred to reduced consumption by means of a general tax on all commodities, or an income tax. Reder does not discuss exchangeable coupon rationing.
Samuelson (23) discusses the pure theory of choice under rationing. He explains simple rationing in which the Government specifies the maximum amount of a particular commodity
that each individual can consume, such as gasoline. He compares this with "point rationing" in which the individual is limited to a weighted sum of commodities. For example, as Neisser (16) suggests, Government Gan hardly assign a certain amount of each of the different cuts of meat to a consumer, but can limit the consumption of the group of meat products wi.th the point prices of each cut of meat providing the relative weights. In the current gasoline case, it is implied that regular gas carries the same weight as premium. Samuelson works out the equations for maximizing utility under point rationing without exchange of points. He adds that unless the Government were to explicitly ban such transactions, an exchange market
57

for points would arise. From'a welfare point of view, he says, it can be shown that the free interchange of coupons for money is, in a certain sense, optimal. But in his concluding sentence he warns that it should not be thought that anything he has said is an argument for making coupons interchangeable, since 'there might in fact be grave difficulties in the way of devising a method of point allocation which would recognize the harm done to individuals. The harm Samuelson was concerned with was that done to the middle class when the rich cought stamps from the poor and bid up the stanip market price. Samuelson is right in saying that the rich and poor might trade to mutual advantage and to the disadvantage of the middle class, but he overlooks certain corollaries: (a) the rich could bid up the price of scarce gas in the same way if there were no rationing and prices were allowed to rise, and this would disadvantage both the middle class and the poor; society may be better off with allocative rationing than with no rationing at all; and (b) the middle class consumers are better off buying or selling coupons at the price the rich bid them up to than in using their allotment and not exchanging coupons; socie.+.y may be better off with exchangeable coupon rationing than with allocative rationing. Boulding (2) says that rationing is probably the most equitable method of dir\ect restriction of purchases during a shortage. He added that if price is allowed to rise freely the rich may bid up the price until the commodity is out of reach of the poor.
It will be shown in connection with figure 3, below, that rationing with exchangeable coupons leads to a higher level of consumer utility than does allocative rationing. Under allocative rationing, at (M2, G1 ) in figure 1, the marginal rate of substitution of gas for money is not equal to the price ratio, suggesting that the consumer might move to a higher indifference level than 12 by entering a negotiable coupon market. Figure 2 shows the effect of such a market on the budget line.
With a resale market and q > 0, combjnation (M2' Gd is feasible (R = Gd. This point is common to both the original budget line Bo and the one with exchangeable co:upons B 2 • The slope of Bo is p; the slope of B2 is p + q. If the consumer sells coupons he not only gains q for cash coupons sold but also foregoes buying gas for p per coupon; for each coupon sold, p + q is
available to spend on nongas goods (M). The demand for gas now depends on the tangency of B2 with an indifference curve. .
Figure 3 illustrates the i>olution for a consumer with a preference pattern such that he buys coupons but consumes less gas at p + q than at p. The implications of other preference patterns are discussed below. With exchangeable coupons, the consumer in figure 3 uses (M3, G2 )
and realizes 13 , He is worse off than before the shortage but better off than under higher market prices or under regulated consumption with nonnegotiable coupons.
Several results follow from this analysis. First, if there is an exchangeable coupon market, then the pump price of gas plus the coupon price is the relevant choice indicator in allocating gas among alternative uses. The opportunity cost applies whether the User is buying or selling coupons. If the coupon resale market is functioning smoothly, the allocation of gas obtained by this choice indicator will not be very different from that obtained by the free market price.
Consequently, the allocation of gasoline among alternative ends will be about the same under higher market prices as under exchangeable coupon rationing. The differences will be attributable more to the different income effects than to a difference in the choice indicator. On the other hand, allocation of gasoline among
R=G, G
Figure 2
58

t·
M
'3 ~~~------------~~--'1
o G
Figure 3
alternative ends is likely to be different under exchangeable coupon rationing from what it would be under an allocative rationing system where priorities have to be set by the Government.
Second, rationing under an exchangeable coupon market is likely to lead to higher levels of consumer satisfaction than allocative rationing which, in turn, is preferred to pJ:ograms which reduce consumption through higher taxes or higher prices.
Third, inasmuch as the allocation of gas among alternative uses is about the same under exchangeable coupons and higher market prices, the difference between those programs is one of income distribution. Coupons give the added
value to final users, and higher prices transfer it to the oil industry. A tax equal to the coupon value would result in approximately the same allocation of gasoline while transferring income to the Government. The income effect will have som~ impact on the allocation of gas among alternative uses. If we are thinking of 94.5 billion gallons of gas per year and a coupon price of $0.30 per gallon, the implied income transfer is $28 billion per year. For an individual, private, licensed driver allocated 10 gallons per week, it amounts to $156 per year.
Fourth, the utility of the program depends on controlled pump prices. If the pump price is allowed to rise toward the free market price, then the value of a coupon in the market is
59

diminished and the need for a rationing program is reduced.
The curves were drawn in figure 3 to reflect a consumer who will buy coupons and consume gas so that G2 > R. Other consumer psychologies can be superimposed on the money constraint of figure 2 to suggest selling rather than buying coupons. At the extreme, if a licensed driver received coupons but always rode a bicycle, he could sell all his coupons. The situation can be imagined with reference to figure 2. Before rationing, the bicyclist had M 4
to spend. After receiving and selling his gas ration R at price q per unit, he finds he has M 5
to spend. Hence the income effect of the program is M 5 - M 4. All licensed drivers receive this income effect. The bicyclist realizes all the effect in cash.
M
I M2 ----1--,I __ -----,-MO ,I
I I I I I I I I I I I
0 G2 R=G, GO
Some consumers may be better off under exchangeable coupon rationing than in the initial, prerationing equilibrium. The reslllt depends on a utility surface reflecting a high marginal utility of money relative to the marginal utility of gas. Figure 4 depicts a consumer who sells some coupons, buys some gas, and is better off than under the initial conditions. This result is particularly likely to obtain for a consumer whose preference pattern is such that R > Go (not shown in the diagram). Such a conspmer would be indifferent between allocative rationing and the prerationing situation. He benefits from a program which keeps pump prices lower. And he benefits from the income effect of exchangeable coupons.
Attention needs to be turned to the effects of gasoline rationing with exchangeable coupons on
13
10
G
i1
Fi~ure 4
60
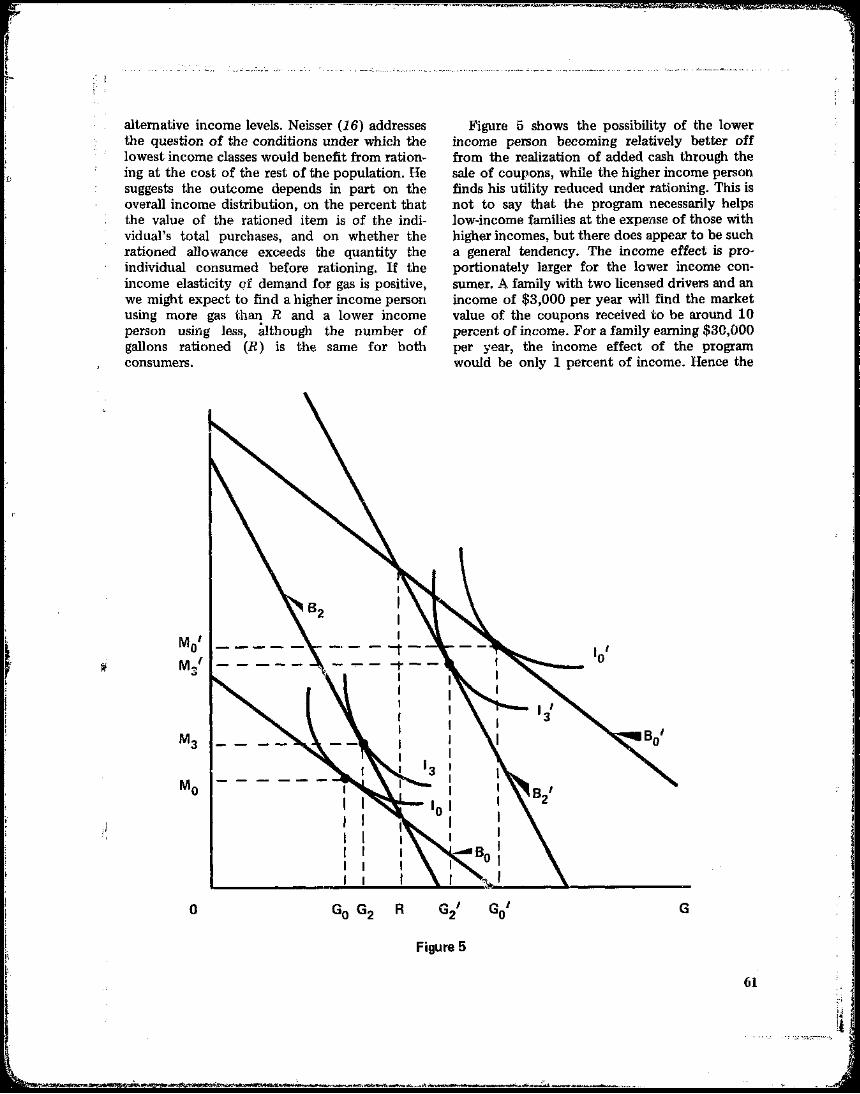
alternative income levels .. Neisser (16) addresses the question of the conditions under which the lowest income classes would benefit from rationing at the cost of the rest of the population. He suggests the outcome depends in part on the overall income distribution, on the percent that the value of the rationed item is of the individual's total purchases, and on whether the rationed allowance exceeds the quantity the individual consumed before rationing. If the income elasticity of demand for gas is positive, we might expect to find a higher income person using more gas than R and a lower income person usil1g less, iuthough the number of gallons rationed (R) is the same for both consumers.
IM Io --;--M.;/
Figure 5 shows the possibility of the lower income person becoming relatively better off from the realization of added cash through the sale of coupons, while the higher income person finds his utility reduced under rationing. This is not to say that the program necessarily helps low-income families at the expense of those with higher incomes, but there does appear to be such a general tendency. The income effect is proportionately larger for the lower income consumer. A family with two licensed drivers and an income of $3,000 per year will find the market value of the coupons received to be around 10 percent of income. For a family earning $3C,000 per year, the income effect of the program would be only 1 percent of income. Hence the
I Io
o G I G I G2 o
Figure 5
61
income distribution effect of the exchangeable coupon rationing program is progressive.
The lower income person's gain depends on a well-ordered market for coupons. If he sells coupons for $0.05 or $0.10 a gallon to someone who will resell them for $0.40 or $0.50 to a desperate user, then the income transfer is to the broker rather than to the low-income seller or the desperate buyer. Under a well-ordered coupon market, the regulated pump price plus the market price of coupons (p + q) is the relevant choice indicator regardless of consumer psychology or income level.
It may be expected that the market will develop a bid-ask system of pricing. For example, a driver with a few extra coupons might sell them to a retailer for $0.25 each and a customer might come along a few minutes later and buy them for $0.30.
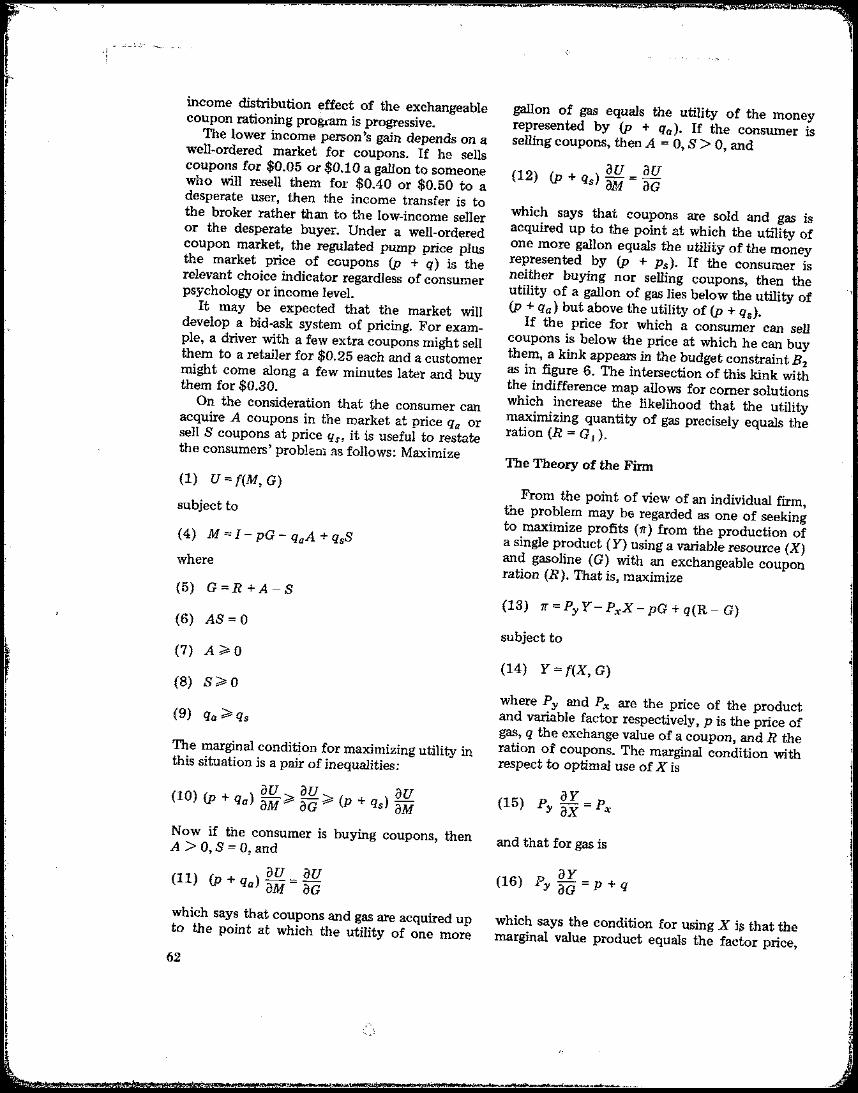
On the consideration that the consumer can acquire A coupons in the market at price qa or sell S coupons at price qs, it is useful to restate the consumers' problem as follows: Maximize
(1) U = {(M, G)
subject to
(4) M =1- pG - qaA + qsS
where
(5) G:; R + A - S
(6) AS = 0
(7) A ~ 0
(8) S~ 0
The marginal condition for maximizing utility in this situation is a pair of inequalities:
Now if the consumer is buying coupons, then A > 0, S = 0, and
au au (11) (p + qa) aM = aG
which says that coupons and gas are acquired up to the point at which the utility of one more
gallon of gas equals the utility of the money represented by (p + qa). If the consumer is selling coupons, then A = 0, S > 0, and
which says that coupons are sold and gas is acquired up to the point at which the utility of one more gallon equals the utility of the money represented by (p + Ps). If the consumer is neither buying nor selling coupons, then the utility of a gallon of gas lies below the utility of (p + qa) but above the utility of (p + qs).
If the price for which a consumer can sell coupons is below the price at which he can buy them, a kink appears in the budget constraint Bzas in figure 6. The intersection of this kink with the indifference map allows for comer solutions which increase the likelihood that the utility maximizing quantity of gas precisely equals the ration (R = G l ).
The Theory of the Firm
From the point of view of an individual firm ,the problem may be regarded as one of seeking to maximize profits (11') from the production of a single product (Y) using a variable resource (X) and gasoline (G) with an exchangeable coupon ration (R). That is, maximize
(13) 1T =Py Y -PxX - pG + q(R- G)
subject to
(14) Y ={(X, G)
where Py and Px are the price of the product and variable factor respectively, p is the price of gas, q the exchange value of a coupon, and R the ration of coupons. The marginal condition with respect to optimal use of X is
ay(15) Py ax = Px
and that for gas is
ay(16) Py vG = P + q
which says the condition for using X is that the marginal value product equals the factor price,
~.'
62

, '
M
o G
Figure 6
while the condition for using gas is that the the technical possibilities of conserving gasoline. marginal value product of gas equals the pump In addition, this line of thinking leads one to price of gas plus the market value of the suspect that, as q rises, the final product mix of exchangeable coupons. These two conditions the economy under rationing is likely to reflect imply an increased proportion of commodities wl).ich
require relatively leGS gas in their production and (17) ax = 2.2...9 distribution.
aG Px The level of gas consumption by the finn is analyzed by reference to the demand in the
which says the marginal rate of substitution factor market as measured by the marginal value equals the ratio of the pump price plus coupon product. In figure 7, Go is the amount of gas the price to the price of X. Thus as q becomes larger, firm uses at price p. Suppose the ration R is less less gas relative to X will be used in order to than Go. The firm can exchange coupons plus make the marginal rate of substitution larger. In money for gas up to point R. If, at this juncture, terms of factor-factor substitution, higher cou the marginal value product of gas exceeds the pon prices (q) encourage firms to use relatively opportunity cost p + q, as assumed in figure 7, less gas and more of other resources subject to the firm will buy coupons on the market and
63

"
maximize profits with G t units of gas. Figure 7 shows the incentive for a firm to buy coupons on the market when MVPg > (P + q) at G = R.
On the other hand, if MVPg < (P + q) at G = R, the firm will have an incentive to sell coupons as shown in figure 8. From figures 7 and 8 it becomes apparent that p + q is the choice indicator of how much gas to use, and the size of R has no direct relation to the optimal level
Figure 7
Figure 8
of G. However, the firm prefers a large R to a small one because of the income transfer effect. The monetary value of the transfer is qR, indicated by the shaded area in figures 7 and 8.
In the event that a bid-ask pricing system obtains for coupons, the marginal condition for optimal use of gas by the firm is
The case for which MVP lies between these bounds, and both inequalities hold, is shown in figure 9. The firm will maximize profits by using exactly the ration of gas, R, in this instance. Should the demand for gas by the firm shift to the right, the firm will buy gas for p + qa; should it shift to the left, the choice indicator becomes p +qs.
The Coupon Market: Aggregate Supply and Demand t-. ,
Individual actions of firms and households in response to a distribution of exchangeable gas rationing coupons will lead to a market for coupons as described above. This section ad dresses the question of the probable monetary value of a coupon. If we start from an initial price and quantity, and assume a gas shortage, an estimate of the price impact depends upon an estimate of the price elasticity of demand for
$
p+q. ~----------------~
p ~------------------~--~---------
o R G
Figure 9
64

gas. There are a number of difficulties involved in answering this 'empirical question. Some estimates of short- and long-run elasticities are available, but none drawn from a set of statistically satisfying situations paralleling the recent experience. The number of observations of price hikes in the range of 10 to 50 percent per year is not sufficient for a statistical estimate. And there is little statistical evidence as to the importance of probable shifters in the pricequantity relationship sUGh as population, income per capita, tastes, and prices of related goods. But in a practical situation one works with what one has. Various statistical analyses point to a short-run price elasticity between -0.10 and -0.25, confirming the notion that the market for, gaso[ne is inelastic. An elasticity of -0.20 would suggest that the 38 percent price rise from the spring of 1973 to the spring of 1974 was sufficient to curtail use by around 7 percent. Inasmuch as use was estimated around 12 percent below unconstrained demand at preshortage prices, and the remaining 5 percent
Table 1. Changes in price per gallon and total value of gasoline when price flexibility is - 5 and
supply declines by specified percentages
Change Change Change in quantity in price inpQ
Percent Percent Percent
-1 5 3.95 -5 25 18.75
-10 50 35.00 -15 75 48.75 -20 100 60.00
could easily be explained by voluntary conservation practices and by continuing evidence of upward pressure on prices, it does not appear unreasonable to use -0.2 for illustrating the price effects of a gasoline shortage with implications for the exchange market price of coupons.
A price elasticity of -0.2 implies, under appropriate assumptions, a price flexibility of -5. Thus a shortage of 10 percent in gas supplies may induce a 50 percent increase in prices, resulting in a gain in total revenue to the industry of 35 percent. The relationship between price, quantity, and total revenue when the price flexibility equals -5 is shown in table 1. The way th!.s market behavior may translate into a price 'of coupons can be traced in table 2.
Suppose the economy is in eqUilibrium with 105 billion gallons of gas selling for $0.60 per gallon, and a total revenue of $63 billion to the industry, when a 10 percent shortage in supplies arisef';. Then only 94.5 billion gallons of gas are available. One way to induce consumers to demand no more than the reduced supply of gas is to raise the price. With a price flexibility of -5 and a shortage of 10 percent, the resulting increase in price would be 50 percent. The price of gas would increase to $0.90 from $0.60. The total revenue to the oil industry would increase by 35 percent to $85 billion, a gain of $22 billion (table 2).
Rationing with exchangeable coupons and with the pump plice of gas frozen at $0.60 would create a coupon exchange market. The exchange price of a coupon would be bid up by users who value gas at more .than the pump price. This market would reallocate the fixed
Table 2. Market value of gas and of coupons under alternative assumptions when supply declines by specified percentages
Free market Price of a Value of Value ofChange in Quantity Value ofprice of CQupon,q, coupons, gas atquantity per year gas, PfJgas,Pf atp = 0.60 qQ p = 0.60
Billion Billion Billion BillionPercent Dollars Dollarsgallons dollars dollars dollars
j; 0 105.00 0.60 63.0000 0.00 0.0000 63.0000 -1 103.95 .63 65.4885 .03 3.1185 62.3700 -5 99.75 .75 74.8125 .15 14.9625 59.8500
-10 94.50 .90 85.0500 .30 28.3500 56.7000 -15 89.25 1.05 93.7125 .45 40.1625 53.5500 -20 84.00 1.20 100.8000 .60 50.4000 50.4000
Source: Table 1.
65 ~-

quantity of gas among users so that the value of surcharge, (d) raise prices, or (e) ration. Thisgao; at the margin to the nser is equal t.o the paper focuses on implications of the last two.opportunity cost of the pump price plus the 2. Each of the above alternatives can bringcoupon price. Coupons at f~0.30 to ration 94.5 demand into balance with supply. But thebillion gallons of gas would generate a $28 alternatives differ with respect to their impactsbillion coupon market (table 2). This is a on the allocation of scarce gasoline among altermeasure of ,the income transfer to firms and native ends, and also on the distribution ofhouseholds from the oil industry. With a market income. The chief difference between raisingprice of $0.90 for bas, the oil industry would prices, raising gas taxes, and exchangeable cougross $85 billion. But with $0.60 gas and $0.30 pon rationing is the effect on income distribucoupons, firms and households receive $28 tion. Raising prices transfers income to the oilbillion, and the oil industry grosses only $57 industry; raising taxes transfers income to thebillion. Hence the $28 billion gain to individuals Government; and coupon rationing transfersis accompanied by a $6 billion loss to the oil income to households and firms. Allocativeindustry (table 2). rationing with priorities set by the GovernmentThe oil industry could avert this loss by may result in a different distribution of gasolineseeking an increase in the pump price to $0.67. among uses than the other alternatives.This would hold the industry gross (including 3. The magnitude of the income transfertaxes) at $63 billion. Then coupons would reach associated with a 10 percent shortage is estiequilibrium at $0.23 per gallon and the gross mated in the neighborhood of $28 billion pervalue of the coupon market would be $2f; bil year.lion per year (table 3). 4. Prices at the pump must be frozen below
the market level if coupon rationing is to beTable 3. Total value of coupons, price per coupon, useful. If prices rise, the value of coupons fallsand price per gallon of gas required to hold industry accordingly and may become less on the resalerevenue constant at $63 billion, when gasoline market than the cost of operating the program.supply declines by specified percentages 5. The relevant choice indicator that firmsChange in Value of Price of and households will use in deciding how muchPrice ofquantity coupons a coupon gas gas to allocate among alternative uses under
exchangeable coupon rationing is the sum of thePercent Billion
Dollars Dollars pump plus the coupon price. Hence, if the pumpdollars price is $0.60 per gallon and a coupon is $0.30 0 0 0.0 0.6000
per gallon, the choice indicator is $0.90.-1 2.4885 .0239 .6061 6. It follows that the size of the ration to a-5 11.8125 .1152 .6348 firm or household does not affect the quantity-10 22.0500 .2333 .6667
-15 30.7125 .3441. .7059 of gas used, but only affects the income distribu
-20 37.8000 .4500 .7500 tion. Hence, if one group is rationed at 100percent of need and another group at 80
Sout'ce: Table 2. percent, the effect is simply to give a subsidy tothe former group. Both groups will allocate gason the basis of whether an additional gallon isConclusions worth $0.90 to them.
7. Gas rationing as a means of allocating aGasoline rationing using exchangeable cou scarce resource and avoiding hardship is worthpons and ration banking has several properities while. But, through the income redistributionquite different from other forms of rationing or effects, gas rationing with exchangeable couponsallocation. Highlights of some of the properties also becomes a welfare program. It may provediscussed in this paper, plus a few added less efficient at meeting the latter objective thanconsiderations, follow: ' other welfare institutions. Insofar as the former1. When supplies are below unconstrained goal of allocating a scarce resource withoutdemand at present prices, possible solutions are hardship is uppermost, coupon rationing may beto (a) increase supplies, (b) encourage voluntary worth the expense and effort. But if the latterreduction in demand, (c) impose a tax or goal of welfare is seen to be param-::mnt, other,
66

more efficient institutions should be considered. 8. Exchangeable coupon gas rationing creates
a new market institution likely to do a business worth $28 billion per year. The institution would be uncertain and imperfect. Some might take advantage of others in this situation. It is a responsibility of the Government when it creates such an institution to watch it, help it, and be sure it works fairly. For example, the Government may help make an efficient market by buying and selling coupons in very small lots. And the Government may collect coupon price information daily and disseminate it as a market news service.
9. The coupon resale market introduces a degree of flexibility in gasoline allocation among alternative ends that allocative forms of rationing don't have. But it doesn't solve all the administration problems. The coupon creates a price-protected market possibly $0.30 per gallon above the pump price. Efforts to circumvent this protection would give rise to black market and other illegal operations. Experience with illegal actions such as price gouging during the gasoline shortage in early 1974 suggests that gasoline rationing regulations with exchangeable coupons must provide adequate audit and enforcement procedures.
References
(1) Arant, Willard David. "Wartime Meat Policies." J. Farm Econ., Vol. 28, pp. 903-919, November 1946.
(2) Boulding, Kenneth Ewart. Economic AnalVol. 57, May 1943, pp. 378-397. ysis, Volume I, Macroeconomics. Harper and Row, 4th Ed., 1966, pp. 202-206.
(3) Boulding, Kenneth Ewart. "A Note on the Theory of the Black Market." Canadian J. Econ. and Polit. Sci., Vol. 13, February 1947, pp. 115-118.
(4) Graff, Johannes de v. "Towards an Austerity Theory of Value." South African J. Econ., Vol. 16, March 1948, pp.35-50.
(5) Graff, Johannes de v. "Rothbarth's 'Virtual Price System' and the Slutsky Equation." Rev. Econ. Studies, Vol. 15, No. 38,1957-48, pp. 91-95.
(6) Haraldson, W. C. "A Note on Welfare
Economics and Rationing." Quart. J. of Econ., Vol. fiB, November 1943, pp. 146-148.
(7) Henderson, A. M. "A Note on the Theory of Rationing." Rev. Econ. Studies, Vol. 15, 1948-49.
(8) Kaldor, Nicholas. "Rationing and the Cost of Living Index." Rev. Econ. Studies, Vol. 8, No.3, June 1941, pp. 185-187.
(9) Kalecki, M. "A Scheme for the Curtailment of Consumption." Inst. Statis., Oxford, Bul. 3, Vol. II, June 18-30, 1940, pp. 7·9. An amplified version appears under the title "General Rationing" in Vol. III, No.1, January 11,1941, pp. 1-6.
(10) Kaplan, Jacob J. "Rationing Objectives and Allotments, Illustrated with Sugar Data." J. Farm Econ., Vol. 24, August 1942, pp. 647-664.
(11) Kaplan, Jacob J. "Some Problems in Rationing Meats." Rev. Econ. Statis., Vol. 24, November 1942, pp. 159-165.
(12) Kershaw, Joseph Alexander, and H. Alpert. "The Invalidation of Ration Currency. ,. J. Social Issues, Fall 1947, pp. 40-48.
(13) Lloyd, E. M. H. "Some Notes on Point Rationing." Rev. Econ. Statis., Vol. 24, May 1942, pp. 49-52.
(14) Makower, Helen. "Rationing and Value Theory." Rev. /tcon. Studies, Vol. 13, 1945-46, pp. 75-80.
(15) McManus, M. "The Geometry of Point Rationing." Rev. Econ. Studies, Vol. 22(1), No. 57, 1954-55, pp. 1-14.
(16) Neisser, Hans Phillipp. "Theoretical Aspects of Rationing." Quart. J. Econ.,
(17) Nicholson, J. L. "Rationing and Index Numbers." Rev. Econ. Studies, Vol. 10, 1942-43, pp. 68-72.
(18) Paul, Allen B. "Food Price Controls Reconsidered." J. Farm Econ., Vol. 40, February 1958, pp. 30-46.
(19) Polak, Jacques Jacobus. "Rationing of Purchasing Power to Restrict Consumption." Economica (New Series), Vol. 8, August 1941, pp. 22~··238.
(20) Reder, Melvin Warren. "Welfare Economics and Rationing." Quart. J. Econ., Vol. 57, November 1942, pp. 153-159.
(21) Rothbarth, E. "The Measurement of Changes in Real Income Under Conditions of Rationing." Rev. Econ. Studies,
67
Vol. 8, 1940-41, pp. 100-107. (2.2) Rothchild, K. W. "Rationing and the Con
sumer." Oxford Econ. Papers, No.7, March 1945, pp. 67-82.
(23) Samuelson, Paul Anthony. Foundations of Economic Analysis. Harvard Univ. Press, 1947. Republished by Atheneum, 1965, pp. 163-171.
(24) Scitovszky, Tibor. "The Political Economy of Consumers' Rationing." Rev. Econ. StaUs. , Vol. 24, August 1942, pp. 114-124.
(25) Tobin, James. "A Survey on the Theory of Rationing." Econometrica, Vol. 20, No.
4, October 1952, pp. 521-553. (26) Tobin, James, and Hendrik Samuel
Houthakker. "The Effects of Rationing on Demand Elasticities." Rev. Econ. Studies, Vol. 18, No.3, November 1951, pp. 140-153.
(27) Working, Elmer Joseph. "Price Control and the Wartime Pricing of Farm Products." J. Farm Econ., Vol. 26, February 1944, pp. 110-121.
(28) Worswick, George David Norman. "Points, Prices, and Consumer's Choice." Institute of Statistics, Oxford, Bul. Vol. 6, No.3, February 26, 1944, pp. 33-39.
68