agricultural environment and policy
TRANSCRIPT

8/3/2019 Agricultural Environment and Policy
http://slidepdf.com/reader/full/agricultural-environment-and-policy 1/135

8/3/2019 Agricultural Environment and Policy
http://slidepdf.com/reader/full/agricultural-environment-and-policy 2/135
AGRIBUSINESS ENVIRONMENT & POLICY
Dr. S.V. Warade
Assistant Professor
School of Agri-Business Management, Nagpur
Dr. PDKV,Akola

8/3/2019 Agricultural Environment and Policy
http://slidepdf.com/reader/full/agricultural-environment-and-policy 3/135
Objective of the Course1.Exposure to the environment in which the agri-
business is conducted.
2. Understanding micro and macro environmental forces
and their impact on agri-business

8/3/2019 Agricultural Environment and Policy
http://slidepdf.com/reader/full/agricultural-environment-and-policy 4/135
Role of agriculture in Indian economy1. Share in GDP 14.60% in 2009-10 ( 55.10 % in 1950-51)
1. growth rate of GDP = 0.4 % (2009-10)= advanced estimate 5.4% (2010-11)
2. Provide surplus food for growing population.
3. Share agricultural trade /agribusiness.
1. Export 10.59% (2009-10)
2. Import 4.38% (2009-10)4. Major employer in India : 58.20 % in 2009-10
(69.50% IN 1950-51)
1. Base of Secondary(industrial ) and Tertiary sector(Service).(
provide raw material to industry)2. Foodgrain production 218 MT 2009-10
(Growth rate is 1.96 % base 2000-01)
3. It is market of non-agri goodsSource : Central Statistical Organization (CSO) and Department of Agriculture and Cooperation.

8/3/2019 Agricultural Environment and Policy
http://slidepdf.com/reader/full/agricultural-environment-and-policy 5/135
Indicator India Maharashtra
Geographical Area
(million ha )
329 30.80
Forest Area
(Lakh Sq Km)
7.74 0.62
Gross Cropped Area(Million Ha)
195.8 22.6
Irrigated Area
(million Ha)
87.2
(45.00% of GCA)
4.0
(18% of GCA)
Cotton Area
(million Ha)
9.08 3.06
Literacy 64.84 76.88
Sex Ratio 922 933
Percentage of Rural
Population
72.18 57.57
About Us

8/3/2019 Agricultural Environment and Policy
http://slidepdf.com/reader/full/agricultural-environment-and-policy 6/135
Indicator India Maharashtra
Live stock
(Lakh )
4850.02 370.58
Foodgrain Production
(Million tonnes)
118 12.55
Working Factories
(Thousand)
129.87 18.05
Annual industiral
Employment (thousand)
19,794 3,024
Electricity
Generation (Million
Kwh)
7,41,167 75,195
Electricity Consumption
(million Kwh)
5,27,566 72,994
Number of Banks 85,886 8,120
Per capita Income (Rs)52,421 81,579

8/3/2019 Agricultural Environment and Policy
http://slidepdf.com/reader/full/agricultural-environment-and-policy 7/135
Indicator India Maharashtra
Share of Agriculture in
GDP/GSDP
14.60 10.2
Export of Agri 10.59% of total export
Import of Agri 4.38 % of total import
Agriculture GDP/GSDP Share 14.6 10.2
Industry GDP/GSDP Share 33.6 30.9
Services GDP/GSDP Share 52.2 58.9

8/3/2019 Agricultural Environment and Policy
http://slidepdf.com/reader/full/agricultural-environment-and-policy 8/135
Scope for Agri-business in India
The food chain in India from the farmer to the consumer involves severalintermediaries leading to handling at multiple points and longer transit time.
Only 25% of the consumers rupees reaches the farmer as compared to 50% indeveloped countries.
It is estimated that 20% of the food produced in India is wasted. This is valuedmore than Rs 50,000 crores approximately.
This wastage is equal to the amount that the government spends on foodsubsidy by more than 3 to 4 times.
India produce a wide range of fruits and vegetables of both the topical and
temperate varieties because of the varied climatic conditions in our country. India having around 4000 fruit processing units with an aggregate capacity of
more than 12 lakh MT (less than 4% of total fruits produced).
Unfortunately, around 2.20% of fruits & Vegetables are processed as against30% in Thailand, 70% in Brazil, 78% in Philippines and 80% in Malaysia.
The wastage is estimated as high as over 25% of the total production of fruits
and vegetables. The cold chain system is primitive and under developed.
The existing capacity of 1 million tonnes is primarily used for storage of potatoes.
The current method of forecasting of agricultural produce does not providefor any time to take corrective action in terms of crop failure or surplus.

8/3/2019 Agricultural Environment and Policy
http://slidepdf.com/reader/full/agricultural-environment-and-policy 9/135
Only around 1 percent of India's annual meat production of over 4.5
million tons is converted to value-added products. Milk processing level is 35 percent, which is, 13 % in the organized and 22
% in the unorganized sector.
Out of the total production of bread, 40 percent is produced in theorganized sector and the remaining 60 percent in the unorganized sector.
Similarly, production of biscuits in the organized sector is about 80 percent
and quantity of biscuits produced in the unorganized sector is about 20percent.
Processing level of buffalo meat is estimated at 21 percent, poultry 6percent, and marine products 8 percent.
India's share of processed food is about 1.6%.
Scope for Agribusiness in India

8/3/2019 Agricultural Environment and Policy
http://slidepdf.com/reader/full/agricultural-environment-and-policy 10/135
Concept of Agri-Business Management
Agri-business can be defined as a process of planning, organizing,
staffing, Leading and controlling in the agribusiness
It is commercialization of agriculture, which refers to marketorientation of agricultural production process.
Transition from subsistence to commercial agriculture.
From production oriented approach to market oriented approach

8/3/2019 Agricultural Environment and Policy
http://slidepdf.com/reader/full/agricultural-environment-and-policy 11/135

8/3/2019 Agricultural Environment and Policy
http://slidepdf.com/reader/full/agricultural-environment-and-policy 12/135
Agricultural Economics : Optimisation of resources and
output(efficiency). Allocation of resources at optimum level to get
optimum output or euilibrium (MC=MR)
Agri-Business: Agribusiness is the trade of commerce ( Exchange
activity) in agriculture.
AgriBusiness Management: Whereas optimisation technique(i.e.
efficiency/agricultural economics) is used at every stage of business
includes be input marketing, production, processing and marketing.

8/3/2019 Agricultural Environment and Policy
http://slidepdf.com/reader/full/agricultural-environment-and-policy 13/135
Input Output Market
1. Innovation of new
technology
2. Availability of inputs
to farmers
in proper quantity
of good quality
at appropriate time
at appropriate cost
3. ExtensionApproach
Institutions
1. Crop planning
2. Maximize
production
3. Maximize input use
efficiency
4. Food security
5. Employment
generation
6. Sustainability of
natural resources
1.Identifying the market
2. Proper return to
farmer
3. Higher consumer
satisfaction
4. Appropriate market
channel
5. Low marketing cost
6. Higher market
efficiency7. Low wastage
8. Increase value
addition
Agribusiness System

8/3/2019 Agricultural Environment and Policy
http://slidepdf.com/reader/full/agricultural-environment-and-policy 14/135

8/3/2019 Agricultural Environment and Policy
http://slidepdf.com/reader/full/agricultural-environment-and-policy 15/135

8/3/2019 Agricultural Environment and Policy
http://slidepdf.com/reader/full/agricultural-environment-and-policy 16/135

8/3/2019 Agricultural Environment and Policy
http://slidepdf.com/reader/full/agricultural-environment-and-policy 17/135
Foodgrains Production in India
Year Area Production Productivity
(Million (Million (Kg./ha.)
hectares) tonnes)
1950-51 97.3 50.8 522
1960-61 115.6 82.0 7101970-71 124.3 108.4 872
1980-81 126.7 129.6 1023
1990-91 127.8 176.4 1380
1999-2000 123.1 208.9(4 times) 1697
2009-10 123.2 218 1798
Population growth
= 36.10 cr in 1950-51 crores to 121 crores in 2011

8/3/2019 Agricultural Environment and Policy
http://slidepdf.com/reader/full/agricultural-environment-and-policy 18/135

8/3/2019 Agricultural Environment and Policy
http://slidepdf.com/reader/full/agricultural-environment-and-policy 19/135

8/3/2019 Agricultural Environment and Policy
http://slidepdf.com/reader/full/agricultural-environment-and-policy 20/135
Problems and Policy changes relating to farm supplies

8/3/2019 Agricultural Environment and Policy
http://slidepdf.com/reader/full/agricultural-environment-and-policy 21/135
Seeds
Seeds, which are considered the carriers of new
technology for crop production and higher crop yields,
are a critical input for sustained growth of agriculture.
In India more than four-fifths of the farmers rely on
farm-saved seeds leading to a low seed replacement
rate.

8/3/2019 Agricultural Environment and Policy
http://slidepdf.com/reader/full/agricultural-environment-and-policy 22/135
Seeds
The Indian Seed Programme includes the participation
of Central and State Governments, the Indian Council of
Agricultural Research (ICAR), State Agricultural
Universities, the cooperative and private sectors.
There are 15 State Seed Corporations besides two
national-level corporations, namely National Seeds
Corporation and State Farms Corporation of India.
8/3/2019 Agricultural Environment and Policy
http://slidepdf.com/reader/full/agricultural-environment-and-policy 23/135
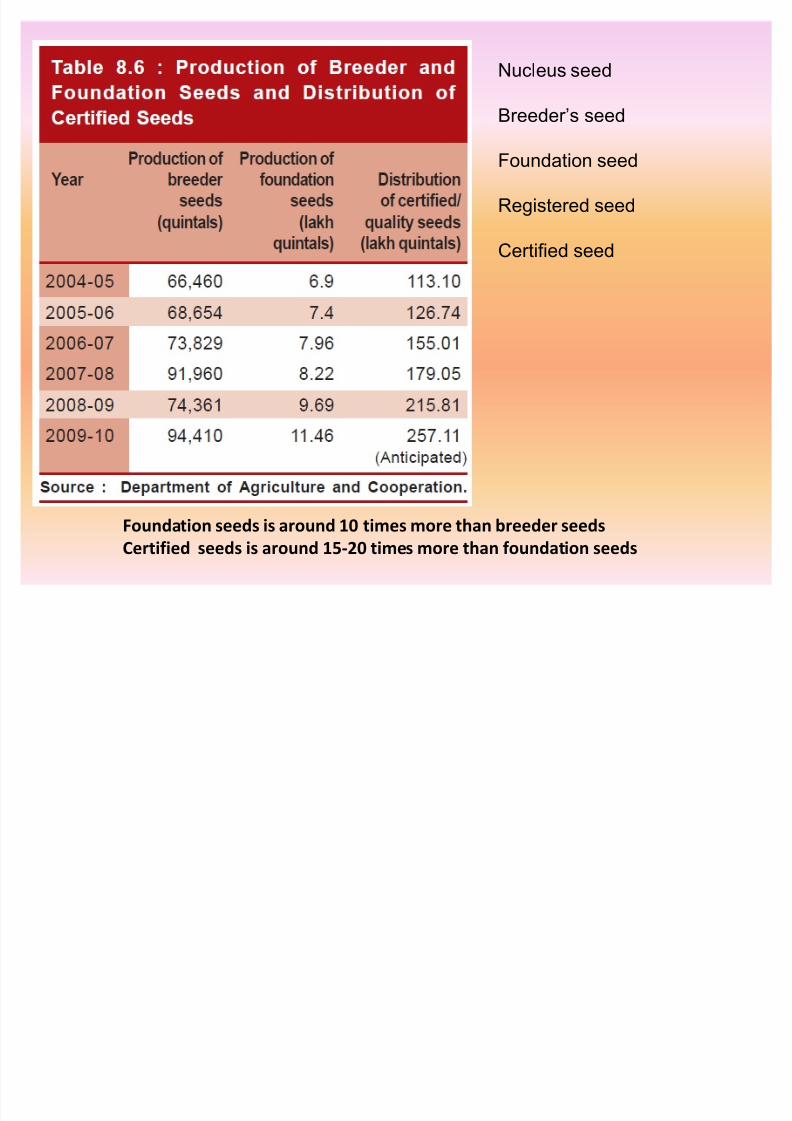
Foundation seeds is around 10 times more than breeder seeds
Certified seeds is around 15-20 times more than foundation seeds
Nucleus seed
Breeder¶s seed
Foundation seed
Registered seed
Certified seed

8/3/2019 Agricultural Environment and Policy
http://slidepdf.com/reader/full/agricultural-environment-and-policy 24/135
SeedsThe Ministry of Agriculture is implementing
the Central-sector Development andS
trengthening of Infrastructure Facilities for Production and Distribution of
Quality Seeds scheme.
The aim of the scheme is to make quality seeds of various crops
available to farmers timely and at affordable price.
Under this scheme, the seed component of the Prime MinistersRelief Package is being implemented in 31 suicide-affected
districts of Maharashtra, Andhra Pradesh, Karnataka and Kerala,
to supply certified seeds at 50 per cent of seed cost.
During the year 2008-09, Rs 445.81 crore was released under the
Prime Ministers Relief Package

8/3/2019 Agricultural Environment and Policy
http://slidepdf.com/reader/full/agricultural-environment-and-policy 25/135
SeedsThe scheme is being implemented on all -India basis from the
year 2005-06.The major thrusts under the scheme are on improving quality of
farm saved seeds through Seed Village Programmes, to enhance
seed replacement rate (It is the percentage of area sown of
certified/quality seeds other than the farm saved seed), boosting
seed production in the private sector and helping public sectorseed companies to contribute to enhancing seed production.
Some of the remarkable achievements under the scheme during
2008-09 were that more than 1,31,023 seed villages were
organized across the country; certified/quality seed production
increased from 194.31 lakh quintals during 2006-07 to 250.35 lakh
quintals during 2008-09; 183.10 lakh seeds 2009-10

8/3/2019 Agricultural Environment and Policy
http://slidepdf.com/reader/full/agricultural-environment-and-policy 26/135
Seeds52 seed infrastructure development proposals were sanctioned
for boosting seed production in the private sector; and financial
sanctions were given for establishing tissue culture facilities in
Orissa (banana) and Maharashtra (pomegranate).
Further, Biotech Consortium of India Limited (BCIL) was engagedas an expert agency to undertake public awareness programmes
in nine BT cotton- growing States at State capital, district and
tehsil levels.
The BCIL has been provided financial assistance of Rs 26.65 lakh
during the year 2008-09.

8/3/2019 Agricultural Environment and Policy
http://slidepdf.com/reader/full/agricultural-environment-and-policy 27/135
SeedsThe Protection of Plant Varieties and Farmers Rights (PPV&FR)
Authority, established in November 2005 at the NationalAgricultural Science Complex (NASC), New Delhi, has been
mandated to implement provisions of the PPV&FR Act 2001.
Fourteen crops, namely rice, wheat, maize, sorghum, pearl millet,
chick pea, peagion pea, green gram, black gram, lentil, field pea,
kidney bean, cotton and jute were notified for the purpose of registration under the Act.
There are plans to extend its operations and coverage to forestry
and aromatic and medicinal plants.

8/3/2019 Agricultural Environment and Policy
http://slidepdf.com/reader/full/agricultural-environment-and-policy 28/135
SeedsConsidering the vital importance of the seeds sector in
promoting agricultural growth, it is proposed to replace theexisting Seeds Act 1966 by suitable legislation.
The new Act is expected to
(i) create a facilitative climate for growth of the seed industry,
(ii) enhance seed replacement rates for various crops,
(iii) boost the export of seeds and encourage import of usefulgerm plasm and
(iv) create a conducive atmosphere for application of frontier
sciences in varietal development and for enhanced investment in
research and development (R&D).
The Seeds Bill was introduced in the Rajya Sabha in 2004. It was
referred to the Parliamentary Standing Committee on Agriculture
which recommended several modifications in 2008. These would
be taken up for consideration by Parliament
8/3/2019 Agricultural Environment and Policy
http://slidepdf.com/reader/full/agricultural-environment-and-policy 29/135
Fertilizers
Chemical fertilizers have played a significant role in the
development of the agricultural sector.
The per hectare consumption of fertilizers in nutrients terms
increased from 105.5 kg in 2005-06 to 135.3 kg in 2009-10.
However, improving the marginal productivity of soil still remains
a challenge.
This requires increased NPK application and application of proper
nutrients, based on soil analysis.

8/3/2019 Agricultural Environment and Policy
http://slidepdf.com/reader/full/agricultural-environment-and-policy 30/135

8/3/2019 Agricultural Environment and Policy
http://slidepdf.com/reader/full/agricultural-environment-and-policy 31/135

8/3/2019 Agricultural Environment and Policy
http://slidepdf.com/reader/full/agricultural-environment-and-policy 32/135

8/3/2019 Agricultural Environment and Policy
http://slidepdf.com/reader/full/agricultural-environment-and-policy 33/135
Fertilizers
A new scheme, the National Project on Management of SoilHealth & Fertility (NPMSF), has been introduced in 2008-09 with a
view to setting up of 500 new Soil Testing Laboratories (STLs) and
250 Mobile Soil Testing Laboratories (MSTLs) and strengthening of
the existing State STLs for micronutrient analysis.
In order to ensure adequate availability of fertilizers of standard
quality to farmers and to regulate trade, quality and distribution
in the country, fertilizers have been declared an essential
commodity as per the Fertilizer Control Order (FCO) 1985promulgated under Section 3 of the Essential Commodity Act
1955.

8/3/2019 Agricultural Environment and Policy
http://slidepdf.com/reader/full/agricultural-environment-and-policy 34/135
Fertilizers
The procedure for incorporation of new products has been
liberalized and simplified to encourage manufacture and use of fortified fertilizers.
Eight fertilizers have been specified as fortified
fertilizers(basic/strong) in FCO 1985.
To encourage balanced use of fertilizers, a new concept of
customized fertilizers has been introduced. These fertilizers are
soil specific and crop specific.
Organic fertilizers, namely city-based compost and vermin
compost, and bio-fertilizers, namely rhizobium, azotobacter,
azospirillum and phosphate solubilizing bacteria, have beenrecognized and incorporated in FCO(Fertilizer Control Order)
1985.

8/3/2019 Agricultural Environment and Policy
http://slidepdf.com/reader/full/agricultural-environment-and-policy 35/135
Irrigation
Irrigation is one of the most important critical inputs for
enhancing the productivity that is required at different criticalstages of plant growth of various crops for optimum production.
The Government of India has taken up irrigation potential
creation through public funding and is assisting farmers to create
potential on their own farms.
Substantial irrigation potential has been created through major
and medium irrigation schemes.
The total irrigation potential in the country has increased from
81.1 million ha in 1991-92 to 108.2 million ha by March 2010

8/3/2019 Agricultural Environment and Policy
http://slidepdf.com/reader/full/agricultural-environment-and-policy 36/135
Irrigation
The Central Government initiated the Accelerated Irrigation
Benefit Programme (AIBP) from 1996-97 for extending assistancefor the completion of incomplete irrigation schemes .
Under this programme, projects approved by the Planning
Commission are eligible for assistance.
Further, the assistance, which was entirely a loan from the Centre
in the beginning, was modified by inclusion of a grant component
with effect from 2004-05.

8/3/2019 Agricultural Environment and Policy
http://slidepdf.com/reader/full/agricultural-environment-and-policy 37/135
Irrigation
AIBP guidelines were further modified in December 2006 to
provide enhanced assistance at 90 per cent of the project cost as
grant to special category States, Drought Prone Area Programme
(DPAP) States/tribal areas/flood-prone areas and Koraput-
Balangir-Kalahandi (KBK) districts of Orissa.
Under the AIBP, Rs 41,729.37 crore of Central Loan Assistance(CLA)/grant has been released up to March 31, 2010.
An additional irrigation potential of 64 lakh ha has been created
under the AIBP up to March 2010.
As on March 31, 2010, 281 projects have been covered under the
AIBP and 120 completed
8/3/2019 Agricultural Environment and Policy
http://slidepdf.com/reader/full/agricultural-environment-and-policy 38/135
PRICE POLICY FOR AGRICULTURAL PRODUCE
Objectives
To ensure remunerative prices to the growers.
Reasonable price to buyer
A balanced and integrated price structure

8/3/2019 Agricultural Environment and Policy
http://slidepdf.com/reader/full/agricultural-environment-and-policy 39/135
PRICE POLICY FOR AGRICULTURAL PRODUCE
Minimum support prices (MSPs)
Purchase operations to control market prices.
Central nodal agencies intervene in the market to undertake
procurement operations(NAFED, FCI)

8/3/2019 Agricultural Environment and Policy
http://slidepdf.com/reader/full/agricultural-environment-and-policy 40/135
PRICE POLICY FOR AGRICULTURAL PRODUCE
Commission for Agricultural Costs and Prices (CACP)
Assurance of a remunerative and stable price environment Agricultural Prices Commission was set up in January, 1965
1985, Commission for Agricultural Costs and Pricesi) Cost of production
ii) Changes in input prices
iii) In
put-o
utp
ut pri
ce parityiv) Trends in market prices
v) Demand and supply
vi) Inter-crop price parity
vii)Effect on industrial cost str ucture
viii)Effect on cost of living
ix) Effect on general price level x) Inter national price situation
xi) Parity between prices paid and prices received by the farmers.
xii)Effect on issue prices(paid by govt agency) and implications for
subsidy

8/3/2019 Agricultural Environment and Policy
http://slidepdf.com/reader/full/agricultural-environment-and-policy 41/135

8/3/2019 Agricultural Environment and Policy
http://slidepdf.com/reader/full/agricultural-environment-and-policy 42/135

8/3/2019 Agricultural Environment and Policy
http://slidepdf.com/reader/full/agricultural-environment-and-policy 43/135
PRICE POLICY FOR AGRICULTURAL PRODUCE
Price Support Scheme (PSS)
The Department of Agriculture & Cooperation is implementing the
Price Support Scheme (PSS)
Procurement of oilseeds and pulses through (N AFED),
N AFED is a
lso the Ce
ntra
lage
ncy
N AFED undertakes procurement of oilseeds, pulses and cotton
Procurement under the PSS is continued till prices stabilize at or
above the MSP

8/3/2019 Agricultural Environment and Policy
http://slidepdf.com/reader/full/agricultural-environment-and-policy 44/135
PRICE POLICY FOR AGRICULTURAL PRODUCE
Market Intervention Scheme (MIS)The Department of Agriculture & Cooperation implements the
MIS
for procurement of agricultural and horticultural commodities that
are generally perishable in nature and not covered under the
PSS.
to protect the growers of these commodities from having to make
distress sales.
In the event of a bumper crop and glut in the market, prices tend
to fall below economic levels/cost of production.
.

8/3/2019 Agricultural Environment and Policy
http://slidepdf.com/reader/full/agricultural-environment-and-policy 45/135
CREDIT AND INSURANCE
Agricultural Credit
Adequate and timely credit support to farmers for their
cultivation needs,
The Kisan Credit Card Scheme (KCC) was introduced in
August 1998.
About 970.64 lakhs KCCs have been issued (up to
November 2009.
Provide both consumption credit and investment credit
Crop loans up to a principal amount of Rs 3 lakh, at 7 per
cent rate of interest.
6 per cent per annum , who from the current year

8/3/2019 Agricultural Environment and Policy
http://slidepdf.com/reader/full/agricultural-environment-and-policy 46/135
CREDIT AND INSURANCE
Agricultural Credit A package for revival of short-term Rural Cooperative Credit
(2006) = Rs 13,596 crore.
(MoUs) between the Gover nment of India and N ABARD,
committing to implementing revival package.
T
we
nty-five(25) States have exe
cuted MoUs
with the Gover
nme
ntof India and N ABARD.
This covers 96 per cent PACS and 96 per cent of the Central
cooperative banks (CCBs) in the country.
As on November 2010, Rs 8009.75 crore has been released by
N ABARD for recapitalization.

8/3/2019 Agricultural Environment and Policy
http://slidepdf.com/reader/full/agricultural-environment-and-policy 47/135
CREDIT AND INSURANCE
Agricultural Credit
A rehabilitation package for 31 suicide-prone districts
Financial outlay of Rs 16978.69 crore.
8/3/2019 Agricultural Environment and Policy
http://slidepdf.com/reader/full/agricultural-environment-and-policy 48/135
CREDIT AND INSURANCE
Agricultural Credit
A debt waiver and debt relief scheme 2008-09
Overdue as on December 31, 2007 and which remained
unpaid until Febr uary 29, 2008, are eligible for debt waiver or
debt relief.
About 3.68 crore farmers have benefited from the scheme
Debt waiver and debt relief of Rs 65,318.33 crore

8/3/2019 Agricultural Environment and Policy
http://slidepdf.com/reader/full/agricultural-environment-and-policy 49/135
CREDIT AND INSURANCE
Agricultural Insurance
Uncertainty and risk in agricultural production.
The National Agricultural Insurance Scheme (N AIS) 1999-
2000, for risk management in agriculture
Providing financial support to farmers in the event of crop
failure as a result of natural calamities, pests and diseases.
The scheme is open to all the farmers loanee and non-
loanee-irrespective of their size of holding.
Loanee farmers are covered on compulsory basis in a
notified area for notified crops.

8/3/2019 Agricultural Environment and Policy
http://slidepdf.com/reader/full/agricultural-environment-and-policy 50/135
CREDIT AND INSURANCE
Agricultural Insurance
All food crops, oilseeds and annual commer cial/ horticulturalcrops are covered under N AIS,
In respect of which past yield data= bench mark/base line.
25 States and two Union Territories.
1,347 lakh farmers over an area of 2,109 lakh ha have been
covered,Insuring a sum of Rs 1,48,250 crore.

8/3/2019 Agricultural Environment and Policy
http://slidepdf.com/reader/full/agricultural-environment-and-policy 51/135
CREDIT AND INSURANCE
Agricultural Insurance
Pilot Modified NAIS (MNAIS)
Modified N AIS for implementation on pilot basis in 50 districts
from rabi 2010-11 season.
The major improvements made in the MN AIS are:
Actuarial premium with subsidy in premium at different rates,
i.e. 40 per cent to 75 per cent depending upon the slab,provided to farmers,
all claims liability on the insurer,
unit area of insurance reduced to village panchayat level for
major crops,indemnity for prevented/sowing/planting risk and for post
harvest losses due to cyclone,
payment up to 25 per cent advance of likely claims as
immediate relief,

8/3/2019 Agricultural Environment and Policy
http://slidepdf.com/reader/full/agricultural-environment-and-policy 52/135
CREDIT AND INSURANCE
Agricultural Insurance
Pilot Modified NAIS (MNAIS)
more proficient basis for calculation of threshold yield,
minimum indemnity level of 70 per cent instead of 60 per
cent,
and private-sector insurers with adequate infrastr ucture
allowed (at present, ICICI Lombard, IFFCO-Tokio andCholamandalam-MS).
Only upfront premium subsidy is shared by the Central and
State Gover nments on 50: 50 basis and claims are the
liabi
lity of the i
ns
ura
nce
compa
nies.Seven States have already notified the areas for
implementation of the scheme during Rabi 2010-11.
It is expected that the scheme will be notified by 14- 15
States.

8/3/2019 Agricultural Environment and Policy
http://slidepdf.com/reader/full/agricultural-environment-and-policy 53/135
CREDIT AND INSURANCE
Agricultural Insurance
Weather Based Crop Insurance Scheme (WBCIS)Covered By: State Agriculture Insurance Company (AIC),
and other private insurers like ICICI Lombard General
Insurance, Iff co-Tokio General Insurance etc.
13 States
to provide insurance protection to farmers against adverse
weather incidences which adversely impact crop production.
During this period 81 lakh farmers have been covered.

8/3/2019 Agricultural Environment and Policy
http://slidepdf.com/reader/full/agricultural-environment-and-policy 54/135
CREDIT AND INSURANCE
Agricultural Insurance
Coconut Palm Insurance Scheme (CPIS) 2009-10
Covered by: The Agriculture Insurance Company of India(AIC)
It operates under Coconut Development Board.
Area Covered : Andhra Pradesh, Goa, Kar nataka, Kerala,
Maharashtra, Orissa and Tamil Nadu.
Eligibility: a farmer should have at least 10 healthy nut-
bearing palms in the age group 4 to 60 years
14.33 lakhs palms are covered under the scheme.
27,023 farmers are
covered
8/3/2019 Agricultural Environment and Policy
http://slidepdf.com/reader/full/agricultural-environment-and-policy 55/135
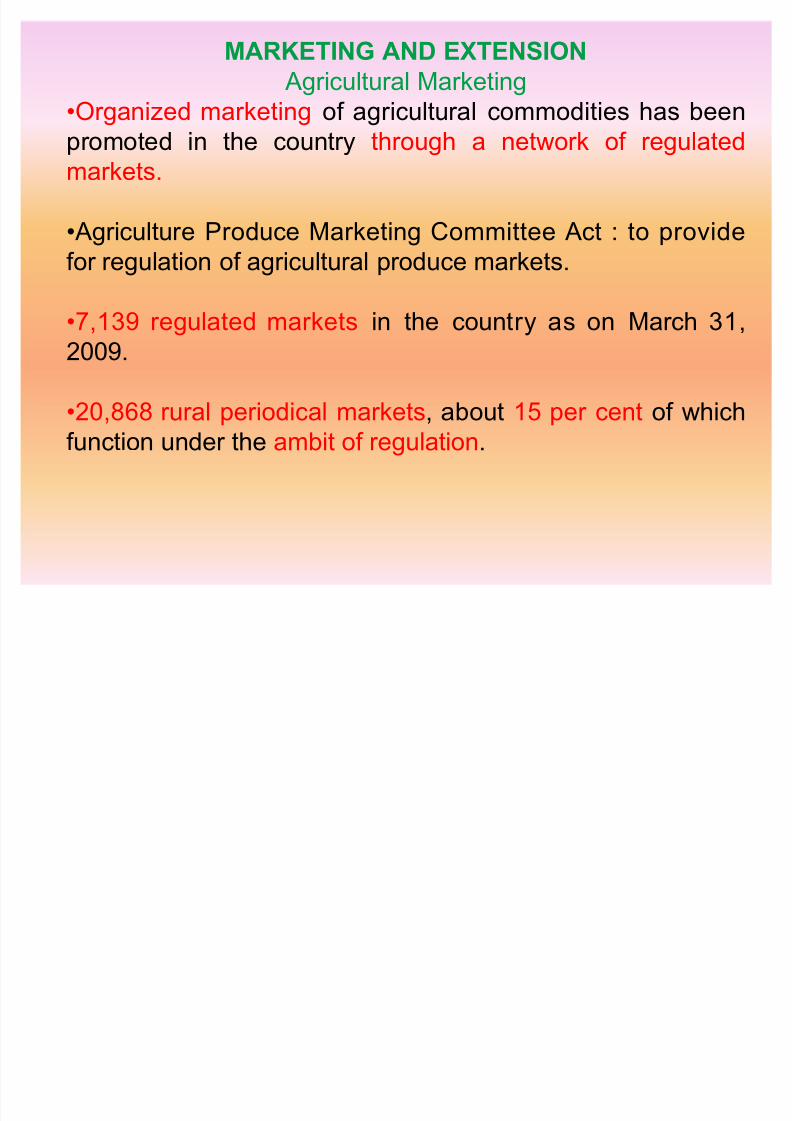
MARKETING AND EXTENSION
Agricultural Marketing
Organized marketing of agricultural commodities has been
promoted in the country through a network of regulatedmarkets.
Agriculture Produce Marketing Committee Act : to provide
for regulation of agricultural produce markets.
7,139 regulated markets in the country as on Mar ch 31,
2009.
20,868 r
ura
lperiodi
ca
lmarkets, abo
ut 15 per
ce
nt of
whi
chf unction under the ambit of regulation.

8/3/2019 Agricultural Environment and Policy
http://slidepdf.com/reader/full/agricultural-environment-and-policy 56/135
MARKETING AND EXTENSION
Agricultural Marketing
Model law on agricultural marketing(2003)
The
legis
latio
nprovides for estab
lishme
nt of private markets/yards,direct pur chase centres, consumers¶/farmers¶ markets for direct sale. To
promote contract farming arrangements
Promotion of public-private partnership in the management and
development of agricultural markets in the country.
Provision has also been made in the law for constitution of state
agricultural produce marketing standards bureaus for promotion of grading, standardization and quality certification of agricultural produce.
This would facilitate pledge financing, direct pur chasing, for ward/ f utures
trading and exports.
Sixteen states/UTs have amended their APMC acts and the remaining
states are in
the process of doi
ng so APMC model r ules based on the model law are under formulation in
consultation with States.

8/3/2019 Agricultural Environment and Policy
http://slidepdf.com/reader/full/agricultural-environment-and-policy 57/135
MARKETING AND EXTENSION
Extension reforms
The Gover nment supports transfer of agricultural
technologies and information to the farming community
through various initiatives.
The Support to State Extension Programmes for the
Extension Reforms scheme launched in 2005-06, aims to
make the extension system farmer driven and farmer
accountable by way of new institutional arrangements for
technology dissemination in the form of an Agricultural
Technology Management Agency (ATMA) at district level.
MARKETING AND EXTENSION

8/3/2019 Agricultural Environment and Policy
http://slidepdf.com/reader/full/agricultural-environment-and-policy 58/135
MARKETING AND EXTENSION
Extension reformsThe ATMA has active participation of farmers/farmer groups,
nongover nmental organizations (NGOs), KVKs, PRIs and other stakeholders operating at district level and below. Up to January
2010, 595 districts-level ATMAs have been established.
Gender : 30 per cent of resour ces on programmes and
activities are allocated for women farmers and extension
f unctionaries.Since inception, out of a total of 10.19 crore farmer
beneficiaries, 25.80 lakh women farmers (25.34 per cent) have
participated in various extension activities under the scheme.
Further, the Mass Media Support to Agriculture scheme is
focusing on the use of Doordarshan infrastr ucture for providingagriculture-related information and knowledge to the farming
community.
MARKETING AND EXTENSION

8/3/2019 Agricultural Environment and Policy
http://slidepdf.com/reader/full/agricultural-environment-and-policy 59/135
MARKETING AND EXTENSION
Extension reforms
Mass media initiative is use of 96 FM transmitters of All India
Radio (AIR) to broadcast area-specific agriculturalprogrammes
with 30- minute radio transmission in the evening, six days a
week.
The Kisan Call Centres scheme provides the farming
community agricultural information
toll-free telephone lines ³1800-180-1551´
The Agri-clinic and Agri-business Centres Scheme launched
in 2002 provides extension services to farmers
thro
ugh agri
culture grad
uates by viab
le se
lf-emp
loyme
ntventures.
MARKETING AND EXTENSION

8/3/2019 Agricultural Environment and Policy
http://slidepdf.com/reader/full/agricultural-environment-and-policy 60/135
MARKETING AND EXTENSION
Extension reforms
N ABARD monitors the credit support to Agri-clinics
Subsidy at 25 per cent of the capital cost of the projectf unded through bank loan.
The subsidy would be 33.33 per cent in respect of
candidates belonging to Scheduled Castes (SC), Scheduled
Tribes (ST), women and other disadvantaged sections
Under the scheme, 19,854 unemployed agriculturegraduates have been trained up to December 2009.
PUBLIC DISTRIBUTION SYSTEM

8/3/2019 Agricultural Environment and Policy
http://slidepdf.com/reader/full/agricultural-environment-and-policy 61/135
PUBLIC DISTRIBUTION SYSTEM
Objectives Procurement of foodgrains from farmers at remunerative
prices,
Distribution of foodgrains to consumers,
Particular ly the vulnerable sections of society,
At affordable prices and
Maintenance of food buffers for food security and price
stability.
The instr uments used are the MSP and central issue
Price (CIP).
PUBLIC DISTRIBUTION SYSTEM

8/3/2019 Agricultural Environment and Policy
http://slidepdf.com/reader/full/agricultural-environment-and-policy 62/135
PUBLIC DISTRIBUTION SYSTEM
Objectives The nodal agency which undertakes procurement,
distribution and storage of foodgrains is the Food Cororation
of India (FCI).
Procurement at MSP is open-ended,
Distribution is gover ned by the scale of allocation and itsofftake by the beneficiaries.
The off take of foodgrains is primarily under the targeted
public distribution system(TPDS) and for other welfare
schemes of the Gover
nme
nt of I
ndia.Offtake of foodgrains under the TPDS has been increasing
in the last five years and has gone up from 29.7 million
tonnes in 2004-05 to 34.8 million tonnes in 2008-09.

8/3/2019 Agricultural Environment and Policy
http://slidepdf.com/reader/full/agricultural-environment-and-policy 63/135
PUBLIC DISTRIBUTION SYSTEM

8/3/2019 Agricultural Environment and Policy
http://slidepdf.com/reader/full/agricultural-environment-and-policy 64/135
PUBLIC DISTRIBUTION SYSTEM
Decentralized Procurement Scheme (DCP)
Introduced in 1997,
Foodgrains are procured and distributed by the StateGover nments themselves.
States procure, store and issue foodgrains under the TPDS
and welfare schemes of the Gover nment of India.
The difference between the economic cost fixed for the
State and the CIP is passed on to the State Gover nment assubsidy.
Objectives: covering more farmers under MSP operations,
improving efficiency of the PDS, providing foodgrains
varieties more suited to
lo
ca
ltastes a
nd red
ucin
gtransportation costs.

8/3/2019 Agricultural Environment and Policy
http://slidepdf.com/reader/full/agricultural-environment-and-policy 65/135

8/3/2019 Agricultural Environment and Policy
http://slidepdf.com/reader/full/agricultural-environment-and-policy 66/135

8/3/2019 Agricultural Environment and Policy
http://slidepdf.com/reader/full/agricultural-environment-and-policy 67/135

8/3/2019 Agricultural Environment and Policy
http://slidepdf.com/reader/full/agricultural-environment-and-policy 68/135

8/3/2019 Agricultural Environment and Policy
http://slidepdf.com/reader/full/agricultural-environment-and-policy 69/135
PUBLIC DISTRIBUTION SYSTEM
8/3/2019 Agricultural Environment and Policy
http://slidepdf.com/reader/full/agricultural-environment-and-policy 70/135
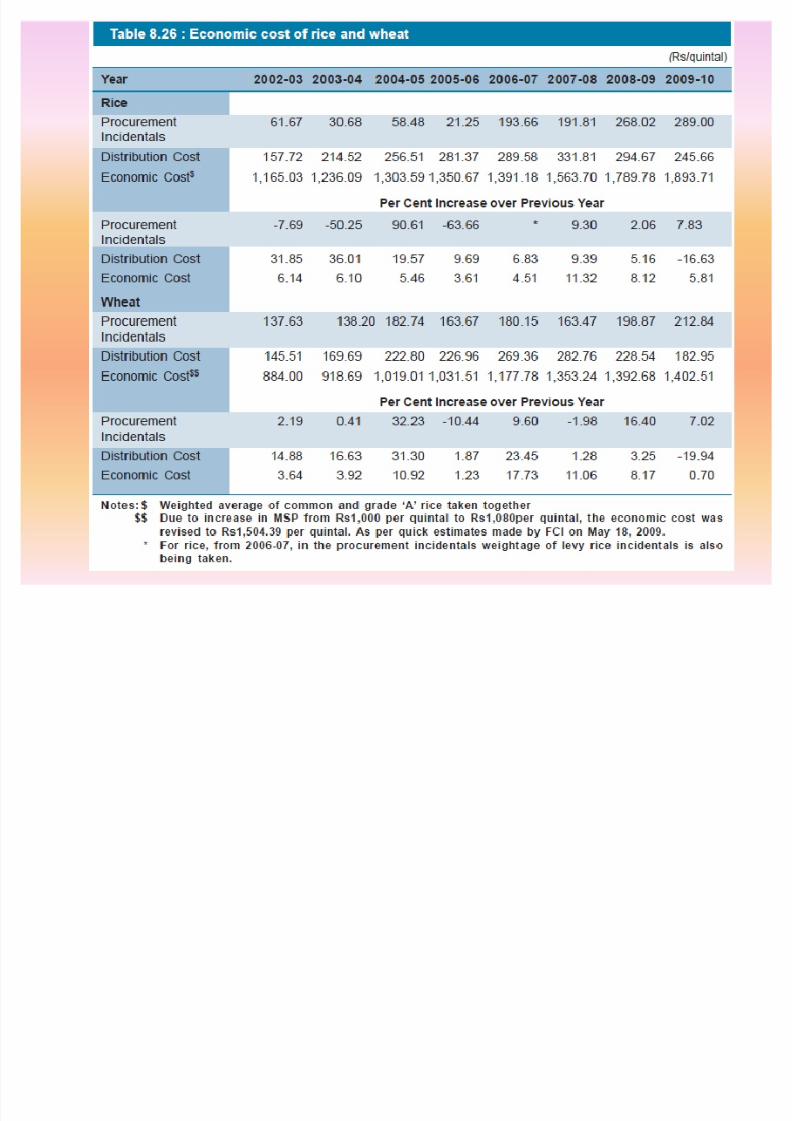
PUBLIC DISTRIBUTION SYSTEM
The economic cost of foodgrains consists of three
components,
MSP (and bonus) as the price paid to farmers,
procurement incidentals and
Cost of distribution.
8/3/2019 Agricultural Environment and Policy
http://slidepdf.com/reader/full/agricultural-environment-and-policy 71/135

8/3/2019 Agricultural Environment and Policy
http://slidepdf.com/reader/full/agricultural-environment-and-policy 72/135
PUBLIC DISTRIBUTION SYSTEM

8/3/2019 Agricultural Environment and Policy
http://slidepdf.com/reader/full/agricultural-environment-and-policy 73/135
PUBLIC DISTRIBUTION SYSTEM
Sugar
The estimated sugar cane production in 2009-10 is 2,494.81
lakh tonnes
2,739.31 lakh tonnes as per estimates 2008-09.
9 per cent decline in the production
The estimated production of sugar in the
2009-10 =160 lakh tonnes( 116 LT decline)
2007-08 = 263 lakh tonnes
2006-07 = 282 lakh tonnes
PUBLIC DISTRIBUTION SYSTEM

8/3/2019 Agricultural Environment and Policy
http://slidepdf.com/reader/full/agricultural-environment-and-policy 74/135
PUBLIC DISTRIBUTION SYSTEM
Sugar
The Gover
nme
nt has take
na
number of meas
ures toaugment domestic stocks of sugar and to moderate prices.
Includes allowing sugar mills to import dutyfree raw sugar
under the advance authorization scheme from Febr uary 17,
2009,
Under open general license (OGL) by sugar mills Allowing import of white/refined sugar by STC/MMTC/ PEC
and N AFED up to 1 million tonnes under OGL at zero duty
up to Mar ch 31,2010.
Fair and remunerative price (FRP) to provide reasonable
margins to sugar cane farmers on account of ³risk´ and
³profit´.
The Central Gover nment has fixed an FRP of Rs129.84 per
quintal
PUBLIC DISTRIBUTION SYSTEM

8/3/2019 Agricultural Environment and Policy
http://slidepdf.com/reader/full/agricultural-environment-and-policy 75/135
PUBLIC DISTRIBUTION SYSTEM
Edible Oil
To inc
rease the availabi
lity a
nd
co
ntro
lpri
ces of edib
le oi
ls,Gover nment has reduced the custom duties on crude and
refined edible oils to ³nil´ and 7.5 per cent respectively since
April1, 2008 upto 2010.
Export of all major edible oils from the country has beenbanned since 2008 to 2010
Imported edible oils were distributed through State
Gover nments/UTs at the rate of 1 kg per ration card per
month.

8/3/2019 Agricultural Environment and Policy
http://slidepdf.com/reader/full/agricultural-environment-and-policy 76/135
Commodity Future Market

8/3/2019 Agricultural Environment and Policy
http://slidepdf.com/reader/full/agricultural-environment-and-policy 77/135
Commodity Future MarketCommodities traded: agricultural commodities, bullion, cr ude
oil, energy and metal products.
Thecommodity f
utu
res market facilitates the pri
ce dis
coveryprocess and provides price risk management.
Its effectiveness depends on the wider participation of all the
stakeholders.
The average daily value of trades in the commodity exchanges
improved from Rs 16,400 crore during 2008 to Rs 23,200 crorein 2009.
The total value of trades in the commodity f utures market rose
from Rs 50.34 lakh crore in 2008 to Rs 95.90 lakh crore during
2010.
The Multi Commodity Exchange, Mumbai, recorded the highesttur nover in terms of value of trade during 2009,
followed by the National Commodity & Derivatives Exchange
Ltd. (NCDEX) and National Multi Commodity Exchange of India
Ltd. (NMCE) respectively

8/3/2019 Agricultural Environment and Policy
http://slidepdf.com/reader/full/agricultural-environment-and-policy 78/135

8/3/2019 Agricultural Environment and Policy
http://slidepdf.com/reader/full/agricultural-environment-and-policy 79/135
Commodity Future Market

8/3/2019 Agricultural Environment and Policy
http://slidepdf.com/reader/full/agricultural-environment-and-policy 80/135
Commodity Future Market
Value of trade in agricultural commodities was about 16.33
per ce
nt.
Agricultural commodities, however, accounted for 38 per cent
of the total volume of trade.
Commodity Future Market

8/3/2019 Agricultural Environment and Policy
http://slidepdf.com/reader/full/agricultural-environment-and-policy 81/135
Co od ty utu e a et
For ward Markets Commission (FMC), the regulator for
commodity f
utu
res trading.To counterbalance the speculative element in price discovery
and increasing the awareness level of farmers and other market
participants was emphasized.
Take initiatives to prevent market manipulation
Ensure market integrity, financial integrity and customer protection.
The issuance of guidelines for bringing members of the
commodity exchanges
guidelines for disinvestment of the equity by the existing
national exchanges after five years of their operation. A price dissemination project was initiated by the FMC, under
which spot and f uture prices of agricultural commodities
would be made available to farmers on real-time basis on
ele
ctro
nic
price ti
cker boards p
la
ced at APMC
Commodity Future Market

8/3/2019 Agricultural Environment and Policy
http://slidepdf.com/reader/full/agricultural-environment-and-policy 82/135
y
Introduction of exchange of f utures for physicals (EFP) and
alter
nate f
utu
res settleme
nt me
cha
nism, Allowing higher position limits to N AFED
To facilitate hedging and delivery by them and introduction of
ear ly delivery system in select commodities.
Efforts were made to develop an ³aggregation´ model in
collaboration with commodity exchanges to promoteparticipation of farmers.
Commodity Future Market

8/3/2019 Agricultural Environment and Policy
http://slidepdf.com/reader/full/agricultural-environment-and-policy 83/135
y
Revocation(cancel) of suspension of f utures trading 4
commodities :
cha
na, soy oi
l, r
ubber a
nd potato, 2008.
Revocation of suspension of trading in wheat in 2009.
The f utures trading in sugar has been suspended till 2010.
Commodity Future Market

8/3/2019 Agricultural Environment and Policy
http://slidepdf.com/reader/full/agricultural-environment-and-policy 84/135
yDEVELOPMENT OF ELECTRONIC SPOT EXCHANGES
The Gover nment has allowed the National Commodity Exchanges to set up three
spot exchanges in the country, namely
theN
ationa
lSpot Ex
cha
nge
Ltd. (
NSE
L),
NCDEX spot Exchange Ltd. (NSPOT) and
National Agriculture Produce Marketing Company of India Ltd. (N APMC).
These spot exchanges have created an avenue for direct market linkage among
farmers, processors, exporters and end users
with a view to reducing the cost of intermediation and enhancing price realization
by farmers.They will also provide the most efficient spot price inputs to the f utures
exchanges.
The spot exchanges will encompass the entire spectr um of commodities across
the country
will bring home the advantages of an electronic spot trading platform to all market
participants in the agricultural and nonagricultural segments.
On the agricultural side, the exchanges would enable farmers to trade f lawlessly
on the platform by providing real-time access to price information and a simplified
delivery process, thereby ensuring the best possible price.
Commodity Future Market

8/3/2019 Agricultural Environment and Policy
http://slidepdf.com/reader/full/agricultural-environment-and-policy 85/135
yDEVELOPMENT OF ELECTRONIC SPOT EXCHANGES
On the buy side, all users of the commodities in the commodity value chain would
have simul
taneo
us a
ccess to the ex
cha
nges a
nd be ab
le to pro
cure at the bestpossible price.
Therefore the efficiency levels attained as a result o f such f lawless spot
transactions would result in major benefits for both producers and consumers.
These Spot Exchanges will also provide a platform for trading of Warehouse
Receipts.
Agricultural Manufacturing Industry

8/3/2019 Agricultural Environment and Policy
http://slidepdf.com/reader/full/agricultural-environment-and-policy 86/135
g g y
1. Growth in industry as whole : 11.00%
1. Min
ing : 9.5 %2. Manufacturing: 11.9%
3. Electricity : 4.0%
2. Growth in components of agri-based industry(base 1993-
94) in 2008-09
1. Food products : 7.0 %2. Beverages , Tobacco: 12.0%
3. Jute textile: 33.1 %
In first quarter of 2009-10 , all these agri components are
negative

8/3/2019 Agricultural Environment and Policy
http://slidepdf.com/reader/full/agricultural-environment-and-policy 87/135

8/3/2019 Agricultural Environment and Policy
http://slidepdf.com/reader/full/agricultural-environment-and-policy 88/135
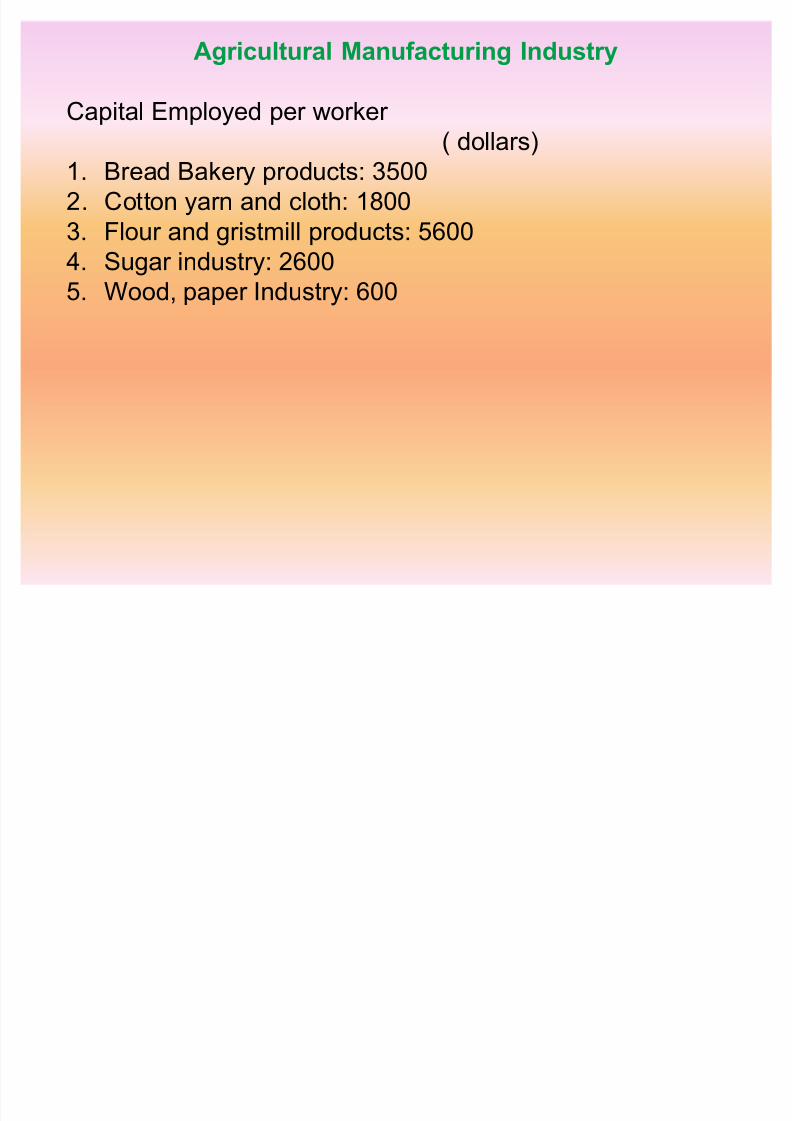
Agricultural Manufacturing Industry
8/3/2019 Agricultural Environment and Policy
http://slidepdf.com/reader/full/agricultural-environment-and-policy 89/135
Capital Employed per worker
( dollars)1. Bread Bakery products: 3500
2. Cotton yar n and cloth: 1800
3. Flour and gristmill products: 5600
4. Sugar industry: 2600
5. Wood, paper Industry: 600

8/3/2019 Agricultural Environment and Policy
http://slidepdf.com/reader/full/agricultural-environment-and-policy 90/135

8/3/2019 Agricultural Environment and Policy
http://slidepdf.com/reader/full/agricultural-environment-and-policy 91/135

8/3/2019 Agricultural Environment and Policy
http://slidepdf.com/reader/full/agricultural-environment-and-policy 92/135

8/3/2019 Agricultural Environment and Policy
http://slidepdf.com/reader/full/agricultural-environment-and-policy 93/135

8/3/2019 Agricultural Environment and Policy
http://slidepdf.com/reader/full/agricultural-environment-and-policy 94/135

8/3/2019 Agricultural Environment and Policy
http://slidepdf.com/reader/full/agricultural-environment-and-policy 95/135

8/3/2019 Agricultural Environment and Policy
http://slidepdf.com/reader/full/agricultural-environment-and-policy 96/135

8/3/2019 Agricultural Environment and Policy
http://slidepdf.com/reader/full/agricultural-environment-and-policy 97/135
Indian Budget

8/3/2019 Agricultural Environment and Policy
http://slidepdf.com/reader/full/agricultural-environment-and-policy 98/135
Agriculture
Removal of production and distribution bottlenecks for items
like fr uits and vegetables, milk, meat, poultry and fish to be
the focus of attention this year .
Allocation under Rashtriya Krishi Vikas Yojana (RKVY)
increased from ` 6,755 crore to ` 7,860 crore.
Indian Budget
A i lt

8/3/2019 Agricultural Environment and Policy
http://slidepdf.com/reader/full/agricultural-environment-and-policy 99/135
Agriculture
B
ringing Green Revolution to Eastern RegionTo improve rice based cropping system in this region,
allocation of 400 crore has been made.
I ntegrated Development of 60,000 pulses villages in rainfed
areas Allocation of 300 crore to promote 60,000 pulses villages in
rainfed areas.
Promotion of Oil Palm
Allocation of 300 crore to bring 60,000 hectares under oil
palm plantations.
Initiative to yield about 3 lakh Metric tonnes of palm oil
annually in five years.
Indian Budget

8/3/2019 Agricultural Environment and Policy
http://slidepdf.com/reader/full/agricultural-environment-and-policy 100/135
Agriculture
I nitiative on Vegetable Clusters
Allocation of 300 crore for implementation of vegetable
initiative to provide quality vegetable at competitive prices.
N utri-cereals Allocation of 300 crore to promote higher production of
Bajra, Jowar, Ragi and other millets, which are highly
nutritious and have several medicinal properties.
N ational Mission for Protein Supplement
Allocation of 300 crore to promote animal based protein
production through livestock development, dairy farming,
piggery, goat rearing and fisheries.
Indian Budget

8/3/2019 Agricultural Environment and Policy
http://slidepdf.com/reader/full/agricultural-environment-and-policy 101/135
Agriculture
Accelerated Fodder Development Programme
Allocation of 300 crore for Accelerated Fodder Development
Programme to benefit farmers in 25,000 villages.
N ational Mission for Sustainable AgricultureGover nment to promote organic farming methods,
combining moder n technology with traditional farming
practices.
Indian Budget

8/3/2019 Agricultural Environment and Policy
http://slidepdf.com/reader/full/agricultural-environment-and-policy 102/135
Agriculture
Agriculture Credit
Credit f low for farmers raised from 3,75,000 crore to
4,75,000 crore in 2011-12.
Interest subvention proposed to be enhanced from 2 per
cent to 3 per cent for providing short-term crop loans tofarmers who repay their crop loan on time.
In view of enhanced target for f low of agriculture credit,
capital base of N ABARD to be strengthened by ` 3,000 crore
in phased manner.
10,000 crore to be contributed to N ABARD¶s Short-term
Rural Credit f und for 2011-12.
Indian Budget

8/3/2019 Agricultural Environment and Policy
http://slidepdf.com/reader/full/agricultural-environment-and-policy 103/135
Agriculture
Mega Food Parks
Approval being given to set up 15 more Mega Food Parks
during 2011-12.
Storage Capacity and Cold Chains Augmentation of storage capacity through private
entrepreneurs and warehousing corporations has been fast
tracked.
Capital investment in creation of moder n storage capacity
will be eligible for viability gap f unding of the Finance
Ministry.
Indian Budget

8/3/2019 Agricultural Environment and Policy
http://slidepdf.com/reader/full/agricultural-environment-and-policy 104/135
Agriculture
Agriculture Produce Marketing Act
In view of recent episode of inf lation, need for State
Gover nments to review and enfor ce a reformed Agriculture
Produce Marketing Act.
8/3/2019 Agricultural Environment and Policy
http://slidepdf.com/reader/full/agricultural-environment-and-policy 105/135
Agriculture risk management
Risk: A state of uncertainty where some of the possibilities
involve a loss or other undesirable outcome.
Uncertainty: The lack of complete certainty, that is, the
existence of more than one possibility. The "tr ue"
outcome/state/result/value is not known.
Risk Management - A process to identify, assess, manage,
and control potential events or situations, to provide
reasonable assurance regarding the achievement of theorganization's objectives.

8/3/2019 Agricultural Environment and Policy
http://slidepdf.com/reader/full/agricultural-environment-and-policy 106/135
Comprehensive Agriculture risk management framework can
be presented in three main categories:
The first covers direct initiatives on the part of the
Government, such as agricultural credit, input subsidies
and calamity relief.
The second covers indirect initiatives on the part of the
Government to mitigate production risks through
insurance mechanisms covering crops, weather and
livestock and including micro insurance.
Thirdly, Government and market-based approaches to
mitigate price or income risks, which includes minimum
support prices, farm income insurance, a price
stabilization fund, commodity markets, contract farming,

8/3/2019 Agricultural Environment and Policy
http://slidepdf.com/reader/full/agricultural-environment-and-policy 107/135

8/3/2019 Agricultural Environment and Policy
http://slidepdf.com/reader/full/agricultural-environment-and-policy 108/135
Agriculture credit
Wor ld¶s largest network of r ural financial institutions,
boasting 30,272 nationalized commer cial bank branches;
2,934 other commer cial banks;
14,241 r ural regional bank branches and
about 122,000 credit outlets from the cooperative sector
18% of each bank¶s net credit should be given to the
agriculture sector

8/3/2019 Agricultural Environment and Policy
http://slidepdf.com/reader/full/agricultural-environment-and-policy 109/135
Input subsidiesRs. crore
Fertilizer = 18460
Electricity = 20301
Irrigation = 14625
Other = 6504
Total subsidy = 82967

8/3/2019 Agricultural Environment and Policy
http://slidepdf.com/reader/full/agricultural-environment-and-policy 110/135
Calamity funds
The Calamity Relief Fund (CRF)
contributions from both central and state Gover nments (3:1 ration) and is used
to pay for relief in the event of droughts, f loods, cyclones, hailstorms, tsunamis,
etc.
The National Calamity Contingency Fund (NCCF) was created at central level
with 100% contribution from the Central Gover nment, and is used for any relief operations not covered by the CRF.
The Twelfth Finance Commission has allocated a f und of INR 213.33 billion for
the 5 year period between fiscal year 2005-06 to fiscal year 2010-11.2
Though the Calamity Funds were formulated with a noble cause, their
execution, efficiency and timely availability are riddled with shortcomings.

8/3/2019 Agricultural Environment and Policy
http://slidepdf.com/reader/full/agricultural-environment-and-policy 111/135
PRODUCTION & ASSET PROTECTION
Area yield±based crop insurance
India is administering the wor ld¶s largest crop insurance programme in terms of
the number of farmers insured.
The National Agricultural Insurance Scheme (N AIS) annually insuresapproximately 18 million farmers, or 15% of all farmers and approximately 17%
of all farmed land.
PRODUCTION & ASSET PROTECTION
Area yield±based crop insurance
M j i t id tifi d b G t

8/3/2019 Agricultural Environment and Policy
http://slidepdf.com/reader/full/agricultural-environment-and-policy 112/135
Major improvements identified by Govt are:
Bringing the Insurance Unit down to the village Panchayat level so as to
minimize the base risk..
Using a longer time yield series when in fixing the Guaranteed Yield, to ensuremore stable coverage.
Increasing the levels of indemnity (coverage).
Introducing insurance to prevent sowing/planting and post-harvest losses
under adverse conditions.
In case of major disasters, allowing for the partial settlement of claims on
accounts.uniform seasonality discipline (cut-off dates for buying insurance) be employed
for participation for all farmers, both borrowing and non borrowing.
Covering horticultural crops such as vegetables and fr uits.
Introducing a gradual shift from an administered price regime to an actuarial
one, supported by up-front subsidy as a premium.
Adopting transparent norms for subsidy premiums with the participation of theprivate sector participation.
Sharing of premiums by banks, where lending banks bear 25% of the premium
payable by the farmer, subject to a maximum of one per centage point of the
premium.
Through these improvements, the Gover nment is expecting to double the
penetratio
nof
crop i
ns
ura
nce s
chemes by 2012.

8/3/2019 Agricultural Environment and Policy
http://slidepdf.com/reader/full/agricultural-environment-and-policy 113/135
PRODUCTION & ASSET PROTECTION
Weather-based crop insurance
Weather-based crop insurance appeared in India in 2003.
At present, Agriculture Insurance Company of India (AIC), is providing
weather-insurance services along with two private insurers.Though most of these attempts were taken on the initiative of
particular insurers until 2006-7, in 2007-8 the Gover nment began
offering an alter native to N AIS by initiating pilot projects in select
areas for select crops.

8/3/2019 Agricultural Environment and Policy
http://slidepdf.com/reader/full/agricultural-environment-and-policy 114/135
PRODUCTION & ASSET PROTECTION
Weather-based crop insurance
While weather-based crop insurance appears a priori to be an
attractive proposal, i t is confronted with many constraints. These
include:
(i) a sparse network of weather stations belonging to the IndiaMeteorological Department (IMD), and the consequent lack of high
quality weather data for locations smaller than the district level;
(ii) prohibitively high premium rates for farmers;
(iii) the limited scope of weather insurance (it only covers parametric
weather events), compared to the µall risk¶ nature of µarea yield
insurance, etc.

8/3/2019 Agricultural Environment and Policy
http://slidepdf.com/reader/full/agricultural-environment-and-policy 115/135
PRODUCTION & ASSET PROTECTION
Livestock insurance
Livestock insurance began in the ear ly 1970s and still
maintains the same µplain vanilla¶ offerings in terms of scope and
coverage. This type of insurance still covers only accidental death
(basic coverage) with permanent total disability as an optional
coverage. The premium for basic coverage is 4% in the case of
general animals and 2.25% in the case of animals financed under Government schemes. Despite being in existence for over 30 years,
the total penetration of livestock insurance in the r ural areas is still
poor. The Gover nment has recently introduced a pilot scheme on
livestock insurance in 100 districts with a 50% premium subsidy for
two animals per family.
PRODUCTION & ASSET PROTECTION

8/3/2019 Agricultural Environment and Policy
http://slidepdf.com/reader/full/agricultural-environment-and-policy 116/135
Micro-insurance
There are three distinct phases of micro-insurance (MI) development
in India.The first phase coincided with the introduction of target- oriented
poverty alleviation programmes such as the Integrated Rural
Development Programme (IRDP).
The second phase of MI growth can be seen in con junction with the
growth of credit disbursement to the poorer segments of society
through the Self Help Groups (SHGs). This saw an increase in the roleof Non-Gover nmental Organizations (NGOs) for the purposes of
intermediation and the proliferation of Microfinance Institutions (MFIs).
The third phase of MI development was bor ne out of the increasing
realization of the need for an increased coverage of poorer
households through some form of social security measure.
market are related to health insurance, with only a few offeringinsurance for assets, livestock, crops, etc. While India boasts
tremendous MI potential, some areas within the regulations require
amendments in order to achieve their f ull potential.
PRODUCTION & ASSET PROTECTION

8/3/2019 Agricultural Environment and Policy
http://slidepdf.com/reader/full/agricultural-environment-and-policy 117/135
Micro-insurance
Recognizing the need for insurers to adjust the costs they face in
serving marginal clients in remote areas; collecting premiums andinstallments; and offering doorstep services, the Insurance
Regulatory & Development Authority (IRDA) announced the
introduction of new micro-insurance regulations in December
2005. These regulations enable an insurer with a life insurance
business to offer life micro-insurance products as well as non-life
micro-insurance products to poor households. Similar ly, an insurer providing non-life insurance services may offer general micro-
insurance products as well as life micro-insurance products. Most MI
products on the market are related to health insurance, with only a few
offering insurance for assets, livestock, crops, etc. While India boasts
tremendous MI potential, some areas within the regulations require
amendments in order to achieve their f ull potential.
MARKETING & PRICE INSURANCE

8/3/2019 Agricultural Environment and Policy
http://slidepdf.com/reader/full/agricultural-environment-and-policy 118/135
MARKETING & PRICE INSURANCE
One major issue in an agrarian economy is in the form of price
f luctuations, as they pose a serious risk to farmers¶ income and well-being.
Supply-side problems and agricultural marketing system as well as
infrastr ucture weaknesses contribute to farmers¶ risk in terms of
price/income realization.
Furthermore, seasonal production also leads to price volatility
when harvested crops reach markets in very large volumes within ashort time span.
When there is a bumper crop, the farmer finds himself in a buyer¶s
market during the peak marketing season, making him a price-taker.
Even though globalization and liberalization are expected to
benefit farmers by creating greater opportunities for better price
realisation, the market sometimes exposes them to greater risks asmost agricultural commodities, particular ly those grown by small
farmers, are not well-known at the inter national level.
MARKETING & PRICE INSURANCE

8/3/2019 Agricultural Environment and Policy
http://slidepdf.com/reader/full/agricultural-environment-and-policy 119/135
MARKETING & PRICE INSURANCE
1.Agriculture price risk management instrumentsMinimum Support Prices (MSP)
Electronic Spot Exchanges
Price Stabilization Fund (PSF)
2.Commodity markets and Contract farming
Commodity markets
Contract farming
3.Revenue based farm income insurance

8/3/2019 Agricultural Environment and Policy
http://slidepdf.com/reader/full/agricultural-environment-and-policy 120/135
Issues in agricultural policies

8/3/2019 Agricultural Environment and Policy
http://slidepdf.com/reader/full/agricultural-environment-and-policy 121/135
Issues in agricultural policies
1. I & II plan emphasized on major and medium irri project
2. In 1965-67, India faced severe drought
3. Imported 19 MT foodgrains
4. It lead to reexamination of agri strategy
Issues in agricultural policies

8/3/2019 Agricultural Environment and Policy
http://slidepdf.com/reader/full/agricultural-environment-and-policy 122/135
Issues in agricultural policies
5. Govt designed National Agricultural Policy
1. Focus on minor irrig project
2. Inputs and credit at subsidized rate
3. Designed MSP
4. Built up PDS str ucture
5. Introduced r ural employment programs as safety net for poor
Issues in agricultural policies
Impact of Policy Measures

8/3/2019 Agricultural Environment and Policy
http://slidepdf.com/reader/full/agricultural-environment-and-policy 123/135
Impact of Policy Measures
1. Technological Measures: Package of practice at Green Revol.
2. Land Reform(abolish intermdries interest on land) : Tenancy Reform,
transfer of land to actual tiller
3. Cooperation and consolidation of holdings: reorganization andfragmentation of holdings. Cooperative farming
Issues in agricultural policies
Impact of Policy Measures

8/3/2019 Agricultural Environment and Policy
http://slidepdf.com/reader/full/agricultural-environment-and-policy 124/135
4. Institutions involving people¶s in planning: Community development
programme, for the people, by the people, design panchayat raj
5. Institutional Credit: Cooperative Society expansion, RRBs
6. Procurement and Support Prices: MSP, Issue Price estimation
Issues in agricultural policies
Impact of Policy Measures

8/3/2019 Agricultural Environment and Policy
http://slidepdf.com/reader/full/agricultural-environment-and-policy 125/135
Impact of Policy Measures
7. Input Subsidies to agriculture:F
ertilizer, seeds, electricity, irrigation
8. Food security system: PDS
9. Rural Employment Programmes: 4th Plan SFDA, JRY, SGRY, JGSY
Issues in agricultural policies
Impact of Policy Measures

8/3/2019 Agricultural Environment and Policy
http://slidepdf.com/reader/full/agricultural-environment-and-policy 126/135
Impact of Policy Measures
Other measures:development of Irrigation projects,
electrification,
Warehousing,
promotion of Agri Research,
econ condition of farm labours,
crop insurance,
KCC,
roads,
rural housing,
telephone . etc.
Issues in agricultural policies
Trends in Investment
1 Sh f A i i GDP d li f 55 10% i 1950 51 t 15 70 % i 2008 09
8/3/2019 Agricultural Environment and Policy
http://slidepdf.com/reader/full/agricultural-environment-and-policy 127/135
1. Share of Agri in GDP decline from 55.10% in 1950-51 to 15.70 % in 2008-09
2.Less I
nvestme
nt i
nAgri
culture mea
ns:
Less growth in infrastr ucture supporting agriculture like
irrigation,
r ural roads,
market,
power,
cold storage etc.,
Issues in agricultural policies
Trends in Investment
8/3/2019 Agricultural Environment and Policy
http://slidepdf.com/reader/full/agricultural-environment-and-policy 128/135
3. Total agri investment : 1990-91 = 14,836 crores (9.9 % of total investment)
(29.60 % public investment)
2008-09 = 1,38,597 crores (7% of total investment)
(17.60 % public investment)
4. Gover nment try to compensate its investment considering the positive
growth private investment .
5. Increasing subsidies reduces Capital Formation. The public investment isdiverted toward subsidies.
6. Considering the problem of RIDF, the govt started RIDF(r ural infrastr ucture
development f und)

8/3/2019 Agricultural Environment and Policy
http://slidepdf.com/reader/full/agricultural-environment-and-policy 129/135
Globalization
A process of deepening economic integration, increasing economic
openness and growing economic independence between countries in thewor ld economy.
It is simply growing economic activities across the political boundaries of
nation.
Globalization happens through
Trade in goods and services Movement of capital
Flow of finance
First Step for globalizing is liberalization which was taken between 1950-70
Increasing Foreign investment., liberating financials policies, control and
regulations on potential companies / organization, MNCs for investing in other
countries are removed, permitted to trade in foreign exchange market.
India also permitted to MNC for entering in India.
Globalization
Aft th S d W ld W t i t th f ti f

8/3/2019 Agricultural Environment and Policy
http://slidepdf.com/reader/full/agricultural-environment-and-policy 130/135
After the Second Wor ld War many countries come together for promotion of
wor ld trade.
For the purpose, General Agreement of Trade and Tariff (GATT) was settled
in 1947 for legal control on inter national trade.
GATT concluded eight rounds to promote wor ld trade through formulation of
policies regarding reduction of tariff and trade restrictions.
Eight and last round of GATT was Ur uguay Round (1986-93).
In this round Director General of GATT, Arthur Dunkel brought Draft Final Act
in 1986, the 104 countries had signed Draft Final Act, which paved way for
setting Wor ld Trade Organization in 1994.
The Wor ld Trade Organization was established on 1 January 1995 and
became new inter national organization set up as a permanent body and isdesigned to play role of watchdog in the sphere of trade in goods, services,
foreign investment, intellectual property right
Globalization

8/3/2019 Agricultural Environment and Policy
http://slidepdf.com/reader/full/agricultural-environment-and-policy 131/135
Globalization
Function of World Trade Organization
It facilitate the implementation, administration and operation of multilateral and
plurilateral trade agreement;
It acts as for um for multilateral trade negotiations;
It administer the understanding on r ules and procedures gover ning the
settlement of disputes;
Overseeing national trade policies;
To achieve coherence in global economic policy-making, cooperation of Wor ldTrade Organization with Inter national Monetary Fund, Inter national Banks for
Reconstr uction and Development.
Globalization

8/3/2019 Agricultural Environment and Policy
http://slidepdf.com/reader/full/agricultural-environment-and-policy 132/135
Agreement of Agriculture
In Ur uguay round, all member nations of GATT have decided to a widespread
reduction in
tariffs,
removal of quantitive restrictions and
openin
gup their e
co
nomies to i
nter
natio
na
l competitio
n.
It has directed policies concer ning with domestic protection in different areas
including agriculture.
Globalization

8/3/2019 Agricultural Environment and Policy
http://slidepdf.com/reader/full/agricultural-environment-and-policy 133/135
Agreement of Agriculture
AoA provides framework for long-term reform of agriculture trade anddomestic policies over the years to come
With objectives of increased market orientation in agril trade
It deals with
1. Providing market access: conversion of non-tariff trade barrier in to
tariff protection, differentiating level for developed and developedcountries.
2. Regulating domestic support: AoA divides domestic support as trading
distorting and non-trade distorting (minimal).
Amber box: Trade distorting domestic support (minimize support)
Green box: Environmental assistance programs
Blue box: Subsides as direct payment to farmers for differencebetween MSP and market price(USA)
Special and Differential box(S&D):)Special measures for particular
class and differential treatment for various class
according to the need. It is for developing countries.
3. Containing export subsidies: Provision for export subsidies
Globalization
8/3/2019 Agricultural Environment and Policy
http://slidepdf.com/reader/full/agricultural-environment-and-policy 134/135
Agreement of Agriculture
Amber box trade distorting support is quantified with Aggregate Measure
of Support(AMS)
It consist of product specific and non-product specific.
Product Specific: difference between domestic support and external
reference price.
Non - Product Specific:F
or various agri inputs like fertilizer, electricity,irrigation and credit.
Other than AoA, following agreements are related to agriculture
Agreement on Sanitary and Phyto-sanitary (SPS): conforming
international standard norms for protection of human, animals or plant life
Agreement on Technical Barriers to Trade (TBT): allow countries to fix
high standards other than international standards suitable for the national
level and tested at national laboratory or agency.
Trade Related Intellectual Property Rights(TRIP): Patent, copyrights,
trademark, industrial designs, undisclosed information.
Gl b li ti

8/3/2019 Agricultural Environment and Policy
http://slidepdf.com/reader/full/agricultural-environment-and-policy 135/135
Globalization
Agreement of Agriculture
AoA was expecting reduction in domestic support for agriculture in
developed countries.
And will increase international price;
subsequently will lead to improve export of developing countries.
But after post WTO.
It result in heavy subsidies by developed countries to their agriculture;
decreasing international prices;
Affecting agriculture in developing countries.