agricultural experiment station 2016 kentucky small grain · 2016. 10. 20. · 6 agroclimatic...
TRANSCRIPT
University of KentuckyCollege of Agriculture,Food and EnvironmentAgricultural Experiment Station
Kentucky Tobacco Research and Development Center | Veterinary Diagnostic Laboratory | Division of Regulatory Services | Research and Education CenterRobinson Forest | Robinson Center for Appalachian Resource Sustainability | University of Kentucky Superfund Research Center | Equine Programs
Agricultural Experiment Station
PR-707
2016 Kentucky Small GrainVARIETY PERFORMANCE TEST
B. Bruening, B. Mijatovic, S. Swanson, J. Connelley, G. Olson, A. Clark, and D. Van Sanford, Plant and Soil Sciences
www.uky.edu/ag/WheatVarietyTest
12
34
5
6
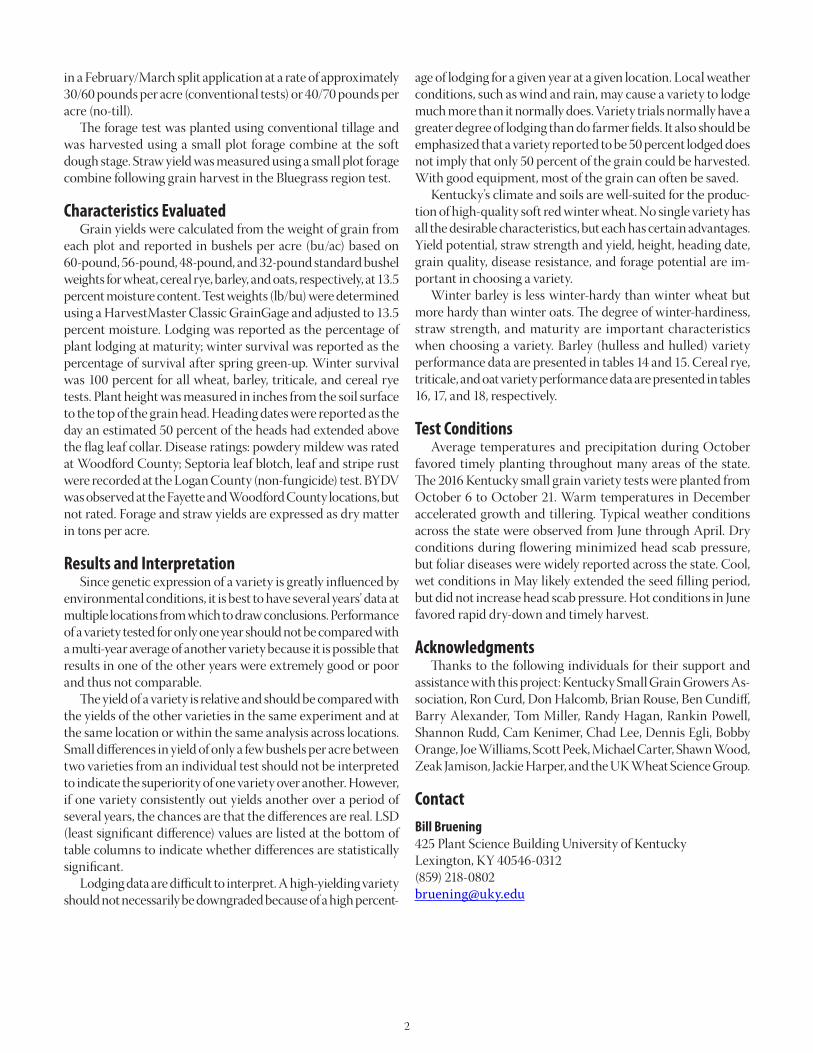
Agroclimatic regions
The 2016 soft red winter wheat growing season ended with Kentucky farmers harvesting 410,000 acres of the 550,000
acres planted, for a total production of 29.5 million bushels of grain. An average yield of 72 bushels per acre was expected (Table 1). The acreage not harvested for grain was primarily used for forage production and cover cropping.
Small grain performance tests were conducted in six of the seven agroclimatic regions of Kentucky (Table 2). Agricultural areas within each region are considered to have similar soil types and climatic conditions. Each region having a substantial acre-age of a small grain commodity had at least one trial conducted in that region for that commodity. The objective of the Kentucky small grain variety perfor-mance test is to evaluate varieties of wheat, oat, barley, triticale and cereal rye that are commercially available or may soon be available to Kentucky farmers. New varieties are continu-ally being developed by agricultural experiment stations and commercial firms. Annual evaluation of small grain varieties and selections provides farmers, seed producers, and other agricultural workers with current information to help them select the varieties best adapted to their locality and individual requirements. Because weather, soil, and other environmental factors may alter varietal performance from one location to another, seven wheat tests were conducted at seven locations throughout the state (Table 2). In addition, wheat tests for varietal differences in forage yield and straw yield were conducted at one location.
Experimental Methods Ninety-seven wheat entries were evaluated under both con-ventional and no-till cultural practices. No-till tests were grown at three locations, and conventional tests were grown at four locations. The experimental design was a randomized complete block. The tests had four replications per entry, and the data presented are the average response from the four replications. The plots were planted with specially built multi-row conven-tional and no-till cone seeders. Conventional test plots consisted of six rows to form a plot 4 feet wide and 15 feet long, which was later trimmed to 12 feet in length. No-till plots consisted of seven rows to form a plot 5 feet wide and 25 feet long, which was later
trimmed to 20 feet in length. Plots were harvested with a small plot combine. The preceding crop for all tests was corn. Tests were conducted using intensive management practices. Typical herbicide applications included a spring application for broadleaf control and a fall preplanting burn-down (no-till tests only) application. Fungicides were applied in the spring on all but one (disease rating) test. An insecticide for aphid control was typically applied in the fall and spring. Nitrogen was applied
Table 1. Wheat Acreage Harvested and Yields (bu/ac) in Kentucky, 2014-16.*
2016 2015 2014Harvested Yield Harvested Yield Harvested Yield
410,000 72 470,000 73 510,000 71
*June 14, 2016, National Agricultural Statistics Service.
Table 2. Agroclimatic Regions of Kentucky Small Grain Variety Tests.Region Location Cooperator Crop Tested
1 Purchase Ballard Co. Tom Miller No-till wheat
2 Western Coal Field
Caldwell Co. Princeton Research and Education Ctr.
No-till wheat, barley
3 Ohio Valley Union Co. Randy Hagan No-till wheat
4 Bluegrass Fayette Co. Kentucky Ag. Exp. Station
Wheat*, triticale, oat, cereal rye
5 Southern Tier
Logan Co. Don Halcomb Wheat*
Trigg Co. Ben Cundiff and Barry Alexander
Wheat*
6 North Central
Woodford Co. UK Woodford Farm Shannon Rudd
Wheat*
* Conventional tillage.
2
in a February/March split application at a rate of approximately 30/60 pounds per acre (conventional tests) or 40/70 pounds per acre (no-till). The forage test was planted using conventional tillage and was harvested using a small plot forage combine at the soft dough stage. Straw yield was measured using a small plot forage combine following grain harvest in the Bluegrass region test.
Characteristics Evaluated Grain yields were calculated from the weight of grain from each plot and reported in bushels per acre (bu/ac) based on 60-pound, 56-pound, 48-pound, and 32-pound standard bushel weights for wheat, cereal rye, barley, and oats, respectively, at 13.5 percent moisture content. Test weights (lb/bu) were determined using a HarvestMaster Classic GrainGage and adjusted to 13.5 percent moisture. Lodging was reported as the percentage of plant lodging at maturity; winter survival was reported as the percentage of survival after spring green-up. Winter survival was 100 percent for all wheat, barley, triticale, and cereal rye tests. Plant height was measured in inches from the soil surface to the top of the grain head. Heading dates were reported as the day an estimated 50 percent of the heads had extended above the flag leaf collar. Disease ratings: powdery mildew was rated at Woodford County; Septoria leaf blotch, leaf and stripe rust were recorded at the Logan County (non-fungicide) test. BYDV was observed at the Fayette and Woodford County locations, but not rated. Forage and straw yields are expressed as dry matter in tons per acre.
Results and Interpretation Since genetic expression of a variety is greatly influenced by environmental conditions, it is best to have several years’ data at multiple locations from which to draw conclusions. Performance of a variety tested for only one year should not be compared with a multi-year average of another variety because it is possible that results in one of the other years were extremely good or poor and thus not comparable. The yield of a variety is relative and should be compared with the yields of the other varieties in the same experiment and at the same location or within the same analysis across locations. Small differences in yield of only a few bushels per acre between two varieties from an individual test should not be interpreted to indicate the superiority of one variety over another. However, if one variety consistently out yields another over a period of several years, the chances are that the differences are real. LSD (least significant difference) values are listed at the bottom of table columns to indicate whether differences are statistically significant. Lodging data are difficult to interpret. A high-yielding variety should not necessarily be downgraded because of a high percent-
age of lodging for a given year at a given location. Local weather conditions, such as wind and rain, may cause a variety to lodge much more than it normally does. Variety trials normally have a greater degree of lodging than do farmer fields. It also should be emphasized that a variety reported to be 50 percent lodged does not imply that only 50 percent of the grain could be harvested. With good equipment, most of the grain can often be saved. Kentucky’s climate and soils are well-suited for the produc-tion of high-quality soft red winter wheat. No single variety has all the desirable characteristics, but each has certain advantages. Yield potential, straw strength and yield, height, heading date, grain quality, disease resistance, and forage potential are im-portant in choosing a variety. Winter barley is less winter-hardy than winter wheat but more hardy than winter oats. The degree of winter-hardiness, straw strength, and maturity are important characteristics when choosing a variety. Barley (hulless and hulled) variety performance data are presented in tables 14 and 15. Cereal rye, triticale, and oat variety performance data are presented in tables 16, 17, and 18, respectively.
Test Conditions Average temperatures and precipitation during October favored timely planting throughout many areas of the state. The 2016 Kentucky small grain variety tests were planted from October 6 to October 21. Warm temperatures in December accelerated growth and tillering. Typical weather conditions across the state were observed from June through April. Dry conditions during flowering minimized head scab pressure, but foliar diseases were widely reported across the state. Cool, wet conditions in May likely extended the seed filling period, but did not increase head scab pressure. Hot conditions in June favored rapid dry-down and timely harvest.
Acknowledgments Thanks to the following individuals for their support and assistance with this project: Kentucky Small Grain Growers As-sociation, Ron Curd, Don Halcomb, Brian Rouse, Ben Cundiff, Barry Alexander, Tom Miller, Randy Hagan, Rankin Powell, Shannon Rudd, Cam Kenimer, Chad Lee, Dennis Egli, Bobby Orange, Joe Williams, Scott Peek, Michael Carter, Shawn Wood, Zeak Jamison, Jackie Harper, and the UK Wheat Science Group.
Contact
Bill Bruening425 Plant Science Building University of Kentucky Lexington, KY 40546-0312(859) [email protected]

3
AgriMAXX Wheat Co.7167 HighbanksRd Mascoutak, IL 62258
AgriMAXX 415AgriMAXX 438AgriMAXX 444AgriMAXX 446AgriMAXX 452AgriMAXX 454AgriMAXX 463AgriMAXX 490AgriMAXX EXP 1670AgriMAXX EXP 1674
Ag Alumni Seed PO Box 158 Romany, IN 47981
Ag 2650
Armor SeedPO Box 9 Waldenburg, AR 72475
ARMOR ARW 1513ARMOR ARW 1516ARMOR ARW 1521ARMOR ARW 1551 ARMOR INFERNO ARMOR RUMBLE
Beck’s Hybrids6767 E. 276th Atlanta, IN 46031
BECK 114BECK 120BECK 123BECK 125BECK 128
Winfield15 Ringel Ave. Wabash, IN 46992
CROPLAN 9101CROPLAN 9201CROPLAN 9203CROPLAN SRW 9415
Dupont Pioneer59 Greif Parkway, Ste. 200 Delaware, OH 43015
Pioneer variety 25R32 Pioneer variety 26R10 Pioneer variety 26R41 Pioneer variety 26R53 Pioneer variety 26R59 Pioneer variety XW13W
Dyna-Gro Seed2760 Keller Rd. Owensboro, KY 43201
Dyna-Gro 9223Dyna-Gro 9522Dyna-Gro 9591Dyna-Gro 9600Dyna-Gro 9692Dyna-Gro WX 15742Dyna-Gro WX 16771
Equity SeedPO Box 978 Westfield, IN 46074
Equity Brand Butler EXP DEI 16098
Kentucky American Seeds, Inc.205 Means Ave. Hopkinsville, KY 42240
KAS Liberty IV KAS Lowery KAS S1200 KAS S2500SYNGENTA BRANSON
Kentucky Foundation Seed ProjectUniversity of Kentucky PO Box 11950 Lexington, KY 40579
KY06C-1178-16-10-3
Kentucky Small Grain Growers Association PO Box 90 Eastwood, KY 40018
PEMBROKE 2008PEMBROKE 2014PEMBROKE 2016
Limagrain Cereal Seeds257 E. Hail Bushnell, IL 61422
L11419L11425L11541
Progeny AG Products1529 Hwy 193 Wynne, AR 72396
PROGENY P 243PROGENY P 357PROGENY P 870PROGENY PGX 15-10PROGENY PGX 15-12PROGENY PGX 15-14PROGENY PGX 15-16
Seed Consultants, Inc.648 Miami Trace Rd. SW, Washington Court House, OH 43160
SC 1315-15™SC 1325-15™ SC 1335-15™SC 13S26™ SC EXP102™SC EXP142™
Southern States Coop.6606 W. Broad St. Richmond, VA 23230
SS 8340SS 8360SS 8513SS 8530SS 8700
Steyer SeedsPO Box 209 Old Fort, OH 44861
STEYER EVANSSTEYER MORRINSTEYER STex141STEYER STex142STEYER STex155
Syngenta Seeds14031 Trestle Rd. Highland, IL 62249
SYNGENTA SY 007SYNGENTA SY 483SYNGENTA SY 547SYNGENTA SY HARRISONSYNGENTA VIPER
UniSouth Genetics3205-C Hwy. 46S Dickson, TN 37055
USG 3013USG 3197USG 3404USG 3895
University of MissouriColumbia, MO 65211
Truman
University of TennesseeKnoxville, TN 37996
TN1102
Virginia TechPO Box 338 Warsaw, VA 22572
Hilliard VA 12W-72
List of Tables Table 3. Wheat Test - Overall State Summary Table 4. Wheat Forage Test Table 5. Wheat Straw Test Table 6. Wheat Test - Purchase Region Table 7. Wheat Test - Western Coal Field Region Table 8. Wheat Test - Ohio Valley Region Table 9. Wheat Test - Bluegrass RegionTable 10. Wheat Test - Southern Tier Region ATable 11. Wheat Test - Southern Tier Region BTable 12. Wheat Test - North Central RegionTable 13. Wheat Disease RatingsTable 14. Hulless Barley Variety TestTable 15. Barley Variety TestTable 16. Cereal Rye Variety TestTable 17. Triticale Variety TestTable 18. Oat Variety Test
Wheat Varieties Tested in 2016

4
Yield (Bu/A)
Test Wt.(Lb/bu)
Height(In)
Heading Date> April 1
VARIETY 2016 2015-16 2014-16 2016 2016 2016
AgriMAXX 463 94.5 57.2 35 25
USG 3404 94.1 92.3 94.2 57.2 38 28
AgriMAXX 438 93.4 92.9 94.7 57.3 38 27
Pioneer variety 26R41 92.3 89.1 92.0 58.6 36 26
AgriMAXX 446 92.1 91.9 95.5 58.1 36 27
AgriMAXX 444 91.9 91.2 94.1 57.0 37 27
Dyna-Gro 9223 91.9 90.2 94.0 57.3 38 27
SS 8360 91.8 90.9 94.8 58.3 36 28
USG 3895 91.5 56.9 35 26
Pioneer variety 26R10 91.4 90.4 93.7 57.9 36 27
ARMOR INFERNO 91.3 90.8 94.4 58.6 36 27
ARMOR ARW1516 91.1 55.2 37 25
Dyna-Gro 9522 91.0 89.4 92.7 57.3 37 27
CROPLAN 9101 90.9 57.4 37 25
HILLIARD 90.8 87.1 59.1 38 24
Pioneer variety XW13W 90.8 91.6 59.2 38 27
PROGENY PGX 15-14 90.5 56.7 36 26
PROGENY PGX 15-10 90.1 57.6 39 27
CROPLAN SRW 9415 90.1 58.3 36 27
Pioneer variety 26R59 89.5 57.4 34 26
ARMOR RUMBLE 89.3 57.9 40 27
USG 3197 89.3 56.7 38 25
CROPLAN 9201 89.1 58.3 37 28
BECK 120 88.9 88.7 93.2 55.4 35 25
EXP1060 88.5 57.8 39 26
AgriMAXX Exp. 1674 88.4 56.2 36 26
SS 8700 88.3 88.4 89.9 57.8 39 27
CROPLAN 9203 87.9 58.5 38 27
Dyna-Gro WX15742 87.9 85.2 56.8 38 25
USG 3013 87.6 88.8 92.7 57.6 38 27
BECK 125 87.3 86.6 90.3 58.2 38 27
SYNGENTA VIPER 87.3 59.8 40 24
Equity Brand Butler 87.2 87.9 88.5 58.1 39 28
Pioneer variety 26R53 87.2 84.9 88.5 59.4 35 26
EXP1074 87.2 58.7 37 26
KAS S1200 87.2 86.6 91.4 55.4 36 25
L11419 87.1 57.2 40 25
BECK 128 86.9 88.2 56.8 37 27
STEYER STex142 86.6 85.7 56.6 38 25
SS 8340 86.6 84.6 90.1 59.6 36 26
SC EXP102™ 86.5 58.3 36 26
SYNGENTA SY HARRISON 86.4 56.6 37 27
SYNGENTA SY 547 86.1 86.1 90.2 57.9 39 25
ARMOR ARW1521 86.0 58.2 36 26
PROGENY P 870 85.9 86.1 90.5 55.2 35 26
AgriMAXX 454 85.8 88.0 56.3 37 27
Dyna-Gro 9591 85.7 84.2 88.1 58.5 38 25
KAS S2500 85.5 56.3 37 27
EXP1052 85.5 57.9 39 26
EXP1078 85.3 58.3 39 26
Table 3. 2016 Kentucky Wheat Test - Overall State Summary.*

5
Yield (Bu/A)
Test Wt.(Lb/bu)
Height(In)
Heading Date> April 1
VARIETY 2016 2015-16 2014-16 2016 2016 2016
PROGENY PGX 15-16 85.2 60.4 35 25
BECK 123 84.8 84.6 57.9 39 24
STEYER EVANS 84.7 87.2 56.6 38 27
BECK 114 84.7 59.1 40 26
PEMBROKE 2016 84.6 83.9 86.5 59.1 35 24
AgriMAXX 415 84.5 83.6 87.9 60.0 36 26
SS 8530 84.5 84.5 55.6 38 24
L11425 84.3 57.8 38 25
KAS Liberty IV 84.3 86.9 56.3 36 26
PROGENY P 357 84.2 86.1 90.5 55.3 37 27
SC 1335-15™ 84.1 84.9 89.5 58.2 38 28
STEYER STex155 84.0 58.4 36 26
PROGENY PGX 15-12 84.0 57.3 35 22
ARMOR ARW1551 83.7 60.0 35 25
Dyna-Gro 9600 83.6 83.3 55.6 38 24
ARMOR ARW1513 83.4 56.5 37 27
L11541 83.3 58.5 36 27
Dyna-Gro 9692 83.1 86.6 56.1 37 27
SC 1315-15™ 83.1 83.4 58.5 38 25
SYNGENTA SY 483 83.0 86.9 91.0 57.9 38 28
STEYER STex141 82.8 56.3 37 27
EXP1083 82.5 62.0 36 28
Dyna-Gro WX16771 82.4 58.0 36 26
SYNGENTA BRANSON 82.2 83.1 57.1 36 25
SC EXP142™ 82.1 56.8 38 25
EXP1081 81.8 57.3 41 28
KY06C-1178-16-10-3 81.7 58.3 39 26
AgriMAXX 452 81.6 58.7 39 26
EXP DEI 16098 81.5 57.0 40 28
VA 12W-72 81.3 58.6 36 22
KAS Lowery 81.1 83.4 57.8 40 28
AgriMAXX Exp. 1670 80.9 60.2 39 24
SC 13S26™ 80.8 56.1 38 27
Pioneer variety 25R32 80.8 81.7 85.1 59.1 38 28
PROGENY P 243 80.7 57.7 39 24
AgriMAXX 490 80.7 59.3 39 23
SC 1325-15™ 80.6 81.7 88.4 56.6 36 25
STEYER MORRIN 80.6 85.2 57.8 38 28
SS 8513 80.3 80.2 58.5 38 21
TN1102 79.1 55.6 39 22
SYNGENTA SY 007 78.9 79.9 84.4 57.3 37 22
PEMBROKE 2014 78.5 79.9 84.4 58.9 35 22
Ag 2650 78.2 58.3 40 25
Truman 75.9 78.4 82.0 57.9 41 32
PEMBROKE 2008 75.8 78.3 82.5 58.0 36 21
EXP1053 75.4 57.8 38 22
EXP1072 73.2 58.2 36 20
AVERAGE 85.4 86.1 90.2 57.7 37 26
C.V. 7.6 7.7 7.7
LSD (0.10) 4.0 7.6 6.4
* Summary of seven tests - (Caldwell, Woodford, Logan, Union, Trigg, Ballard, Fayette Co.).
Table 3 (continued)

6
VARIETY
DM Yield* at Soft Dough StageTons/acre Head
Type2016 2015-16 2014-16L11541 4.31 Smooth
SC 13S26™ 4.28 Bearded
BECK 125 4.05 3.72 4.31 Bearded
ARMOR ARW1513 3.98 Bearded
CROPLAN 9101 3.97 Bearded
Pioneer variety 26R10 3.86 3.82 4.17 Bearded
EXP1083 3.84 Smooth
EXP1060 3.83 Smooth
AgriMAXX 454 3.80 3.72 Bearded
EXP1078 3.80 Bearded
AgriMAXX 490 3.78 Bearded
USG 3404 3.73 3.52 3.77 Bearded
HILLIARD 3.71 3.42 Bearded
PEMBROKE 2016 3.70 3.63 3.72 Bearded
SS 8340 3.67 3.65 4.02 Bearded
SS 8700 3.65 3.67 3.99 Bearded
CROPLAN SRW 9415 3.63 Bearded
Pioneer variety 26R41 3.62 3.36 3.86 Bearded
AgriMAXX 415 3.60 3.56 3.79 Bearded
AgriMAXX 438 3.59 3.61 4.23 Smooth
SC 1335-15™ 3.58 3.50 3.75 Bearded
Dyna-Gro 9223 3.57 3.63 4.08 Smooth
CROPLAN 9201 3.56 Bearded
PROGENY PGX 15-14 3.56 Tip-Awned
STEYER STex141 3.56 Bearded
STEYER STex142 3.56 3.42 Bearded
SS 8513 3.55 3.33 Tip-Awned
Dyna-Gro 9692 3.54 3.55 Bearded
L11425 3.53 Smooth
Pioneer variety 26R53 3.53 3.32 3.71 Bearded
BECK 128 3.52 3.47 Bearded
ARMOR INFERNO 3.51 3.40 3.82 Bearded
ARMOR ARW1551 3.50 Smooth
EXP1074 3.50 Bearded
KAS S2500 3.50 Bearded
ARMOR ARW1516 3.49 Bearded
EXP1052 3.47 Bearded
VA 12W-72 3.47 Bearded
AgriMAXX 463 3.42 Smooth
BECK 123 3.42 3.41 Bearded
L11419 3.42 Smooth
SC 1325-15™ 3.42 3.31 3.72 Bearded
SYNGENTA SY 483 3.42 3.46 4.16 Smooth
USG 3895 3.42 Bearded
SYNGENTA SY HARRISON 3.41 Bearded
BECK 114 3.40 Smooth
STEYER STex155 3.40 Bearded
PROGENY PGX 15-16 3.39 Smooth
Equity Brand Butler 3.35 3.46 3.83 Smooth
STEYER EVANS 3.35 3.43 Bearded
USG 3013 3.35 3.49 3.96 Smooth
VARIETY
DM Yield* at Soft Dough StageTons/acre Head
Type2016 2015-16 2014-16PEMBROKE 2014 3.34 3.41 3.66 Bearded
SYNGENTA SY 547 3.34 3.37 3.96 Smooth
BECK 120 3.33 3.42 3.85 Bearded
TN1102 3.32 Bearded
USG 3197 3.32 Bearded
SC EXP142™ 3.30 Bearded
AgriMAXX Exp. 1670 3.29 Smooth
SS 8360 3.29 3.28 3.91 Bearded
AgriMAXX 446 3.28 3.70 4.03 Bearded
PEMBROKE 2008 3.28 3.11 3.60 Bearded
Dyna-Gro 9522 3.27 3.50 4.14 Bearded
KAS Liberty IV 3.27 3.32 Bearded
SS 8530 3.26 3.26 Bearded
SC EXP102™ 3.24 Bearded
ARMOR ARW1521 3.22 Bearded
Pioneer variety 25R32 3.22 3.22 3.32 Bearded
Dyna-Gro 9591 3.21 3.21 3.59 Bearded
KY06C-1178-16-10-3 3.21 Bearded
Ag 2650 3.19 Bearded
Dyna-Gro 9600 3.19 3.21 Bearded
Pioneer variety XW13W 3.19 3.26 Bearded
AgriMAXX 452 3.17 Smooth
PROGENY P 243 3.16 3.17 Bearded
AgriMAXX Exp. 1674 3.14 Smooth
EXP1053 3.13 Smooth
PROGENY PGX 15-10 3.11 Bearded
Dyna-Gro WX15742 3.09 3.05 Bearded
KAS Lowery 3.08 3.22 Smooth
Pioneer variety 26R59 3.08 Tip-Awned
SYNGENTA VIPER 3.07 Smooth
CROPLAN 9203 3.06 Smooth
EXP1072 3.05 Smooth
ARMOR RUMBLE 2.97 Bearded
EXP1081 2.97 Smooth
AgriMAXX 444 2.96 3.14 3.85 Bearded
EXP DEI 16098 2.95 Smooth
SC 1315-15™ 2.94 3.27 Bearded
Dyna-Gro WX16771 2.92 Smooth
KAS S1200 2.91 3.16 3.48 Bearded
PROGENY P 870 2.91 3.28 3.59 Bearded
PROGENY P 357 2.90 3.42 3.87 Bearded
SYNGENTA BRANSON 2.77 2.95 Tip-Awned
PROGENY PGX 15-12 2.75 Smooth
SYNGENTA SY 007 2.73 2.91 3.30 Bearded
Truman 2.69 2.83 3.28 Smooth
STEYER MORRIN 2.64 3.25 Smooth
AVERAGE 3.37 3.38 3.82C.V. 13.71 12.06 13.67
LSD (0.10) 0.77 0.48 0.47
Location: Bluegrass Region - Fayette Co.; Conventional tillagePlanting date: 10-9-15Harvest date: 5-23-16*DM=Dry Matter Yield
Table 4. 2016 Kentucky Wheat Forage Test.

7
VARIETY
DM Yield*Tons/acre
2016 2015-16 2014-16
CROPLAN 9201 3.01
EXP DEI 16098 2.87
ARMOR ARW1516 2.62
SC 13S26™ 2.60
SC 1335-15™ 2.58 1.77 1.67
Ag 2650 2.56
ARMOR ARW1513 2.52
L11541 2.51
L11419 2.47
HILLIARD 2.45 1.77
ARMOR RUMBLE 2.42
Dyna-Gro 9522 2.41 1.59 1.53
KAS Lowery 2.40 1.75
BECK 114 2.35
PROGENY PGX 15-10 2.35
KAS S2500 2.34
SS 8700 2.34 1.79 1.61
EXP1081 2.29
AgriMAXX 438 2.27 1.50 1.47
AgriMAXX 452 2.24
Dyna-Gro 9223 2.24 1.65 1.56
VA 12W-72 2.23
EXP1078 2.22
AgriMAXX Exp. 1674 2.21
CROPLAN SRW 9415 2.21
Pioneer variety XW13W 2.19 1.45
STEYER MORRIN 2.19 1.42
Pioneer variety 26R10 2.17 1.37 1.26
STEYER EVANS 2.17 1.37
BECK 123 2.16 1.52
KAS S1200 2.16 1.47 1.34
STEYER STex141 2.16
EXP1083 2.14
Pioneer variety 26R59 2.14
EXP1060 2.12
ARMOR ARW1551 2.10
SS 8530 2.09 1.36
SYNGENTA SY 547 2.09 1.43 1.34
PEMBROKE 2014 2.05 1.57 1.41
Dyna-Gro WX16771 2.04
Pioneer variety 26R41 2.03 1.31 1.20
Truman 2.03 1.70 1.56
SYNGENTA SY 483 2.01 1.59 1.63
BECK 128 2.00 1.39
AgriMAXX 415 1.99 1.44 1.28
SS 8340 1.99 1.53 1.44
ARMOR INFERNO 1.98 1.38 1.34
EXP1052 1.98
Dyna-Gro 9600 1.97 1.29
Dyna-Gro 9692 1.97 1.38
PROGENY P 243 1.97 1.47
SYNGENTA VIPER 1.97
Table 5. 2016 Kentucky Wheat Straw Test.
VARIETY
DM Yield*Tons/acre
2016 2015-16 2014-16AgriMAXX 446 1.96 1.27 1.28
PROGENY PGX 15-16 1.94
SS 8360 1.93 1.43 1.37
USG 3013 1.93 1.45 1.50
AgriMAXX 444 1.90 1.49 1.36
CROPLAN 9101 1.90
Equity Brand Butler 1.89 1.37 1.36
SYNGENTA SY HARRISON 1.89
PROGENY P 870 1.87 1.48 1.38
SS 8513 1.86 1.48
Dyna-Gro WX15742 1.83 1.45
L11425 1.83
KAS Liberty IV 1.80 1.30
SC EXP102™ 1.80
USG 3895 1.79
EXP1053 1.78
Pioneer variety 25R32 1.78 1.13 0.93
USG 3404 1.78 1.35 1.33
Dyna-Gro 9591 1.76 1.36 1.21
SC 1325-15™ 1.76 1.18 1.11
PROGENY PGX 15-14 1.75
EXP1074 1.74
PEMBROKE 2016 1.74 1.36 1.25
BECK 125 1.73 1.10 1.13
PEMBROKE 2008 1.70 1.34 1.23
KY06C-1178-16-10-3 1.67
AgriMAXX 463 1.66
AgriMAXX 454 1.63 1.20
Pioneer variety 26R53 1.63 1.11 1.09
SYNGENTA SY 007 1.62 1.21 1.18
ARMOR ARW1521 1.61
PROGENY P 357 1.59 1.16 1.22
TN1102 1.58
SC EXP142™ 1.57
SC 1315-15™ 1.56 1.44
SYNGENTA BRANSON 1.55 1.14
AgriMAXX Exp. 1670 1.50
BECK 120 1.50 1.20 1.19
AgriMAXX 490 1.47
EXP1072 1.47
USG 3197 1.45
STEYER STex155 1.43
STEYER STex142 1.40 1.03
PROGENY PGX 15-12 1.37
CROPLAN 9203 1.17
AVERAGE 1.99 1.41 1.34C.V. 28.26 28.98 26.03
LSD (0.10) 0.93 0.55 0.38
Location: Bluegrass Region - Fayette Co.; Conventional tillagePlanting date: 10-9-15Harvest date: 6-20-16* Dry Matter straw yield following grain harvest
8
VARIETY
Yield (Bu/A)
Test Wt. (Lb/Bu)
Height(In)
Heading Date> April 1
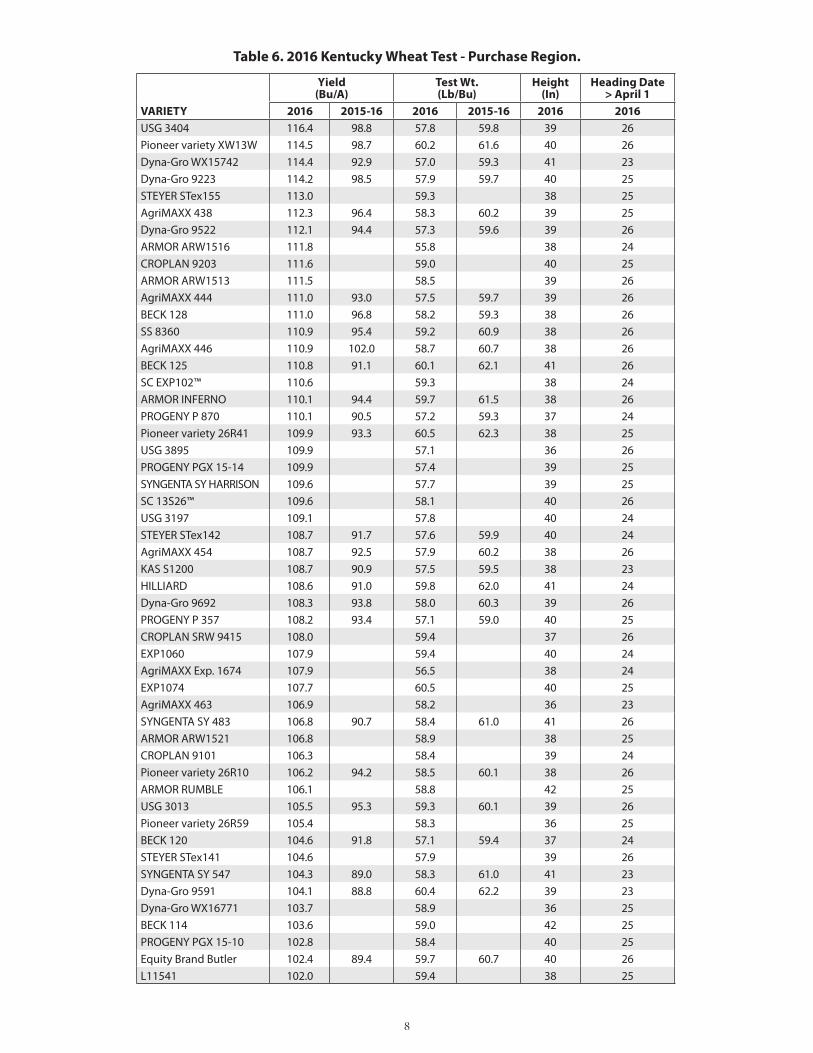
2016 2015-16 2016 2015-16 2016 2016USG 3404 116.4 98.8 57.8 59.8 39 26
Pioneer variety XW13W 114.5 98.7 60.2 61.6 40 26
Dyna-Gro WX15742 114.4 92.9 57.0 59.3 41 23
Dyna-Gro 9223 114.2 98.5 57.9 59.7 40 25
STEYER STex155 113.0 59.3 38 25
AgriMAXX 438 112.3 96.4 58.3 60.2 39 25
Dyna-Gro 9522 112.1 94.4 57.3 59.6 39 26
ARMOR ARW1516 111.8 55.8 38 24
CROPLAN 9203 111.6 59.0 40 25
ARMOR ARW1513 111.5 58.5 39 26
AgriMAXX 444 111.0 93.0 57.5 59.7 39 26
BECK 128 111.0 96.8 58.2 59.3 38 26
SS 8360 110.9 95.4 59.2 60.9 38 26
AgriMAXX 446 110.9 102.0 58.7 60.7 38 26
BECK 125 110.8 91.1 60.1 62.1 41 26
SC EXP102™ 110.6 59.3 38 24
ARMOR INFERNO 110.1 94.4 59.7 61.5 38 26
PROGENY P 870 110.1 90.5 57.2 59.3 37 24
Pioneer variety 26R41 109.9 93.3 60.5 62.3 38 25
USG 3895 109.9 57.1 36 26
PROGENY PGX 15-14 109.9 57.4 39 25
SYNGENTA SY HARRISON 109.6 57.7 39 25
SC 13S26™ 109.6 58.1 40 26
USG 3197 109.1 57.8 40 24
STEYER STex142 108.7 91.7 57.6 59.9 40 24
AgriMAXX 454 108.7 92.5 57.9 60.2 38 26
KAS S1200 108.7 90.9 57.5 59.5 38 23
HILLIARD 108.6 91.0 59.8 62.0 41 24
Dyna-Gro 9692 108.3 93.8 58.0 60.3 39 26
PROGENY P 357 108.2 93.4 57.1 59.0 40 25
CROPLAN SRW 9415 108.0 59.4 37 26
EXP1060 107.9 59.4 40 24
AgriMAXX Exp. 1674 107.9 56.5 38 24
EXP1074 107.7 60.5 40 25
AgriMAXX 463 106.9 58.2 36 23
SYNGENTA SY 483 106.8 90.7 58.4 61.0 41 26
ARMOR ARW1521 106.8 58.9 38 25
CROPLAN 9101 106.3 58.4 39 24
Pioneer variety 26R10 106.2 94.2 58.5 60.1 38 26
ARMOR RUMBLE 106.1 58.8 42 25
USG 3013 105.5 95.3 59.3 60.1 39 26
Pioneer variety 26R59 105.4 58.3 36 25
BECK 120 104.6 91.8 57.1 59.4 37 24
STEYER STex141 104.6 57.9 39 26
SYNGENTA SY 547 104.3 89.0 58.3 61.0 41 23
Dyna-Gro 9591 104.1 88.8 60.4 62.2 39 23
Dyna-Gro WX16771 103.7 58.9 36 25
BECK 114 103.6 59.0 42 25
PROGENY PGX 15-10 102.8 58.4 40 25
Equity Brand Butler 102.4 89.4 59.7 60.7 40 26
L11541 102.0 59.4 38 25
Table 6. 2016 Kentucky Wheat Test - Purchase Region.
9
VARIETY
Yield (Bu/A)
Test Wt. (Lb/Bu)
Height(In)
Heading Date> April 1
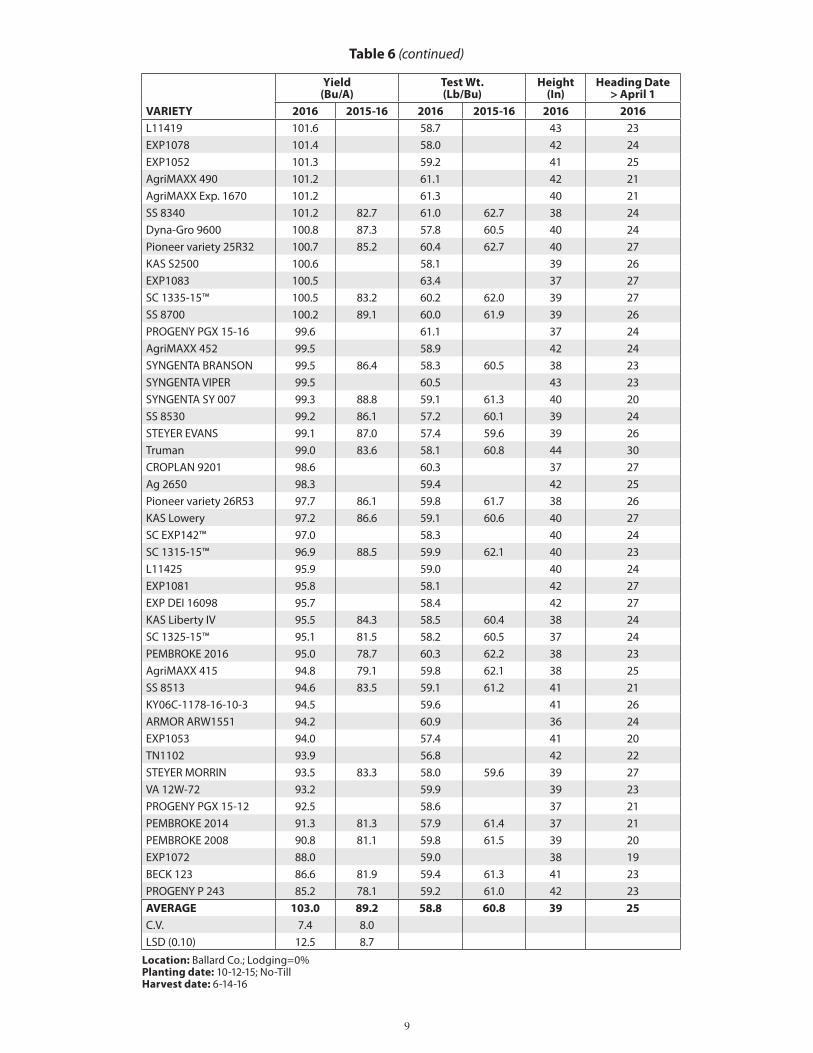
2016 2015-16 2016 2015-16 2016 2016L11419 101.6 58.7 43 23
EXP1078 101.4 58.0 42 24
EXP1052 101.3 59.2 41 25
AgriMAXX 490 101.2 61.1 42 21
AgriMAXX Exp. 1670 101.2 61.3 40 21
SS 8340 101.2 82.7 61.0 62.7 38 24
Dyna-Gro 9600 100.8 87.3 57.8 60.5 40 24
Pioneer variety 25R32 100.7 85.2 60.4 62.7 40 27
KAS S2500 100.6 58.1 39 26
EXP1083 100.5 63.4 37 27
SC 1335-15™ 100.5 83.2 60.2 62.0 39 27
SS 8700 100.2 89.1 60.0 61.9 39 26
PROGENY PGX 15-16 99.6 61.1 37 24
AgriMAXX 452 99.5 58.9 42 24
SYNGENTA BRANSON 99.5 86.4 58.3 60.5 38 23
SYNGENTA VIPER 99.5 60.5 43 23
SYNGENTA SY 007 99.3 88.8 59.1 61.3 40 20
SS 8530 99.2 86.1 57.2 60.1 39 24
STEYER EVANS 99.1 87.0 57.4 59.6 39 26
Truman 99.0 83.6 58.1 60.8 44 30
CROPLAN 9201 98.6 60.3 37 27
Ag 2650 98.3 59.4 42 25
Pioneer variety 26R53 97.7 86.1 59.8 61.7 38 26
KAS Lowery 97.2 86.6 59.1 60.6 40 27
SC EXP142™ 97.0 58.3 40 24
SC 1315-15™ 96.9 88.5 59.9 62.1 40 23
L11425 95.9 59.0 40 24
EXP1081 95.8 58.1 42 27
EXP DEI 16098 95.7 58.4 42 27
KAS Liberty IV 95.5 84.3 58.5 60.4 38 24
SC 1325-15™ 95.1 81.5 58.2 60.5 37 24
PEMBROKE 2016 95.0 78.7 60.3 62.2 38 23
AgriMAXX 415 94.8 79.1 59.8 62.1 38 25
SS 8513 94.6 83.5 59.1 61.2 41 21
KY06C-1178-16-10-3 94.5 59.6 41 26
ARMOR ARW1551 94.2 60.9 36 24
EXP1053 94.0 57.4 41 20
TN1102 93.9 56.8 42 22
STEYER MORRIN 93.5 83.3 58.0 59.6 39 27
VA 12W-72 93.2 59.9 39 23
PROGENY PGX 15-12 92.5 58.6 37 21
PEMBROKE 2014 91.3 81.3 57.9 61.4 37 21
PEMBROKE 2008 90.8 81.1 59.8 61.5 39 20
EXP1072 88.0 59.0 38 19
BECK 123 86.6 81.9 59.4 61.3 41 23
PROGENY P 243 85.2 78.1 59.2 61.0 42 23
AVERAGE 103.0 89.2 58.8 60.8 39 25C.V. 7.4 8.0
LSD (0.10) 12.5 8.7
Location: Ballard Co.; Lodging=0%Planting date: 10-12-15; No-TillHarvest date: 6-14-16
Table 6 (continued)

10
VARIETY
Yield (Bu/A)
Test Wt. (Lb/Bu)
Height(In)
Heading Date> April 1
2016 2015-16 2016 2015-16 2016 2016Equity Brand Butler 96.5 92.7 57.4 58.7 40 25
EXP1060 96.4 56.5 40 23
ARMOR RUMBLE 96.0 56.8 42 23
ARMOR ARW1513 92.8 56.3 39 25
KAS S2500 92.5 57.2 40 25
SS 8700 92.5 95.1 57.1 59.8 41 25
CROPLAN SRW 9415 92.4 58.4 38 25
PROGENY PGX 15-10 92.1 56.0 42 25
USG 3895 91.8 56.1 36 25
AgriMAXX 446 91.6 89.3 58.2 60.3 38 25
Dyna-Gro 9223 91.5 89.5 56.7 58.8 41 25
SYNGENTA SY 547 91.5 91.9 57.1 60.1 42 21
Pioneer variety XW13W 91.5 86.7 58.7 60.9 40 25
SYNGENTA SY 483 91.4 93.1 57.4 59.6 42 25
AgriMAXX 438 91.3 90.8 56.0 58.8 39 24
SS 8360 91.1 89.9 58.3 60.5 37 25
PROGENY PGX 15-14 90.7 56.5 37 23
AgriMAXX 463 90.2 55.0 36 22
USG 3404 90.2 90.7 56.1 59.1 39 25
HILLIARD 90.0 86.2 58.6 60.8 40 22
CROPLAN 9101 90.0 57.1 38 22
BECK 128 89.9 91.1 57.6 59.8 40 24
USG 3197 89.8 56.8 41 22
Dyna-Gro 9692 89.8 89.7 57.2 59.5 40 24
Pioneer variety 26R10 89.6 89.7 57.4 60.2 37 25
Pioneer variety 25R32 89.5 88.0 57.9 60.8 40 26
L11425 89.5 57.4 40 23
EXP1083 89.3 62.2 37 25
EXP1074 89.2 58.9 40 24
SC 1335-15™ 89.1 88.3 57.2 60.4 41 25
Dyna-Gro 9522 89.1 87.8 57.3 59.6 41 25
BECK 114 88.8 58.7 43 23
STEYER EVANS 88.8 90.8 56.4 59.2 39 25
Pioneer variety 26R59 88.5 58.1 35 23
Dyna-Gro WX15742 88.4 87.5 56.4 58.8 40 22
BECK 120 88.4 86.7 54.8 58.1 37 22
STEYER STex141 88.4 56.2 39 25
SC EXP142™ 88.0 56.4 41 22
KAS Liberty IV 87.8 90.9 55.8 58.9 39 23
SYNGENTA VIPER 87.8 59.2 41 23
ARMOR ARW1521 87.7 56.3 38 22
SYNGENTA SY HARRISON 87.7 56.9 39 24
USG 3013 87.6 87.3 57.5 59.5 41 25
SC 13S26™ 87.5 57.2 40 24
STEYER MORRIN 87.3 84.9 57.5 58.8 40 25
EXP DEI 16098 87.2 57.4 43 25
EXP1081 86.9 56.7 43 25
CROPLAN 9201 86.9 58.4 38 26
ARMOR ARW1516 86.7 54.3 38 22
SC 1315-15™ 86.4 84.5 58.9 61.4 42 21
ARMOR INFERNO 86.4 87.5 57.5 59.7 37 25
STEYER STex142 86.3 89.2 55.9 58.8 40 22
Table 7. 2016 Kentucky Wheat Test - Western Coal Field Region.

11
VARIETY
Yield (Bu/A)
Test Wt. (Lb/Bu)
Height(In)
Heading Date> April 1
2016 2015-16 2016 2015-16 2016 2016BECK 125 85.9 85.9 57.2 60.2 39 25
Dyna-Gro 9600 85.8 88.2 57.6 59.7 41 22
SS 8530 85.7 85.5 56.9 59.4 41 22
AgriMAXX 454 85.6 88.8 56.9 59.5 39 24
L11419 85.6 56.5 43 22
CROPLAN 9203 85.6 58.5 40 24
KAS S1200 85.5 84.2 54.6 57.8 38 22
PROGENY P 870 85.3 84.1 55.3 58.2 36 23
SC EXP102™ 85.3 58.0 37 22
TN1102 85.2 55.3 42 20
PROGENY P 357 84.9 87.3 55.0 57.7 39 24
SC 1325-15™ 84.6 84.7 56.4 59.2 37 23
L11541 84.3 58.8 37 24
AgriMAXX 444 84.1 89.3 55.0 58.7 38 24
SYNGENTA SY 007 83.8 80.7 57.4 59.8 40 18
Pioneer variety 26R41 83.8 84.4 58.2 61.1 36 24
PROGENY PGX 15-16 83.3 58.7 36 23
Dyna-Gro WX16771 83.2 57.3 37 22
PROGENY PGX 15-12 83.1 57.1 37 19
AgriMAXX 415 83.0 84.4 59.9 62.0 38 24
Ag 2650 83.0 58.1 42 24
STEYER STex155 82.6 57.7 36 22
KAS Lowery 82.5 84.7 57.3 59.3 40 26
AgriMAXX 452 82.4 58.4 42 23
SYNGENTA BRANSON 82.4 86.9 56.9 59.4 39 21
Dyna-Gro 9591 82.2 83.0 58.1 60.7 40 21
AgriMAXX Exp. 1674 82.1 56.0 37 23
EXP1053 81.8 57.2 41 19
KY06C-1178-16-10-3 81.7 57.9 42 24
PEMBROKE 2016 81.7 86.1 59.2 61.5 38 22
AgriMAXX Exp. 1670 81.6 59.0 40 21
PROGENY P 243 80.8 81.2 57.7 60.0 42 21
BECK 123 80.6 80.7 57.2 59.5 42 21
EXP1052 80.5 58.2 39 24
ARMOR ARW1551 80.1 58.2 36 23
Pioneer variety 26R53 79.9 79.7 59.1 61.4 37 24
SS 8513 78.7 82.9 58.6 60.3 42 20
EXP1078 78.3 57.4 41 24
EXP1072 78.2 57.3 39 17
VA 12W-72 77.5 57.4 38 22
PEMBROKE 2008 75.6 79.1 57.6 60.4 38 18
PEMBROKE 2014 75.1 76.9 58.4 61.1 37 21
AgriMAXX 490 74.6 58.2 43 19
Truman 73.0 74.2 56.2 58.0 42 30
AVERAGE 86.2 86.6 57.3 59.7 39 23C.V. 6.1 6.7
LSD (0.10) 8.7 6.8
Location: Caldwell Co. (Princeton, KY); Lodging = 0%Planting date: 10-6-15; No-Till Harvest date: 6-12-16
Table 7 (continued)

12
VARIETY
Yield (Bu/A)
Test Wt. (Lb/bu)
Height(In)
Heading Date> April 1
2016 2015-16 2016 2015-16 2016 2016AgriMAXX 463 113.2 60.7 37 26
CROPLAN 9101 112.2 60.0 38 26
AgriMAXX 438 112.0 100.7 60.2 60.2 40 28
Pioneer variety 26R41 111.4 98.6 60.1 60.1 37 28
L11419 111.0 60.5 43 26
Equity Brand Butler 110.9 99.1 59.2 59.4 40 29
PROGENY PGX 15-14 110.3 59.0 37 27
ARMOR ARW1516 110.2 57.1 37 26
CROPLAN 9203 109.9 60.7 38 28
USG 3895 109.6 57.9 36 28
Pioneer variety 26R10 109.0 98.5 59.6 60.1 37 29
USG 3013 108.7 96.5 60.0 60.1 40 28
PROGENY PGX 15-10 108.1 61.2 40 28
USG 3197 107.9 60.5 39 26
ARMOR RUMBLE 107.8 61.3 40 27
USG 3404 107.7 102.0 59.5 60.0 40 29
BECK 114 107.5 61.6 42 28
AgriMAXX Exp. 1674 107.4 58.1 38 27
EXP1060 107.4 59.6 42 27
CROPLAN 9201 107.3 60.0 37 30
Dyna-Gro 9223 107.1 95.9 59.9 60.2 39 28
AgriMAXX 444 107.0 100.7 59.6 60.4 39 28
Pioneer variety 26R59 107.0 58.3 34 27
SYNGENTA VIPER 106.6 62.6 41 26
KAS S2500 106.5 58.1 38 29
SC EXP102™ 106.5 60.8 37 26
Dyna-Gro WX16771 105.7 60.4 38 27
Dyna-Gro WX15742 105.5 91.8 59.9 59.0 40 27
AgriMAXX 454 105.4 98.4 57.3 59.3 37 29
SS 8360 105.4 95.7 59.7 60.1 38 29
KAS Liberty IV 105.3 98.4 59.1 58.8 39 27
EXP DEI 16098 105.3 57.1 39 29
STEYER STex142 105.2 93.2 59.7 59.2 40 26
ARMOR INFERNO 104.7 94.6 60.3 60.5 37 28
Dyna-Gro 9692 104.6 97.9 57.2 59.3 37 28
L11425 104.4 60.3 39 27
Pioneer variety 26R53 104.3 95.6 61.3 61.7 36 27
Pioneer variety XW13W 104.0 101.6 60.2 60.8 38 29
STEYER STex141 104.0 57.4 39 29
BECK 123 103.7 88.7 60.0 60.1 42 25
AgriMAXX 446 103.7 91.8 59.6 60.1 38 29
ARMOR ARW1521 103.5 61.1 37 27
PROGENY PGX 15-16 103.5 62.7 36 27
SYNGENTA SY HARRISON 102.4 57.7 38 28
ARMOR ARW1551 102.3 62.7 35 26
PROGENY PGX 15-12 102.1 60.4 36 23
SS 8700 102.1 94.7 61.2 60.1 40 28
EXP1052 102.0 59.4 39 28
PEMBROKE 2016 101.9 89.9 61.9 61.3 36 26
PROGENY P 243 101.8 91.3 59.9 60.3 41 25
BECK 128 101.4 96.2 59.6 60.4 38 29
Table 8. 2016 Kentucky Wheat Test - Ohio Valley Region.

13
VARIETY
Yield (Bu/A)
Test Wt. (Lb/bu)
Height(In)
Heading Date> April 1
2016 2015-16 2016 2015-16 2016 2016SS 8513 101.3 88.1 61.1 61.5 41 24
STEYER STex155 101.3 60.8 37 26
AgriMAXX 415 101.3 89.5 62.0 62.2 37 27
BECK 120 100.8 90.5 57.7 57.9 37 26
SS 8340 100.6 94.2 61.2 61.7 37 27
Dyna-Gro 9522 100.5 97.4 59.3 59.9 38 29
SC 13S26™ 100.3 58.2 38 28
EXP1074 100.1 61.7 37 28
CROPLAN SRW 9415 100.1 60.2 37 28
SYNGENTA BRANSON 99.6 88.8 59.5 60.2 39 25
HILLIARD 99.4 91.3 60.4 60.8 40 26
Dyna-Gro 9591 99.0 88.3 60.7 60.8 38 26
EXP1078 98.9 60.6 41 28
AgriMAXX Exp. 1670 98.7 63.0 41 25
SC EXP142™ 98.5 59.4 39 26
AgriMAXX 452 98.2 62.1 40 27
BECK 125 98.0 92.9 59.5 60.2 39 29
SYNGENTA SY 483 97.8 93.5 61.2 60.6 38 29
KAS S1200 97.6 90.3 58.7 58.6 35 27
PROGENY P 357 97.6 93.4 57.6 58.3 37 28
SYNGENTA SY 547 97.4 86.5 59.9 60.4 41 25
PROGENY P 870 97.4 90.9 56.9 57.8 36 27
STEYER EVANS 97.2 97.2 59.3 59.8 39 29
KAS Lowery 96.9 91.7 59.3 60.7 41 30
AgriMAXX 490 96.6 62.5 40 23
ARMOR ARW1513 96.6 57.4 37 28
STEYER MORRIN 96.5 94.6 60.0 60.1 38 29
VA 12W-72 95.8 61.5 37 25
SC 1325-15™ 95.5 86.1 58.9 59.2 37 27
Pioneer variety 25R32 95.3 91.1 61.5 61.3 38 30
Truman 95.1 91.6 62.4 61.5 43 33
SC 1335-15™ 95.0 91.4 60.2 60.5 39 29
SC 1315-15™ 94.8 82.9 59.9 59.9 39 26
SS 8530 93.9 87.3 56.8 58.1 39 26
KY06C-1178-16-10-3 93.7 60.0 40 27
Ag 2650 93.7 59.5 43 27
Dyna-Gro 9600 92.8 85.9 56.7 57.9 38 25
L11541 90.6 59.6 34 28
PEMBROKE 2008 90.6 83.3 60.3 61.1 38 23
EXP1081 90.1 58.8 43 29
SYNGENTA SY 007 90.0 83.3 58.4 59.3 39 23
EXP1053 89.9 62.1 39 23
PEMBROKE 2014 89.6 83.2 61.9 61.7 35 24
TN1102 88.4 58.2 41 24
EXP1083 86.0 62.2 36 29
EXP1072 80.4 61.2 38 21
AVERAGE 101.4 92.7 59.9 60.1 38 27C.V. 6.7 6.7
LSD (0.10) 11.1 7.4Location: Union Co.; Lodging = 0%Planting date: 10-7-15; No-Till Harvest date: 6-13-16
Table 8 (continued)

14
VARIETY
Yield (Bu/A)
Test Wt. (Lb/bu)
Height(In)
Heading Date> April 1
2016 2015-16 2016 2015-16 2016 2016CROPLAN 9201 78.7 57.8 34 32
ARMOR ARW1516 76.0 54.3 32 28
AgriMAXX Exp. 1674 75.7 55.4 33 30
HILLIARD 73.3 72.6 57.3 57.9 34 28
ARMOR INFERNO 72.9 75.1 56.0 56.9 32 31
EXP1060 72.7 56.7 33 29
EXP1052 72.1 55.7 34 29
AgriMAXX 438 71.2 76.6 55.8 56.2 34 31
AgriMAXX 446 71.0 74.1 55.4 56.4 32 32
Dyna-Gro 9591 71.0 72.3 57.1 57.1 32 29
Pioneer variety 26R10 70.5 74.6 56.5 56.9 31 31
USG 3404 70.0 73.8 56.0 56.9 33 32
USG 3895 70.0 54.7 30 30
PROGENY PGX 15-10 69.9 55.3 35 30
SS 8700 69.1 72.5 57.0 56.2 34 31
Dyna-Gro 9223 69.0 71.6 56.0 56.5 33 31
Pioneer variety 26R59 68.9 56.0 28 30
AgriMAXX 463 68.8 54.4 29 28
BECK 128 68.8 72.5 55.8 56.6 32 32
SS 8360 68.8 71.0 55.8 56.7 30 32
Dyna-Gro 9522 68.8 72.7 55.5 56.6 32 32
AgriMAXX 444 67.7 72.4 54.8 56.2 31 32
CROPLAN SRW 9415 67.6 55.7 32 32
AgriMAXX 415 67.4 70.9 58.4 59.0 31 30
BECK 114 67.3 57.7 35 30
AgriMAXX 454 66.9 74.0 55.4 56.7 32 31
BECK 125 66.2 69.9 56.6 56.5 33 31
ARMOR ARW1513 66.1 55.1 32 31
EXP1074 66.0 56.1 31 30
CROPLAN 9101 65.9 55.1 31 30
ARMOR RUMBLE 65.8 55.4 36 31
EXP1078 65.8 56.6 35 30
PROGENY PGX 15-14 65.8 55.4 31 30
BECK 120 65.6 72.6 53.3 54.7 30 30
Pioneer variety 26R41 65.5 68.0 55.8 56.2 29 30
SC EXP102™ 65.0 56.5 32 30
CROPLAN 9203 65.0 56.4 33 31
SYNGENTA SY 547 65.0 71.5 56.4 57.4 33 29
SYNGENTA VIPER 64.6 57.9 34 26
SC 1315-15™ 64.5 67.7 57.0 57.2 31 29
SS 8340 64.4 68.7 57.7 58.6 31 30
EXP1081 63.9 57.3 37 31
KAS S2500 63.7 55.5 32 31
AgriMAXX 452 63.5 57.6 33 30
ARMOR ARW1551 63.3 59.2 29 29
Pioneer variety 26R53 63.2 66.7 56.4 57.7 29 29
L11541 63.1 57.1 31 30
AgriMAXX Exp. 1670 62.5 58.9 33 27
EXP1083 62.4 61.1 31 31
Pioneer variety XW13W 62.3 71.1 57.1 57.3 32 31
BECK 123 62.1 66.9 54.9 56.1 33 29
Table 9. 2016 Kentucky Wheat Test - Bluegrass Region.

15
Table 9 (continued)
VARIETY
Yield (Bu/A)
Test Wt. (Lb/bu)
Height(In)
Heading Date> April 1
2016 2015-16 2016 2015-16 2016 2016ARMOR ARW1521 62.1 56.4 31 29
AgriMAXX 490 62.1 57.1 33 26
STEYER STex141 61.1 55.7 30 31
Dyna-Gro 9692 61.0 68.0 55.7 56.5 30 31
SYNGENTA SY HARRISON 61.0 55.1 30 31
KAS S1200 60.7 68.8 52.6 54.4 30 30
USG 3013 60.5 67.9 55.1 56.1 32 31
PEMBROKE 2016 60.1 64.0 55.8 56.5 28 27
STEYER EVANS 59.9 70.4 55.1 56.5 32 31
STEYER STex142 59.5 65.8 52.9 54.5 32 28
VA 12W-72 59.2 56.8 31 26
KAS Liberty IV 59.1 65.2 53.0 54.1 29 30
L11419 59.1 54.8 34 29
SC 1335-15™ 59.1 67.2 56.7 56.9 33 31
KAS Lowery 58.6 62.9 56.5 57.6 36 31
PROGENY P 243 58.3 67.2 54.1 55.9 31 28
PROGENY P 357 58.0 67.3 54.1 54.9 31 31
SC EXP142™ 57.7 53.9 31 29
STEYER MORRIN 57.7 72.0 55.7 57.1 33 32
Truman 57.3 62.7 56.5 58.0 36 35
Dyna-Gro 9600 57.1 60.5 51.1 53.5 31 28
SYNGENTA BRANSON 57.0 64.7 55.0 55.8 31 29
L11425 56.6 55.0 31 30
PROGENY PGX 15-16 56.3 58.4 29 29
USG 3197 56.0 53.1 31 28
SC 13S26™ 55.4 54.4 32 31
Dyna-Gro WX15742 55.3 62.4 53.7 54.3 31 29
Ag 2650 55.1 56.6 35 28
EXP DEI 16098 55.1 55.1 36 32
PROGENY P 870 55.0 66.7 52.5 54.0 29 30
Pioneer variety 25R32 55.0 61.0 58.3 57.9 32 31
SC 1325-15™ 55.0 64.7 54.0 55.1 31 29
Equity Brand Butler 54.8 65.3 56.5 56.9 35 32
SS 8530 54.3 63.1 52.9 54.9 30 27
KY06C-1178-16-10-3 54.1 55.6 31 30
STEYER STex155 53.9 56.4 29 30
PEMBROKE 2014 53.0 60.4 56.2 57.2 27 26
EXP1072 53.0 55.6 29 25
PROGENY PGX 15-12 52.8 54.3 27 26
SS 8513 52.2 62.3 56.5 57.7 30 25
TN1102 51.4 53.2 32 26
SYNGENTA SY 483 50.9 64.9 55.6 56.5 31 32
Dyna-Gro WX16771 50.7 56.1 30 30
SYNGENTA SY 007 47.8 57.9 54.4 56.0 30 26
EXP1053 47.2 54.8 30 27
PEMBROKE 2008 46.2 58.6 54.3 56.7 30 26
AVERAGE 62.1 68.0 55.7 56.4 32 30C.V. 9.7 8.5
LSD (0.10) 9.9 6.5Location: Fayette Co. (Lexington, KY); Lodging = 0%Planting date: 10-9-15; Conventional tillageHarvest date: 6-20-16

16
VARIETY
Yield (Bu/A)
Test Wt. (Lb/bu)
Lodging(%)
Height(In)
Heading Date> April 1
2016 2015-16 2016 2015-16 2016 2016 2016PROGENY PGX 15-12 90.7 57.1 0 38 19
SS 8340 90.2 97.0 59.4 61.3 0 37 23
Pioneer variety 26R41 88.6 98.1 58.1 60.1 0 40 23
AgriMAXX 463 88.5 55.7 0 39 22
PROGENY PGX 15-14 87.8 56.0 0 38 23
USG 3197 87.2 57.2 0 39 22
HILLIARD 86.2 96.6 59.6 60.8 0 42 21
SS 8513 85.8 90.4 58.5 59.4 11 40 18
VA 12W-72 85.6 58.3 0 39 19
TN1102 85.2 55.8 15 41 20
ARMOR ARW1516 85.2 54.8 0 39 22
Pioneer variety XW13W 85.1 101.7 59.8 61.2 0 39 24
Dyna-Gro WX15742 84.8 92.7 57.7 59.0 0 40 22
STEYER STex142 84.6 93.7 57.1 58.5 0 39 22
EXP1078 83.5 59.0 3 39 22
USG 3404 82.8 93.5 57.0 58.8 0 40 25
USG 3895 82.7 58.0 0 39 22
ARMOR ARW1521 82.1 57.9 0 38 23
CROPLAN 9101 81.7 57.0 0 38 22
SC EXP102™ 80.7 57.1 0 38 22
ARMOR RUMBLE 80.5 57.4 0 39 23
PROGENY P 870 79.7 94.1 54.2 56.7 0 39 23
SYNGENTA BRANSON 79.7 91.3 56.4 58.9 0 37 21
Equity Brand Butler 79.6 91.8 57.1 58.1 0 41 25
SS 8360 79.5 97.8 57.7 59.8 0 38 24
AgriMAXX 444 79.3 93.0 57.3 59.0 0 38 24
AgriMAXX 415 79.2 97.5 59.9 61.5 0 35 23
SS 8530 79.1 95.7 55.1 57.6 0 39 21
Dyna-Gro 9522 79.0 94.7 56.9 58.8 0 38 24
KAS S1200 79.0 91.8 54.4 56.5 0 39 22
PROGENY PGX 15-16 78.9 60.3 0 38 22
BECK 123 78.2 93.9 58.3 59.7 0 39 21
SYNGENTA SY HARRISON 78.1 55.6 0 38 23
BECK 120 77.9 93.2 54.9 57.0 0 37 22
SYNGENTA VIPER 77.8 58.8 0 41 21
Dyna-Gro 9223 77.8 94.5 55.3 58.1 0 37 23
L11541 77.6 58.0 13 40 23
SC 1335-15™ 77.4 93.3 57.3 59.5 0 39 25
Ag 2650 77.2 56.9 0 40 22
STEYER MORRIN 77.0 96.7 56.3 57.8 0 42 25
PEMBROKE 2008 77.0 88.6 58.1 60.0 0 37 17
AgriMAXX 446 76.7 95.4 57.5 59.2 0 38 24
AgriMAXX 438 76.7 97.6 54.0 57.2 0 39 24
PEMBROKE 2014 76.6 89.8 59.7 61.4 0 39 20
EXP1074 76.4 57.4 0 40 23
ARMOR INFERNO 76.4 98.9 58.8 60.3 0 38 23
PROGENY PGX 15-10 76.4 56.8 0 38 23
SC 1315-15™ 76.3 90.8 57.9 60.1 0 40 22
AgriMAXX 490 76.1 58.4 0 41 20
PROGENY P 243 76.0 95.3 57.5 59.6 0 39 22
Pioneer variety 26R53 75.9 89.4 59.5 60.9 0 37 22
Table 10. 2016 Kentucky Wheat Test - Southern Tier Region A.

17
Table 10 (continued)
VARIETY
Yield (Bu/A)
Test Wt. (Lb/bu)
Lodging(%)
Height(In)
Heading Date> April 1
2016 2015-16 2016 2015-16 2016 2016 2016EXP DEI 16098 75.9 56.4 0 39 24
STEYER EVANS 75.8 92.0 56.0 58.4 0 39 24
PEMBROKE 2016 75.7 93.6 58.0 60.1 0 39 21
L11419 75.4 56.0 0 39 22
STEYER STex155 75.3 57.8 0 39 22
Dyna-Gro 9591 75.3 89.8 57.5 60.0 0 40 22
CROPLAN 9203 75.1 57.5 0 37 23
Pioneer variety 26R10 75.0 91.7 57.0 59.3 0 38 24
SC EXP142™ 74.6 57.0 0 39 22
SYNGENTA SY 007 74.6 83.5 56.8 59.0 0 40 19
SYNGENTA SY 547 74.6 87.6 57.5 59.4 0 40 21
ARMOR ARW1551 73.9 58.8 0 39 22
Pioneer variety 26R59 73.5 56.2 0 40 23
SS 8700 73.5 89.6 54.4 57.4 0 40 23
CROPLAN SRW 9415 73.4 57.2 0 37 24
Dyna-Gro WX16771 73.2 57.0 0 40 23
USG 3013 72.9 91.9 56.0 58.0 0 38 23
AgriMAXX Exp. 1674 72.7 55.7 0 38 23
BECK 125 72.6 92.2 56.2 58.7 0 39 24
SC 1325-15™ 71.8 85.6 55.6 57.7 0 37 22
Dyna-Gro 9600 71.5 82.6 54.1 57.0 0 41 21
KY06C-1178-16-10-3 70.7 57.4 1 37 22
EXP1083 70.5 59.9 0 37 25
EXP1052 70.2 57.3 5 41 24
Truman 69.7 83.6 56.0 58.3 0 41 29
EXP1072 69.7 57.7 1 38 17
Pioneer variety 25R32 69.0 85.8 57.1 59.7 0 38 25
CROPLAN 9201 69.0 53.8 0 38 25
KAS Liberty IV 68.8 94.1 54.7 57.6 0 37 22
BECK 128 68.3 89.5 53.7 57.6 0 36 24
SYNGENTA SY 483 68.2 89.2 56.0 58.1 0 39 24
EXP1060 68.0 56.9 13 38 23
KAS Lowery 68.0 89.6 54.4 57.8 3 39 25
L11425 67.4 56.3 4 39 22
PROGENY P 357 67.2 92.6 52.9 55.9 0 38 23
EXP1081 66.9 55.8 15 38 25
KAS S2500 66.8 51.7 0 39 24
Dyna-Gro 9692 66.4 93.1 51.7 56.5 0 38 24
EXP1053 66.3 57.0 1 38 19
STEYER STex141 66.1 52.6 0 39 24
BECK 114 66.0 57.3 0 39 23
ARMOR ARW1513 66.0 55.3 0 40 24
SC 13S26™ 65.9 51.4 0 40 24
AgriMAXX 452 65.4 56.1 0 39 23
AgriMAXX 454 63.5 91.0 52.6 55.8 0 38 24
AgriMAXX Exp. 1670 63.1 58.8 1 39 21
AVERAGE 75.9 92.3 56.7 58.8 1 39 23C.V. 9.8 9.0
LSD (0.10) 12.3 9.1
Location: Logan Co.Planting date: 10-14-15; Conventional tillageHarvest date: 6-13-16

18
VARIETY
Yield (Bu/A)
Test Wt. (Lb/bu)
Lodging(%)
Height(In)
Heading Date> April 1
2016 2015-16 2016 2015-16 2016 2016 2016CROPLAN SRW 9415 106.9 61.1 0 38 26
AgriMAXX 438 104.1 103.6 59.6 59.5 0 41 26
USG 3895 103.4 59.0 0 36 23
USG 3197 103.0 58.2 1 40 24
KAS Liberty IV 102.5 102.2 58.9 57.5 4 39 24
AgriMAXX 444 102.4 104.8 58.3 58.5 0 40 26
BECK 123 102.3 103.7 59.2 59.0 1 41 23
Pioneer variety 26R53 102.3 100.7 61.5 60.8 0 37 24
Pioneer variety XW13W 102.2 105.7 61.2 60.0 0 40 25
L11419 102.0 58.4 1 42 24
Dyna-Gro 9223 101.9 101.5 58.7 58.3 6 40 25
USG 3404 101.6 102.9 58.1 58.2 0 40 26
Pioneer variety 26R10 101.4 101.6 58.8 58.5 0 38 26
USG 3013 101.4 103.9 59.3 59.2 10 41 26
ARMOR ARW1516 101.2 56.7 0 37 24
SS 8360 101.0 105.7 60.2 59.8 9 38 26
BECK 120 100.8 104.6 57.3 56.2 0 37 24
CROPLAN 9203 100.5 59.4 0 40 25
SYNGENTA SY 547 100.5 102.3 60.0 59.3 0 41 24
PROGENY PGX 15-14 100.5 58.3 0 36 25
SC EXP142™ 100.5 60.0 0 41 23
SYNGENTA BRANSON 99.6 97.9 59.4 58.2 0 38 24
KAS S2500 99.4 58.2 0 40 25
Dyna-Gro WX15742 99.2 101.5 59.5 58.0 5 40 24
SYNGENTA SY HARRISON 99.2 58.3 0 38 26
SYNGENTA SY 483 98.8 104.0 60.0 58.9 0 40 27
AgriMAXX 454 98.8 100.8 58.3 58.6 0 40 26
AgriMAXX 446 98.6 105.8 59.9 59.5 0 37 26
Pioneer variety 26R41 98.5 97.5 60.6 59.0 0 37 25
PROGENY P 357 98.4 92.6 56.6 54.7 0 38 25
Dyna-Gro 9522 98.3 96.6 58.7 57.7 0 39 26
AgriMAXX 463 98.3 59.9 0 37 23
SS 8530 98.3 97.5 56.7 56.8 15 39 22
Dyna-Gro 9600 98.1 100.3 57.7 57.1 5 40 23
L11541 98.1 59.6 6 36 25
KY06C-1178-16-10-3 98.0 60.6 0 43 24
ARMOR RUMBLE 98.0 58.8 1 42 25
SC 1315-15™ 97.9 101.4 60.6 60.1 0 40 24
Equity Brand Butler 97.5 102.1 59.8 59.3 0 41 26
SYNGENTA VIPER 97.5 61.0 4 42 22
ARMOR INFERNO 97.4 101.5 59.9 59.4 0 39 25
PROGENY PGX 15-10 97.0 58.9 0 41 25
SC 1335-15™ 96.8 99.3 60.2 59.6 0 40 26
Dyna-Gro 9591 96.8 96.2 59.6 59.2 13 40 24
SYNGENTA SY 007 96.7 98.7 60.7 59.5 0 39 22
EXP DEI 16098 96.6 58.4 0 43 26
PROGENY P 870 96.5 99.1 57.8 56.3 0 37 25
KAS S1200 96.4 101.2 57.6 56.6 0 37 24
AgriMAXX Exp. 1674 96.3 57.5 0 36 25
CROPLAN 9201 96.2 60.1 0 38 26
AgriMAXX 452 96.2 60.0 3 41 24
Table 11. 2016 Kentucky Wheat Test - Southern Tier Region B.
19
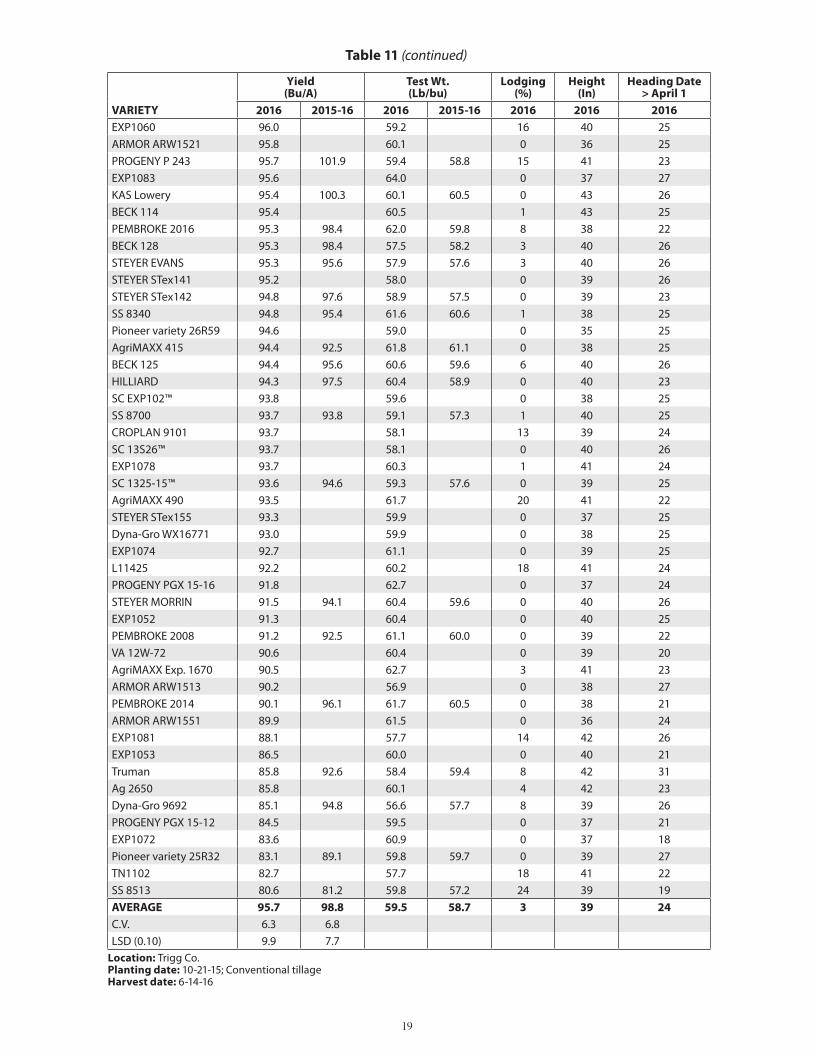
Table 11 (continued)
VARIETY
Yield (Bu/A)
Test Wt. (Lb/bu)
Lodging(%)
Height(In)
Heading Date> April 1
2016 2015-16 2016 2015-16 2016 2016 2016EXP1060 96.0 59.2 16 40 25
ARMOR ARW1521 95.8 60.1 0 36 25
PROGENY P 243 95.7 101.9 59.4 58.8 15 41 23
EXP1083 95.6 64.0 0 37 27
KAS Lowery 95.4 100.3 60.1 60.5 0 43 26
BECK 114 95.4 60.5 1 43 25
PEMBROKE 2016 95.3 98.4 62.0 59.8 8 38 22
BECK 128 95.3 98.4 57.5 58.2 3 40 26
STEYER EVANS 95.3 95.6 57.9 57.6 3 40 26
STEYER STex141 95.2 58.0 0 39 26
STEYER STex142 94.8 97.6 58.9 57.5 0 39 23
SS 8340 94.8 95.4 61.6 60.6 1 38 25
Pioneer variety 26R59 94.6 59.0 0 35 25
AgriMAXX 415 94.4 92.5 61.8 61.1 0 38 25
BECK 125 94.4 95.6 60.6 59.6 6 40 26
HILLIARD 94.3 97.5 60.4 58.9 0 40 23
SC EXP102™ 93.8 59.6 0 38 25
SS 8700 93.7 93.8 59.1 57.3 1 40 25
CROPLAN 9101 93.7 58.1 13 39 24
SC 13S26™ 93.7 58.1 0 40 26
EXP1078 93.7 60.3 1 41 24
SC 1325-15™ 93.6 94.6 59.3 57.6 0 39 25
AgriMAXX 490 93.5 61.7 20 41 22
STEYER STex155 93.3 59.9 0 37 25
Dyna-Gro WX16771 93.0 59.9 0 38 25
EXP1074 92.7 61.1 0 39 25
L11425 92.2 60.2 18 41 24
PROGENY PGX 15-16 91.8 62.7 0 37 24
STEYER MORRIN 91.5 94.1 60.4 59.6 0 40 26
EXP1052 91.3 60.4 0 40 25
PEMBROKE 2008 91.2 92.5 61.1 60.0 0 39 22
VA 12W-72 90.6 60.4 0 39 20
AgriMAXX Exp. 1670 90.5 62.7 3 41 23
ARMOR ARW1513 90.2 56.9 0 38 27
PEMBROKE 2014 90.1 96.1 61.7 60.5 0 38 21
ARMOR ARW1551 89.9 61.5 0 36 24
EXP1081 88.1 57.7 14 42 26
EXP1053 86.5 60.0 0 40 21
Truman 85.8 92.6 58.4 59.4 8 42 31
Ag 2650 85.8 60.1 4 42 23
Dyna-Gro 9692 85.1 94.8 56.6 57.7 8 39 26
PROGENY PGX 15-12 84.5 59.5 0 37 21
EXP1072 83.6 60.9 0 37 18
Pioneer variety 25R32 83.1 89.1 59.8 59.7 0 39 27
TN1102 82.7 57.7 18 41 22
SS 8513 80.6 81.2 59.8 57.2 24 39 19
AVERAGE 95.7 98.8 59.5 58.7 3 39 24C.V. 6.3 6.8
LSD (0.10) 9.9 7.7Location: Trigg Co.Planting date: 10-21-15; Conventional tillageHarvest date: 6-14-16

20
VARIETY
Yield (Bu/A)
Test Wt. (Lb/bu)
Height(In)
Heading Date> April 1
2016 2015-16 2016 2015-16 2016 2016AgriMAXX 463 95.9 56.2 34 28
AgriMAXX 446 92.6 85.2 57.5 57.7 36 31
AgriMAXX 444 92.1 85.3 56.8 57.7 37 31
ARMOR INFERNO 91.4 83.6 58.1 57.9 34 31
USG 3404 90.2 84.2 56.3 56.8 36 32
Dyna-Gro 9522 89.3 82.3 56.1 56.8 36 31
Pioneer variety 26R41 88.7 83.7 57.1 57.7 34 30
Pioneer variety 26R10 88.5 82.4 57.8 58.3 35 31
Pioneer variety 26R59 88.5 55.6 32 30
Pioneer variety 26R53 87.4 76.4 58.3 58.2 33 30
CROPLAN 9201 87.3 58.1 37 32
SS 8700 86.9 84.1 56.0 56.5 38 31
CROPLAN 9101 86.8 56.3 36 30
AgriMAXX 438 86.2 84.3 57.2 58.2 37 31
SS 8360 85.8 81.0 57.0 58.0 34 32
PROGENY PGX 15-10 84.5 56.6 38 31
L11425 84.4 56.5 35 28
BECK 120 84.3 81.3 53.0 54.5 33 29
HILLIARD 83.7 74.8 58.0 58.2 34 26
BECK 125 83.3 78.9 57.5 57.3 37 32
PROGENY PGX 15-16 82.8 58.8 34 29
PEMBROKE 2016 82.8 76.5 56.3 56.9 33 26
KAS S1200 82.4 79.4 52.8 55.0 34 29
CROPLAN SRW 9415 82.1 56.4 36 31
PROGENY PGX 15-12 82.1 53.9 33 24
ARMOR ARW1551 81.9 58.6 33 29
Dyna-Gro 9223 81.7 79.8 56.5 57.2 37 31
SS 8530 80.8 76.4 53.6 55.3 37 27
EXP1052 80.6 55.4 37 29
EXP1081 80.5 56.5 42 32
BECK 123 79.8 76.1 56.5 56.4 36 28
Dyna-Gro 9600 78.8 78.5 54.4 56.6 35 27
KY06C-1178-16-10-3 78.8 57.0 36 29
EXP1074 78.4 55.4 35 29
PROGENY P 870 77.6 77.3 52.8 54.8 33 30
SYNGENTA VIPER 77.5 58.5 38 25
AgriMAXX Exp. 1674 76.9 54.4 34 31
STEYER EVANS 76.8 77.0 54.4 56.2 36 31
USG 3013 76.7 78.5 56.4 57.0 36 30
Pioneer variety XW13W 75.9 75.6 57.3 57.1 35 30
EXP1078 75.5 56.0 37 29
L11419 75.1 55.6 39 30
PROGENY P 357 75.1 76.1 54.1 55.4 36 31
PEMBROKE 2014 73.7 71.3 56.5 57.1 32 24
BECK 128 73.3 73.0 55.7 56.6 36 32
USG 3895 73.3 55.6 32 30
EXP1083 73.0 61.0 36 32
Pioneer variety 25R32 72.9 71.5 58.5 58.7 38 32
USG 3197 72.3 53.4 37 30
AgriMAXX 454 72.0 71.0 55.8 56.8 35 32
AgriMAXX 415 71.5 71.1 58.1 59.2 35 31
Table 12. 2016 Kentucky Wheat Test - North Central Region.

21
Table 12 (continued)
VARIETY
Yield (Bu/A)
Test Wt. (Lb/bu)
Height(In)
Heading Date> April 1
2016 2015-16 2016 2015-16 2016 2016Dyna-Gro 9591 71.4 70.8 56.4 56.7 37 29
EXP1060 71.3 56.2 37 31
ARMOR RUMBLE 71.0 56.8 38 32
KAS Liberty IV 71.0 73.0 54.1 55.2 32 30
SC 1335-15™ 70.5 71.8 55.8 56.1 36 32
KAS S2500 69.2 55.5 35 32
SYNGENTA SY 547 69.2 73.8 55.8 57.3 37 30
KAS Lowery 69.1 68.1 57.7 58.7 40 31
AgriMAXX Exp. 1670 69.0 58.1 37 28
Equity Brand Butler 69.0 74.9 57.3 57.6 37 32
SC 1325-15™ 69.0 74.4 53.5 55.1 34 30
SS 8513 69.0 73.3 56.2 57.5 35 24
PROGENY PGX 15-14 68.8 54.5 34 31
STEYER STex155 68.6 56.8 34 31
SS 8340 68.6 67.0 57.9 58.0 34 31
Dyna-Gro WX16771 67.7 56.6 34 31
CROPLAN 9203 67.6 57.7 36 32
Dyna-Gro WX15742 67.5 67.5 53.7 55.1 36 30
L11541 67.5 57.3 34 32
PROGENY P 243 67.5 68.6 56.3 56.6 36 29
STEYER STex142 67.4 68.7 54.0 54.5 36 30
SYNGENTA SY 483 67.3 73.2 56.8 58.0 37 32
VA 12W-72 67.3 56.2 32 22
SYNGENTA SY HARRISON 66.8 55.0 35 31
TN1102 66.7 52.3 37 24
ARMOR ARW1516 66.5 53.3 34 30
Dyna-Gro 9692 66.5 69.2 56.2 57.3 34 31
AgriMAXX 452 65.8 58.0 39 31
SC 1315-15™ 64.8 67.8 55.7 57.2 35 30
ARMOR ARW1521 64.3 56.6 33 31
BECK 114 64.1 58.6 38 31
SC EXP102™ 63.8 56.9 33 31
EXP1053 62.4 55.9 36 27
AgriMAXX 490 60.9 56.3 37 27
STEYER MORRIN 60.8 71.1 56.6 57.6 37 32
ARMOR ARW1513 60.7 55.8 35 32
STEYER STex141 60.6 56.1 34 32
SYNGENTA SY 007 60.3 66.5 54.4 55.7 35 27
EXP1072 59.8 55.8 32 23
PEMBROKE 2008 58.9 64.7 55.1 56.5 33 25
SC EXP142™ 58.4 52.8 35 30
SYNGENTA BRANSON 57.8 66.0 54.4 56.3 34 30
EXP DEI 16098 55.0 56.3 39 32
Ag 2650 54.2 57.8 37 29
SC 13S26™ 53.3 55.2 34 31
Truman 51.0 60.8 57.7 57.6 38 34
AVERAGE 73.7 75.0 56.1 56.9 35 30C.V. 7.8 8.1
LSD (0.10) 9.5 7.0
Location: Woodford Co.; Lodging = 0%Planting date: 10-16-15; Conventional tillageHarvest date: 6-20-16

22
VARIETYStripe Rust
Leaf Rust
Leaf Blotch
Powdery Mildew
Ag 2650 1.7 2.7 4.5 8.5
AgriMAXX 415 2.3 3.7 4.5 5.0
AgriMAXX 438 1.7 5.7 6.5 7.8
AgriMAXX 444 3.0 2.7 4.5 5.3
AgriMAXX 446 3.3 4.3 4.8 6.8
AgriMAXX 452 8.3 1.3 4.5 6.5
AgriMAXX 454 7.7 3.3 4.5 7.5
AgriMAXX 463 2.3 2.7 4.0 5.5
AgriMAXX 490 7.0 1.3 4.5 4.8
AgriMAXX Exp. 1670 8.7 7.0 4.8 7.3
AgriMAXX Exp. 1674 3.7 3.3 3.0 2.8
ARMOR ARW1513 7.0 4.3 3.8 7.3
ARMOR ARW1516 1.3 3.0 4.8 6.8
ARMOR ARW1521 1.7 1.7 4.8 5.5
ARMOR ARW1551 1.3 1.0 3.8 1.5
ARMOR INFERNO 2.0 5.0 6.3 7.0
ARMOR RUMBLE 3.0 1.3 4.3 6.8
BECK 114 6.0 2.0 4.5 6.3
BECK 120 1.0 3.3 4.8 4.3
BECK 123 5.0 3.7 3.3 4.3
BECK 125 5.7 1.3 5.3 5.5
BECK 128 7.7 4.3 4.3 7.8
Clark 5.7 5.7 8.3 7.5
CROPLAN 9101 3.7 1.0 6.3 5.8
CROPLAN 9201 8.3 3.0 5.0 3.3
CROPLAN 9203 1.7 4.7 6.5 8.5
CROPLAN SRW 9415 3.0 4.3 5.3 7.0
Dyna-Gro 9223 2.0 5.7 6.3 7.8
Dyna-Gro 9522 2.0 3.7 5.0 5.3
Dyna-Gro 9591 3.3 1.7 6.0 5.8
Dyna-Gro 9600 7.0 1.7 4.5 3.3
Dyna-Gro 9692 7.0 4.3 4.3 7.0
Dyna-Gro WX15742 4.7 1.0 6.3 4.3
Dyna-Gro WX16771 2.0 1.7 5.8 5.8
Equity Brand Butler 3.0 1.0 4.0 6.0
EXP DEI 16098 5.3 2.7 4.5 4.8
EXP1052 4.3 4.0 5.8 3.0
EXP1053 4.3 1.3 7.0 4.3
EXP1060 8.3 3.0 4.3 4.3
EXP1072 5.7 2.0 5.5 2.8
EXP1074 6.0 1.7 6.0 3.5
EXP1078 3.7 1.7 4.3 5.0
EXP1081 6.7 2.3 6.3 2.8
EXP1083 7.3 3.0 4.3 2.0
HILLIARD 2.7 1.0 4.0 1.5
KAS Liberty IV 2.3 8.7 7.5 3.8
KAS Lowery 8.3 1.0 5.0 6.3
KAS S1200 1.3 2.7 4.8 5.3
KAS S2500 8.0 3.7 4.3 7.0
KY06C-1178-16-10-3 7.0 2.7 4.3 2.8
L11419 6.0 4.7 4.5 4.0
Table 13. 2016 Kentucky Wheat Disease Ratings.
VARIETYStripe Rust
Leaf Rust
Leaf Blotch
Powdery Mildew
L11425 8.3 3.3 4.3 5.8
L11541 1.3 1.0 2.8 1.3
PEMBROKE 2008 3.0 3.7 8.5 3.0
PEMBROKE 2014 1.3 4.7 5.5 2.0
PEMBROKE 2016 5.3 1.7 4.8 4.8
Pioneer variety 25R32 1.0 3.0 4.3 3.3
Pioneer variety 26R10 3.0 6.0 6.5 5.5
Pioneer variety 26R41 1.0 1.7 5.3 4.5
Pioneer variety 26R53 1.3 2.0 4.3 5.0
Pioneer variety 26R59 2.3 4.3 3.8 1.8
Pioneer variety XW13W 2.7 1.3 4.3 8.3
PROGENY P 243 6.0 3.3 3.0 5.5
PROGENY P 357 4.0 5.0 5.5 7.0
PROGENY P 870 1.3 2.7 4.8 5.3
PROGENY PGX 15-10 1.3 1.7 4.0 3.5
PROGENY PGX 15-12 3.3 1.3 3.5 3.5
PROGENY PGX 15-14 3.3 4.0 3.0 3.0
PROGENY PGX 15-16 1.7 1.0 4.3 2.8
SC 1315-15™ 5.0 1.7 6.0 6.0
SC 1325-15™ 7.0 2.3 5.0 6.3
SC 1335-15™ 6.0 1.3 6.0 5.3
SC 13S26™ 8.3 4.0 4.5 8.5
SC EXP102™ 1.7 3.7 4.5 6.3
SC EXP142™ 5.0 1.0 5.8 4.5
SS 8340 2.3 5.0 4.5 5.8
SS 8360 2.3 4.7 4.8 6.8
SS 8513 2.3 6.0 3.3 2.0
SS 8530 4.3 1.3 3.3 4.0
SS 8700 3.3 4.7 3.8 3.3
STEYER EVANS 1.7 3.7 5.0 5.5
STEYER MORRIN 2.7 2.0 3.5 7.5
STEYER STex141 7.3 4.3 4.5 7.5
STEYER STex142 5.3 2.0 7.3 4.5
STEYER STex155 1.0 3.0 5.0 6.0
SYNGENTA BRANSON 3.3 2.3 5.3 3.5
SYNGENTA SY 007 2.0 3.0 8.3 3.0
SYNGENTA SY 483 3.0 3.3 5.0 2.5
SYNGENTA SY 547 4.7 1.7 3.3 2.0
SYNGENTA SY HARRISON 3.0 5.7 4.3 7.0
SYNGENTA VIPER 1.7 4.7 4.0 5.0
TN1102 8.7 2.0 6.5 2.8
Truman 3.0 3.3 7.3 4.8
USG 3013 1.0 6.3 7.0 8.5
USG 3197 5.7 1.0 7.0 5.3
USG 3404 2.7 3.3 4.8 5.0
USG 3895 1.0 1.0 5.5 4.8
VA 12W-72 1.0 1.0 4.0 1.5
AVERAGE 4.0 3.0 5.0 5.0
Powdery mildew rated at Woodford Co. locationSeptoria leaf blotch, leaf and stripe rust rated at Logan Co.Disease Rating scale: 1 = resistant; 9 = susceptible
23
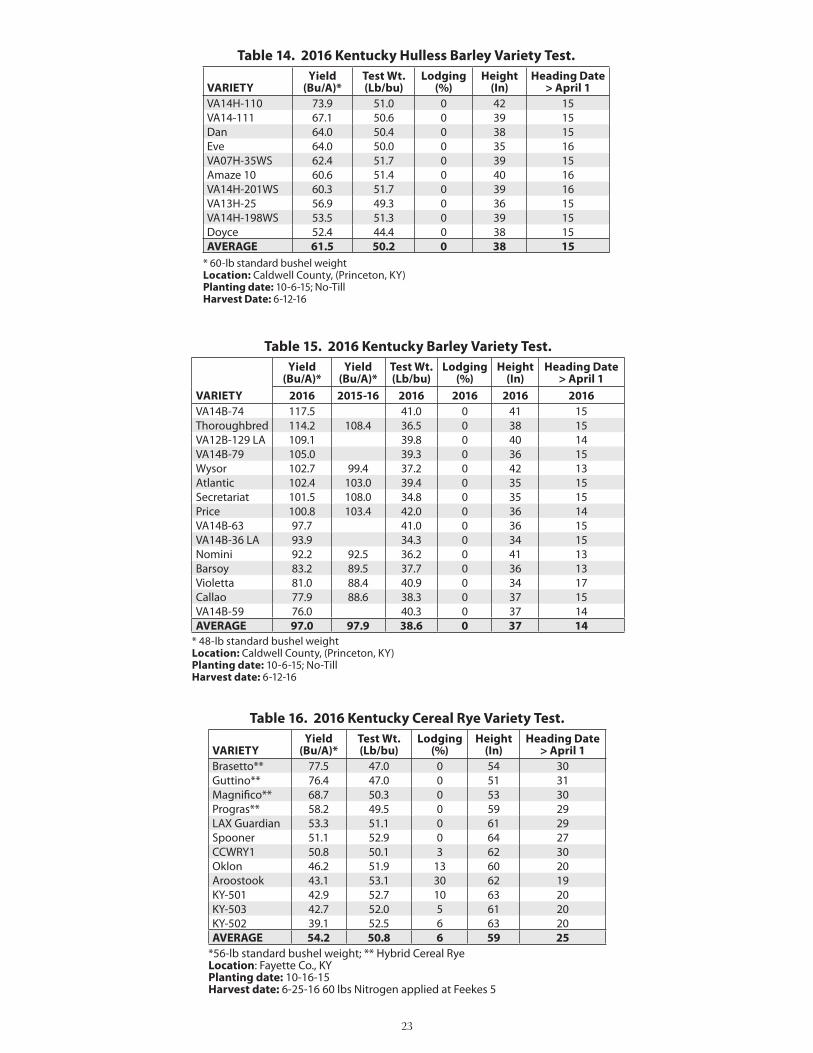
Table 14. 2016 Kentucky Hulless Barley Variety Test.
VARIETYYield
(Bu/A)*Test Wt.(Lb/bu)
Lodging(%)
Height(In)
Heading Date> April 1
VA14H-110 73.9 51.0 0 42 15VA14-111 67.1 50.6 0 39 15Dan 64.0 50.4 0 38 15Eve 64.0 50.0 0 35 16VA07H-35WS 62.4 51.7 0 39 15Amaze 10 60.6 51.4 0 40 16VA14H-201WS 60.3 51.7 0 39 16VA13H-25 56.9 49.3 0 36 15VA14H-198WS 53.5 51.3 0 39 15Doyce 52.4 44.4 0 38 15AVERAGE 61.5 50.2 0 38 15
* 60-lb standard bushel weightLocation: Caldwell County, (Princeton, KY) Planting date: 10-6-15; No-TillHarvest Date: 6-12-16
Table 15. 2016 Kentucky Barley Variety Test.
VARIETY
Yield(Bu/A)*
Yield(Bu/A)*
Test Wt.(Lb/bu)
Lodging(%)
Height(In)
Heading Date> April 1
2016 2015-16 2016 2016 2016 2016VA14B-74 117.5 41.0 0 41 15Thoroughbred 114.2 108.4 36.5 0 38 15VA12B-129 LA 109.1 39.8 0 40 14VA14B-79 105.0 39.3 0 36 15Wysor 102.7 99.4 37.2 0 42 13Atlantic 102.4 103.0 39.4 0 35 15Secretariat 101.5 108.0 34.8 0 35 15Price 100.8 103.4 42.0 0 36 14VA14B-63 97.7 41.0 0 36 15VA14B-36 LA 93.9 34.3 0 34 15Nomini 92.2 92.5 36.2 0 41 13Barsoy 83.2 89.5 37.7 0 36 13Violetta 81.0 88.4 40.9 0 34 17Callao 77.9 88.6 38.3 0 37 15VA14B-59 76.0 40.3 0 37 14AVERAGE 97.0 97.9 38.6 0 37 14
* 48-lb standard bushel weightLocation: Caldwell County, (Princeton, KY) Planting date: 10-6-15; No-TillHarvest date: 6-12-16
Table 16. 2016 Kentucky Cereal Rye Variety Test.
VARIETYYield
(Bu/A)*Test Wt.(Lb/bu)
Lodging(%)
Height(In)
Heading Date> April 1
Brasetto** 77.5 47.0 0 54 30Guttino** 76.4 47.0 0 51 31Magnifico** 68.7 50.3 0 53 30Progras** 58.2 49.5 0 59 29LAX Guardian 53.3 51.1 0 61 29Spooner 51.1 52.9 0 64 27CCWRY1 50.8 50.1 3 62 30Oklon 46.2 51.9 13 60 20Aroostook 43.1 53.1 30 62 19KY-501 42.9 52.7 10 63 20KY-503 42.7 52.0 5 61 20KY-502 39.1 52.5 6 63 20AVERAGE 54.2 50.8 6 59 25
*56-lb standard bushel weight; ** Hybrid Cereal RyeLocation: Fayette Co., KYPlanting date: 10-16-15 Harvest date: 6-25-16 60 lbs Nitrogen applied at Feekes 5

The College of Agriculture, Food and Environment is an Equal Opportunity OrganizationIssued 7-2016
Mention or display of a trademark, proprietary product, or firm in text or figures does not constitute an endorsement and does not imply approval to
the exclusion of other suitable products or firms.
Table 17. 2016 Kentucky Triticale Variety Test.
VARIETY
Grain Yield(Bu/A)*
Test Wt.(Lb/bu)
Height(In)
Heading Date> April 1
2016 2015-16 2016 2016 2016LAX HY Octane 64.5 72.4 47.2 48 32
Trical 815 64.1 62.4 45.7 51 29
SS 1414 49.0 58.8 45.6 43 25
Trical 336 48.5 57.2 43.8 48 30
SYN 154 48.0 46.0 46 24
Arcia 30.5 46.6 42.6 41 25
AVERAGE 50.8 59.5 45.2 46 28* 60-lb standard bushel weight; Lodging = 0%Location: Fayette Co., KYPlanting date: 10-16-15Harvest date: 6-25-16
Table 18. 2016 Kentucky Oat Variety Test.
VARIETYGrain Yield
(Bu/A)*Test Wt.(Lb/bu)
Height(In)
Heading Date> May 1
Winter Survival
CCBO3 88.9 35.7 39 11 96
Gerard 224 72.9 36.0 38 7 98
NC12-3578 71.1 37.8 39 7 100
SS 76-50 68.3 33.9 36 8 88
RAM 99016 67.9 33.9 40 8 96
Gerard 229 65.4 35.7 36 8 98
NC12-3447 63.5 34.5 42 8 83
Horizon 201 52.6 31.2 40 7 74
Horizon 306 50.4 34.7 37 9 65
Brooks 48.7 34.1 43 8 81
Horizon 270 42.2 34.3 34 8 71
NC09-4503N 15.7 34.3 37 8 31
AVERAGE 59.0 34.7 38 8 82* 32-lb standard bushel weight; Winter Survival (%); Lodging = 0%Location: Fayette Co., KYPlanting date: 10-16-15Harvest date: 6-25-16 60 lbs Nitrogen applied at Feekes 5