agricultural households - statistics south africa · statistics south africa census 2011...
TRANSCRIPT
Census 2011 Agricultural households
Key Highlights
Statistics South Africa
Pali LehohlaStatistician-GeneralReport No. 03-11-01 (2011)
Statistics South Africa
Census 2011 Agricultural households, Report No. 03-11-01
ii
Census 2011 Agricultural households / Statistics South Africa Published by Statistics South Africa, Private Bag X44, Pretoria 0001 © Statistics South Africa, 2013 Users may apply or process this data, provided Statistics South Africa (Stats SA) is acknowledged as the original source of the data; that it is specified that the application and/or analysis is the result of the user's independent processing of the data; and that neither the basic data nor any reprocessed version or application thereof may be sold or offered for sale in any form whatsoever without prior permission from Stats SA. Stats SA Library Cataloguing-in-Publication (CIP) Data Census 2011 Agricultural households/ Statistics South Africa. Pretoria: Statistics South Africa, 2013 Report no. 03-11-01 (2011) 27 pp ISBN 978-0-621-42004-3 A complete set of Stats SA publications is available at Stats SA Library and the following libraries:
National Library of South Africa, Pretoria Division National Library of South Africa, Cape Town Division Library of Parliament, Cape Town Bloemfontein Public Library Natal Society Library, Pietermaritzburg Johannesburg Public Library Eastern Cape Library Services, King William’s Town Central Regional Library, Polokwane Central Reference Library, Nelspruit Central Reference Collection, Kimberley Central Reference Library, Mmabatho
This publication is available on the Stats SA website: www.statssa.gov.za For technical enquiries please contact: Moses Mnyaka Tel: 012 310 8984 Fax: 012 310 4641 Email: [email protected] For dissemination enquiries, please contact Printing and Distribution, Statistics South Africa Ina du Plessis Email: [email protected]
Statistics South Africa
Census 2011 Agricultural households, Report No. 03-11-01
iii
Contents 1. Introduction ..................................................................................................................................................................................... 1
1.1 Importance of agricultural statistics ......................................................................................................................................... 1 1.2 Background .............................................................................................................................................................................. 1 1.3 How the count was done ......................................................................................................................................................... 1
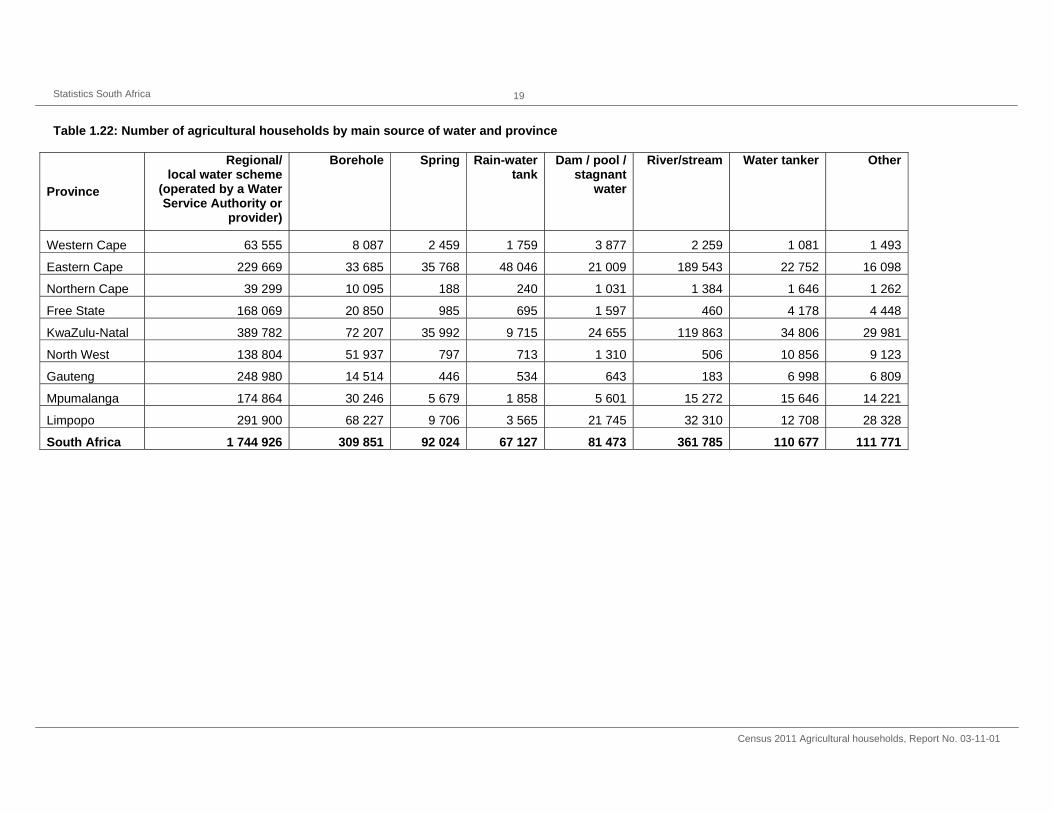
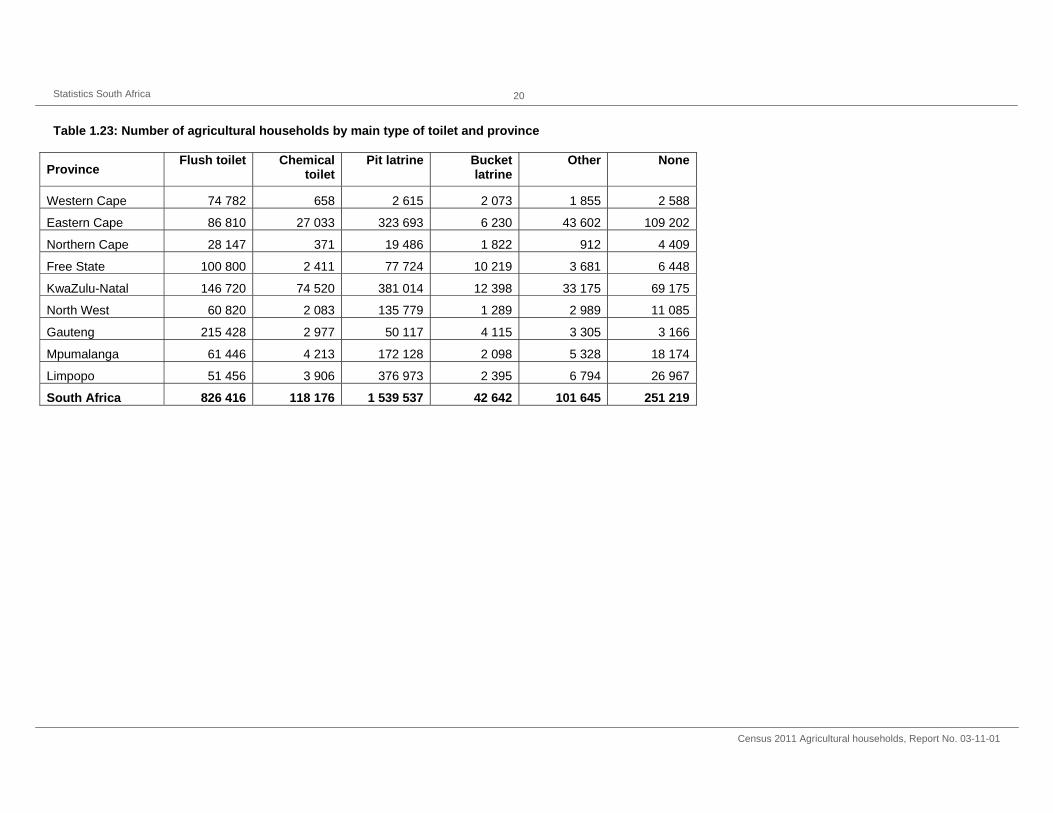
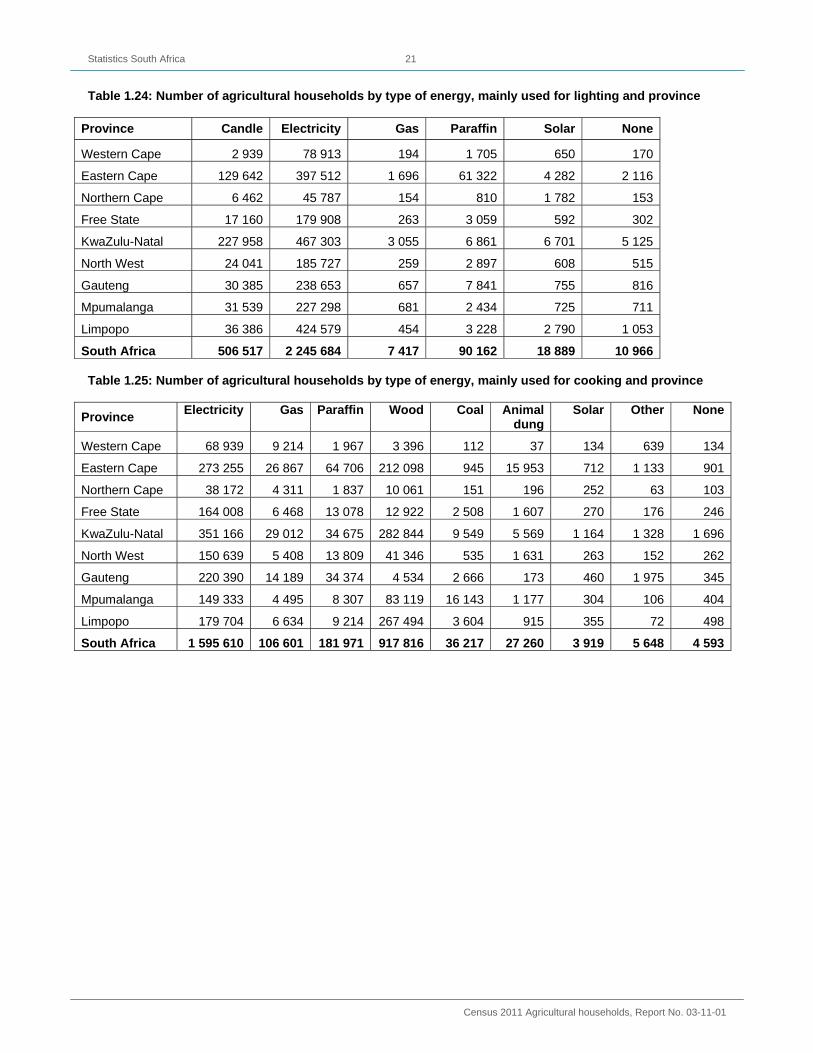
Annexure 1: List of agricultural households tables .......................................................................................................................... 12 Annexure 2: Terms and definitions................................................................................................................................................... 22 List of Tables Table 1.1: Number of households by province ................................................................................................................................ 12 Table 1.2: Number of agricultural households involved in specific activity by province .................................................................. 12 Table 1.3: Number of agricultural households by population group of household head and province ........................................... 12 Table 1.4: Number of agricultural households by sex of household head and province ................................................................. 13 Table 1.5: Number of agricultural households by age group of household head and province ...................................................... 13 Table 1.6: Number of agricultural households by education level of household head and province .............................................. 13 Table 1.7: Number of agricultural households by income level of household head and province .................................................. 14 Table 1.8: Number of agricultural households by type of activity and province .............................................................................. 14 Table 1.9: Number of agricultural households owning only livestock by province .......................................................................... 14 Table 1.10: Number of agricultural households owning cattle by province ..................................................................................... 15 Table 1.11: Number of agricultural households owning sheep by province .................................................................................... 15 Table 1.12: Number of agricultural households owning goats by province ..................................................................................... 15 Table 1.13: Number of agricultural households owning pigs by province ....................................................................................... 16 Table 1.14: Number of agricultural households owning other livestock by province ...................................................................... 16 Table 1.15: Number of agricultural households in livestock production by sex of household head and province.......................... 16 Table 1.16: Number of agricultural households in poultry production by sex of household head and province ............................. 17 Table 1.17: Number of agricultural households in vegetable production by sex of household head and province ........................ 17 Table 1.18: Number of agricultural households in production of other crops by sex of household head and province ................. 17 Table 1.19: Number of agricultural households producing fodder/pasture/grass by sex of household head and province ........... 18 Table 1.20: Number of agricultural households in other agricultural activities by sex of household head and province ............... 18 Table 1.21: Number of agricultural households by access to water and province .......................................................................... 18 Table 1.22: Number of agricultural households by main source of water and province ................................................................. 19 Table 1.23: Number of agricultural households by main type of toilet and province ....................................................................... 20 Table 1.24: Number of agricultural households by type of energy, mainly used for lighting and province ..................................... 21 Table 1.25: Number of agricultural households by type of energy, mainly used for cooking and province .................................... 21 List of Figures Figure 2.1: Distribution of agricultural households by province ......................................................................................................... 2 Figure 2.2: Distribution of agricultural households per province ........................................................................................................ 2 Figure 2.3: Distribution of agricultural households involved in specific activity by province ............................................................. 3 Figure 2.4: Distribution of agricultural household heads by age groups and sex .............................................................................. 3 Figure 2.5: Distribution of agricultural households heads by educational level and province ........................................................... 4 Figure 2.6: Distribution of agricultural household heads by annual income and province ................................................................ 4 Figure 2.7: Distribution of agricultural households by type of activity and province .......................................................................... 5 Figure 2.8: Distribution of agricultural households owning only livestock by province ...................................................................... 5 Figure 2.9: Distribution of agricultural households owning cattle per province ................................................................................. 6 Figure 2.10: Distribution of agricultural households owning cattle by province ................................................................................. 6 Figure 2.11: Distribution of agricultural households owning sheep per province .............................................................................. 7 Figure 2.12: Distribution of agricultural households owning sheep by province ............................................................................... 7 Figure 2.13: Distribution of agricultural households owning goats per province ............................................................................... 8 Figure 2.14: Distribution of agricultural households owning goats by province ................................................................................ 8 Figure 2.15: Distribution of agricultural households owning pigs per province ................................................................................. 9 Figure 2.16: Distribution of agricultural households owning pigs by province ................................................................................... 9 Figure 2.17: Distribution of agricultural households by main source of water and province ........................................................... 10 Figure 2.18: Distribution of agricultural households by type of toilet facility and province .............................................................. 10 Figure 2.19: Distribution of agricultural households by type of energy used for lighting and province ........................................... 11 Figure 2.20: Distribution of agricultural households by type of energy used for cooking and province .......................................... 11
Statistics South Africa
Census 2011 Agricultural households, Report No. 03-11-01
1
1. Introduction
1.1 Importance of agricultural statistics
Agricultural statistics are key to the measurement of the performance of the agricultural sector. In general, the data are used for food security, green economy and environmental studies. The information will be mostly used for decision making, planning, research and the measurement of food security and employment in the sector.
1.2 Background
In 2009, Statistics South Africa (Stats SA) conducted a study to evaluate the state of agricultural statistics in the country. The research sought to evaluate the quality, quantity (depth and breadth) and frequency of agricultural statistics as provided in the country at the time. The research revealed, among others, that agricultural statistics, at the time, fell short in terms of the specified aspects. Critically, regarding quantity, the country lacked information on smallholder and subsistence agriculture. In addition, the agricultural sector lacked a comprehensive frame (farmer list) that covered all agricultural activities in the country as the current census of commercial agriculture was partially covering the sector. A decision was reached in 2010 to include three questions related to agriculture in the Population Census 2011 (Census 2011) questionnaire. The main objective was to identify all households involved in agriculture in the country in order to plan a frame for a proper agricultural census.
The list of households engaged in agriculture generated from the above exercise of Census 2011 will complement the current tax based frame sourced from the South African Revenue Service (SARS) to develop a complete frame of all agricultural activities in the country. The data presented in this report is obtained from Census 2011 and provide useful insights on the geographic sphere. Specifically, the information presented is a result of the three agricultural questions, which were included in the population questionnaire. This information is critical for the measurement of the food security of the country at both national and household levels. This report forms part of a series of publications generated from Census 2011.
1.3 How the count was done
The Census 2011 main questionnaire was used as a tool to identify the agricultural active enumerated households. This was achieved by including three questions onto the census questionnaire. The questions were structured as follows: - What kind of agricultural activity is the household involved in? - How many of the following (livestock) does the household own? - Where does this household operate its agricultural activities?
The data was collected and processed in the same manner as the rest of population census.
PJ Lehohla Statistician-General PRETORIA 2013
Statistics South Africa
Census 2011 Agricultural households, Report No. 03-11-01
2
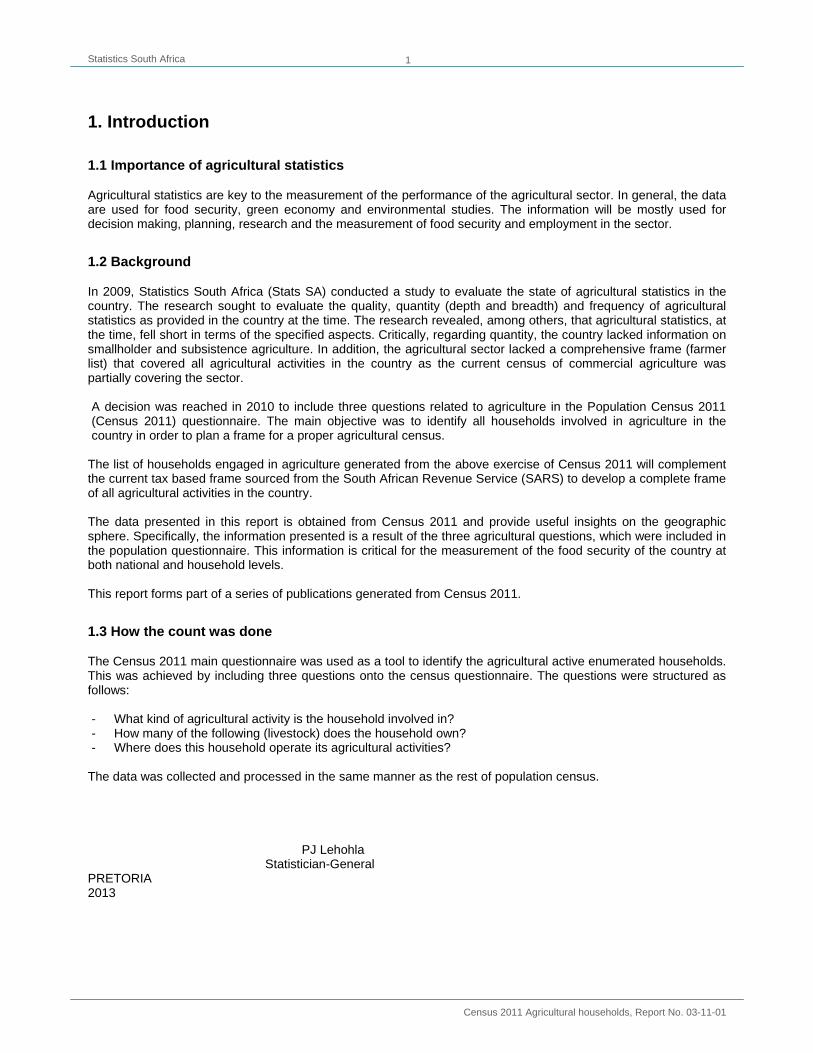
2. Key results Figure 2.1: Distribution of agricultural households by province
The number of households engaged in agriculture (also referred to as agricultural households in this report), was 2,9 million in 2011. Figure 2.1 shows that nationally, 24,9%, 20,7% and 16,3% of agricultural households were located in KwaZulu-Natal, Eastern Cape and Limpopo respectively. The lowest percentage of agricultural households were recorded for the Northern Cape and Western Cape at 1,9% and 2,9% respectively.
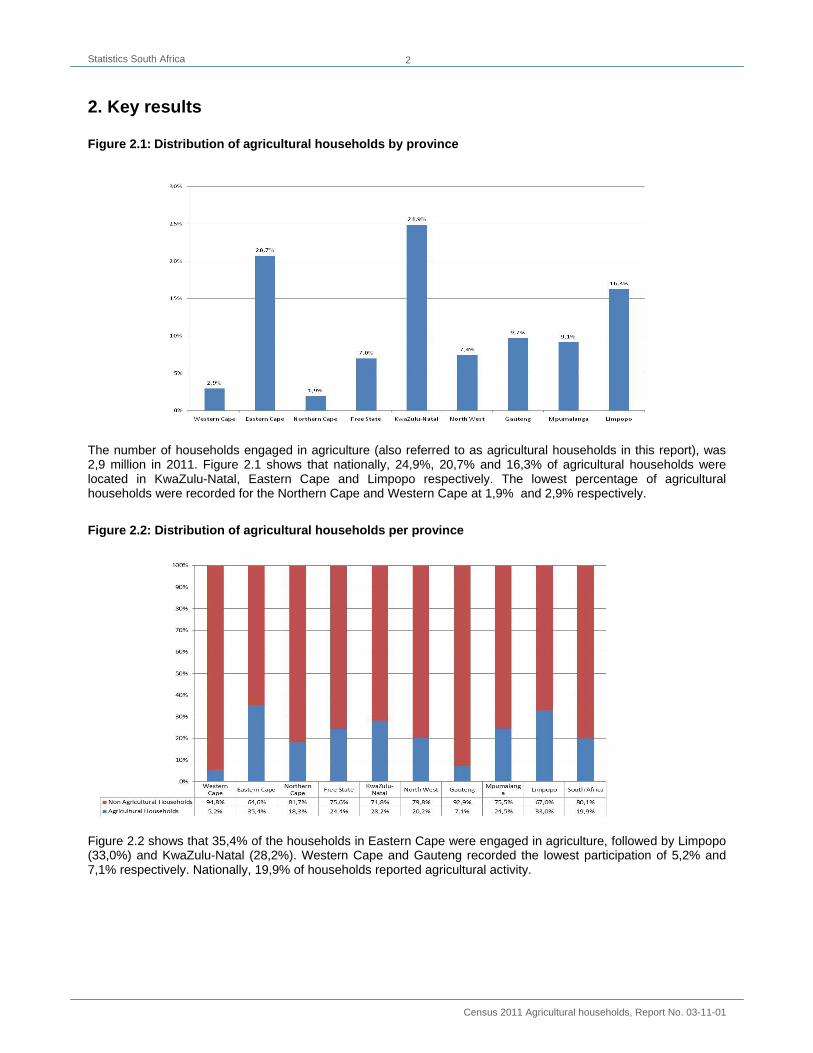
Figure 2.2: Distribution of agricultural households per province
Figure 2.2 shows that 35,4% of the households in Eastern Cape were engaged in agriculture, followed by Limpopo (33,0%) and KwaZulu-Natal (28,2%). Western Cape and Gauteng recorded the lowest participation of 5,2% and 7,1% respectively. Nationally, 19,9% of households reported agricultural activity.
Statistics South Africa
Census 2011 Agricultural households, Report No. 03-11-01
3
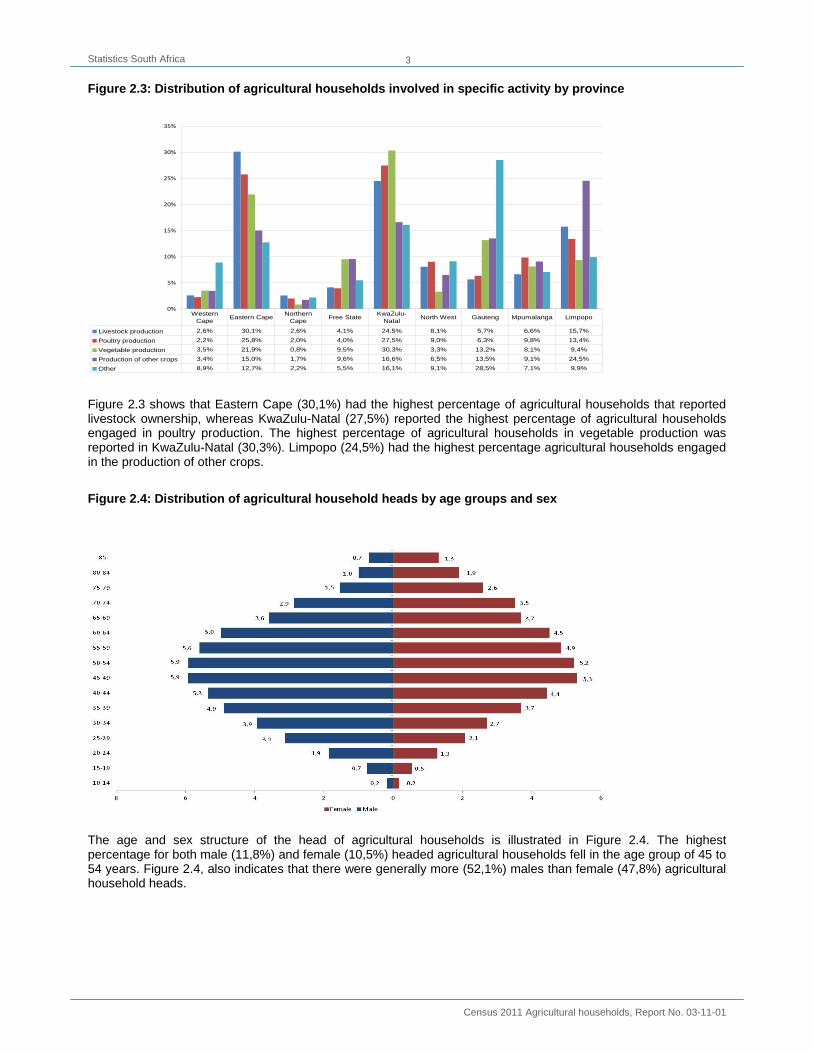
Figure 2.3: Distribution of agricultural households involved in specific activity by province
0%
5%
10%
15%
20%
25%
30%
35%
Livestock production 2,6% 30,1% 2,6% 4,1% 24,5% 8,1% 5,7% 6,6% 15,7%
Poultry production 2,2% 25,8% 2,0% 4,0% 27,5% 9,0% 6,3% 9,8% 13,4%
Vegetable production 3,5% 21,9% 0,8% 9,5% 30,3% 3,3% 13,2% 8,1% 9,4%
Production of other crops 3,4% 15,0% 1,7% 9,6% 16,6% 6,5% 13,5% 9,1% 24,5%
Other 8,9% 12,7% 2,2% 5,5% 16,1% 9,1% 28,5% 7,1% 9,9%
Western Cape Eastern Cape Northern
Cape Free State KwaZulu-Natal North West Gauteng Mpumalanga Limpopo
Figure 2.3 shows that Eastern Cape (30,1%) had the highest percentage of agricultural households that reported livestock ownership, whereas KwaZulu-Natal (27,5%) reported the highest percentage of agricultural households engaged in poultry production. The highest percentage of agricultural households in vegetable production was reported in KwaZulu-Natal (30,3%). Limpopo (24,5%) had the highest percentage agricultural households engaged in the production of other crops.
Figure 2.4: Distribution of agricultural household heads by age groups and sex
The age and sex structure of the head of agricultural households is illustrated in Figure 2.4. The highest percentage for both male (11,8%) and female (10,5%) headed agricultural households fell in the age group of 45 to 54 years. Figure 2.4, also indicates that there were generally more (52,1%) males than female (47,8%) agricultural household heads.
Statistics South Africa
Census 2011 Agricultural households, Report No. 03-11-01
4
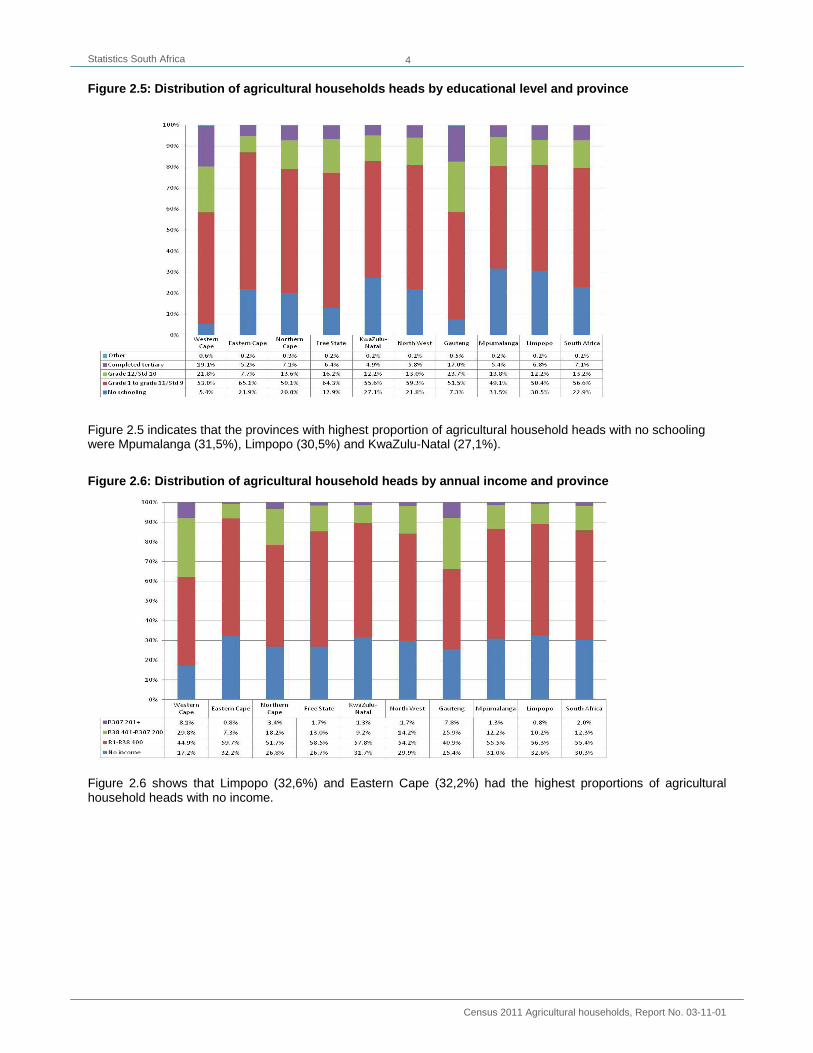
Figure 2.5: Distribution of agricultural households heads by educational level and province
Figure 2.5 indicates that the provinces with highest proportion of agricultural household heads with no schooling were Mpumalanga (31,5%), Limpopo (30,5%) and KwaZulu-Natal (27,1%).
Figure 2.6: Distribution of agricultural household heads by annual income and province
Figure 2.6 shows that Limpopo (32,6%) and Eastern Cape (32,2%) had the highest proportions of agricultural household heads with no income.
Statistics South Africa
Census 2011 Agricultural households, Report No. 03-11-01
5
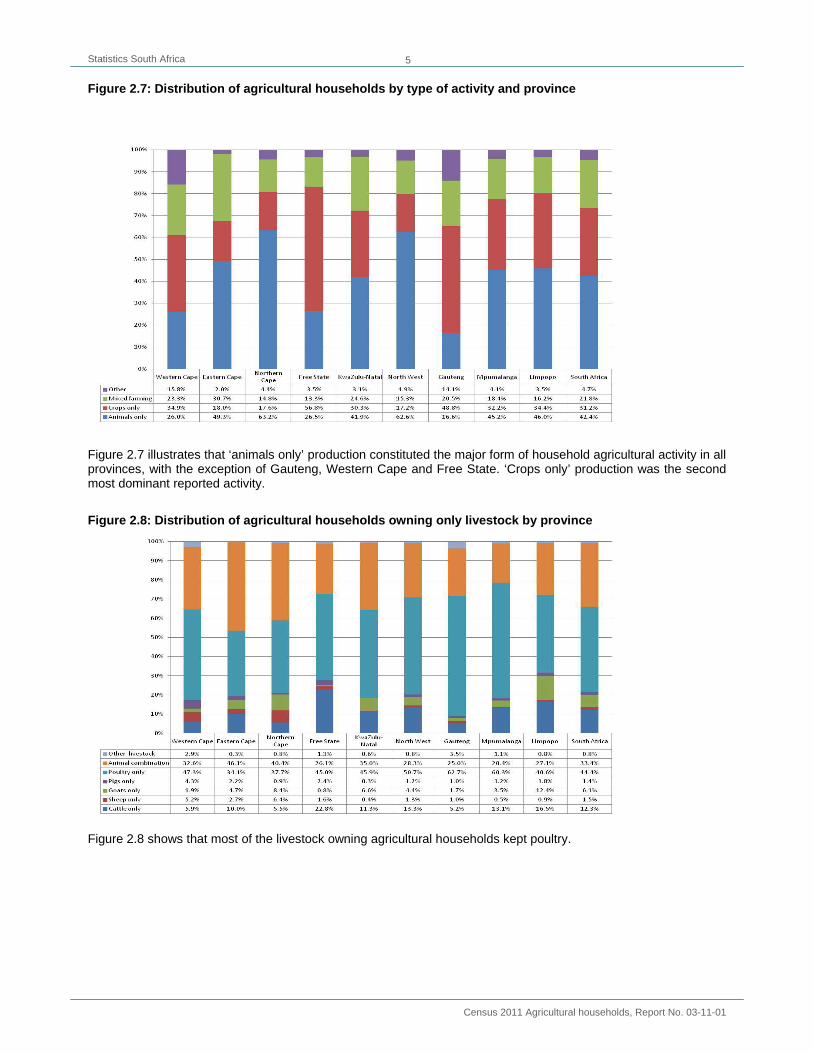
Figure 2.7: Distribution of agricultural households by type of activity and province
Figure 2.7 illustrates that ‘animals only’ production constituted the major form of household agricultural activity in all provinces, with the exception of Gauteng, Western Cape and Free State. ‘Crops only’ production was the second most dominant reported activity.
Figure 2.8: Distribution of agricultural households owning only livestock by province
Figure 2.8 shows that most of the livestock owning agricultural households kept poultry.
Statistics South Africa
Census 2011 Agricultural households, Report No. 03-11-01
6
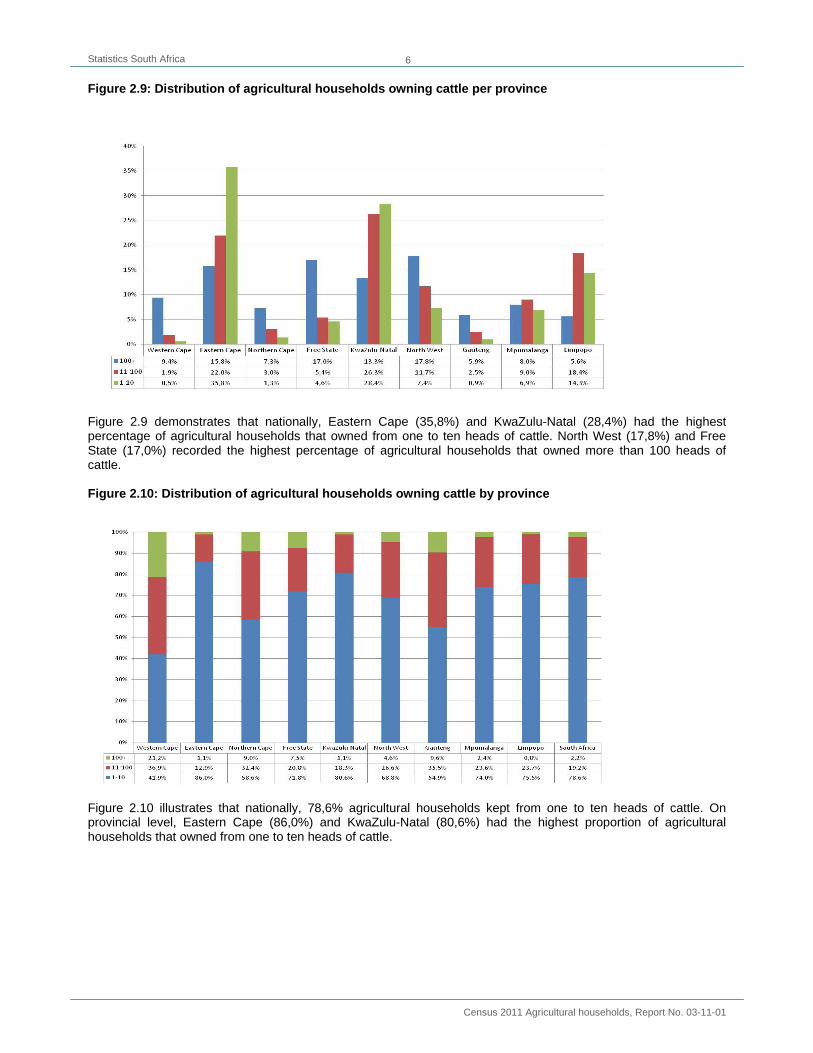
Figure 2.9: Distribution of agricultural households owning cattle per province
Figure 2.9 demonstrates that nationally, Eastern Cape (35,8%) and KwaZulu-Natal (28,4%) had the highest percentage of agricultural households that owned from one to ten heads of cattle. North West (17,8%) and Free State (17,0%) recorded the highest percentage of agricultural households that owned more than 100 heads of cattle. Figure 2.10: Distribution of agricultural households owning cattle by province
Figure 2.10 illustrates that nationally, 78,6% agricultural households kept from one to ten heads of cattle. On provincial level, Eastern Cape (86,0%) and KwaZulu-Natal (80,6%) had the highest proportion of agricultural households that owned from one to ten heads of cattle.
Statistics South Africa
Census 2011 Agricultural households, Report No. 03-11-01
7
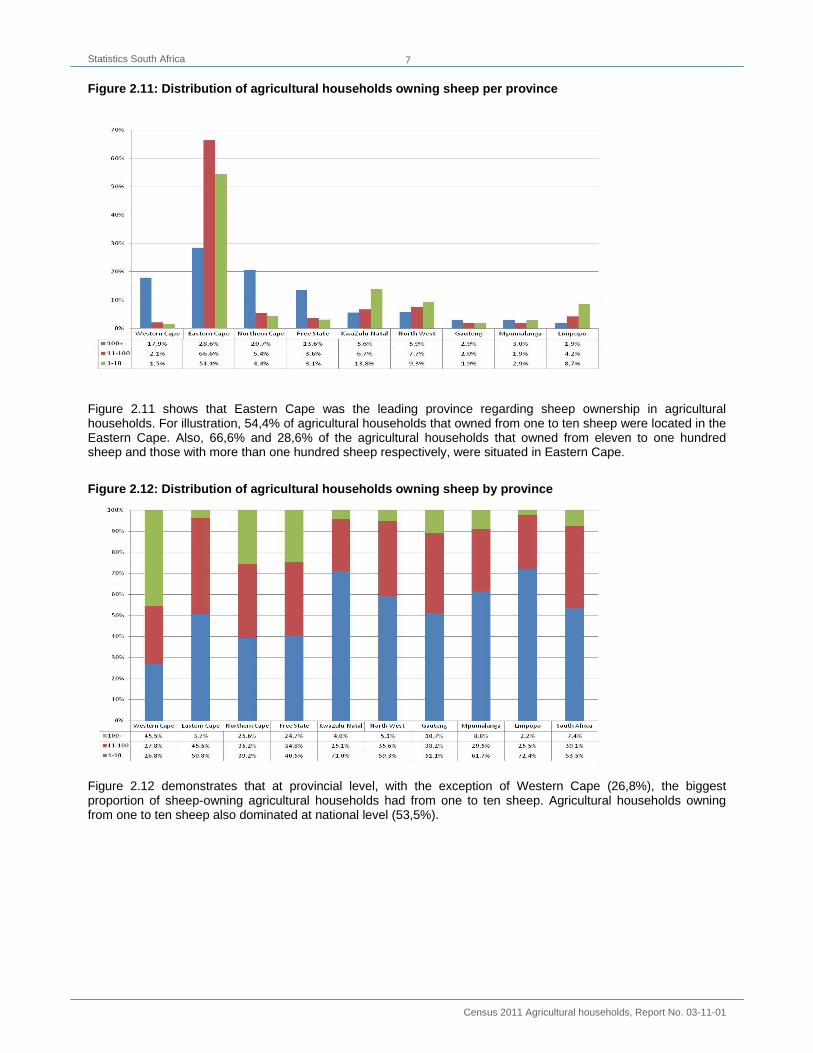
Figure 2.11: Distribution of agricultural households owning sheep per province
Figure 2.11 shows that Eastern Cape was the leading province regarding sheep ownership in agricultural households. For illustration, 54,4% of agricultural households that owned from one to ten sheep were located in the Eastern Cape. Also, 66,6% and 28,6% of the agricultural households that owned from eleven to one hundred sheep and those with more than one hundred sheep respectively, were situated in Eastern Cape.
Figure 2.12: Distribution of agricultural households owning sheep by province
Figure 2.12 demonstrates that at provincial level, with the exception of Western Cape (26,8%), the biggest proportion of sheep-owning agricultural households had from one to ten sheep. Agricultural households owning from one to ten sheep also dominated at national level (53,5%).
Statistics South Africa
Census 2011 Agricultural households, Report No. 03-11-01
8
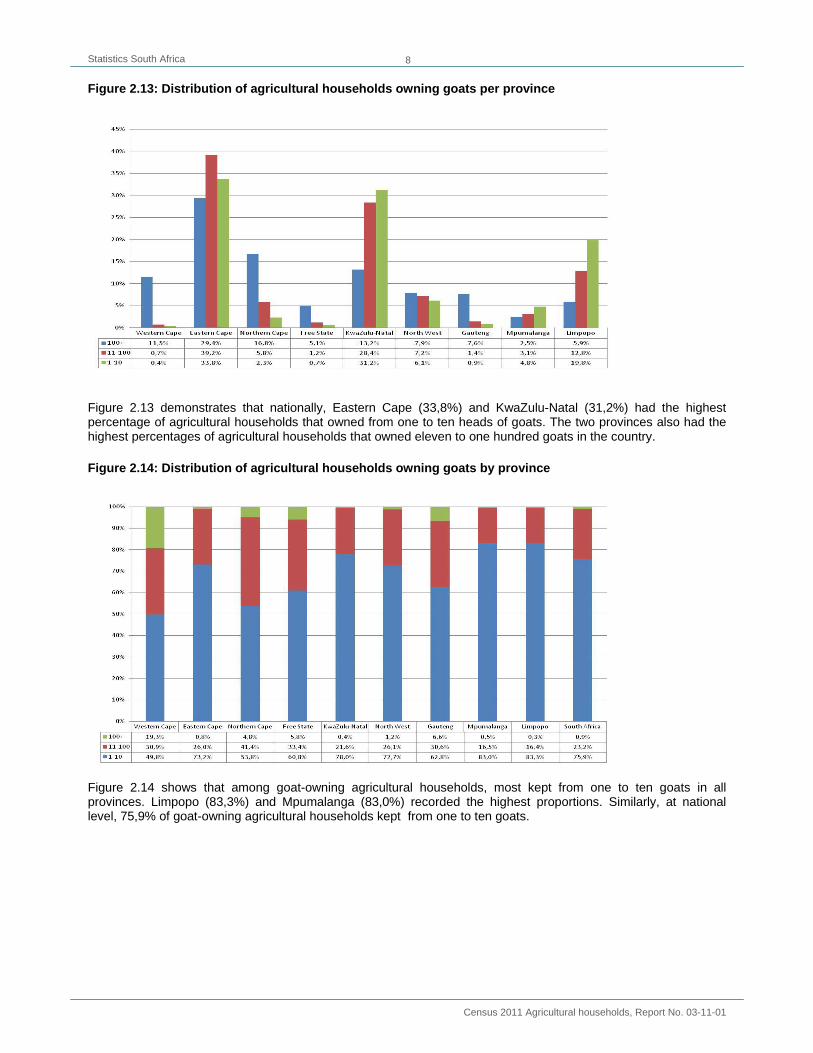
Figure 2.13: Distribution of agricultural households owning goats per province
Figure 2.13 demonstrates that nationally, Eastern Cape (33,8%) and KwaZulu-Natal (31,2%) had the highest percentage of agricultural households that owned from one to ten heads of goats. The two provinces also had the highest percentages of agricultural households that owned eleven to one hundred goats in the country. Figure 2.14: Distribution of agricultural households owning goats by province
Figure 2.14 shows that among goat-owning agricultural households, most kept from one to ten goats in all provinces. Limpopo (83,3%) and Mpumalanga (83,0%) recorded the highest proportions. Similarly, at national level, 75,9% of goat-owning agricultural households kept from one to ten goats.
Statistics South Africa
Census 2011 Agricultural households, Report No. 03-11-01
9
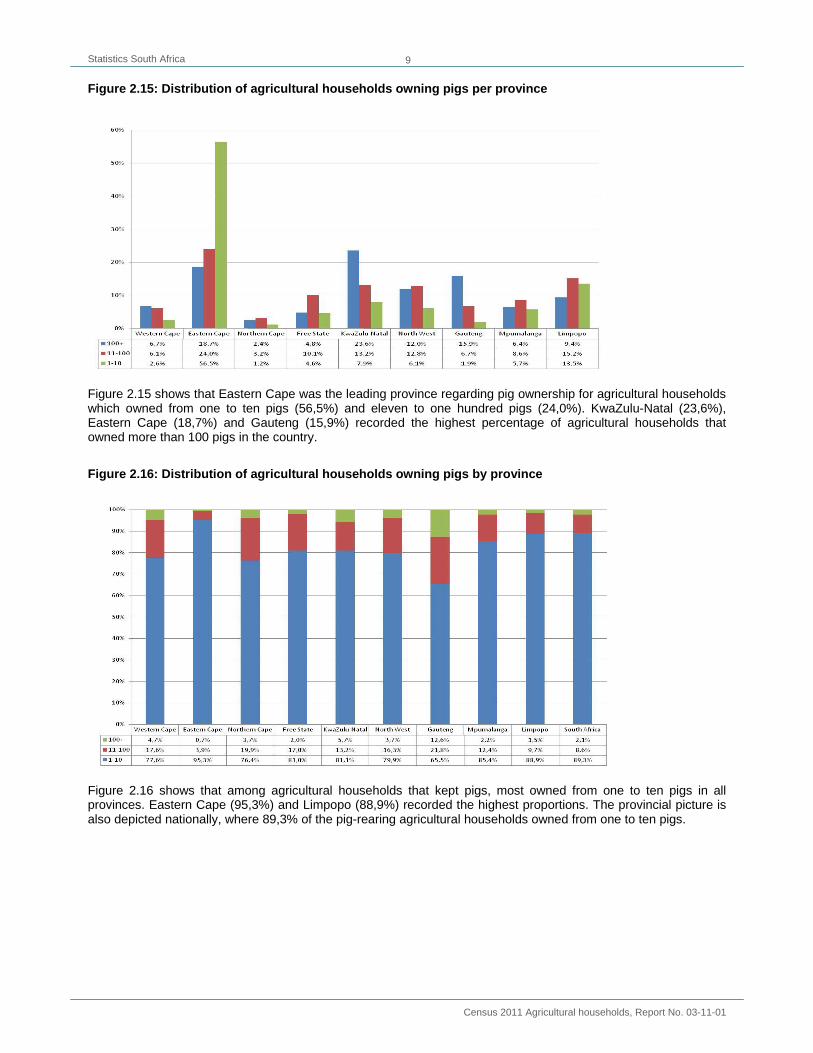
Figure 2.15: Distribution of agricultural households owning pigs per province
Figure 2.15 shows that Eastern Cape was the leading province regarding pig ownership for agricultural households which owned from one to ten pigs (56,5%) and eleven to one hundred pigs (24,0%). KwaZulu-Natal (23,6%), Eastern Cape (18,7%) and Gauteng (15,9%) recorded the highest percentage of agricultural households that owned more than 100 pigs in the country.
Figure 2.16: Distribution of agricultural households owning pigs by province
Figure 2.16 shows that among agricultural households that kept pigs, most owned from one to ten pigs in all provinces. Eastern Cape (95,3%) and Limpopo (88,9%) recorded the highest proportions. The provincial picture is also depicted nationally, where 89,3% of the pig-rearing agricultural households owned from one to ten pigs.
Statistics South Africa
Census 2011 Agricultural households, Report No. 03-11-01
10
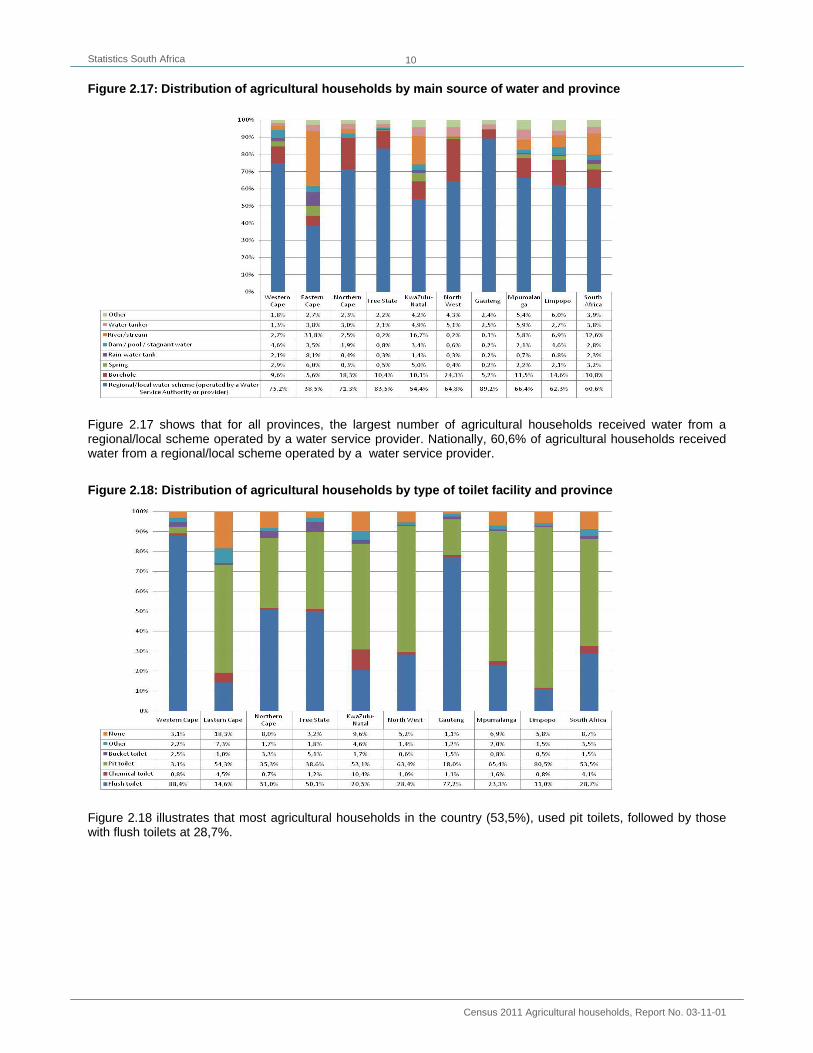
Figure 2.17: Distribution of agricultural households by main source of water and province
Figure 2.17 shows that for all provinces, the largest number of agricultural households received water from a regional/local scheme operated by a water service provider. Nationally, 60,6% of agricultural households received water from a regional/local scheme operated by a water service provider.
Figure 2.18: Distribution of agricultural households by type of toilet facility and province
Figure 2.18 illustrates that most agricultural households in the country (53,5%), used pit toilets, followed by those with flush toilets at 28,7%.
Statistics South Africa
Census 2011 Agricultural households, Report No. 03-11-01
11
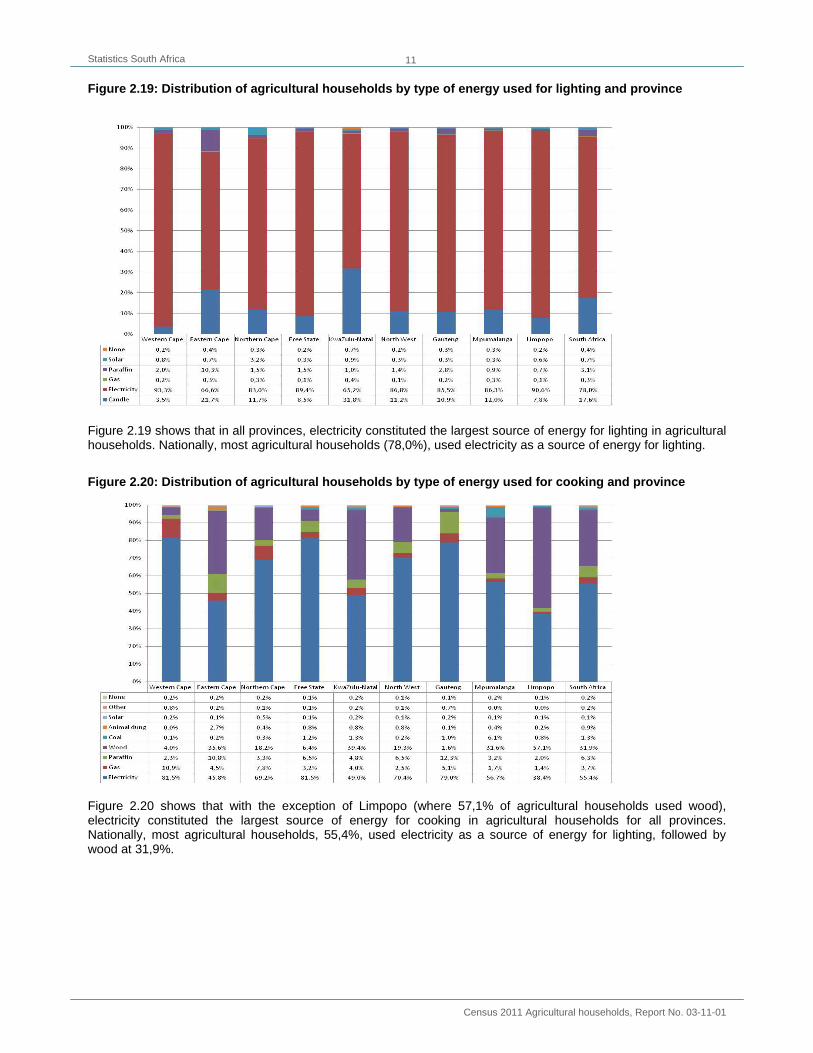
Figure 2.19: Distribution of agricultural households by type of energy used for lighting and province
Figure 2.19 shows that in all provinces, electricity constituted the largest source of energy for lighting in agricultural households. Nationally, most agricultural households (78,0%), used electricity as a source of energy for lighting.
Figure 2.20: Distribution of agricultural households by type of energy used for cooking and province
Figure 2.20 shows that with the exception of Limpopo (where 57,1% of agricultural households used wood), electricity constituted the largest source of energy for cooking in agricultural households for all provinces. Nationally, most agricultural households, 55,4%, used electricity as a source of energy for lighting, followed by wood at 31,9%.
Statistics South Africa
Census 2011 Agricultural households, Report No. 03-11-01
12
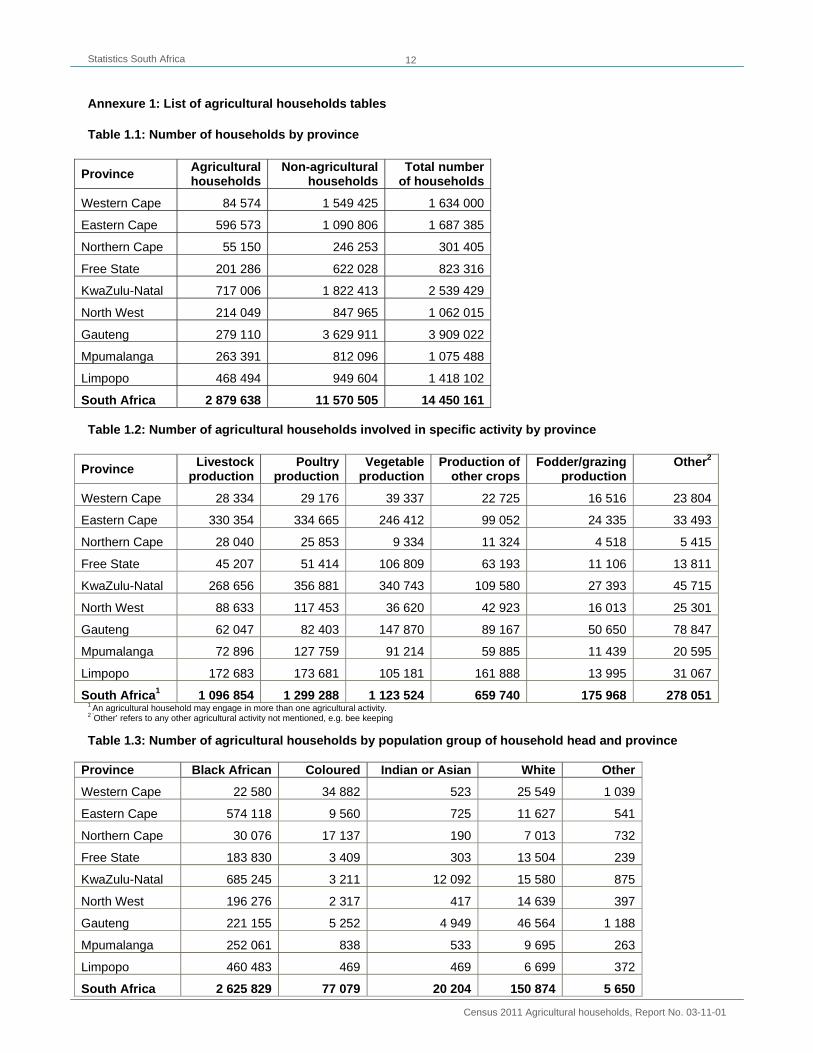
Annexure 1: List of agricultural households tables Table 1.1: Number of households by province
Province Agricultural households
Non-agriculturalhouseholds
Total numberof households
Western Cape 84 574 1 549 425 1 634 000
Eastern Cape 596 573 1 090 806 1 687 385
Northern Cape 55 150 246 253 301 405
Free State 201 286 622 028 823 316
KwaZulu-Natal 717 006 1 822 413 2 539 429
North West 214 049 847 965 1 062 015
Gauteng 279 110 3 629 911 3 909 022
Mpumalanga 263 391 812 096 1 075 488
Limpopo 468 494 949 604 1 418 102
South Africa 2 879 638 11 570 505 14 450 161 Table 1.2: Number of agricultural households involved in specific activity by province
Province Livestock production
Poultry production
Vegetable production
Production of other crops
Fodder/grazing production
Other2
Western Cape 28 334 29 176 39 337 22 725 16 516 23 804
Eastern Cape 330 354 334 665 246 412 99 052 24 335 33 493
Northern Cape 28 040 25 853 9 334 11 324 4 518 5 415
Free State 45 207 51 414 106 809 63 193 11 106 13 811
KwaZulu-Natal 268 656 356 881 340 743 109 580 27 393 45 715
North West 88 633 117 453 36 620 42 923 16 013 25 301
Gauteng 62 047 82 403 147 870 89 167 50 650 78 847
Mpumalanga 72 896 127 759 91 214 59 885 11 439 20 595
Limpopo 172 683 173 681 105 181 161 888 13 995 31 067
South Africa1 1 096 854 1 299 288 1 123 524 659 740 175 968 278 0511 An agricultural household may engage in more than one agricultural activity. 2 ‘Other’ refers to any other agricultural activity not mentioned, e.g. bee keeping Table 1.3: Number of agricultural households by population group of household head and province
Province Black African Coloured Indian or Asian White Other
Western Cape 22 580 34 882 523 25 549 1 039
Eastern Cape 574 118 9 560 725 11 627 541
Northern Cape 30 076 17 137 190 7 013 732
Free State 183 830 3 409 303 13 504 239
KwaZulu-Natal 685 245 3 211 12 092 15 580 875
North West 196 276 2 317 417 14 639 397
Gauteng 221 155 5 252 4 949 46 564 1 188
Mpumalanga 252 061 838 533 9 695 263
Limpopo 460 483 469 469 6 699 372
South Africa 2 625 829 77 079 20 204 150 874 5 650
Statistics South Africa
Census 2011 Agricultural households, Report No. 03-11-01
13
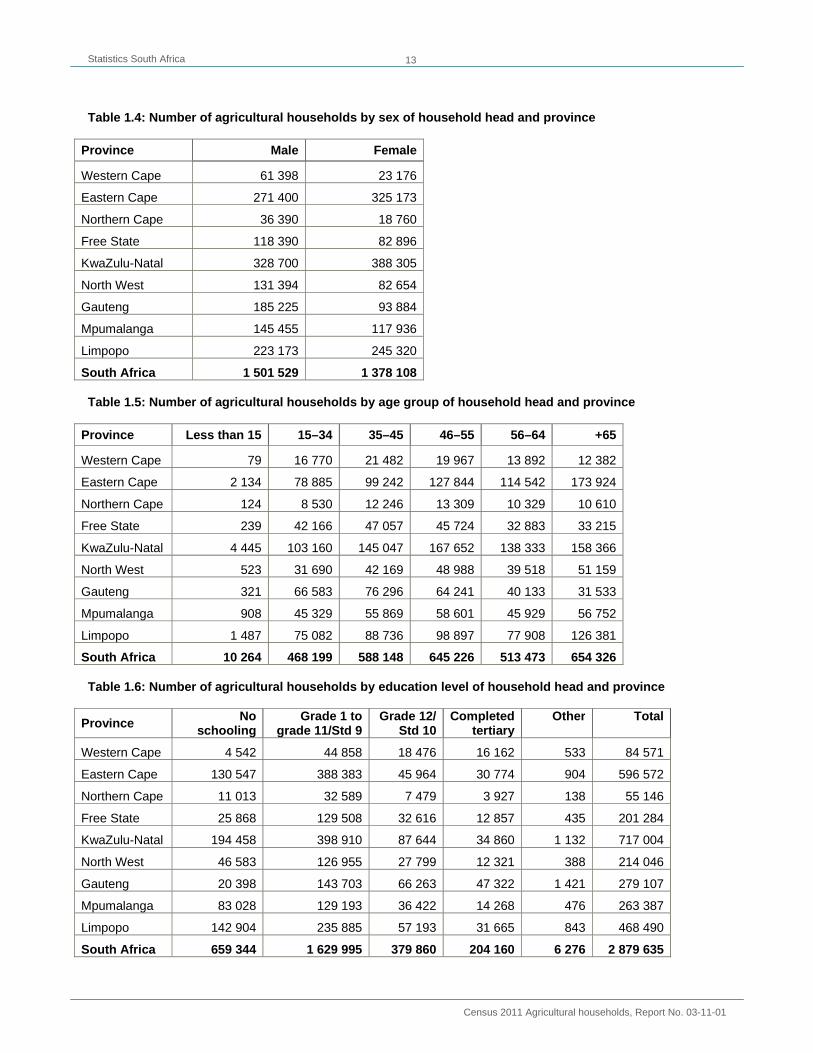
Table 1.4: Number of agricultural households by sex of household head and province
Province Male Female
Western Cape 61 398 23 176
Eastern Cape 271 400 325 173
Northern Cape 36 390 18 760
Free State 118 390 82 896
KwaZulu-Natal 328 700 388 305
North West 131 394 82 654
Gauteng 185 225 93 884
Mpumalanga 145 455 117 936
Limpopo 223 173 245 320
South Africa 1 501 529 1 378 108 Table 1.5: Number of agricultural households by age group of household head and province
Province Less than 15 15–34 35–45 46–55 56–64 +65
Western Cape 79 16 770 21 482 19 967 13 892 12 382
Eastern Cape 2 134 78 885 99 242 127 844 114 542 173 924
Northern Cape 124 8 530 12 246 13 309 10 329 10 610
Free State 239 42 166 47 057 45 724 32 883 33 215
KwaZulu-Natal 4 445 103 160 145 047 167 652 138 333 158 366
North West 523 31 690 42 169 48 988 39 518 51 159
Gauteng 321 66 583 76 296 64 241 40 133 31 533
Mpumalanga 908 45 329 55 869 58 601 45 929 56 752
Limpopo 1 487 75 082 88 736 98 897 77 908 126 381
South Africa 10 264 468 199 588 148 645 226 513 473 654 326 Table 1.6: Number of agricultural households by education level of household head and province
Province No schooling
Grade 1 tograde 11/Std 9
Grade 12/Std 10
Completed tertiary
Other Total
Western Cape 4 542 44 858 18 476 16 162 533 84 571
Eastern Cape 130 547 388 383 45 964 30 774 904 596 572
Northern Cape 11 013 32 589 7 479 3 927 138 55 146
Free State 25 868 129 508 32 616 12 857 435 201 284
KwaZulu-Natal 194 458 398 910 87 644 34 860 1 132 717 004
North West 46 583 126 955 27 799 12 321 388 214 046
Gauteng 20 398 143 703 66 263 47 322 1 421 279 107
Mpumalanga 83 028 129 193 36 422 14 268 476 263 387
Limpopo 142 904 235 885 57 193 31 665 843 468 490
South Africa 659 344 1 629 995 379 860 204 160 6 276 2 879 635
Statistics South Africa
Census 2011 Agricultural households, Report No. 03-11-01
14
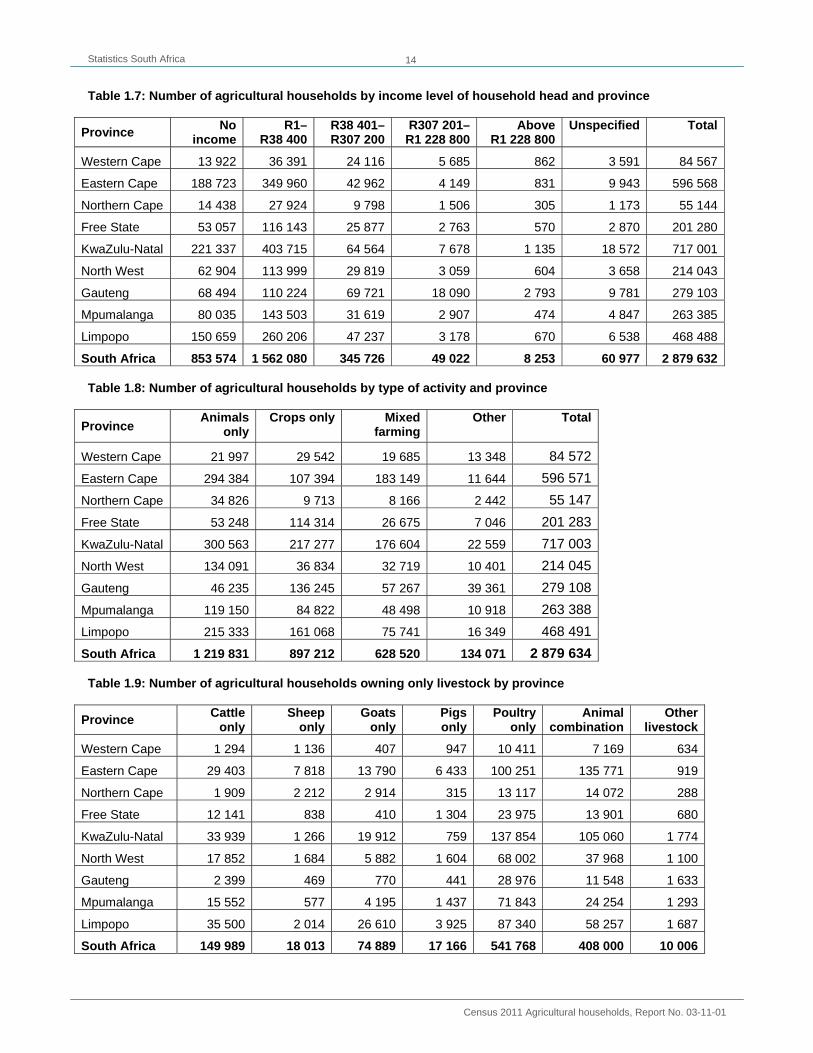
Table 1.7: Number of agricultural households by income level of household head and province
Province No income
R1– R38 400
R38 401–R307 200
R307 201–R1 228 800
AboveR1 228 800
Unspecified Total
Western Cape 13 922 36 391 24 116 5 685 862 3 591 84 567
Eastern Cape 188 723 349 960 42 962 4 149 831 9 943 596 568
Northern Cape 14 438 27 924 9 798 1 506 305 1 173 55 144
Free State 53 057 116 143 25 877 2 763 570 2 870 201 280
KwaZulu-Natal 221 337 403 715 64 564 7 678 1 135 18 572 717 001
North West 62 904 113 999 29 819 3 059 604 3 658 214 043
Gauteng 68 494 110 224 69 721 18 090 2 793 9 781 279 103
Mpumalanga 80 035 143 503 31 619 2 907 474 4 847 263 385
Limpopo 150 659 260 206 47 237 3 178 670 6 538 468 488
South Africa 853 574 1 562 080 345 726 49 022 8 253 60 977 2 879 632 Table 1.8: Number of agricultural households by type of activity and province
Province Animals
only Crops only Mixed
farmingOther Total
Western Cape 21 997 29 542 19 685 13 348 84 572 Eastern Cape 294 384 107 394 183 149 11 644 596 571 Northern Cape 34 826 9 713 8 166 2 442 55 147 Free State 53 248 114 314 26 675 7 046 201 283 KwaZulu-Natal 300 563 217 277 176 604 22 559 717 003 North West 134 091 36 834 32 719 10 401 214 045 Gauteng 46 235 136 245 57 267 39 361 279 108 Mpumalanga 119 150 84 822 48 498 10 918 263 388 Limpopo 215 333 161 068 75 741 16 349 468 491 South Africa 1 219 831 897 212 628 520 134 071 2 879 634 Table 1.9: Number of agricultural households owning only livestock by province
Province Cattleonly
Sheep only
Goatsonly
Pigsonly
Poultryonly
Animal combination
Otherlivestock
Western Cape 1 294 1 136 407 947 10 411 7 169 634
Eastern Cape 29 403 7 818 13 790 6 433 100 251 135 771 919
Northern Cape 1 909 2 212 2 914 315 13 117 14 072 288
Free State 12 141 838 410 1 304 23 975 13 901 680
KwaZulu-Natal 33 939 1 266 19 912 759 137 854 105 060 1 774
North West 17 852 1 684 5 882 1 604 68 002 37 968 1 100
Gauteng 2 399 469 770 441 28 976 11 548 1 633
Mpumalanga 15 552 577 4 195 1 437 71 843 24 254 1 293
Limpopo 35 500 2 014 26 610 3 925 87 340 58 257 1 687
South Africa 149 989 18 013 74 889 17 166 541 768 408 000 10 006
Statistics South Africa
Census 2011 Agricultural households, Report No. 03-11-01
15
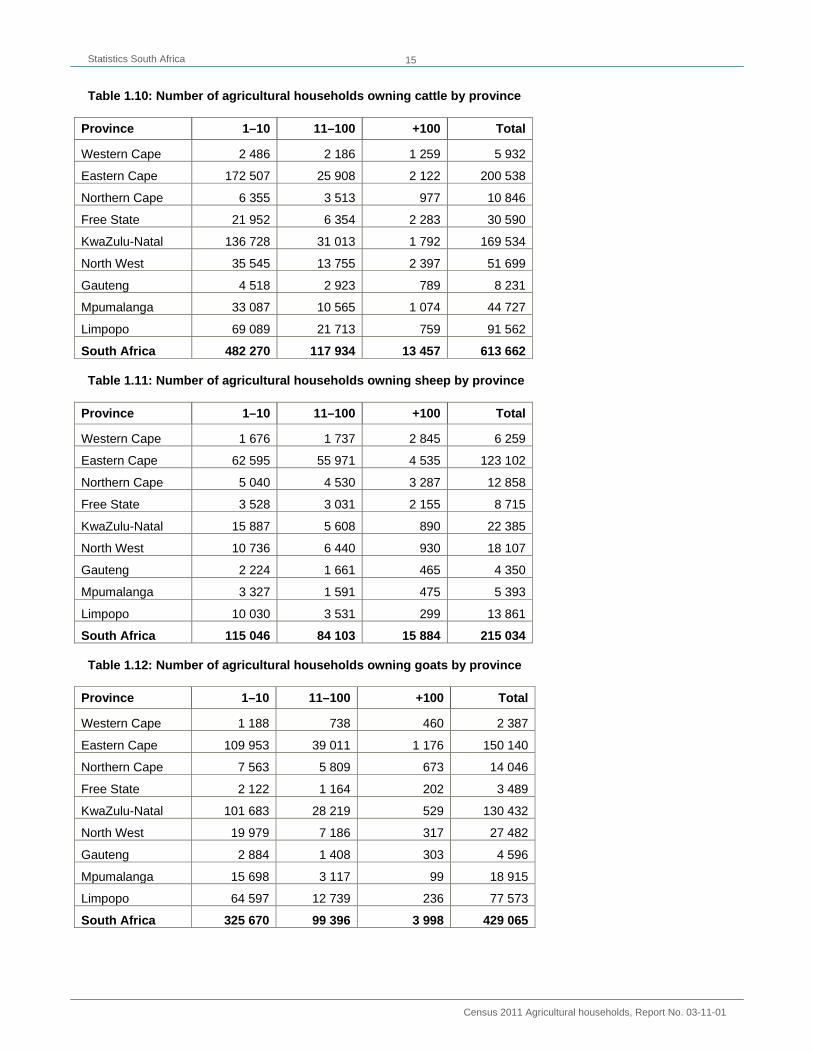
Table 1.10: Number of agricultural households owning cattle by province
Province 1–10 11–100 +100 Total
Western Cape 2 486 2 186 1 259 5 932
Eastern Cape 172 507 25 908 2 122 200 538
Northern Cape 6 355 3 513 977 10 846
Free State 21 952 6 354 2 283 30 590
KwaZulu-Natal 136 728 31 013 1 792 169 534
North West 35 545 13 755 2 397 51 699
Gauteng 4 518 2 923 789 8 231
Mpumalanga 33 087 10 565 1 074 44 727
Limpopo 69 089 21 713 759 91 562
South Africa 482 270 117 934 13 457 613 662 Table 1.11: Number of agricultural households owning sheep by province
Province 1–10 11–100 +100 Total
Western Cape 1 676 1 737 2 845 6 259
Eastern Cape 62 595 55 971 4 535 123 102
Northern Cape 5 040 4 530 3 287 12 858
Free State 3 528 3 031 2 155 8 715
KwaZulu-Natal 15 887 5 608 890 22 385
North West 10 736 6 440 930 18 107
Gauteng 2 224 1 661 465 4 350
Mpumalanga 3 327 1 591 475 5 393
Limpopo 10 030 3 531 299 13 861
South Africa 115 046 84 103 15 884 215 034 Table 1.12: Number of agricultural households owning goats by province
Province 1–10 11–100 +100 Total
Western Cape 1 188 738 460 2 387
Eastern Cape 109 953 39 011 1 176 150 140
Northern Cape 7 563 5 809 673 14 046
Free State 2 122 1 164 202 3 489
KwaZulu-Natal 101 683 28 219 529 130 432
North West 19 979 7 186 317 27 482
Gauteng 2 884 1 408 303 4 596
Mpumalanga 15 698 3 117 99 18 915
Limpopo 64 597 12 739 236 77 573
South Africa 325 670 99 396 3 998 429 065
Statistics South Africa
Census 2011 Agricultural households, Report No. 03-11-01
16
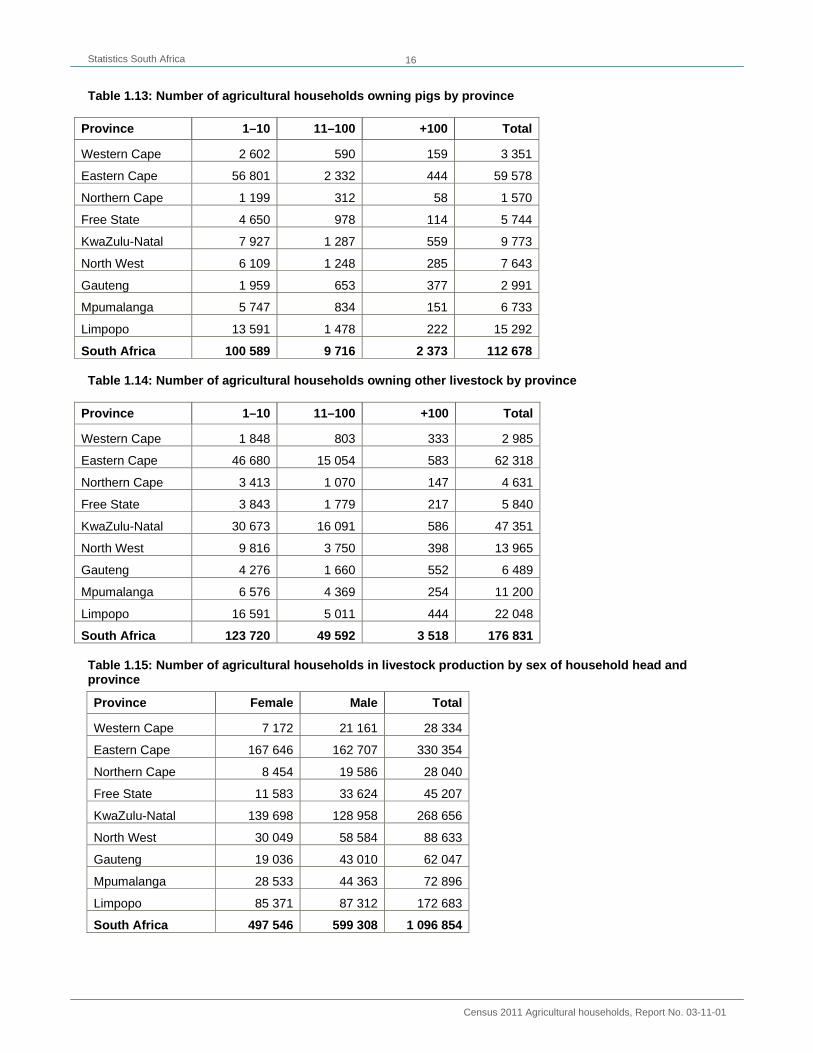
Table 1.13: Number of agricultural households owning pigs by province
Province 1–10 11–100 +100 Total
Western Cape 2 602 590 159 3 351
Eastern Cape 56 801 2 332 444 59 578
Northern Cape 1 199 312 58 1 570
Free State 4 650 978 114 5 744
KwaZulu-Natal 7 927 1 287 559 9 773
North West 6 109 1 248 285 7 643
Gauteng 1 959 653 377 2 991
Mpumalanga 5 747 834 151 6 733
Limpopo 13 591 1 478 222 15 292
South Africa 100 589 9 716 2 373 112 678 Table 1.14: Number of agricultural households owning other livestock by province
Province 1–10 11–100 +100 Total
Western Cape 1 848 803 333 2 985
Eastern Cape 46 680 15 054 583 62 318
Northern Cape 3 413 1 070 147 4 631
Free State 3 843 1 779 217 5 840
KwaZulu-Natal 30 673 16 091 586 47 351
North West 9 816 3 750 398 13 965
Gauteng 4 276 1 660 552 6 489
Mpumalanga 6 576 4 369 254 11 200
Limpopo 16 591 5 011 444 22 048
South Africa 123 720 49 592 3 518 176 831 Table 1.15: Number of agricultural households in livestock production by sex of household head and province
Province Female Male Total
Western Cape 7 172 21 161 28 334
Eastern Cape 167 646 162 707 330 354
Northern Cape 8 454 19 586 28 040
Free State 11 583 33 624 45 207
KwaZulu-Natal 139 698 128 958 268 656
North West 30 049 58 584 88 633
Gauteng 19 036 43 010 62 047
Mpumalanga 28 533 44 363 72 896
Limpopo 85 371 87 312 172 683
South Africa 497 546 599 308 1 096 854
Statistics South Africa
Census 2011 Agricultural households, Report No. 03-11-01
17
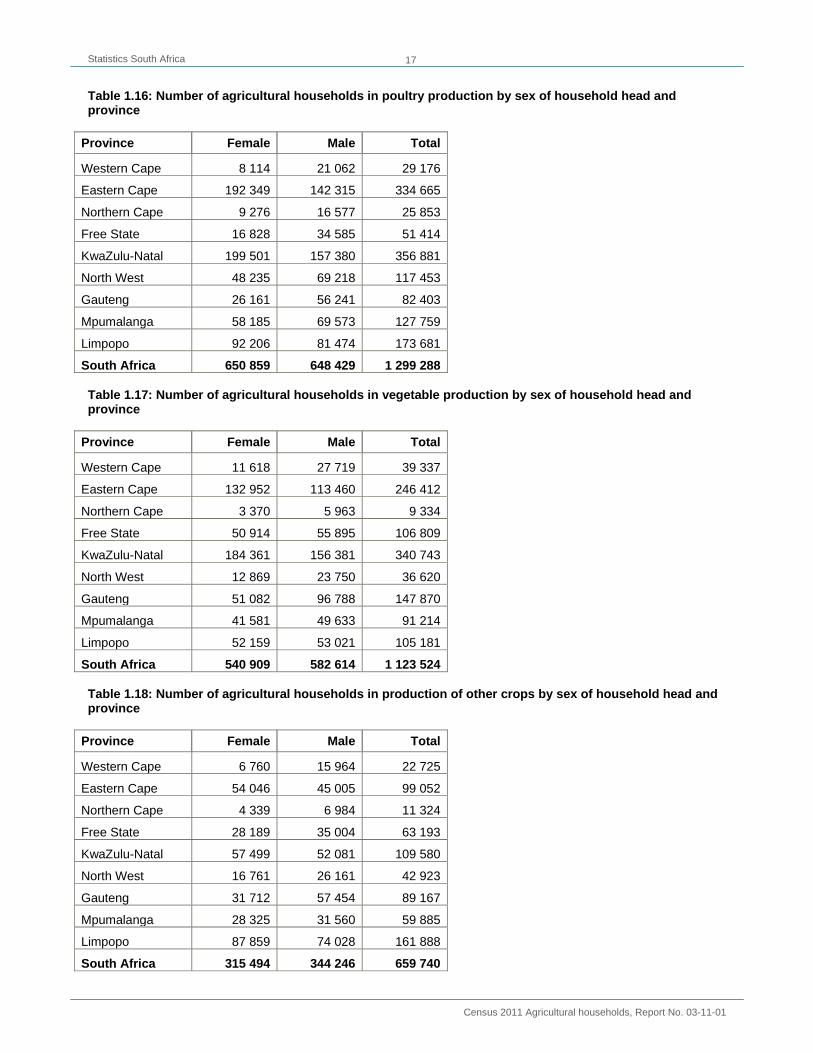
Table 1.16: Number of agricultural households in poultry production by sex of household head and province
Province Female Male Total
Western Cape 8 114 21 062 29 176
Eastern Cape 192 349 142 315 334 665
Northern Cape 9 276 16 577 25 853
Free State 16 828 34 585 51 414
KwaZulu-Natal 199 501 157 380 356 881
North West 48 235 69 218 117 453
Gauteng 26 161 56 241 82 403
Mpumalanga 58 185 69 573 127 759
Limpopo 92 206 81 474 173 681
South Africa 650 859 648 429 1 299 288 Table 1.17: Number of agricultural households in vegetable production by sex of household head and province
Province Female Male Total
Western Cape 11 618 27 719 39 337
Eastern Cape 132 952 113 460 246 412
Northern Cape 3 370 5 963 9 334
Free State 50 914 55 895 106 809
KwaZulu-Natal 184 361 156 381 340 743
North West 12 869 23 750 36 620
Gauteng 51 082 96 788 147 870
Mpumalanga 41 581 49 633 91 214
Limpopo 52 159 53 021 105 181
South Africa 540 909 582 614 1 123 524 Table 1.18: Number of agricultural households in production of other crops by sex of household head and province
Province Female Male Total
Western Cape 6 760 15 964 22 725
Eastern Cape 54 046 45 005 99 052
Northern Cape 4 339 6 984 11 324
Free State 28 189 35 004 63 193
KwaZulu-Natal 57 499 52 081 109 580
North West 16 761 26 161 42 923
Gauteng 31 712 57 454 89 167
Mpumalanga 28 325 31 560 59 885
Limpopo 87 859 74 028 161 888
South Africa 315 494 344 246 659 740
Statistics South Africa
Census 2011 Agricultural households, Report No. 03-11-01
18
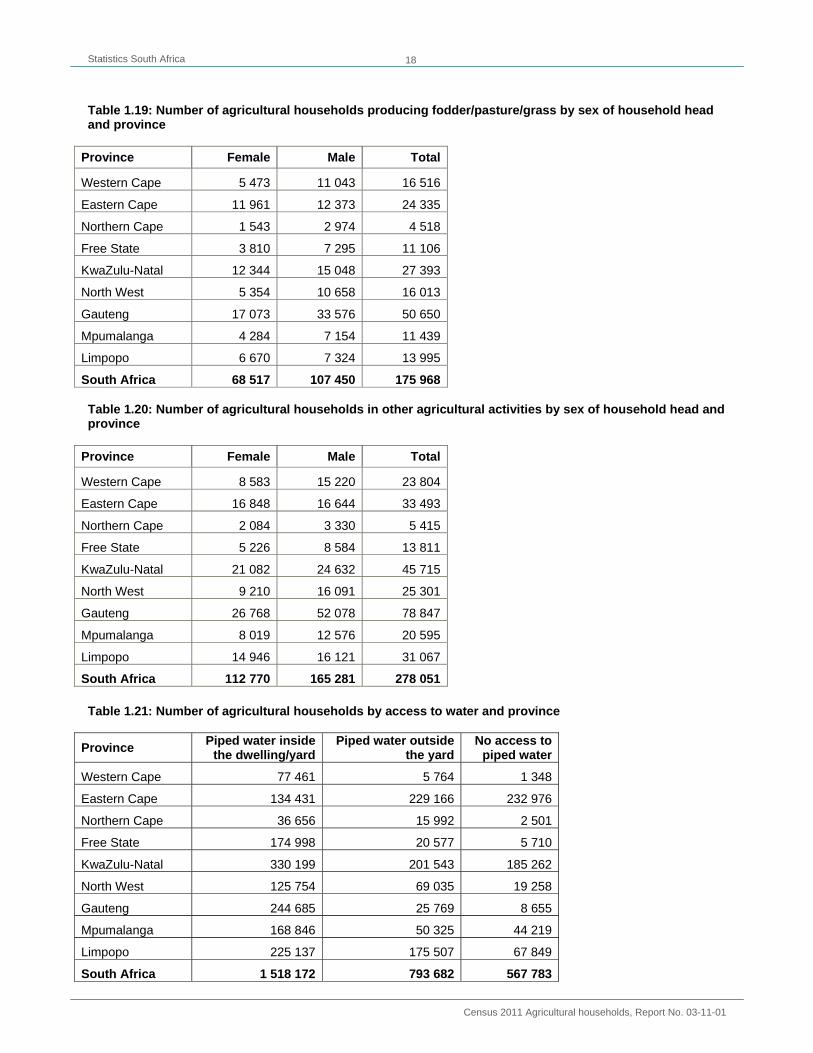
Table 1.19: Number of agricultural households producing fodder/pasture/grass by sex of household head and province
Province Female Male Total
Western Cape 5 473 11 043 16 516
Eastern Cape 11 961 12 373 24 335
Northern Cape 1 543 2 974 4 518
Free State 3 810 7 295 11 106
KwaZulu-Natal 12 344 15 048 27 393
North West 5 354 10 658 16 013
Gauteng 17 073 33 576 50 650
Mpumalanga 4 284 7 154 11 439
Limpopo 6 670 7 324 13 995
South Africa 68 517 107 450 175 968 Table 1.20: Number of agricultural households in other agricultural activities by sex of household head and province
Province Female Male Total
Western Cape 8 583 15 220 23 804
Eastern Cape 16 848 16 644 33 493
Northern Cape 2 084 3 330 5 415
Free State 5 226 8 584 13 811
KwaZulu-Natal 21 082 24 632 45 715
North West 9 210 16 091 25 301
Gauteng 26 768 52 078 78 847
Mpumalanga 8 019 12 576 20 595
Limpopo 14 946 16 121 31 067
South Africa 112 770 165 281 278 051 Table 1.21: Number of agricultural households by access to water and province
Province Piped water inside the dwelling/yard
Piped water outsidethe yard
No access topiped water
Western Cape 77 461 5 764 1 348
Eastern Cape 134 431 229 166 232 976
Northern Cape 36 656 15 992 2 501
Free State 174 998 20 577 5 710
KwaZulu-Natal 330 199 201 543 185 262
North West 125 754 69 035 19 258
Gauteng 244 685 25 769 8 655
Mpumalanga 168 846 50 325 44 219
Limpopo 225 137 175 507 67 849
South Africa 1 518 172 793 682 567 783
Statistics South Africa
Census 2011 Agricultural households, Report No. 03-11-01
19
Table 1.22: Number of agricultural households by main source of water and province
Province
Regional/ local water scheme
(operated by a Water Service Authority or
provider)
Borehole Spring Rain-water tank
Dam / pool / stagnant
water
River/stream Water tanker Other
Western Cape 63 555 8 087 2 459 1 759 3 877 2 259 1 081 1 493
Eastern Cape 229 669 33 685 35 768 48 046 21 009 189 543 22 752 16 098
Northern Cape 39 299 10 095 188 240 1 031 1 384 1 646 1 262
Free State 168 069 20 850 985 695 1 597 460 4 178 4 448
KwaZulu-Natal 389 782 72 207 35 992 9 715 24 655 119 863 34 806 29 981
North West 138 804 51 937 797 713 1 310 506 10 856 9 123
Gauteng 248 980 14 514 446 534 643 183 6 998 6 809
Mpumalanga 174 864 30 246 5 679 1 858 5 601 15 272 15 646 14 221
Limpopo 291 900 68 227 9 706 3 565 21 745 32 310 12 708 28 328
South Africa 1 744 926 309 851 92 024 67 127 81 473 361 785 110 677 111 771
Statistics South Africa
Census 2011 Agricultural households, Report No. 03-11-01
20
Table 1.23: Number of agricultural households by main type of toilet and province
Province Flush toilet Chemical
toiletPit latrine Bucket
latrineOther None
Western Cape 74 782 658 2 615 2 073 1 855 2 588
Eastern Cape 86 810 27 033 323 693 6 230 43 602 109 202
Northern Cape 28 147 371 19 486 1 822 912 4 409
Free State 100 800 2 411 77 724 10 219 3 681 6 448
KwaZulu-Natal 146 720 74 520 381 014 12 398 33 175 69 175
North West 60 820 2 083 135 779 1 289 2 989 11 085
Gauteng 215 428 2 977 50 117 4 115 3 305 3 166
Mpumalanga 61 446 4 213 172 128 2 098 5 328 18 174
Limpopo 51 456 3 906 376 973 2 395 6 794 26 967
South Africa 826 416 118 176 1 539 537 42 642 101 645 251 219
Statistics South Africa
Census 2011 Agricultural households, Report No. 03-11-01
21
Table 1.24: Number of agricultural households by type of energy, mainly used for lighting and province
Province Candle Electricity Gas Paraffin Solar None
Western Cape 2 939 78 913 194 1 705 650 170
Eastern Cape 129 642 397 512 1 696 61 322 4 282 2 116
Northern Cape 6 462 45 787 154 810 1 782 153
Free State 17 160 179 908 263 3 059 592 302
KwaZulu-Natal 227 958 467 303 3 055 6 861 6 701 5 125
North West 24 041 185 727 259 2 897 608 515
Gauteng 30 385 238 653 657 7 841 755 816
Mpumalanga 31 539 227 298 681 2 434 725 711
Limpopo 36 386 424 579 454 3 228 2 790 1 053
South Africa 506 517 2 245 684 7 417 90 162 18 889 10 966 Table 1.25: Number of agricultural households by type of energy, mainly used for cooking and province
Province Electricity Gas Paraffin Wood Coal Animal dung
Solar Other None
Western Cape 68 939 9 214 1 967 3 396 112 37 134 639 134
Eastern Cape 273 255 26 867 64 706 212 098 945 15 953 712 1 133 901
Northern Cape 38 172 4 311 1 837 10 061 151 196 252 63 103
Free State 164 008 6 468 13 078 12 922 2 508 1 607 270 176 246
KwaZulu-Natal 351 166 29 012 34 675 282 844 9 549 5 569 1 164 1 328 1 696
North West 150 639 5 408 13 809 41 346 535 1 631 263 152 262
Gauteng 220 390 14 189 34 374 4 534 2 666 173 460 1 975 345
Mpumalanga 149 333 4 495 8 307 83 119 16 143 1 177 304 106 404
Limpopo 179 704 6 634 9 214 267 494 3 604 915 355 72 498
South Africa 1 595 610 106 601 181 971 917 816 36 217 27 260 3 919 5 648 4 593
Statistics South Africa
Census 2011 Agricultural households, Report No. 03-11-01
22
Annexure 2: Terms and definitions Agriculture The growing of crops, the raising of livestock, and the utilisation of forestry and fishery resources. Agricultural household A household involved in agriculture. Census (population census) The process of counting the number of people, at a given point in time in a country, and collecting information about their demographic, social and economic characteristics. After data collection, the process includes the processing, analysis and dissemination of the information collected. Census night The night before census day. It is the decisive point of time for being included in the census (midnight on that night). Confidentiality A property of data indicating the extent to which their unauthorised disclosure could be prejudicial or harmful to the interest of the source or other relevant parties. De facto census A census in which people are enumerated according to where they were on census night. De jure census A census in which people are enumerated according to where they usually live. Enumeration area (EA) The smallest geographical unit (piece of land) into which the country is divided for census or survey purposes. EAs typically contain between 100 and 250 households. Each EA is expected to have clearly defined boundaries. Formal dwelling A structure built according to approved plans, i.e. house, on a separate stand, flat or apartment, townhouse, room in a backyard or rooms or flatlet elsewhere. Formal sector Sector of employment made up of all employing businesses that are registered in any way. Household A group of persons who live together and provide themselves jointly with food or other essentials for living, or a single person who lives alone. Note that a household is not necessarily the same as a family. Household head A person recognised as such by household, usually the main decision-maker, or the person who owns or rents the dwelling, or the person who is the main breadwinner. The head can either be male or female. If two people are equal decision-makers, the oldest can be named as the household head. Household income All receipts by all members of a household, in cash and in-kind, in exchange for employment, or in return for capital investment, or receipts obtained from other sources such as pension.
Statistics South Africa
Census 2011 Agricultural households, Report No. 03-11-01
23
Informal dwelling Makeshift structure not approved by a local authority and not intended as a permanent dwelling. Typically built with found materials (corrugated iron, cardboard, plastic, etc.). Contrasted with formal dwelling and traditional dwelling. Informal sector A subset of unincorporated enterprises comprising those that produce at least some output for the market; and are less than a specialised size in terms of the number of persons engaged or of employees employed on a continuous basis; and/or not registered under specific forms of national legislation, such as factories, or commercial acts, social security laws, professional groups’ regulatory acts, or similar acts, laws or regulations established by national legislative bodies. Labour force All employed and unemployed persons of working age. Livestock Livestock refers to domesticated animals (e.g. Cattle, sheep, goats, pigs and poultry) irrespective of the purpose of their breeding. Mixed farming A farming practice where both crops and livestock are raised by the farmer. Not economically active population. People who are not available for work such as full-time scholars and students, full-time homemakers, those who are retired and those who are unable or unwilling to work. Overcount The number of persons or households inadvertently counted twice in a census. Post-enumeration Survey A sample survey conducted immediately after a census to evaluate the census. Results are used to make adjustments for the census undercount or over count. Poultry The raising of domesticated birds such as chickens, turkeys, ducks, etc. for eggs, meat, skin, feathers and other products. Proxy A person who answers on behalf of another person (who is, for example, absent or ill). For a census, a proxy is the person that answered on behalf of other members of the household.
Reference period The period of time (day, week, month, or year) for which information is relevant. The reference period for Census 2011 was 9–10 October 2011. Respondents The person (or persons) responding in this interview should be a member (members) of the household and be in a position to answer the questions. This will preferably be any responsible adult. For the rest of the questionnaire the respondents should answer these questions for themselves, if possible. Sex Biological distinction between males and females. Traditional dwelling A dwelling made primarily of clay, mud, reeds or other locally available natural materials. This is a general term that includes huts, rondavels, etc. Such dwellings can be found as single units or in clusters. Undercount The number of people or households that were not counted in a census.
Statistics South Africa
Census 2011 Agricultural households, Report No. 03-11-01
24
Unspecified All cases whereby an answer was expected but was left blank during enumeration. Unoccupied dwelling A dwelling whose inhabitants are absent at the time of the visit or during the reference period, during a census or survey, e.g. respondents on holiday or migrant workers. Vegetable production The growing of crops such as cabbage, spinach, onions and tomatoes for human consumption. Note: For a complete list of concepts, refer to metadata document at www.statssa.gov.za.