agricultural marketing service, usda §43 agricultural marketing service, usda 43.106 (b) single...
TRANSCRIPT

231
Agricultural Marketing Service, USDA § 43.102
PART 43—STANDARDS FOR SAMPLING PLANS
DEFINITIONS
Sec. 43.101 Meaning of words. 43.102 Definitions.
SAMPLING PLANS
43.103 Purpose and scope. 43.104 Master table of single and double
sampling plans. 43.105 Operating characteristics (OC)
curves. 43.106 Choosing AQL’s and sampling plans.
AUTHORITY: Secs. 203, 205, 60 Stat. 1087, as amended, 1090, as amended; 7 U.S.C. 1622, 1624.
SOURCE: 29 FR 5870, May 5, 1964, unless oth-erwise noted. Redesignated at 42 FR 32514, June 27, 1977, and further redesignated at 46 FR 63203, Dec. 31, 1981.
DEFINITIONS
§ 43.101 Meaning of words.
Words used in this subpart in the sin-gular form shall be considered to im-part the plural, or vice versa, as the case may demand.
§ 43.102 Definitions.
Statistical and inspection or sam-pling terms and their respective defini-tions that are used in the sampling plans and operating characteristic curves of which are pertinent to the understanding of inspection by at-tributes follow:
Acceptable quality level (AQL). The AQL is expressed in terms of percent defective or defects per 100 units. Lots having a quality level equal to a speci-fied AQL will be accepted approxi-mately 95 percent of the time when using the sampling plans prescribed for that AQL.
Acceptance number (Ac). The number in a sampling plan that indicates the maximum number of defects or defectives permitted in a sample in order to consider a lot as meeting a specific requirement.
Acceptance sampling. The art or science that deals with procedures in which decisions to accept or reject lots or processes are based on the examina-tion of samples.
Attributes. Refers to the measurement of a given factor noting and recording the presence or absence of some char-acteristic (attribute) in each of the units in the group under consideration.
Consumer’s risk. The risk a consumer takes that a lot will be accepted by a sampling plan even though the lot does not conform to requirements. In the standards of this subpart this risk is nominally set at ten percent.
Consumer protection. The ability of a sampling plan to reject unacceptable supplies. This is measured as the com-plement of the probability of accept-ance (Pa) for the Limited Quality (LQ) lots. The consumer protection is 90 per-cent in these standards.
Defect. A failure to meet a require-ment imposed on a unit with respect to a single quality characteristic. A unit may contain more than one defect.
Defective. A defective unit; one con-taining one or more defects with re-spect to the quality characteristic(s) under consideration.
Inspection. The examination (includ-ing testing) of supplies (including, when appropriate, raw materials, com-ponents and intermediate assemblies).
(a) Acceptance inspection. An inspec-tion to determine conformance of sup-plies to specified requirements in order to accept or reject the supplies.
(b) Estimation inspection. In dealing with attributes, an inspection to deter-mine the amount of the supplies con-forming to a specified requirement— usually expressed as a percentage.
Inspection by attributes. Inspection whereby either the sample unit is clas-sified as defective or non-defective with respect to a requirement or set of requirements (when on a ‘‘defective’’ basis); or, inspection whereby the num-ber of defects in each sample unit is counted with respect to a requirement or set of requirements (when on a ‘‘de-fect’’ basis).
Limiting quality (LQ). The LQ is ex-pressed in terms of percent defective or defects per 100 units. Lots inspected under the standards of this subpart that have a ten percent probability of acceptance are referred to as a lot hav-ing a quality level equal to LQ.
Lot. A collection of units of the same size, type and style which has been
VerDate Mar<15>2010 15:24 Jan 12, 2013 Jkt 229013 PO 00000 Frm 00241 Fmt 8010 Sfmt 8010 Q:\07\7V2.TXT ofr150 PsN: PC150

232
7 CFR Ch. I (1–1–13 Edition) § 43.103
manufactured or processed under es-sentially the same conditions. The term shall mean ‘‘inspection lot,’’ i.e., a collection of units of product from which a sample is to be drawn and in-spected to determine conformance with the acceptability criteria. An inspec-tion lot may differ from a collection of units designated as a lot for other pur-poses (e.g., production lot, shipping lot, etc.).
Lot size. The number of units in the lot.
Operating characteristic curve (OC curve). A curve that gives the prob-ability of acceptance as a function of a specific lot quality level.
Probability of acceptance (Pa). For a given sampling plan and a given qual-ity of inspection lots, is that percent-age of inspection lots expected to be accepted.
Process capability. Performance of a process under normal operating condi-tions. The performance is measured with respect to specific characteristics.
Producer’s risk. The risk that a pro-ducer takes that a lot will be rejected by a sampling plan even though the lot conforms to requirements. In the standards of this subpart this risk is nominally set at five percent.
Random sampling. A process of select-ing a sample from a lot whereby each unit in the lot has an equal chance of being chosen. Ordinary haphazard choice is generally insufficient to guar-antee randomness. Devices such as ta-bles of random numbers are used to re-move subjective biases inherent in per-sonal choice.
Rejection number (Re). The number in a sampling plan that indicates the min-imum number of defects or defectives permitted in a sample that will cause a lot to fail a specific requirement.
Sample. Any number of sample units which are to be used for inspection.
Sample size. The number of sample units which are to be included in the sample.
Sample unit. A container, the entire contents of a container, a portion of the contents of a container, a com-posite mixture of a product, or any other unit of container or commodity to be used for inspection.
Sampling. The act of drawing or se-lecting sample units from a given lot.
Sampling plan. A specific plan which states the sample size(s), acceptance number(s) and rejection number(s). In the standards of this subpart two types of sampling plans are provided:
(a) Single sampling plan. A sampling inspection scheme in which a decision to accept or reject an inspection lot is based on the inspection of a single sam-ple. A single sampling plan consists of a single sample size with associated ac-ceptance and rejection number(s).
(b) Double sampling plan. A sampling inspection scheme which involves use of two independently drawn but related samples, a first sample (n1) and a sec-ond sample which is added to the first to form a total sample size (nt). A dou-ble sampling plan consists of a first and total sample size with associated acceptance and rejection number(s). In-spection of the first sample leads to a decision to accept, to reject, or to take a second sample and the examination of a second sample, when required, al-ways leads to a decision to accept or reject.
SAMPLING PLANS
§ 43.103 Purpose and scope.
(a) This subpart contains selected single and double sampling plans for inspection by attributes. They are to serve as a source of plans for devel-oping sound specifications, standards, or sampling and inspection procedures.
(b) The sampling plans of this sub-part and corresponding operating char-acteristic curves are indexed by accept-able quality level, AQL. The AQL’s ex-pressed in percent defectives or defects per hundred units are: 0.065 0.40 ............ 2.5 8.5 0.10 0.65 ............ 4.0 10.0 0.15 1.0 .............. 5.0 12.5 0.25 1.5 .............. 6.5 15.0
§ 43.104 Master table of single and double sampling plans.
(a) In the master table, a sampling plan is selected by first determining the sample size or sizes and AQL to be used. Then find the applicable accept-ance (Ac) and rejection (Re) numbers at the intersection of the sample size(s) row and AQL column. These numbers together with the sample size or sizes constitute a sampling plan.
VerDate Mar<15>2010 15:24 Jan 12, 2013 Jkt 229013 PO 00000 Frm 00242 Fmt 8010 Sfmt 8010 Q:\07\7V2.TXT ofr150 PsN: PC150

233
Agricultural Marketing Service, USDA § 43.106
(b) Single sampling plans having a sample size of 66 or greater and an ac-ceptance number of 1 are not included in the Master Table. These plans are listed in the tables which supplement the Master Table and accompany the OC curves as indexes to the comparable double sampling plans. The use of these single sampling plans do not facilitate the practice of using two or more AQL’s simultaneously with the same sample size.
§ 43.105 Operating characteristics (OC) curves.
The OC curves shows the ability of the various sampling plans, presented for each AQL, to distinguish between lots of different quality.
§ 43.106 Choosing AQL’s and sampling plans.
(a) The selection of AQL’s and sam-pling plans for given lot sizes depends on too many factors to permit the issuance of a ‘‘pre-selected’’ standard set of plans for specified lot sizes. Each user of the standards of this subpart should select AQL’s and sampling plans that are tailored to best meet his needs.
(b) Some of the factors that must be considered prior to selecting the AQL’s are:
(1) Class of defects such as major and minor: Major defects would generally require lower AQL’s than those for minor defects;
(2) Process capabilities under good commercial practice with respect to the defects in question: For example, if under normal production processes, the defect level cannot be kept below 2.0 percent defective, the selection of an AQL of 0.15 percent defective, although desirable for the defects in question, may not be practical;
(3) Consumer preferences: These may require higher AQL’s or permit lower
AQL’s than process capabilities would indicate; and
(4) Time and cost required to sample and inspect a lot under various AQL’s: The smaller the AQL the more time and cost of inspection.
(c) Some of the factors that may be considered prior to selecting the sam-pling plans for given lot sizes are:
(1) The applicable AQL(s): The AQL dictates, among other things, the smallest sample size that can be used and the size of the ‘‘jumps’’ from one sample size to the next larger one;
(2) The relative ability of the plans to discriminate between ‘‘good’’ and ‘‘bad’’ lots: Although several plans in these standards have the same AQL, they differ in their ability to reject lots worse than the AQL’s. The OC curve in the standards of this subpart provide the basis for determining the discriminating ability of each plan;
(3) The amount, time, and cost of sampling required;
(4) The size and value of the lots rel-ative to the producer and consumer protection a sampling plan affords: One may be willing to take larger risks of passing ‘‘bad’’ lots that are small or of lesser value than they would for larger more valuable lots;
(5) The knowledge about the lot(s) to be submitted for inspection: Lots con-sisting of product produced under es-sentially the same conditions may re-quire smaller sample sizes than those consisting of product produced by dif-ferent shifts and different raw stock for example; and
(6) The record of the quality level of previously submitted lots: The sample size can be smaller for lots submitted from a supplier with a consistent record of quality levels significantly better than the specified AQL(s) than sample sizes for the supplier whose records show considerable variability in quality, ‘‘borderline’’ supplies or product worse than the AQL.
VerDate Mar<15>2010 15:24 Jan 12, 2013 Jkt 229013 PO 00000 Frm 00243 Fmt 8010 Sfmt 8010 Q:\07\7V2.TXT ofr150 PsN: PC150

234
7 CFR Ch. I (1–1–13 Edition) § 43.106
MA
ST
ER
TA
BLE
OF
SIN
GLE
AN
DD
OU
BLE
SA
MP
LIN
GP
LAN
S1
Sam
ple
size
co
de le
tter
Sam
ple
size
Acc
epta
ble
qual
ity le
vels
0.06
5 0.
10
0.15
0.
25
0.40
0.
65
1.0
1.5
2.5
4.0
5.0
6.5
8.5
10.0
12
.5
15.0
Ac
Re
Ac
Re
Ac
Re
Ac
Re
Ac
Re
Ac
Re
Ac
Re
Ac
Re
Ac
Re
Ac
Re
Ac
Re
Ac
Re
Ac
Re
Ac
Re
Ac
Re
Ac
Re
AA
......
......
.n 1
=1
......
.....
......
......
......
......
......
......
......
......
......
......
......
......
......
......
......
......
......
......
......
......
......
......
......
......
......
......
......
......
......
......
....
01
A...
......
......
.n 1
=2
......
.....
......
......
......
......
......
......
......
......
......
......
......
......
......
......
......
......
......
......
......
......
......
......
......
......
......
......
01
B...
......
......
.n 1
=3
......
.....
......
......
......
......
......
......
......
......
......
......
......
......
......
......
......
......
......
......
......
......
......
......
01
......
......
......
......
03
12
n t=
8...
......
.....
......
......
......
......
......
......
......
......
......
......
......
......
......
......
......
......
......
......
......
......
......
......
......
......
......
......
......
...2
3 C
......
......
....
n 1=
4...
......
.....
......
......
......
......
......
......
......
......
......
......
......
......
......
......
......
......
......
......
......
...0
1 ...
......
......
......
...1
2 D
......
......
....
n 1=
5...
......
.....
......
......
......
......
......
......
......
......
......
......
......
......
......
......
......
......
......
...0
1 ...
......
......
......
...1
2 E
......
......
....
n 1=
6...
......
.....
......
......
......
......
......
......
......
......
......
......
......
......
......
......
......
......
......
......
......
......
......
...1
2 ...
......
......
......
......
......
......
.2
3 E
E...
......
....
n 1=
7...
......
.....
......
......
......
......
......
......
......
......
......
......
......
......
......
......
......
......
......
......
......
......
......
......
......
......
......
......
......
...2
3 F
......
......
....
n 1=
9...
......
.....
......
......
......
......
......
......
......
......
......
......
......
......
......
......
......
...0
1 ...
......
...1
2 ...
......
......
......
...2
3 ...
......
......
.3
4 G
......
......
...n 1
=11
......
......
......
......
......
......
......
......
......
......
......
......
......
......
......
......
......
......
......
...1
2 ...
......
......
......
...2
3 ...
......
...3
4 H
......
......
....
n 1=
13...
......
......
......
......
......
......
......
......
......
......
......
......
......
......
......
01
......
......
......
......
......
......
23
......
......
34
......
......
....
45
J...
......
......
.n 1
=21
......
......
......
......
......
......
......
......
......
......
......
......
......
...0
1 0
2 0
2 2
3 1
4 3
4 3
5 4
5 5
6 6
7 n t
=31
......
......
......
......
......
......
......
......
......
......
......
......
......
......
......
...1
2 2
3 ...
......
...3
4 ...
......
...5
6 K
......
......
....
n 1=
29...
......
......
......
......
......
......
......
......
......
......
......
01
02
12
23
14
34
45
37
56
67
78
n t=
65...
......
......
......
......
......
......
......
......
......
......
......
......
......
12
......
......
......
......
67
......
......
......
......
910
L
......
......
....
n 1=
48...
.....
......
......
......
......
......
......
......
......
01
02
12
23
34
45
56
67
78
89
1011
11
12
n t=
72...
......
......
......
......
......
......
......
......
......
......
......
12
M...
......
......
n 1=
84...
.....
......
......
......
......
......
......
01
02
03
23
34
45
67
78
910
11
12
1314
15
16
1819
n t
=12
0...
....
......
......
......
......
......
......
......
......
12
n t=
132
......
....
......
......
......
......
......
......
......
......
......
...2
3 N
......
......
....
n 1=
126
......
....
......
......
......
...0
1 0
2 0
3 2
3 3
4 4
5 6
7 9
10
1011
13
14
1617
18
19
2223
26
27
n t=
180
......
....
......
......
......
......
......
...1
2 n t
=21
0...
....
......
......
......
......
......
......
......
......
23
P...
......
......
.n 1
=20
0...
....
......
......
01
02
03
23
34
45
67
910
13
14
1516
19
20
2425
27
28
3334
39
40
n t=
284
......
....
......
......
......
...1
2 n t
=32
6...
....
......
......
......
......
......
......
23
Q...
......
......
n 1=
315
......
.0
1 0
2 0
23
34
45
67
89
1314
19
20
2223
28
29
3536
41
42
5051
59
60
n t=
435
......
....
......
...1
2 n t
=51
9...
....
......
......
......
......
23
R...
......
......
.n 1
=50
0...
....
02
03
23
34
45
67
910
12
13
1819
28
29
3334
42
43
5354
62
63
7677
90
91
n t=
644
......
.1
2 n t
=83
6...
....
......
......
23
S...
......
......
.n 1
=80
0...
....
03
23
34
45
67
910
13
14
1819
27
28
4243
50
510
6465
82
83
9596
11
711
8 14
014
1 n t
=13
04...
..2
3 T
......
......
....
n 1=
1250
.....
23
34
45
67
910
13
14
1920
26
27
4142
63
64
7677
U
......
......
....
n 1=
2000
.....
34
45
67
910
13
14
1920
28
29
3940
62
63
9697
1D
oubl
e pl
ans
are
indi
cate
d by
2 s
ampl
e si
zes,
n1
(firs
t) a
nd n
t(t
otal
).A
c=A
ccep
tanc
e nu
mbe
rR
e=R
ejec
tion
num
ber.
VerDate Mar<15>2010 15:24 Jan 12, 2013 Jkt 229013 PO 00000 Frm 00244 Fmt 8010 Sfmt 8010 Q:\07\7V2.TXT ofr150 PsN: PC150

235
Agricultural Marketing Service, USDA § 43.106
SAMPLING PLANS AND OPERATING CHARACTERISTIC (OC) CURVES FOR AQL=0.065 PERCENT DEFECTIVE (OR AQL=0.065 DEFECTS PER HUNDRED UNITS)
[Sampling plans—AQL=0.065]
Comparable sampling plans
Identification letter of OC curve
Q R S, T U
nc Ac Re nc Ac Re nc Ac Re nc Ac Re
Single .................................................. 315 0 1 624 1 2 1250 2 3 2,000 3
Double ................................................ ........ ........ ........ 500 0 2 800 0 3 ........ ........ ........ 644 1 2 1304 2 3
nc=Cumulative sample size. Ac=Acceptance number. Re=Rejection number.
VerDate Mar<15>2010 15:24 Jan 12, 2013 Jkt 229013 PO 00000 Frm 00245 Fmt 8010 Sfmt 8006 Q:\07\7V2.TXT ofr150 PsN: PC150 EC
02S
E91
.023
</G
PH
>

236
7 CFR Ch. I (1–1–13 Edition) § 43.106
SAMPLING PLANS AND OPERATING CHARACTERISTIC (OC) CURVES FOR AQL=0.10 PERCENT DEFECTIVE (OR AQL=0.10 DEFECTS PER HUNDRED UNITS)
[Sampling plans—AQL=0.10]
Comparable sampling plans
Identification letter of OC curve
P Q R, S T U
nc Ac Re nc Ac Re nc Ac Re nc Ac Re nc Ac Re
Single .................................. 200 0 1 408 1 2 800 2 3 1,250 3 4 2,000 4
Double ................................ ......... .... .... 315 0 2 500 0 3 ......... .... .... 435 1 2 836 2 3
nc=Cumulative sample size. Ac=Acceptance number. Re=Rejection number.
VerDate Mar<15>2010 15:24 Jan 12, 2013 Jkt 229013 PO 00000 Frm 00246 Fmt 8010 Sfmt 8006 Q:\07\7V2.TXT ofr150 PsN: PC150 EC
02S
E91
.024
</G
PH
>

237
Agricultural Marketing Service, USDA § 43.106
SAMPLING PLANS AND OPERATING CHARACTERISTIC (OC) CURVES FOR AQL=0.15 PERCENT DEFECTIVE (OR AQL=0.15 DEFECTS PER HUNDRED UNITS)
[Sampling plans—AQL=0.15]
Comparable sampling plans
Identification letter of OC curve
N P Q R, S T U
nc Ac Re nc Ac Re nc Ac Re nc Ac Re nc Ac Re nc Ac Re
Single ........................... 126 0 1 264 1 2 500 2 3 800 3 4 1,250 4 5 2,000 6 7
Double ......................... ...... .... .... 200 0 2 315 0 3 ...... .... .... 284 1 2 519 2 3
nc=Cumulative sample size. Ac=Acceptance number. Re=Rejection number.
VerDate Mar<15>2010 15:24 Jan 12, 2013 Jkt 229013 PO 00000 Frm 00247 Fmt 8010 Sfmt 8006 Q:\07\7V2.TXT ofr150 PsN: PC150 EC
02S
E91
.025
</G
PH
>

238
7 CFR Ch. I (1–1–13 Edition) § 43.106
SAMPLING PLANS AND OPERATING CHARACTERISTIC (OC) CURVES FOR AQL=0.25 DEFECTS PER HUNDRED UNITS
[Sampling plans—AQL=0.25]
Com-parable
sampling plans
Identification letter of OC curve
M N P, Q R S T U
nc Ac Re nc Ac Re nc Ac Re nc Ac Re nc Ac Re nc Ac Re nc Ac Re
Single ...... 84 0 1 168 1 2 315 2 3 500 3 4 800 4 5 1250 6 7 2000 9 10
Double .... .... .... .... 126 0 2 200 0 3 .... .... .... 180 1 2 326 2 3
nc=Cumulative sample size. Ac=Acceptance number. Re=Rejection number.
VerDate Mar<15>2010 15:24 Jan 12, 2013 Jkt 229013 PO 00000 Frm 00248 Fmt 8010 Sfmt 8006 Q:\07\7V2.TXT ofr150 PsN: PC150 EC
02S
E91
.026
</G
PH
>

239
Agricultural Marketing Service, USDA § 43.106
SAMPLING PLANS AND OPERATING CHARACTERISTIC (OC) CURVES FOR AQL=0.40 PERCENT DEFECTIVE (OR AQL=0.40 DEFECTS PER HUNDRED UNITS)
[Sampling plans—AQL=0.40]
Com-parable
sampling plans
Identification letter of OC curve
L M N, P Q R S T U
nc Ac Re nc Ac Re nc Ac Re nc Ac Re nc Ac Re nc Ac Re nc Ac Re nc Ac Re
Single ....... 48 0 1 108 1 2 200 2 3 315 3 4 500 4 5 800 6 7 1250 9 10 2000 13 10
Double ..... .... .... .... 84 0 2 126 0 3 .... .... .... 120 1 2 210 2 3
nc=Cumulative sample size. Ac=Acceptance number. Re=Rejection number.
VerDate Mar<15>2010 15:24 Jan 12, 2013 Jkt 229013 PO 00000 Frm 00249 Fmt 8010 Sfmt 8006 Q:\07\7V2.TXT ofr150 PsN: PC150 EC
02S
E91
.027
</G
PH
>

240
7 CFR Ch. I (1–1–13 Edition) § 43.106
SAMPLING PLANS AND OPERATING CHARACTERISTIC (OC) CURVES FOR AQL=0.65 PERCENT DEFECTIVE (OR AQL=0.65 DEFECTS PER HUNDRED UNITS)
[Sampling plans—AQL=0.65]
Comparable sam-pling plans
Identification letter of OC curve
K L M, N P Q R S T U
nc Ac Re nc Ac Re nc Ac Re nc Ac Re nc Ac Re nc Ac Re nc Ac Re nc Ac Re nc Ac Re
Single ................. 29 0 1 66 1 2 126 2 3 200 3 4 315 4 5 500 6 7 800 9 10 1250 13 14 2000 19 20
Double ................ .... .... .... 48 0 2 84 0 3 .... .... .... 72 1 2 132 2 3
nc=Cumulative sample size. Ac=Acceptance number. Re=Rejection number.
VerDate Mar<15>2010 15:24 Jan 12, 2013 Jkt 229013 PO 00000 Frm 00250 Fmt 8010 Sfmt 8006 Q:\07\7V2.TXT ofr150 PsN: PC150 EC
02S
E91
.028
</G
PH
>

241
Agricultural Marketing Service, USDA § 43.106
SAMPLING PLANS AND OPERATING CHARACTERISTIC (OC) CURVES FOR AQL=1.0 PERCENT DEFECTIVE (OR AQL=1.0 DEFECTS PER HUNDRED UNITS)
[Sampling plans—AQL=1.0]
Comparable sampling plans
Identification letter of OC curve
J K, L M N P
nc Ac Re nc Ac Re nc Ac Re nc Ac Re nc Ac Re
Single .................................. 21 0 1 48 1 2 84 2 3 126 3 4 200 4 5
Double ................................ ............ .... .... 29 0 2 ............ .... .... 65 1 2 ............ .... .... .............. .... .... .............. .... ....
Q R S T U
nc Ac Re nc Ac Re nc Ac Re nc Ac Re nc Ac Re
Single .................................. 315 6 7 500 9 10 800 13 14 1250 19 20 2000 28 29
nc=Cumulative sample size. Ac=Acceptance number. Re=Rejection number.
VerDate Mar<15>2010 15:24 Jan 12, 2013 Jkt 229013 PO 00000 Frm 00251 Fmt 8010 Sfmt 8006 Q:\07\7V2.TXT ofr150 PsN: PC150 EC
02S
E91
.029
</G
PH
>

242
7 CFR Ch. I (1–1–13 Edition) § 43.106
SAMPLING PLANS AND OPERATING CHARACTERISTIC (OC) CURVES FOR AQL=1.5 PERCENT DEFECTIVE (OR AQL=1.5 DEFECTS PER HUNDRED UNITS)
[Sampling plans—AQL=1.5]
Comparable sampling plans
Identification letter of OC curve
H J, K L M N P
nc Ac Re nc Ac Re nc Ac Re nc Ac Re nc Ac Re nc Ac Re
Single .................................. 13 0 1 29 1 2 48 2 3 84 3 4 126 4 5 200 6 7
Double ................................ .... .... .... 21 0 2 .... .... .... 31 1 2 .... .... .... .... .... .... ..................... .... .... ..................... .... ....
Q R S T U
nc Ac Re nc Ac Re nc Ac Re nc Ac Re nc Ac Re
Single .................................. 315 8 9 500 12 13 800 18 19 1,250 26 27 2,000 39 40
nc=Cumulative sample size. Ac=Acceptance number. Re=Rejection number.
VerDate Mar<15>2010 15:24 Jan 12, 2013 Jkt 229013 PO 00000 Frm 00252 Fmt 8010 Sfmt 8006 Q:\07\7V2.TXT ofr150 PsN: PC150 EC
02S
E91
.030
</G
PH
>
243
Agricultural Marketing Service, USDA § 43.106
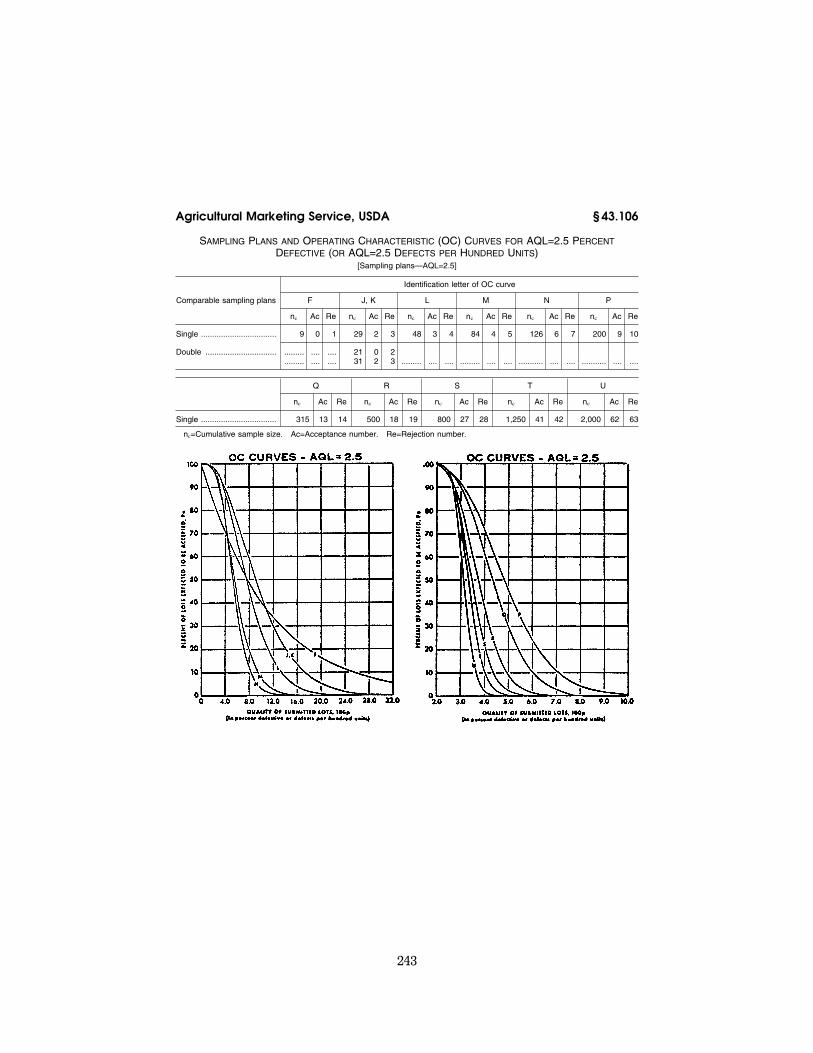
SAMPLING PLANS AND OPERATING CHARACTERISTIC (OC) CURVES FOR AQL=2.5 PERCENT DEFECTIVE (OR AQL=2.5 DEFECTS PER HUNDRED UNITS)
[Sampling plans—AQL=2.5]
Comparable sampling plans
Identification letter of OC curve
F J, K L M N P
nc Ac Re nc Ac Re nc Ac Re nc Ac Re nc Ac Re nc Ac Re
Single .................................. 9 0 1 29 2 3 48 3 4 84 4 5 126 6 7 200 9 10
Double ................................ ......... .... .... 21 0 2 ......... .... .... 31 2 3 ......... .... .... ......... .... .... ........... .... .... ........... .... ....
Q R S T U
nc Ac Re nc Ac Re nc Ac Re nc Ac Re nc Ac Re
Single .................................. 315 13 14 500 18 19 800 27 28 1,250 41 42 2,000 62 63
nc=Cumulative sample size. Ac=Acceptance number. Re=Rejection number.
VerDate Mar<15>2010 15:24 Jan 12, 2013 Jkt 229013 PO 00000 Frm 00253 Fmt 8010 Sfmt 8006 Q:\07\7V2.TXT ofr150 PsN: PC150 EC
02S
E91
.031
</G
PH
>

244
7 CFR Ch. I (1–1–13 Edition) § 43.106
SAMPLING PLANS AND OPERATING CHARACTERISTIC (OC) CURVES FOR AQL=4.0 PERCENT DEFECTIVE (OR AQL=4.0 DEFECTS PER HUNDRED UNITS)
[Sampling plans—AQL=4.0]
Comparable sampling plans
Identification letter of OC curve
D G J K L M N
nc Ac Re nc Ac Re nc Ac Re nc Ac Re nc Ac Re nc Ac Re
Single .................................. 5 0 1 11 1 2 21 2 3 48 4 5 84 6 7 126 9 10 Double ................................ ......... .... .... ......... .... .... ......... .... .... 29 1 4
......... .... .... ......... .... .... ......... .... .... 65 6 7 ........... .... .... ........... .... ....
P Q R S T U
nc Ac Re nc Ac Re nc Ac Re nc Ac Re nc Ac Re nc Ac Re
Single ............................... 200 13 14 315 19 20 500 28 29 800 42 43 1250 63 64 2000 96
nc=Cumulative sample size. Ac=Acceptance number. Re=Rejection number.
VerDate Mar<15>2010 15:24 Jan 12, 2013 Jkt 229013 PO 00000 Frm 00254 Fmt 8010 Sfmt 8006 Q:\07\7V2.TXT ofr150 PsN: PC150 EC
02S
E91
.032
</G
PH
>

245
Agricultural Marketing Service, USDA § 43.106
SAMPLING PLANS AND OPERATING CHARACTERISTIC (OC) CURVES FOR AQL=5.0 PERCENT DEFECTIVE (OR AQL=5.0 DEFECTS PER HUNDRED UNITS)
[Sampling plans—AQL=5.0]
Comparable sampling plans
Identification letter of OC curve
C F J, K L M N
nc Ac Re nc Ac Re nc Ac Re nc Ac Re nc Ac Re nc Ac Re
Single .................................. 4 0 1 1 1 2 29 3 4 48 5 6 84 7 8 126 10 11
Double ................................ .... .... .... .... .... .... 21 1 4 .... .... .... .... .... .... 31 3 4 .... .... .... ........... .... .... ......... .... ....
P Q R S T
nc Ac Re nc Ac Re nc Ac Re nc Ac Re nc Ac Re
Single .................................. 200 15 16 315 22 23 500 33 34 800 50 51 1250 76 77
nc=Cumulative sample size. Ac=Acceptance number. Re=Rejection number.
VerDate Mar<15>2010 15:24 Jan 12, 2013 Jkt 229013 PO 00000 Frm 00255 Fmt 8010 Sfmt 8006 Q:\07\7V2.TXT ofr150 PsN: PC150 EC
02S
E91
.033
</G
PH
>

246
7 CFR Ch. I (1–1–13 Edition) § 43.106
SAMPLING PLANS AND OPERATING CHARACTERISTIC (OC) CURVES FOR AQL=6.5 PERCENT DEFECTIVE (OR AQL=6.5 DEFECTS PER HUNDRED UNITS)
[Sampling plans—AQL=6.5]
Comparable sampling plans
Identification letter of OC curve
B E H J K L
nc Ac Re nc Ac Re nc Ac Re nc Ac Re nc Ac Re nc Ac Re
Single .................................. 3 0 1 6 1 2 13 2 3 21 3 4 29 4 5 48 6 7
M N P Q R S
nc Ac Re nc Ac Re nc Ac Re nc Ac Re nc Ac Re nc Ac Re
Single .................................. 84 9 10 126 13 14 200 19 20 315 28 29 500 42 43 800 64 65
nc=Cumulative sample size. Ac=Acceptance number. Re=Rejection number.
VerDate Mar<15>2010 15:24 Jan 12, 2013 Jkt 229013 PO 00000 Frm 00256 Fmt 8010 Sfmt 8006 Q:\07\7V2.TXT ofr150 PsN: PC150 EC
02S
E91
.034
</G
PH
>

247
Agricultural Marketing Service, USDA § 43.106
SAMPLING PLANS AND OPERATING CHARACTERISTIC (OC) CURVES FOR AQL=8.5 PERCENT DEFECTIVE (OR AQL=8.5 DEFECTS PER HUNDRED UNITS)
[Sampling plans—AQL=8.5]
Comparable sampling plans
Identification letter of OC curve
D G J K, L M
nc Ac Re nc Ac Re nc Ac Re nc Ac Re nc Ac Re
Single .................................. 5 1 2 11 2 3 24 4 5 48 7 8 84 11 1
Double ................................ ........... .... .... ........... .... .... 21 3 5 29 3 7 ........... .... .... ........... .... .... 31 5 6 65 9 10
N P Q R S
nc Ac Re nc Ac Re nc Ac Re nc Ac Re nc Ac Re
Single .................................. 126 16 17 200 24 25 315 35 36 500 53 54 800 82 83
nc=Cumulative sample size. Ac=Acceptance number. Re=Rejection number.
VerDate Mar<15>2010 15:24 Jan 12, 2013 Jkt 229013 PO 00000 Frm 00257 Fmt 8010 Sfmt 8006 Q:\07\7V2.TXT ofr150 PsN: PC150 EC
02S
E91
.035
</G
PH
>

248
7 CFR Ch. I (1–1–13 Edition) § 43.106
SAMPLING PLANS AND OPERATING CHARACTERISTIC (OC) CURVES FOR AQL=10.0 PERCENT DEFECTIVE (OR AQL=10.0 DEFECTS PER HUNDRED UNITS)
[Sampling plans—AQL=10.0]
Comparable sam-pling plans
Identification letter of OC curve
A C F H J K L
nc Ac Re nc Ac Re nc Ac Re nc Ac Re nc Ac Re nc Ac Re nc Ac Re
Single ...................... 2 0 1 4 1 2 9 2 3 13 3 4 21 4 5 29 5 6 48 8 9
M N P Q R S
nc Ac Re nc Ac Re nc Ac Re nc Ac Re nc Ac Re nc Ac Re
Single .................................. 84 13 14 126 18 19 200 27 28 315 41 42 500 62 63 800 95 96
nc=Cumulative sample size. Ac=Acceptance number. Re=Rejection number.
VerDate Mar<15>2010 15:24 Jan 12, 2013 Jkt 229013 PO 00000 Frm 00258 Fmt 8010 Sfmt 8006 Q:\07\7V2.TXT ofr150 PsN: PC150 EC
02S
E91
.036
</G
PH
>

249
Agricultural Marketing Service, USDA § 43.106
SAMPLING PLANS AND OPERATING CHARACTERISTICS (OC) CURVES FOR AQL=12.5 PERCENT DEFECTIVE (OR AQL=12.5 DEFECTS PER HUNDRED UNITS)
[Sampling plans—AQL=12.5]
Identification letter of OC curve
Comparable sampling plans
B, EE G J K L M
nc Ac Re nc Ac Re nc Ac Re nc Ac Re nc Ac Re nc Ac Re
Single .................................. 7 2 3 11 3 4 21 5 6 29 6 7 48 10 11 84 15 16
Double ................................. 3 0 3 8 2 3 .... ..... ..... .... ..... ..... .... ..... ..... .... ..... ..... .... ..... .....
N P Q R S
nc Ac Re nc Ac Re nc Ac Re nc Ac Re nc Ac Re
Single .................................. 126 22 23 200 33 34 315 50 51 500 76 77 800 117 118
nc=Cumulative sample size. Ac=Acceptance number. Re=Rejection number.
VerDate Mar<15>2010 15:24 Jan 12, 2013 Jkt 229013 PO 00000 Frm 00259 Fmt 8010 Sfmt 8006 Q:\07\7V2.TXT ofr150 PsN: PC150 EC
02S
E91
.037
</G
PH
>

250
7 CFR Ch. I (1–1–13 Edition) § 43.106
SAMPLING PLANS AND OPERATING CHARACTERISTIC (OC) CURVES FOR AQL=15.0 PERCENT DEFECTIVE (OR AQL=15.0 DEFECTS PER HUNDRED UNITS)
[Sampling plans—AQL=15.0]
Comparable sampling
plans
Identification letter of OC curve
AA B E F H J K
nc Ac Re nc Ac Re nc Ac Re nc Ac Re nc Ac Re nc Ac Re nc Ac Re
Single ........ 1 0 1 3 1 2 6 2 3 9 3 4 13 4 5 21 6 7 29 7 8
L M N P Q R S
nc Ac Re nc Ac Re nc Ac Re nc Ac Re nc Ac Re nc Ac Re nc Ac Re
Single ........ 48 11 12 84 18 19 126 26 27 200 39 40 315 59 60 500 90 91 800 140 141
nc=Cumulative sample size. Ac=Acceptance number. Re=Rejection number.
PARTS 44–45 [RESERVED]
VerDate Mar<15>2010 15:24 Jan 12, 2013 Jkt 229013 PO 00000 Frm 00260 Fmt 8010 Sfmt 8006 Q:\07\7V2.TXT ofr150 PsN: PC150 EC
02S
E91
.038
</G
PH
>