agricultural transformation to meet 21st century … · agricultural transformation to meet ... •...
TRANSCRIPT
Agricultural Transformation to Meet 21st Century Demands in Sierra Leone
Presented By: Joseph M. Kargbo, Ph.D. President & CEO
Sanda Development Partners, Inc. 3883A Steppes Court
Falls Church, Virginia 22041 Tel./Fax: 703-820-2995
Cell: 757-572-3352 E-mail: [email protected]

At The Technical Workshop Sierra Leone Conference on Development and Transformation
Held on December 4 -7, 2011 at the Bintimani Hotel Freetown, Sierra Leone

Some basic questions I want us to consider in our discussion:
• What kind of agriculture sector do Sierra Leoneans envisage for the country within the next 10 to 20 years, and beyond?
• What are the challenges to be confronted? • What sacrifices are people willing to make to
transform the nation’s agriculture sector? • What are the most appropriate policies and
programs to be adopted in pursuit of these national objectives?
• What is expected from our country’s political leadership?

Agriculture’s Importance in the Economy:
• Contribution to GDP: 32% - 50% + • Arable land account for ~ 74% of country’s total land
area. • Only 36% of arable land is under cultivation. • Employs 68% of population. • Employment by Gender:
– Men: 49% – Women: 51%
• Average farm size: 2.7 ha • • ** Thus, Sierra Leone has huge potential for economic
growth via the agriculture sector.

Contributions of Agricultural sub-sectors to Agricultural GDP
Sub-sector Agricultural GDP Crops 75% Fisheries 21% Livestock 4% Forestry 9% – 13% (Since 1984)

A Century of Agricultural Policy
• Government Emphasis on: • Increasing Rural incomes • Food self-sufficiency • Promotion of agricultural exports

Colonial-era Policy Emphasized :
• Provision of stable prices to producers • Improvements of agricultural production methods • Timber production, exports, and forest conservation • Tried to limit upland cultivation by farmers • Introduced a policy in the 1930s to increase rice production
to meet the growing demand for rice in Freetown, mining areas in the north and eastern part of the country.
• Agricultural Department published its first agricultural policy statement in 1936 after the government realized that domestic food production was going to be its major task.
• Policy of ‘big push’ was implemented in the 1940s by increasing mechanized rice cultivation on drained and reclaimed swamps. Very expensive program that ended up in failure.

From 1961 to the Present: • Dramatic shift in the government’s agricultural
policy shortly after achieving political independence in 1961.
• Government’s ‘White Paper’ argued that while the vital research work must be continued and expanded, much more money must be spent on switching the emphasis from advisory services to actual direct supervision of productive effort.
• 1974 National Development Plan gave the agriculture sector higher priority more than ever before in the history of the country.

Agriculture’s share of Government Expenditure
Period % of total Expenditures 1922-55 0.88 - 3.13 1960/61- 76/77 2.59 - 7.10 2009 7.5
Note: The Maputo Declaration of 2003 adopted by African leaders to boost the
continent’s agricultural production required that African governments must allocate at least 10% of their annual budgets to agriculture sector.

Compare Government Expenditures by Sector
0
5
10
15
20
25
19851990
20002005
2007
Perc
ent (
%)
Year
Defence Education Health Agriculture
Figure 7.1. Recurrent government expenditure by sector in Sierra Leone, 1985 – 2007 Source: CSO and IMF data. Notes: 1985 and 1990 refers to 1985/86 and 1990/91, respectively.

Figure 7.3. Distribution of crops by acreage in Sierra Leone in 2004 (in Percent)
Rice, 30.5
Coffee, 17.3
Cassava, 12.7
Oil palm, 11.6
Vegetables, 3.7
Cocoa, 7.4
Maize, 3
Grondnuts, 6.6
Potato, 4.5 Citrus, 2.6
Source: Based on data from GoSL/SSL (2006). 2004 Population and Housing Census—Agriculture Report.

Table 7.3. Arable and cultivated land by ecosystem in Sierra Leone
Table 7.3. Arable and cultivated land by ecosystem in Sierra Leone Ecology Area (ha) Percent of
arable land Yield (MT / ha) Current Potential
Upland 4,200,000 78.28 0.8 – 1.2 4.0 Lowlands:
Inland valley swamp
Mangrove swamp
Bolilands
Riverine grassland
1,165,000
690,000
200,000
145,000
130,000
21.72
12.86
3.73
2.70
2.42
1 – 4.0
1.4 – 1.9
3.0
1.0
3 - 4
>1.0
3 – 4.0
3.0a
>1.0
3 – 4a
Total arable land
Other land
Total national land
5,365,000
1,870,000
7,235,000
100.00
--
--
0.8 – 4.0
--
--
>1.0
--
--
Notes: a. Yields could be maintained or increased with proper farm management techniques. --. Figures not available. Source: GoSL/Ministry of Agriculture, Special Programme for Food Security, October 4, 2001. Freetown, Sierra Leone. Appears in Kargbo (2011).
• Rice - the staple food, is grown by over 95% of the farmers in the country.

Figure 7.4. Domestic production, retail prices and rate of self-sufficiency for rice in Sierra Leone 1954 – 2007
200
400
600
800
1000
1200
1400
1600
-2
0
2
4
6
8
10
55 60 65 70 75 80 85 90 95 00 05
ProductionPrice
Panel APro
duction
(in 100
0 tons) Log of prices (Le / ton )
20
40
60
80
100
65 70 75 80 85 90 95 00 05
RSSRICE
Panel B
Rate o
f self-su
fficiency
(%)
Year
Notes: Panel A: Rice production and prices. Panel B: Rate of self-sufficiency (%). Source: GoSL, WARDA and IMF data. Appears in Kargbo (2011).

Figure 7.5. Annual revenues generated by Ministry of Fisheries and Marine Resources in Sierra Leone, 1996 - 2010.
0
2
4
6
8
10
12
Okere Adams Chernoh Jalloh Moses Kapu Oya Sankoh Afsatu Kabba
Reve
nues
(Le
billi
ons)
Minister
Source: Based on Government data published b1y Awareness Times. Appears in Kargbo (201).
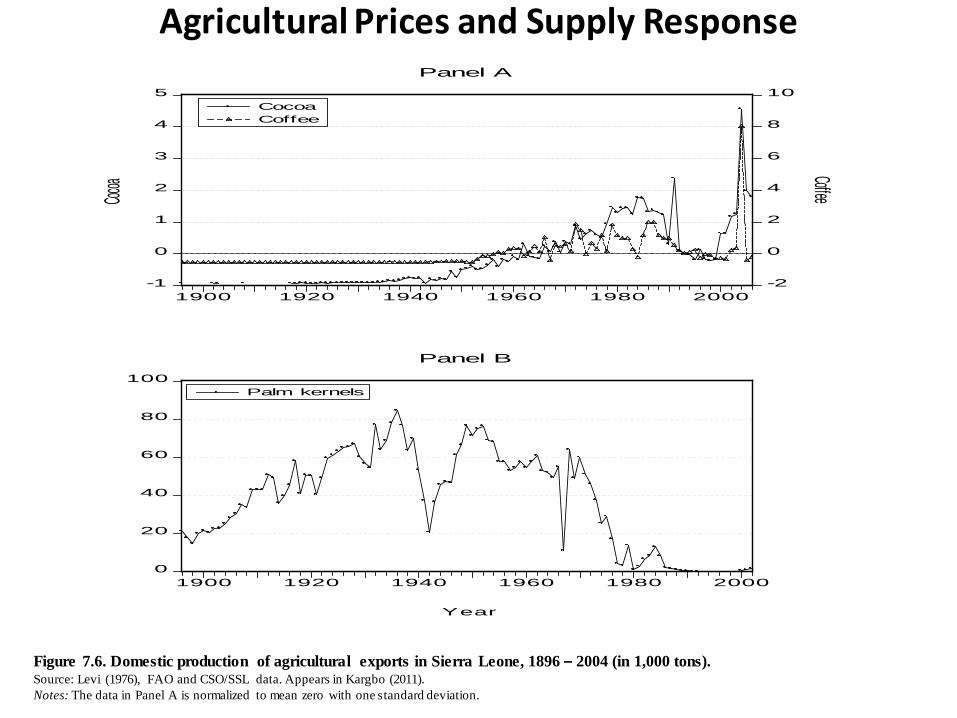
Agricultural Prices and Supply Response
-1
0
1
2
3
4
5
-2
0
2
4
6
8
10
1900 1920 1940 1960 1980 2000
CocoaCoffee
Cocoa Coffee
Panel A
0
20
40
60
80
100
1900 1920 1940 1960 1980 2000
Palm kernels
Year
Panel B
Figure 7.6. Domestic production of agricultural exports in Sierra Leone, 1896 – 2004 (in 1,000 tons). Source: Levi (1976), FAO and CSO/SSL data. Appears in Kargbo (2011). Notes: The data in Panel A is normalized to mean zero with one standard deviation.

Agricultural Prices and Supply Response
0
1
2
3
4
0
2
4
6
8
1900 1920 1940 1960 1980 2000
GingerKola nutsPiassava
Ging
erKola nuts and Piassava
Year
Panel C
Figure 7.6. continued

Figure 7.7. Producer prices for agricultural exports in Sierra Leone, 1946 - 2000
2
4
6
8
10
12
14
16
50 55 60 65 70 75 80 85 90 95 00
CocoaCoffeeGingerPalm kernels
Year
Log o
f Pric
es (L
e / to
n )
Source: Levi (1976), FAO and CSO/SSL data. Appears in Kargbo (2011).

Figure 7.8. International agricultural commodity prices, 1952 - 2008
0
1000
2000
3000
4000
0
50
100
150
200
250
300
55 60 65 70 75 80 85 90 95 00 05
Cocoa beansCoffee
Year
Coffee (US cents / lb )Coco
a (U
S$ /
MT
)
Source: IMF data. Kargbo (2011).

Table 7.4. Sierra Leone: cost structure of major SLPMB exports, 1978 – 83 (Figures per ton)
Year
1978/79 1979/80 1980/81 1981/82 1982/83
Coffee
Average export price, f.o.b. (Le)
Average producer price (Le)
Buying agent’s commission (Le)
Export duty (Le)
Other charges (Le)
Producer prices as % of export price
Agent’s commission as % of export price
Duty as % of export price
Other charges as % of export price
2694.8
1714.7
78.11
427.74
59.88
64.8
2.9
15.8
2.2
2973
2016
66
943.18
54.01
67.8
2.2
31.7
1.8
2334.7
1792
66
817.14
66.77
76.7
2.8
35
2.9
2176.45
1419.67
45.1
579.71
211.42
65.2
2
26.6
9.7
2861.81
1863.21
67.78
655.97
235.85
65.1
2.3
23.2
8.2
Cocoa
Average export price, f.o.b. (Le)
Average producer price (Le)
Buying agent’s commission (Le)
Export duty (Le)
Other charges (Le)
Producer prices as % of export price
Agent’s commission as % of export price
Duty as % of export price
Other charges as % of export price
3516.2
2128
91.24
879.05
59.88
60.5
2.6
25
1.7
3046
2128
74
1066.1
54.01
69.8
2.4
35
1.7
1805.92
1792
66
632.07
66.95
99.2
3.6
35
3.7
2294.23
1459.9
38.89
611.63
207.26
63.6
1.7
26.6
9
2419.66
1510.75
67.95
587.2
221.4
62.4
2.8
24.3
9.2

Palm kernels
Average export price, f.o.b. (Le)
Average producer price (Le)
Buying agent’s commission (Le)
Export duty (Le)
Other charges (Le)
Producer prices as % of export price
Agent’s commission as % of export price
Duty as % of export price
Other charges as % of export price
302.2
162.2
27.5
30.22
48.62
53.8
9.1
10
16.1
416.6
204.1
31
41.66
49
48.9
7.4
10
11.8
244.2
204
27.5
24.42
57.1
83.5
11.3
10
23.4
248.28
162.5
27.5
24.7
192.71
65.5
11
10
77.6
216.34
177.77
27.5
19.25
224.11
82.1
12.7
8.8
103.6
Source: SLPMB, Annual Reports, and World Bank (1984). Appears in Kargbo (2011)
Table 7.4. Sierra Leone: cost structure of major SLPMB exports, 1978 – 83 (Figures per ton)
Table continued Year
1978/79 1979/80 1980/81 1981/82 1982/83

Macroeconomic Policy Reforms and the Agriculture Sector
-20
0
20
40
60
80
100
120
65 70 75 80 85 90 95 00 05
CPI
Panel A. Inflation
Annu
al %
chan
ge
-20
0
20
40
60
80
65 70 75 80 85 90 95 00 05
% change
P anel B : Money supply
Grow
th rat
e (%)
of M
2
0
4
8
12
16
20
-15
-10
-5
0
5
10
15
65 70 75 80 85 90 95 00 05
InvestmentSavings
Inve
stmen
t
P anel C: S avings and investment (% of GDP )
Savings
Y ear
0
2
4
6
8
65 70 75 80 85 90 95 00
Fertilizer
P anel D: Fertil izer use
Kg /
ha
Y ear
Figure 8.1. Selected macroeconomic indicators in Sierra Leone, 1960 – 2008 Source: World Bank and IMF data. Appears in Kargbo (2011).

Figure 8.2. Per capita domestic agricultural production and terms of trade in Sierra Leone, 1960 – 2008
80
100
120
140
160
180
-20
-10
0
10
20
65 70 75 80 85 90 95 00 05
Ag. productionGrowth rate (%)Ag.
produc
tion (19
99-200
1 = 100
)Annual % change
Panel A: Agricultural production
0
100
200
300
400
500
65 70 75 80 85 90 95 00 05
Agtot
Panel B: Agric. terms of trade (1999-2001 = 100)
Year
Source: FAO data. Appears in Kargbo (2011).

Figure 8.3. Real exchange rates and black market premium in Sierra Leone, 1960 – 2008
-1
0
1
2
3
4
5
60 65 70 75 80 85 90 95 00 05
MRER
Panel A. Real exchange rates (2000 = 100)
0
500
1000
1500
2000
80 85 90 95 00 05
Premium (%)
Year
Panel B. Black market premium (%)
Source: GoSL, World Bank and IMF data. Appears in Kargbo (2011). Notes: The graph in Panel A is normalized with mean zero and one standard deviation

Figure 10.1 . Food consumption in Sierra Leone, 1960 – 2005.
1600
1800
2000
2200
2400
2600
2800
3000
65 70 75 80 85 90 95 00 05
Calories
Kcal
/capit
a /da
y
P anel A : Calorie intake
60
80
100
120
140
160
65 70 75 80 85 90 95 00
Rice
P anel B : Rice consumption
Kg /c
apita
/yr
10
15
20
25
30
35
65 70 75 80 85 90 95 00
Fish
P anel C: Fish
Kg / c
apita
/ yr
Year
2
4
6
8
10
12
3
4
5
6
7
8
9
65 70 75 80 85 90 95 00
MeatMilk
P anel D : Meat and milk
Meat
(kg / y
r )
Milk (kg / yr)
Year
Source: Based on data from FAO, WARDA, CSO/SSL, and Alieu (2005). Appears in Kargbo (2011).

Figure 10.2. Nominal food prices in Sierra Leone, 1955 – 2009. (1990 = 100)
-2
0
2
4
6
55 60 65 70 75 80 85 90 95 00 05
ActualSmoothed
Log of p
rices
-2
-1
0
1
2
3
4
55 60 65 70 75 80 85 90 95 00 05
Year
Volatility
Source: Based on data from ILO and CSO/SSL. Appears in Kargbo (2011).

The Model • The supply function for a Cash crop in Sierra Leone could be specified as:
Where: • Qt is the quantity of commodity produced in a particular year, t; for t = 1, 2, ....., n. • Pit = the real producer price for commodity. A significant positive coefficient for Pit indicates that
farmers respond positively to price changes in Sierra Leone.
• Pjt = real price of substitutes or complementary crops. • RAINFL = annual rainfall in Sierra Leone, and represents the availability of moisture since the
country depends on rain-fed agriculture. • POLINST is an indicator for political instability or dummy variable for war period with 1991-2002 =
1, and 0 otherwise. • TIME represents technological changes that affect domestic production over time.

Empirical Estimates of Supply Response For Cash Crop Table 7.5. Regression estimates of supply elasticities for agricultural commodities in Sierra Leone, 1955 – 2005
Explanatory variables
Dependent variables
Cocoa (1955-2005)a Coffee (1955-2005) Palm kernels (1956 – 92) Ginger (1956-86)
Constant
Rainfl
Ginpri
Ricpr
Cofpri(-6)
Cocpri(-7)
Time
RER
Polinst
Repak
3.583
(1.993)b
-0.622
(3.056)*
--
--
0.035
(0.603)
0.067
(1.167)
0.034
(6.411)*
-0.132
(3.612)*
-0.288
(2.216)**
--
-6.058
(1.341)
0.597
(1.164)
--
--
-0.108
(0.745)
0.072
(0.501)
0.038
(2.932)*
-0.137
(1.498)
-0.918
(2.807)*
--
16.488
(2.280)
-1.148
(1.315)
--
--
-1.511
(5.109)*
--
-0.036
(1.535)
-0.505
(3.036)*
-0.606
(1.543)
0.932
(3.142)*
-5.958
(0.927)
1.526
(1.976)***
-0.295
(1.663)
-0.963
(2.826)*
-1.115
(2.648)**
--
0.017
(0.690)
1.333
(5.400)*
0.570
(3.480)*
--

R2
Adjusted R2
SER
D-W statistic
F-statistic
LM: χ2 (1)
LB Q-statistic
ARCH: χ2 (p)
WHET: χ2 (p)
JB statistic
RESET
Chow test
No. of obs.
0.744
0.710
0.283
2.098
21.397*
0.307
(20) = 20.338
(1)=1.976
(11)=20.796**
0.490
F(4,47)=1.756
(1990) =4.229*
51
0.350
0.262
0.711
2.313
3.951*
5.319**
(20) = 16.435
(9)=13.053
(11) = 36.475*
11.249*
F(1,50) =0.046
(1990)=1.899***
51
0.903
0.882
0.652
1.588
43.532*
1.248
(16) = 21.050
--
(11) =14.063
0.715
F(1,34) =1.864
--
35
0.803
0.743
0.470
1.794
13.424*
0.246
(15) = 15.403
(1)=0.0004
(13) = 9.021
1.991
F(5,26) = 1.546
--
31
Notes: a. Refers to estimation period. b. The number in parentheses refers to the absolute t-value. * Significant at the 1.0% level; ** Significant at the 5.0% level. *** Significant at the 10% level. Ginpri is the real producer price for ginger; Ricpr is the real retail price for rice; Cofpri(-6) = real producer price for coffee with 6-year lag; and Cocpri(-7) is the real producer price for cocoa with 7-year lag. All variables (except Polinst and Time) were converted into logarithms. LM is the Lagrange multiplier test of residual serial correlation. ARCH and WHET are tests for heteroscedasticity based on Engle (1982) and White (1980), respectively. L-B Q-statistic is a test on the correlograms of the residuals to check for serial correlation. The number of lags is in parentheses. J-B statistic tests for normality in the residuals. RESET is a test for specification error. The breakpoint Chow test is used to verify whether the coefficient vector is constant over the sub-samples, with the year used as a breakpoint being in parentheses. The degrees of freedom for the other tests are in parentheses adjacent to the distributions. Source: Kargbo (2011).

Table 7.7. VEC estimates of agricultural supply response in Sierra Leone, 1958 – 99 Commodity Rainfl Ginpri Ricpr Cofpri Cocpri RER Cofqty Cocqty Ginqty Constant
Coffee (1958-99)a
3.373 (5.904)b
-- 1.727 (7.312)
-1.326 (5.900)
0.354 (1.380)
-1.168 (5.025)
1.000 -- -- -32.916 (6.309)
Cocoa (1959-99)
6.993 (2.067)
-- -- 1.531 (1.334)
-2.290 (1.671)
0.112 (0.302)
-- 1.000 -- -54.958
Ginger (1958-86)
-1.412 (8.633)
0.458 (2.933)
2.858 (6.718)
-0.253 (1.544)
-- -2.398 (10.651)
-- -- 1.000 --
Adjustment coefficients Coffee -0.053
(0.905) -- -0.233
(0.646)
-0.025 (0.093)
-0.002 (0.008)
0.382 (1.309)
-0.650 (3.694)
-- -- --
Cocoa -0.126 (5.336)
-- -- 0.073 (0.786)
0.109 (1.098)
0.115 (1.003)
-- -0.008 (0.265)
-- --
Ginger 0.118 (1.577)
0.026 (0.144)
-0.085 (1.174)
0.173 (1.776)
-- 0.118 (2.186)
-- -- -0.446 (2.352)
--
Notes: Refers to estimation period. b. Number in parentheses is the absolute t-value. -- Means data not available. Cofqty, Cocqty, and Ginqty refer to the quantities of coffee, cocoa and ginger produced, respectively. See table 7.5 for definition of other variables. Appears in Kargbo (2011).

Table 7.8. Short-run estimates of supply response for agricultural commodities in Sierra Leone, 1959 – 2000 Independent variables Dependent variable
Coffee (1960-2000)a
Cocoa (1962-2000)
Ginger (1959-1986)
Constant 0.020 (0.027)b
0.266 (1.178)
0.478 (0.490)
∆Rainfl
0.453(-1)c (2.191)**
-0.130(-1) (0.975)
1.141(-2) (2.359)**
∆Ginpri
-- -- -0.545(-1) (3.368)*
∆Ricpr 0.155(-1) (1.205)
-- 1.196(-2) (2.537)**
∆Cofpri -0.872(-1) (2.796)*
-0.500(-1) (4.501)*
0.710(-1) (2.242)**
∆Cocpri -- 0.536(-1) (6.731)*
--
Time 0.002 (0.166)
-0.003 (1.067)
-0.009 (0.663)
∆RER 0.524(-1) (2.008)**
-0.069(-2) (2.090)**
-0.091(-1) (0.262)
Polinst -0.555 (1.784)***
0.051 (0.488)
0.401 (2.233)**
∆Cofqty -0.662(-1) (3.716)*
-- --

Table 7.8 cont. (pg: 31) ∆Cocqty -- 0.341(-2)
(3.754)*
--
∆Ginqty -- -- 0.247(-2) (1.447)
EC -0.476(-2) (1.844)***
-0.675(-1) (4.135)*
-0.619(-1) (2.279)*
R2 Adjusted R2 SER D-W statistic F-statistic LM: χ2 (1) LB Q-statistic ARCH: χ2 (p) WHET: χ2 (p) JB statistic RESET Chow test No. of obs.
0.494 0.368 0.667 1.942 3.911* 0.097 (24)=23.443 (4)=5.792 (15)=15.046 0.947 F(1,40)=0.876 (1990)=0.402 41
0.595 0.469 0.259 1.256 4.740* 5.356** (23)=27.824 (7)=11.331 (15)=23.629 0.179 F(5,34)=6.967* (1990)=3.287* 39
0.572 0.358 0.469 2.105 2.671** 0.310 (15)=11.003 (1)=1.454 (17)=15.177 0.247 F(1,27)=0.263 -- 28
Notes. See Table 7.5 for definition of variables. Source: Kargbo (2011).

Table 7.15. VEC estimates of supply response for rice in Sierra Leone, 1964 – 2005
RIQ
D
RICP
R
PWHI
T
RER
RAIN
FL
CON
STAN
T
TREN
D
1.000 1.128 (1.875)a
-0.680 (1.944)
-1.052 (1.780)
-0.034 (0.079)
-6.055 -0.055
Adjustment coefficients
-0.019 (0.774)
0.137 (0.903)
-0.680 (1.944)
-1.052 (1.780)
-0.034 (0.489)
-- --
Notes: a. Refers to absolute t-value. -- Not available. Source: Kargbo (2011).

Table 7.13. Short-run estimates of supply response for rice farmers in Sierra Leone, 1963 – 2006 ∆ Log RIQD = - 1.192 + 0.069(-1) ∆ log RICPR + 0.014 TIME
(0.470) (1.739)*** (0.504)
+ 0.090(-1) ∆ log RAINFL + 0.023(-1) ∆ log RER +
(1.805)*** (0.272)
+ 0.096(-1) ∆ log RIQD - 0.024 POLINST
(0.496) (0.463)
- 0.076(-1) ∆ log PWHIT - 0.893(-1) EC
(0.883) (3.245)* R2 Adjusted R2 SER D-W statistic F-statistic LM: χ2 (1) LB Q-statistic ARCH: χ2 (1)
0.361 0.193 0.149 1.943 2.141** 0.013 (17) = 13.945 2.286
WHET: χ2 (15) JB statistic RESET Chow test No. of obs.
17.245 0.923 F(7,37) = 1.726 (1990) = 1.489 44
Notes: Regression was corrected for serial correlation with the autocorrelation coefficient being 0.872. * Significant at 1% level; ** Significant at 5% level; and *** Significant at 10% level. Source: Kargbo (2011).

Table 8.3. VEC estimates of per capita agricultural and food production in Sierra Leone, 1966 - 2005
Sector DAP DOFP PFOOD RAINFL RER DOINF DINV Constant Trend
Agriculture 1.000 -- 0.107 (1.840)a
1.173 (1.892)
0.036 (2.606)
0.007 (2.354)
-0.141 (1.354)
-14.014 -0.007 (1.329)
Food -- 1.000 -0.010 (0.406)
-0.849 (5.840)
0.167 (2.837)
0.003 (1.826)
0.851 (1.783)
-- --
Adjustment coefficients
Agriculture -0.084 (1.739)
-- -2.614 (2.337)
-0.391 (2.100)
0.235 (0.251)
-120.568 (2.468)
-0.305 (0.962)
--
--
Food -- 0.120 (4.163)
-2.274 (3.091)
-0.026 (0.189)
-1.289 (2.242)
-48.778 (1.354)
0.132 (0.595)
-- --
Notes: Number in parentheses is the absolute t-value. -- Means data not available. See Table 8.2 for definition of other variables. Source: Kargbo (2011)

Table 7.9. Previous estimates of own-price supply elasticities in Sierra Leone Author
Agricultural commodity Palm kernels Cocoa Coffee Ginger Piassava
Saylor (1967) (1950 - 62)a (1931 - 39) (1922 – 39) (1949 – 63)
0.602 - 0.951 0.207 0.059 --
-- -- -- 0.404 - 0.906
--
--
--
Levi (1976) (1946 – 72)
0.80 5.9 – 6.6 1.5 – 3.4 -- --
Kargbo (1992) (1966 – 87)
0.507
0.576
2.046
0.016
0.387
Kargbo (1992) (1968 – 87)c Kargbo (1994) (1965 – 90)
Rice AR OR Short-run 0.153 0.392 Long-run 0.283 0.605 Food* 0.099 - 0.109 (2SLS)b 0.019 – 0.102 (OLS)
Strauss (1984) (1974 – 75)
Food item Elasticity Rice 0.11 Oils and fats 0.02 Fish and animal products 0.09 Root crops and other cereals 0.10 Miscellaneous foods 0.15
Notes: a. Refers to estimation period. b. Estimation by two-stage least squares (2SLS). c. OLS estimates. The OLS estimates for rice are within the Nerlovian framework. -- Data not available. *. Refers to food aggregate. Smith and Strauss (1986) reported elasticities in the range of 0.09-0.11 for the following food items: rice, oil & fats; and fish & animal products. AR = acreage response; and OR = output response. Source: Kargbo (2011).

Table 7.17. Sources of agricultural information used by gender in Sierra Leone (Figures in %) *
Sources used Male Female
Blood relations/Neighbors Agricultural Research Institute Agricultural Training Institution/School Extension Agents Mass media
10.0 50.0 60.0 60.0 20.0
33.3 33.3 42.9 33.3 0.0
* Figures do not add up to 100% because some respondents gave multiple responses. Source: IAR, Research Report 1994-99. Appears in Kargbo (2011).

Table 7.18. Factors perceived as constraining farmer access to agricultural information in Sierra Leone - (Figures in %) *
Factor Male Female Few extension workers Few extension activities Lack of radio Transportation problems Illiteracy Language barrier Remoteness Ill-health Heavy work-load Poor mass media facilities Ignorance about source of information
77.4 68.1 29.0 25.8 9.7 6.5 6.5 3.2 9.7 3.2 6.5
61.5 25.0 26.9 25.0 15.4 13.5 13.6 9.6 1.9 3.8 0.0
* Figures do not add to 100% because some respondents gave multiple answers. Source: IAR, Research Report 1994 – 99. Appears in Kargbo (2011).

Government Assistance to Agriculture
Figure 8.10. Producer support estimates as percent of gross farm receipts in the OECD and Emerging Market Economies, 2003 - 07
0
5
10
15
20
25
30
35
Chile Brazil South Africa China Ukraine Russia Bulgaria Romania OECD
% P
SE
2003-05
2005-07
Source: OECD data. Appears in Kargbo (2011). Note: The Producer Support Estimates (PSE) entails the estimated financial value of government policy transfers from consumers and tax payers to producers. It is expressed as a percent of gross farm receipts, and PSE is very useful in analyzing changes in the level of support over time and for comparison between countries (OECD 2009a,b).

The largest providers of farm subsidies in 2006 (in US$ Billions)
European Union US$138 Japan US$41.0 United States US$29.0 South Korea US$25.0

Concluding Comments • Farmers in Sierra Leone are responsive to price changes, and the long-run supply
response is higher than the short-run response. • The results tend to suggest the existence of spare capacity in the agricultural
sector, and that increasing producer prices, coupled with non-price facilities can lead to increased productivity per acre.
• These findings have significant policy implications that involve a reallocation of
resources within the agricultural sector and intersectoral resource transfers during adjustment of production.
• Because of the importance of agriculture in Sierra Leone’s economy,
macroeconomic and agricultural policy reforms can be complimentary in enhancing economic growth.
• The implementation of appropriate agricultural pricing and exchange rate policies,
combined with institutional and infrastructural development is required to achieve sustainable agricultural growth in Sierra Leone.

Concluding Comments: Continued
• Policymakers should pay close attention to the potential impacts of their policies on relative prices, resource allocation and profitability of the farm sector, agribusiness and other enterprises.
• Shocks to food prices, interest rates and inflation put agriculture in a cost-price
squeeze. • Changes in agricultural prices and rainfall patterns are sources of macroeconomic
and agricultural instability in Sierra Leone. • Over reliance on the free market or exclusively on the government for solutions to
the country’s problems tends to miss the point. • The main challenge facing policy makers is to fashion policies that make both the
free market and government/state work more efficiently. • Thus, competent management of the economy needs detailed analysis of the
available information over time, combined with visionary leadership provided by policymakers