agriculture, and individual metros … · gary forecast 2010 ... louisville forecast 2010 ......
TRANSCRIPT

Economic Forecasts for 2010International, National, Finance, Housing, Indiana, Agriculture, and Individual Metros
INDIANABUSINESSREVIEW
Outlook 2010 Volume 84, No. 4

1 Outlook for 2010 ..............................................
2 International Outlook for 2010 .....................
4 U.S. Outlook for 2010 ......................................
6 Financial Outlook for 2010 ......
8 Housing Market Outlook for 2010 ..................
10 Indiana’s Outlook for 2010 .............................
11 Indiana’s Agricultural Outlook for 2010 .....
The Big Picture
Indiana Metro Areas
12 Anderson Forecast 2010 ...................................
14 Bloomington Forecast 2010 ..........................
17 Columbus Forecast 2010 ................................
18 Evansville Forecast 2010 ..........................
20 Fort Wayne Forecast 2010 .................................
22 Gary Forecast 2010 .........................................
26 Indianapolis-Carmel Forecast 2010 ...............
28 Kokomo Forecast 2010 ...................................
29 Lafayette Forecast 2010 ........................................
32 Louisville Forecast 2010 ......................................
34 Muncie Forecast 2010 .......................................
37 Richmond Forecast 2010 ............
38 South Bend and Elkhart Area Forecast 2010 ...
40 Terre Haute Forecast 2010 .............
Kelley School of Business
Daniel C. SmithDean
Frank AcitoAssociate Dean of Information Technology
Munirpallam VenkataramananAssociate Dean of Academic Programs
Idie KesnerAssociate Dean of Faculty and Research
Philip L. CochranAssociate Dean of Indianapolis Programs
Anne D. AuerDirector of Marketing
Indiana Business Research Center
Jerry N. ConoverDirector and Publisher
Indiana Business Review
Carol O. RogersExecutive Editor
Rachel M. JustisManaging Editor
Molly A. MannsAssociate Editor
Amy L. BuckGraphic Designer
Dale W. DrakeFlora A. LewisCarol S. StewartQuality Control
Nikki J. LivingstonCirculation
Outlook 2010 Volume 84, No. 4
w w w. i b r c . i n d i a n a . e d u

Indiana Business Review, Winter 2009 1
Outlook for 2010Jerry N. Conover, Ph.D.: Director, Indiana Business Research Center, Kelley School of Business, Indiana University
November 2009
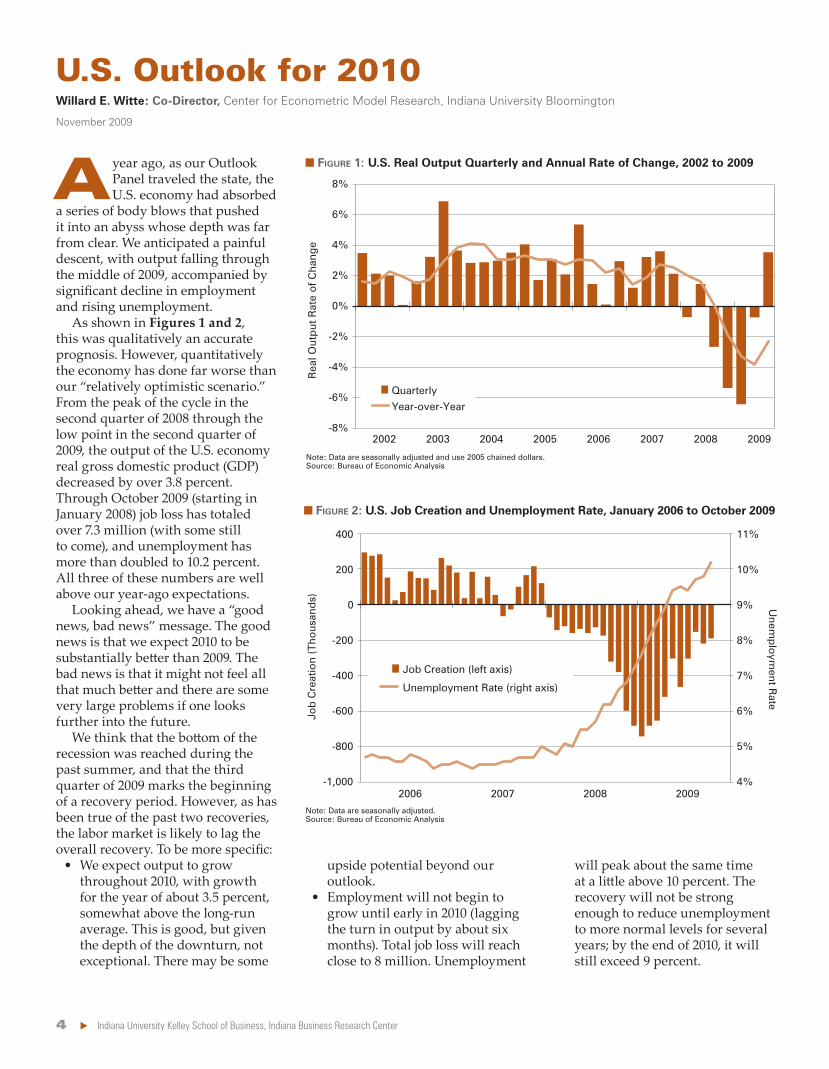
F
-5.0% to -5.9%-6.0% to -6.9%
-7.0% to -7.9%-8.0% to -11.0%
Vander-burghPosey W
arrick
Floyd
Harrison
Gibson
ClarkWashington
Greene
Sullivan
Brown
BartholomewMonroe
OwenClay
Vigo
Morgan Johnson Shelby
Wayne
PutnamHendricks Marion Hancock
Delaware
St. Joseph
Mad
ison
Verm
illion
Boone Hamilton
TiptonClintonTippe
cano
eHoward
Benton Carroll
Wells
New
ton
Allen
Jasper
Whitley
Lake Porter
Elkhart
� FIGURE 1: Change in Employment for Indiana Regions, October 2008 to October 2009
Source: IBRC, using Bureau of Labor Statistics data

2 Indiana University Kelley School of Business, Indiana Business Research Center
I
Introduction
Advanced and Emerging Asia
Europe
International Outlook for 2010Elham Mafi-Kreft: Clinical Assistant Professor of Business Economics and Public Policy, Kelley School of Business, Indiana University Bloomington
November 2009
China Japan
South Korea
Singapore
IndonesiaSub-SaharanAfrica
Germany PolandBritain Belarus
UkraineRomania
France
Brazil
IndiaTaiwan
Spain
Chile
Mexico

Indiana Business Review, Winter 2009 3
Latin America Sub-Saharan Africa
Conclusion
4 Indiana University Kelley School of Business, Indiana Business Research Center
A
U.S. Outlook for 2010Willard E. Witte: Co-Director, Center for Econometric Model Research, Indiana University Bloomington
November 2009
� FIGURE 1: U.S. Real Output Quarterly and Annual Rate of Change, 2002 to 2009
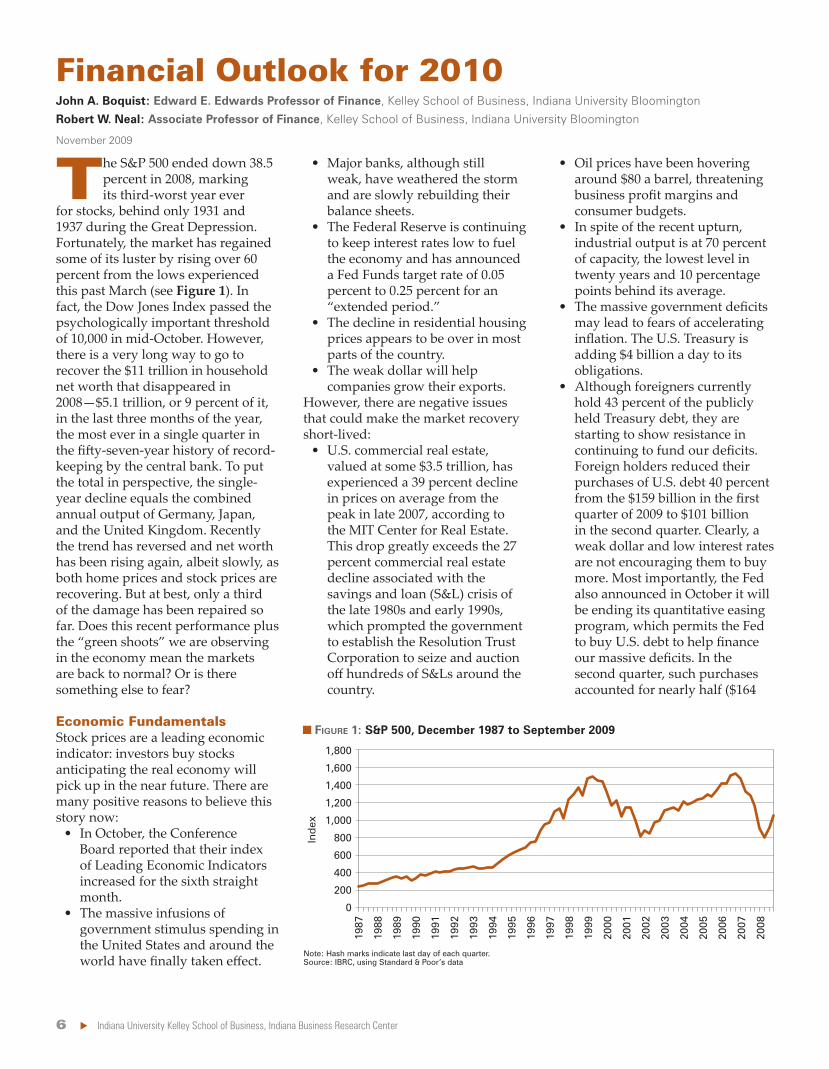
� FIGURE 2: U.S. Job Creation and Unemployment Rate, January 2006 to October 2009
Note: Data are seasonally adjusted and use 2005 chained dollars.Source: Bureau of Economic Analysis
Note: Data are seasonally adjusted.Source: Bureau of Economic Analysis
-8%
-6%
-4%
-2%
0%
2%
4%
6%
8%
2002 2003 2004 2005 2006 2007 2008 2009
Rea
l Out
put
Rat
e o
f Cha
nge
Quarterly
Year-over-Year
4%
5%
6%
7%
8%
9%
10%
11%
-1,000
-800
-600
-400
-200
0
200
400
2006 2007 2008 2009
Job
Cre
atio
n (T
hous
and
s)
Unem
plo
yment R
ate
Job Creation (left axis)
Unemployment Rate (right axis)

Indiana Business Review, Winter 2009 5
6 Indiana University Kelley School of Business, Indiana Business Research Center
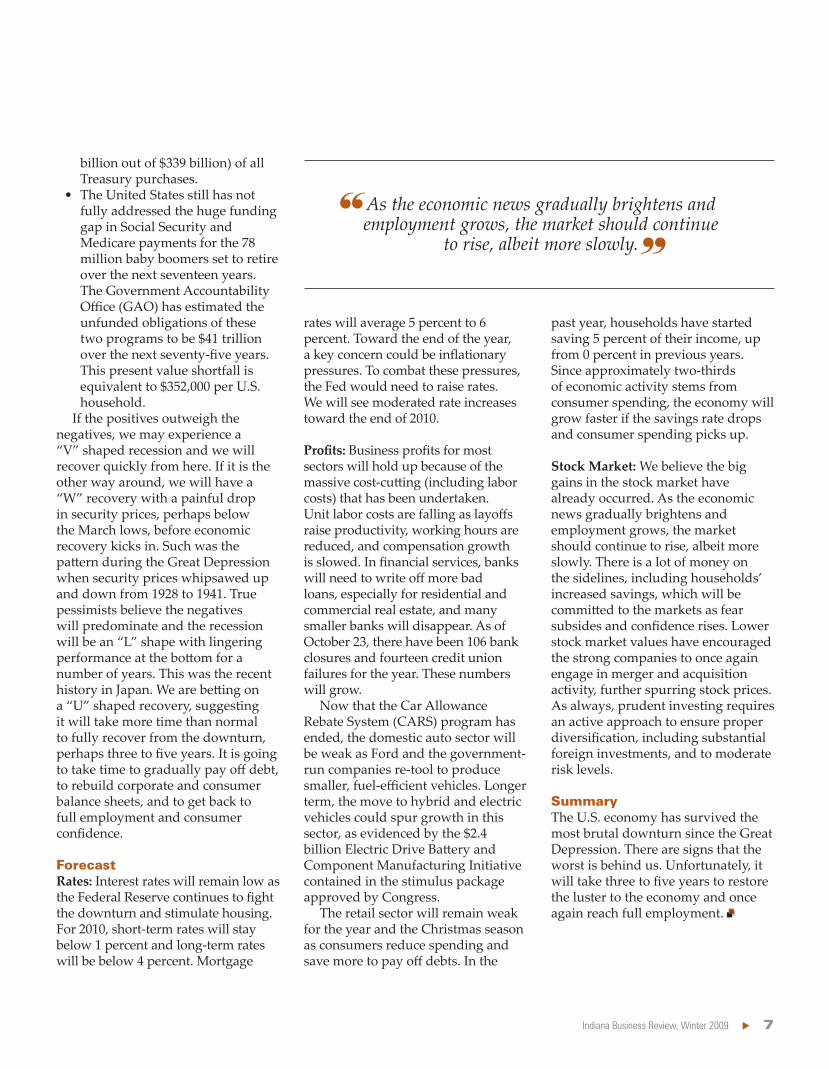
T
Economic Fundamentals
Financial Outlook for 2010John A. Boquist: Edward E. Edwards Professor of Finance, Kelley School of Business, Indiana University Bloomington
Robert W. Neal: Associate Professor of Finance, Kelley School of Business, Indiana University Bloomington
November 2009
0
200
400
600
800
1,000
1,200
1,400
1,600
1,800
1988
1989
1987
1990
1992
1994
1995
1997
1996
1998
1999
2001
2000
2002
2003
2004
2005
2006
2007
2008
1993
1991
Ind
ex
� FIGURE 1: S&P 500, December 1987 to September 2009
Note: Hash marks indicate last day of each quarter.Source: IBRC, using Standard & Poor’s data
Indiana Business Review, Winter 2009 7
Forecast
Summary

8 Indiana University Kelley School of Business, Indiana Business Research Center
0
50
100
150
200
250
1987
1988
1989
1990
1991
1992
1993
1994
1995
1996
1997
1998
1999
2000
2001
2002
2003
2004
2005
2006
2007
2008
2009
Ind
ex
Housing Market Outlook for 2010Jeffrey D. Fisher: Director, Benecki Center for Real Estate Studies; Charles H. and Barbara F. Dunn Professor of Finance and Real Estate, Kelley School of Business, Indiana University Bloomington
November 2009
T
Housing Inventory
Home Prices
Home Sales
� FIGURE 1: S&P/Case-Schiller Ten-City Composite Home Price Index, 1987 to 2009
Note: Hash marks indicate January of each year.Source: Standard & Poor’s
Indiana Business Review, Winter 2009 9
First-Time Homebuyer Tax Credit
Housing Starts
Conclusion
Notes
2006 2007 2008 2009 2010 2011
Housing Activity (in Thousands)
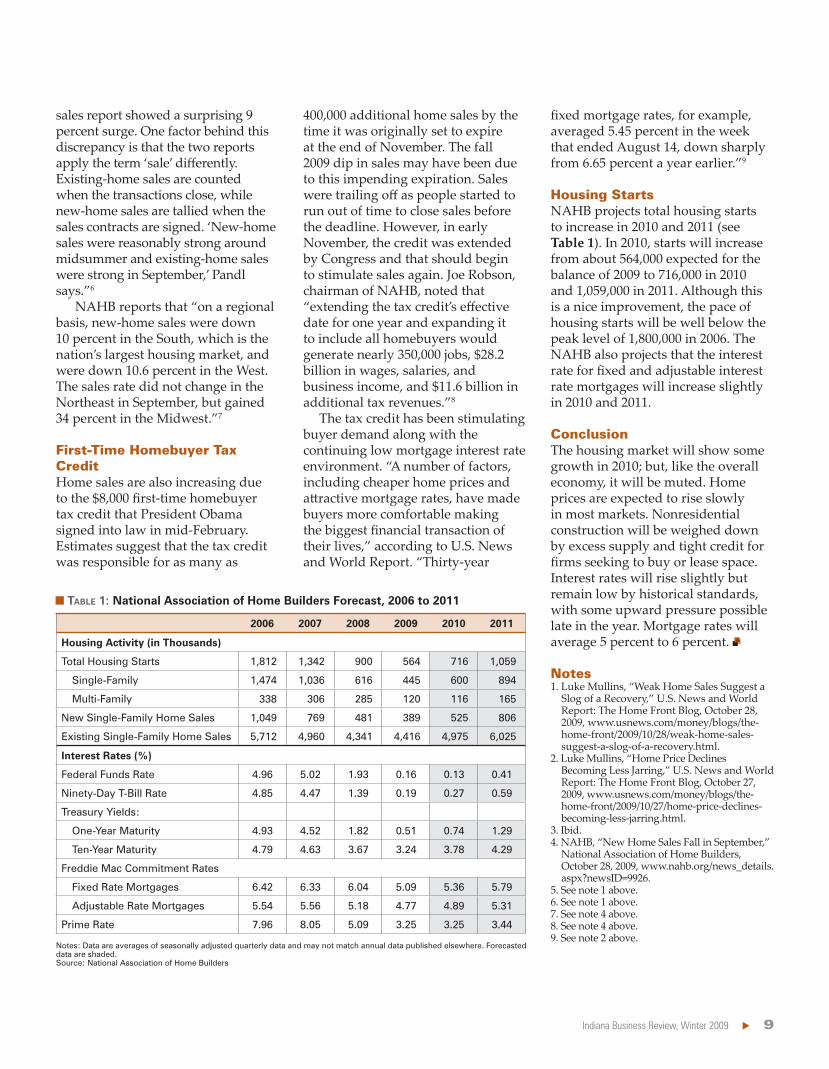
Total Housing Starts 1,812 1,342 900 564 716 1,059
Single-Family 1,474 1,036 616 445 600 894
Multi-Family 338 306 285 120 116 165
New Single-Family Home Sales 1,049 769 481 389 525 806
Existing Single-Family Home Sales 5,712 4,960 4,341 4,416 4,975 6,025
Interest Rates (%)
Federal Funds Rate 4.96 5.02 1.93 0.16 0.13 0.41
Ninety-Day T-Bill Rate 4.85 4.47 1.39 0.19 0.27 0.59
Treasury Yields:
One-Year Maturity 4.93 4.52 1.82 0.51 0.74 1.29
Ten-Year Maturity 4.79 4.63 3.67 3.24 3.78 4.29
Freddie Mac Commitment Rates
Fixed Rate Mortgages 6.42 6.33 6.04 5.09 5.36 5.79
Adjustable Rate Mortgages 5.54 5.56 5.18 4.77 4.89 5.31
Prime Rate 7.96 8.05 5.09 3.25 3.25 3.44
� TABLE 1: National Association of Home Builders Forecast, 2006 to 2011
Notes: Data are averages of seasonally adjusted quarterly data and may not match annual data published elsewhere. Forecasted data are shaded.Source: National Association of Home Builders

10 Indiana University Kelley School of Business, Indiana Business Research Center
Indiana’s Outlook for 2010Jerry N. Conover, Ph.D.: Director, Indiana Business Research Center, Kelley School of Business, Indiana University
December 2009
I
Overall Economic Output
Personal Income
Employment and Unemployment
Other Indicators
Leading Index for Indiana
Ind
ex
93
94
95
96
97
98
99
SepAugJulJunMayAprMarFebJanDecNovOctSep
� FIGURE 1: Leading Index for Indiana, September 2008 to September 2009
Source: Indiana Business Research Center

Indiana Business Review, Winter 2009 11
I
Indiana’s Agricultural Outlook for 2010Corinne Alexander: Assistant Professor, Department of Agricultural Economics, Purdue University, West Lafayette
November 2009

12 Indiana University Kelley School of Business, Indiana Business Research Center
T
Labor Markets
Anderson Forecast 2010Dagney Faulk, Ph.D.: Director of Research, Center for Business and Economic Research, Ball State University
November 2009
Year MonthLabor Force Unemployed
Unemployment Rate
2008
September 61,129 4,027 6.6
October 61,363 4,253 6.9
November 60,683 4,594 7.6
December 60,884 5,433 8.9
Annual 60,958 4,271 7.0
2009
January 61,540 6,811 11.1
February 61,257 6,659 10.9
March 61,107 6,957 11.4
April 60,643 6,267 10.3
May 61,882 6,980 11.3
June 62,450 7,105 11.4
July 60,939 6,881 11.3
August 60,468 6,298 10.4
September* 59,977 5,822 9.7
Industry 2009*Change
since 2008
Percent Change
2008–2009
Total Nonfarm 40,538 -718 -1.7
Total Private 33,338 -918 -2.7
Goods-Producing 4,725 -919 -16.3
Manufacturing 3,038 -1,040 -25.5
Mining, Logging, and Construction
1,688 121 7.7
Service-Providing 35,813 201 0.6
Professional and Business Services
2,475 -314 -11.3
Educational and Health Services
7,850 -139 -1.7
Other Services 1,675 -3 -0.2
Information 600 0 0.0
Trade, Transportation, and Utilities
8,788 121 1.4
Financial Activities 1,688 76 4.7
Leisure and Hospitality 5,538 260 4.9
Government 7,200 200 2.9
� TABLE 1: Labor Force and Unemployment for Madison County, September 2008 to September 2009
� TABLE 2: Anderson Metro Employment by Industry, 2008 to 2009
Note: Data are not seasonally adjusted. *September 2009 data are preliminarySource: Bureau of Labor Statistics
*January through September average. September data are preliminary.Source: Bureau of Labor Statistics
Indiana Business Review, Winter 2009 13
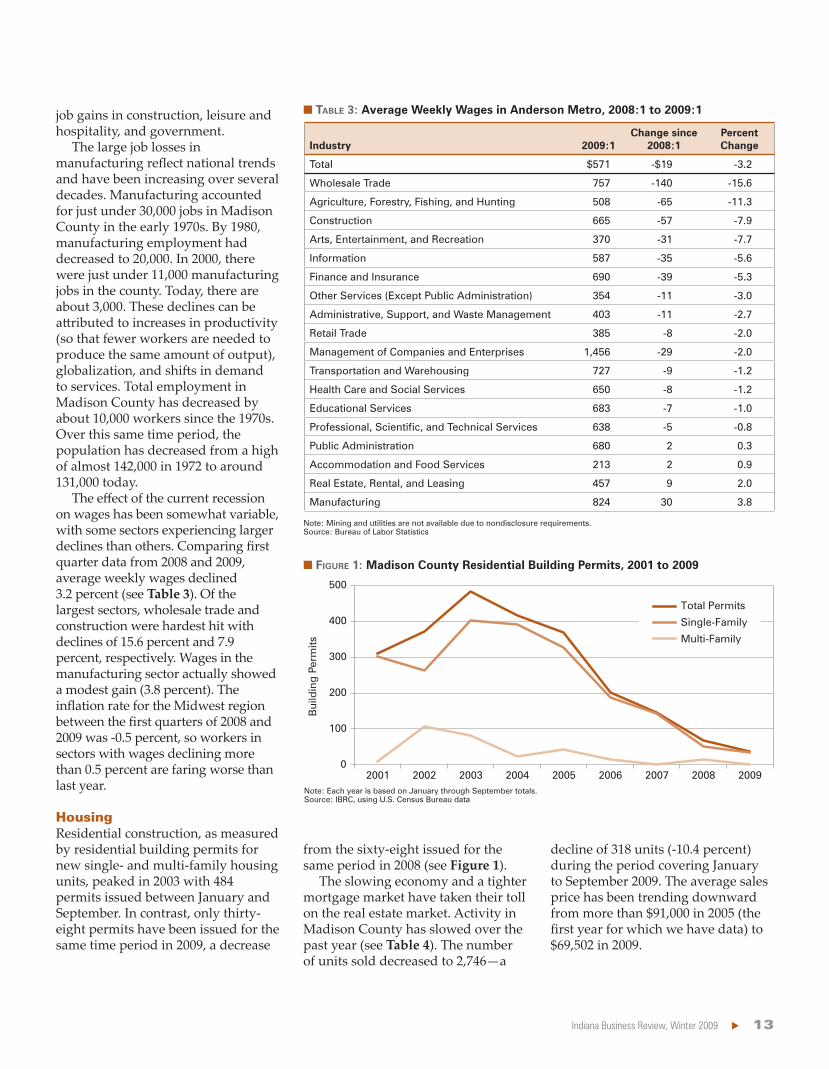
Housing
Bui
ldin
g Pe
rmits
0
100
200
300
400
500
2001 2002 2003 2004 2005 2006 2007 2008 2009
Total Permits
Single-Family
Multi-Family
Industry 2009:1Change since
2008:1Percent Change
Total $571 -$19 -3.2
Wholesale Trade 757 -140 -15.6
Agriculture, Forestry, Fishing, and Hunting 508 -65 -11.3
Construction 665 -57 -7.9
Arts, Entertainment, and Recreation 370 -31 -7.7
Information 587 -35 -5.6
Finance and Insurance 690 -39 -5.3
Other Services (Except Public Administration) 354 -11 -3.0
Administrative, Support, and Waste Management 403 -11 -2.7
Retail Trade 385 -8 -2.0
Management of Companies and Enterprises 1,456 -29 -2.0
Transportation and Warehousing 727 -9 -1.2
Health Care and Social Services 650 -8 -1.2
Educational Services 683 -7 -1.0
Professional, Scientific, and Technical Services 638 -5 -0.8
Public Administration 680 2 0.3
Accommodation and Food Services 213 2 0.9
Real Estate, Rental, and Leasing 457 9 2.0
Manufacturing 824 30 3.8
� TABLE 3: Average Weekly Wages in Anderson Metro, 2008:1 to 2009:1
� FIGURE 1: Madison County Residential Building Permits, 2001 to 2009
Note: Mining and utilities are not available due to nondisclosure requirements.Source: Bureau of Labor Statistics
Note: Each year is based on January through September totals.Source: IBRC, using U.S. Census Bureau data

14 Indiana University Kelley School of Business, Indiana Business Research Center
Bloomington Forecast 2010Timothy F. Slaper, Ph.D.: Director of Economic Analysis, Indiana Business Research Center, Kelley School of Business, Indiana University
November 2009
I
Population
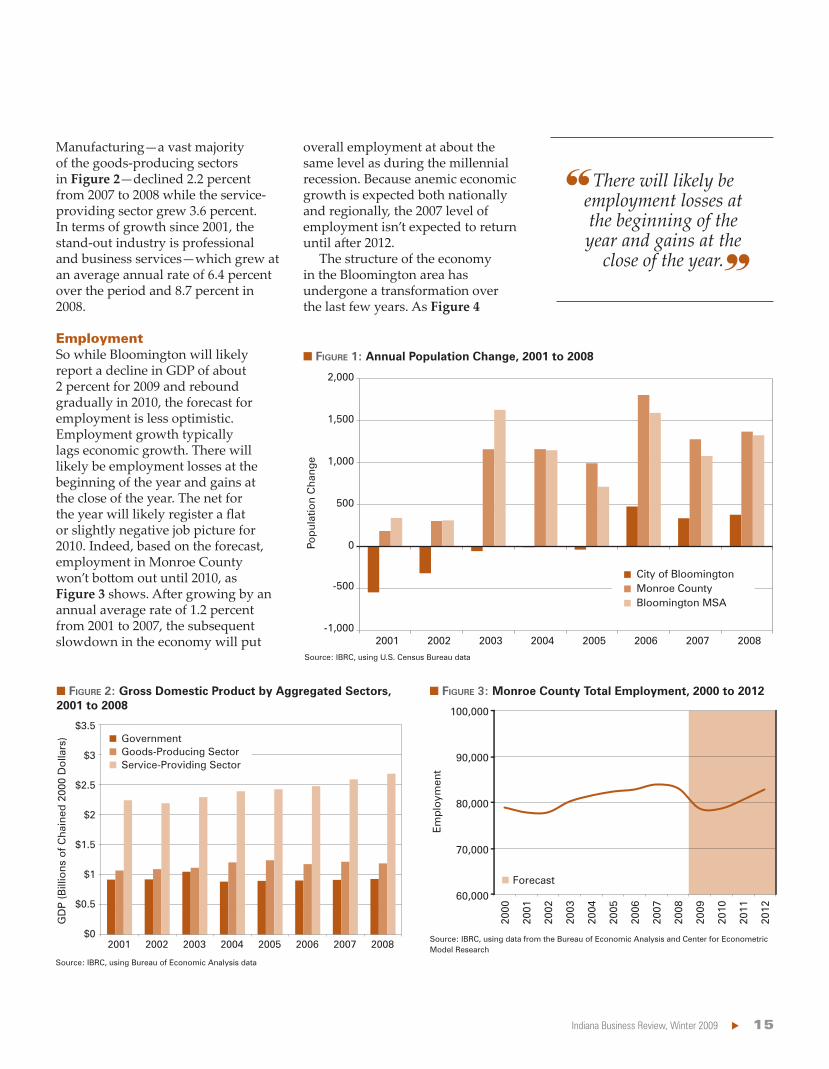
Gross Domestic Product
Social Safety Net
Gaming
Outlook
Notes
Year Units Sold Average Price
2005 3,586 $91,101
2006 3,722 84,352
2007 3,676 79,652
2008 3,064 77,362
2009 2,746 69,502
Year
Total Dollar Value of Food Stamps Issued
Number of Food Stamp Recipients
2003 $1,027,207 12,117
2004 1,153,232 13,277
2005 1,368,883 14,457
2006 1,455,455 15,384
2007 1,519,787 15,681
2008 1,549,855 14,725
2009 2,027,924 15,557
� TABLE 4: Madison County Residential Real Estate Sales, 2005 to 2009
� TABLE 5: Food Stamp Recipients in Madison County, 2003 to 2009
Note: Each year is based on January through September averages. Dollar values are not adjusted for inflation.Source: Metro Indianapolis Board of Realtors
Note: Each year is based on January through September averages. Dollar values are not adjusted for inflation.Source: STATS Indiana, using FSSA data
Indiana Business Review, Winter 2009 15
Employment
� FIGURE 2: Gross Domestic Product by Aggregated Sectors, 2001 to 2008
Source: IBRC, using Bureau of Economic Analysis data
$0
$0.5
$1
$1.5
$2
$2.5
$3
$3.5
2001 2002 2003 2004 2005 2006 2007 2008
GD
P (B
illio
ns o
f Cha
ined
200
0 D
olla
rs) Government
Goods-Producing SectorService-Providing Sector
� FIGURE 3: Monroe County Total Employment, 2000 to 2012
Source: IBRC, using data from the Bureau of Economic Analysis and Center for Econometric Model Research
60,000
70,000
80,000
90,000
100,000
2000
2001
2002
2003
2004
2005
2006
2007
2008
2009
2010
2011
2012
Em
plo
ymen
t
Forecast
� FIGURE 1: Annual Population Change, 2001 to 2008
Source: IBRC, using U.S. Census Bureau data
-1,000
-500
0
500
1,000
1,500
2,000
2001 2002 2003 2004 2005 2006 2007 2008
Pop
ulat
ion
Cha
nge
City of BloomingtonMonroe CountyBloomington MSA

16 Indiana University Kelley School of Business, Indiana Business Research Center
Per Capita Personal Income
Housing
50
75
100
125
150
175
200
2001 2002 2003 2004 2005 2006 2007
Ind
ex (2
001
= 1
00)
Total Employment
Proprietor’s Employment
Manufacturing
Retail Trade
Administrative and Waste Services
Educational Services
$0
$10,000
$20,000
$30,000
$40,000
2000 2001 2002 2003 2004 2005 2006 2007
Per
Cap
ita P
erso
nal I
nco
me
United StatesIndianaMonroe County
� FIGURE 4: Industries in Monroe County with Notable Employment Gains and Losses, 2001 to 2007
� TABLE 1: Monroe County Real Estate Market Compared to Other Selected Indiana Counties, 2008 to 2009
� FIGURE 5: Per Capita Personal Income, 2000 to 2007
Source: IBRC, using Bureau of Economic Analysis data
*From previous yearNote: 2009 data includes January through September only.Source: IBRC, using Indiana Association of Realtors dataSource: IBRC, using Bureau of Economic Analysis data
County
Percent Change in
Units Sold*
Percent Change
in Median Sales Price*
Indiana -13.5 -3.2
Monroe -2.8 -2.6
Vanderburgh -8.1 0.5
Allen -10.3 1.1
Tippecanoe -10.9 -2.0
Marion -14.4 -2.4
St. Joseph -22.1 -1.2
Bartholomew -39.4 -5.3

Indiana Business Review, Winter 2009 17
A
� FIGURE 1: Three-Month Moving Average Unemployment Rates, 1990 to September 2009
Source: Bureau of Labor Statistics
Columbus Forecast 2010Michael J. Oakes: Senior Lecturer in Finance, Division of Business, Indiana University–Purdue University Columbus
November 2009
2001
2000
1999
1998
1997
1996
1994
1995
1993
1992
1991
1990
2002
2003
2004
2005
2006
2007
2008
2009
0%
2%
4%
6%
8%
10%
12%
Une
mp
loym
ent
Rat
e
United StatesIndianaBartholomew County
18 Indiana University Kelley School of Business, Indiana Business Research Center
The Outlook
Evansville Forecast 2010Mohammed Khayum: Professor of Economics and Dean of Business, College of Business, University of Southern Indiana
November 2009
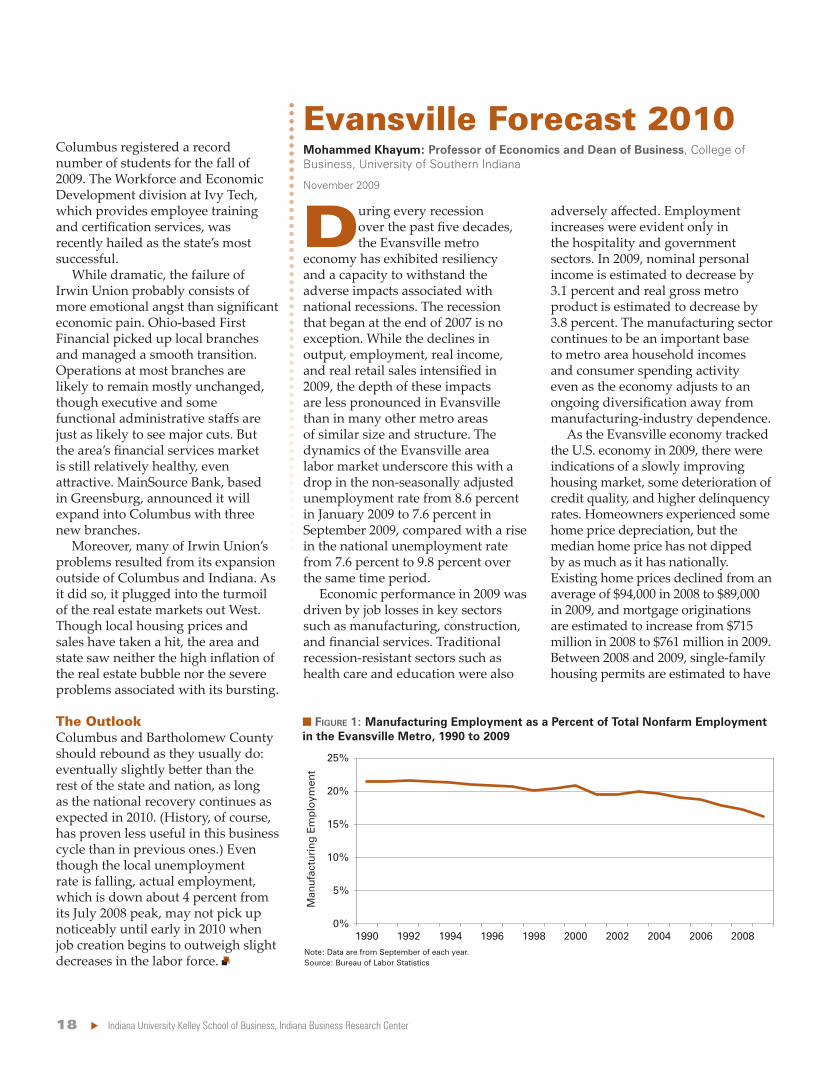
D
� FIGURE 1: Manufacturing Employment as a Percent of Total Nonfarm Employment in the Evansville Metro, 1990 to 2009
Note: Data are from September of each year.Source: Bureau of Labor Statistics
0%
5%
10%
15%
20%
25%
1990 1992 1994 1996 1998 2000 2002 2004 2006 2008
Man
ufac
turi
ng E
mp
loym
ent

Indiana Business Review, Winter 2009 19
Industry Evansville Metro United States Indiana
Manufacturing 16.2 9.0 15.6
Durable Goods 52.3 60.9 69.4
Nondurable Goods 47.7 39.1 30.6
� FIGURE 2: Average Growth of Personal Income
� TABLE 1: Manufacturing Percent of Total Employment, September 2009
� FIGURE 3: Average Growth of Total Employment
*Includes forecasted dataSource: Center for Econometric Model Research
*Includes forecasted dataSource: Center for Econometric Model Research Source: Bureau of Labor Statistics
0%
2%
4%
6%
Evansville Indiana
Per
sona
l Inc
om
e
2003 to 2007 2008 to 2012*
-0.5%
0.0%
0.5%
1.0%
Evansville
2003 to 2007 2008 to 2012*
Indiana
To
tal E
mp
loym
ent
Gro
wth
20 Indiana University Kelley School of Business, Indiana Business Research Center
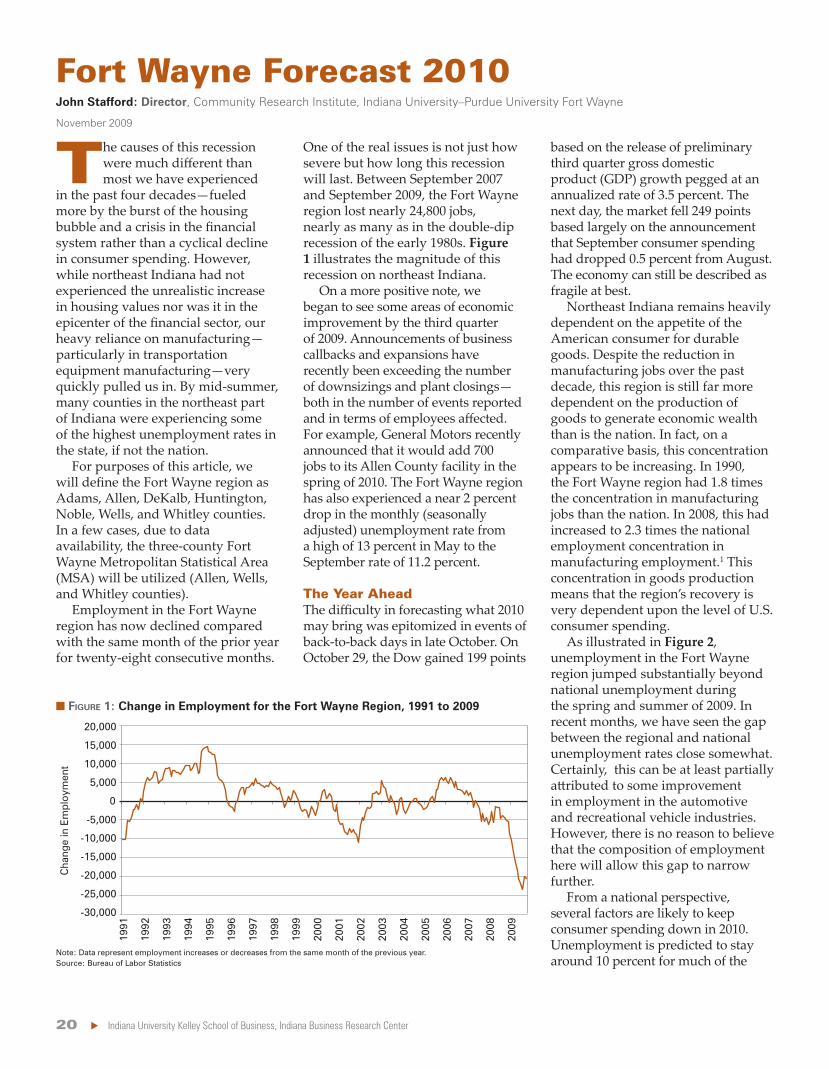
T
The Year Ahead
Fort Wayne Forecast 2010John Stafford: Director, Community Research Institute, Indiana University–Purdue University Fort Wayne
November 2009
-30,000
-25,000
-20,000
-15,000
-10,000
-5,000
0
5,000
10,000
15,000
20,000
1991
1992
1993
1994
1995
1996
1997
1998
1999
2000
2001
2002
2003
2004
2005
2006
2007
2008
2009
Cha
nge
in E
mpl
oym
ent
� FIGURE 1: Change in Employment for the Fort Wayne Region, 1991 to 2009
Note: Data represent employment increases or decreases from the same month of the previous year.Source: Bureau of Labor Statistics

Indiana Business Review, Winter 2009 21
The Longer-Term Perspective
� FIGURE 2: Monthly Unemployment Rates, November 2007 to September 2009
Source: Bureau of Labor Statistics
4%
6%
8%
10%
12%
14%
Nov Jan JanJul JulApr AprOct Sep
Une
mp
loym
ent R
ate
Fort Wayne Region
United States
2007 20092008

22 Indiana University Kelley School of Business, Indiana Business Research Center
Gary Forecast 2010Donald A. Coffin, Ph.D.: Associate Professor of Economics, School of Business and Economics, Indiana University Northwest
November 2009
W
Sector
Percent Change
since 2008
Percent Change
since 2007 Recession
Percent Change
after 2001 Recession*
Percent Change
after 1991 Recession*
Total Establishment Employment -4.8 -3.4 -2.8 2.5
Total Household Employment -2.1 -5.2 -3.7 3.3
Goods Production -9.1 -9.6 -11.1 4.9
Construction -17.5 -19.0 -14.5 5.3
Manufacturing -4.7 -4.4 -9.6 4.7
Durable Goods -6.2 -5.6 -7.2 -0.2
Primary Metals -2.6 0.5 -7.1 -2.2
Iron and Steel Mills 2.3 5.2 -8.7 -2.0
Wholesale Trade 0.0 1.0 -8.3 4.3
Retail Trade -0.9 -9.1** -10.8 -2.8
General Merchandise Stores -3.1 -18.2** -3.0 2.1
Information Activities -4.5 -4.5 -21.9 -6.5
Financial Activities -2.2 -6.2 -5.8 0.9
Private Education and Health 0.2 -1.5 9.9 11.0
Private Education 1.4 -6.5 27.5 23.9
Health Care and Social Assistance 0.0 -0.5 7.0 8.4
General Medical and Surgical Hospitals
3.1 0.0 2.6 3.8
Arts, Entertainment, and Recreation 1.2 13.3 -11.8 29.7
Accommodation and Food Services -0.9 0.0 -6.1 6.8
Federal, State, and Local Government 2.3 2.3 13.4 0.8
Federal -4.8 0.0 -4.3 3.8
State 4.7 4.7 2.2 2.3
Local 2.4 2.1 16.5 0.3
Local (Excluding Education) 1.4 4.3 -4.3 4.0
Local Public Education 3.2 0.5 4.4 -2.3
� TABLE 1: Employment Gains and Losses Following Economic Recessions for Selected Sectors in Northwest Indiana
*Eighteen months after recession troughs, November 2001 and March 1991**December 2007 employment includes seasonal hiringSource: Bureau of Labor Statistics
Notes

Indiana Business Review, Winter 2009 23
A Look at the Recession
� FIGURE 1: Household Employment and Establishment Employment in Northwest Indiana, 1990 to 2009
Note: Graph shows both monthly values and the trend line.Source: Bureau of Labor Statistics
250,000
275,000
300,000
325,000
350,000
375,000
400,000
1990 1992 1994 1996 1998 2000 2002 2004 2006 2008 2010
Em
plo
ymen
t
Household
Establishment

24 Indiana University Kelley School of Business, Indiana Business Research Center
As the Recovery Develops
� FIGURE 2: Unemployment Rate in Northwest Indiana, 1990 to 2009
Source: Bureau of Labor Statistics
0%
2%
4%
6%
8%
10%
12%
14%
1990 1992 1994 1996 1998 2000 2002 2004 2006 2008 2010
Une
mp
loym
ent R
ate
Monthly Rate
Trend Line
Indiana Business Review, Winter 2009 25
Conclusions
Notes
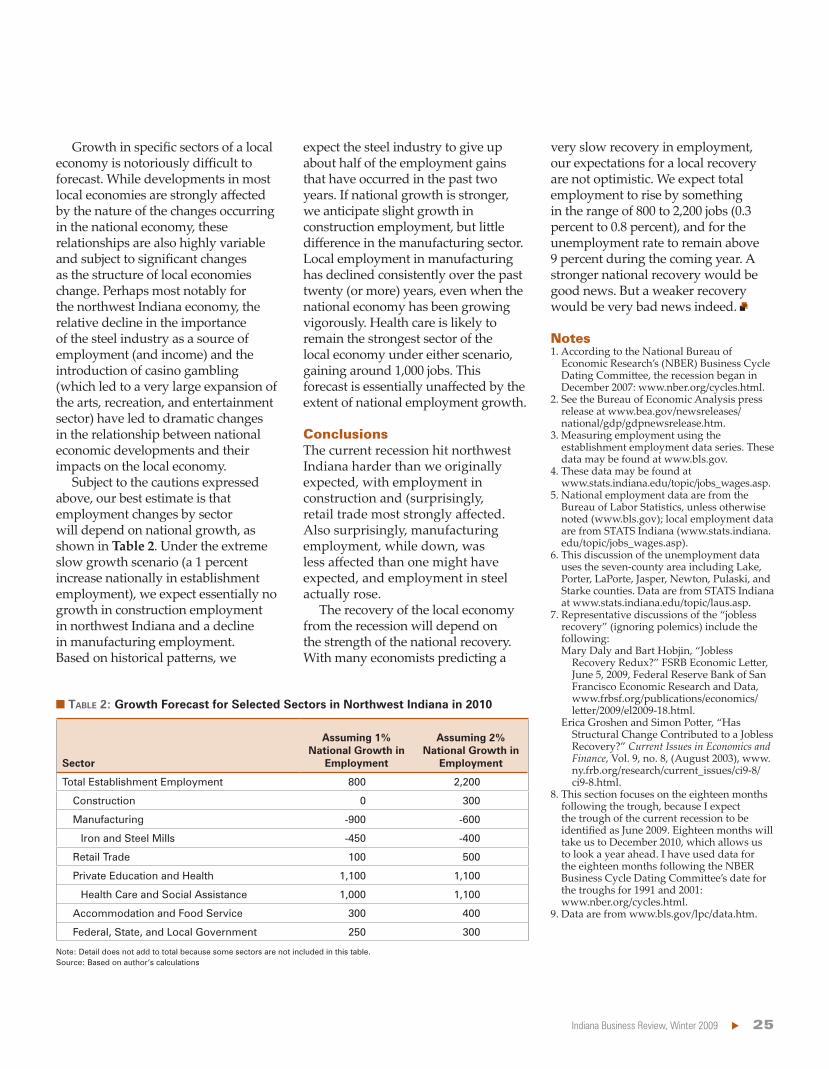
Sector
Assuming 1% National Growth in
Employment
Assuming 2% National Growth in
Employment
Total Establishment Employment 800 2,200
Construction 0 300
Manufacturing -900 -600
Iron and Steel Mills -450 -400
Retail Trade 100 500
Private Education and Health 1,100 1,100
Health Care and Social Assistance 1,000 1,100
Accommodation and Food Service 300 400
Federal, State, and Local Government 250 300
Note: Detail does not add to total because some sectors are not included in this table.Source: Based on author’s calculations
� TABLE 2: Growth Forecast for Selected Sectors in Northwest Indiana in 2010

26 Indiana University Kelley School of Business, Indiana Business Research Center
L
Employment2
Income3
Real Estate and Residential Construction
Indianapolis-Carmel Forecast 2010Kyle J. Anderson, Ph.D.: Visiting Assistant Professor of Business Economics, Kelley School of Business, Indiana University
November 2009
0%
2%
4%
6%
8%
10%
United States Indianapolis
1990
1991
1992
1993
1994
1995
1996
1997
1998
1999
2000
2001
2002
2003
2004
2005
2006
2007
2008
2009
Une
mp
loym
ent R
ate
� FIGURE 1: Comparison of Unemployment Rates, January 1990 to September 2009
Source: STATS Indiana, using Bureau of Labor Statistics data

Indiana Business Review, Winter 2009 27
Forecast
Notes
� TABLE 1: Wages and Jobs for Selected Industries in the Indianapolis Metro, 2008:1 to 2009:1
Industry
Jobs Average Wages Percent Change in Total Wages
2009 Percent
Percent Change since 2008 Weekly
Percent Change since 2008
Total 100 -3.4 $854 -3.0 -6.3
Construction 4.6 -17.8 904 -2.1 -19.5
Finance and Insurance 5.0 -3.4 1,225 -13.2 -16.1
Management of Companies and Enterprises
1.3 -3.5 1,680 -12.1 -15.2
Administrative, Support, and Waste Management
6.6 -14.2 533 0.9 -13.5
Manufacturing 10.6 -9.4 1,556 -0.8 -10.1
Real Estate, Rental, and Leasing
1.7 -2.2 779 -7.8 -9.7
Arts, Entertainment, and Recreation
1.3 -1.9 1,049 -5.4 -7.2
Information 2.1 -3.0 1,079 -4.2 -7.1
Transportation and Warehousing
6.1 -2.9 704 -3.8 -6.6
Wholesale Trade 4.9 -4.3 1,062 -2.2 -6.4
Retail Trade 10.6 -3.5 469 -1.9 -5.3
Accommodation and Food Services
8.7 -2.5 270 -2.2 -4.5
Other Services (Except Public Administration)
3.2 -2.6 594 -1.5 -4.1
Professional, Scientific, and Technical Services
5.3 0.2 1,160 -1.0 -0.8
Public Administration 5.2 1.6 874 2.0 3.6
Health Care and Social Services
13.6 5.1 812 -0.9 4.1
Educational Services 8.0 3.3 768 0.9 4.2
Source: STATS Indiana, using QCEW data
28 Indiana University Kelley School of Business, Indiana Business Research Center
T
Jobs and Unemployment
Real Estate
Kokomo Forecast 2010Jason VanAlstine: Assistant Professor of Economics, Indiana University Kokomo
November 2009
Source: Bureau of Labor Statistics
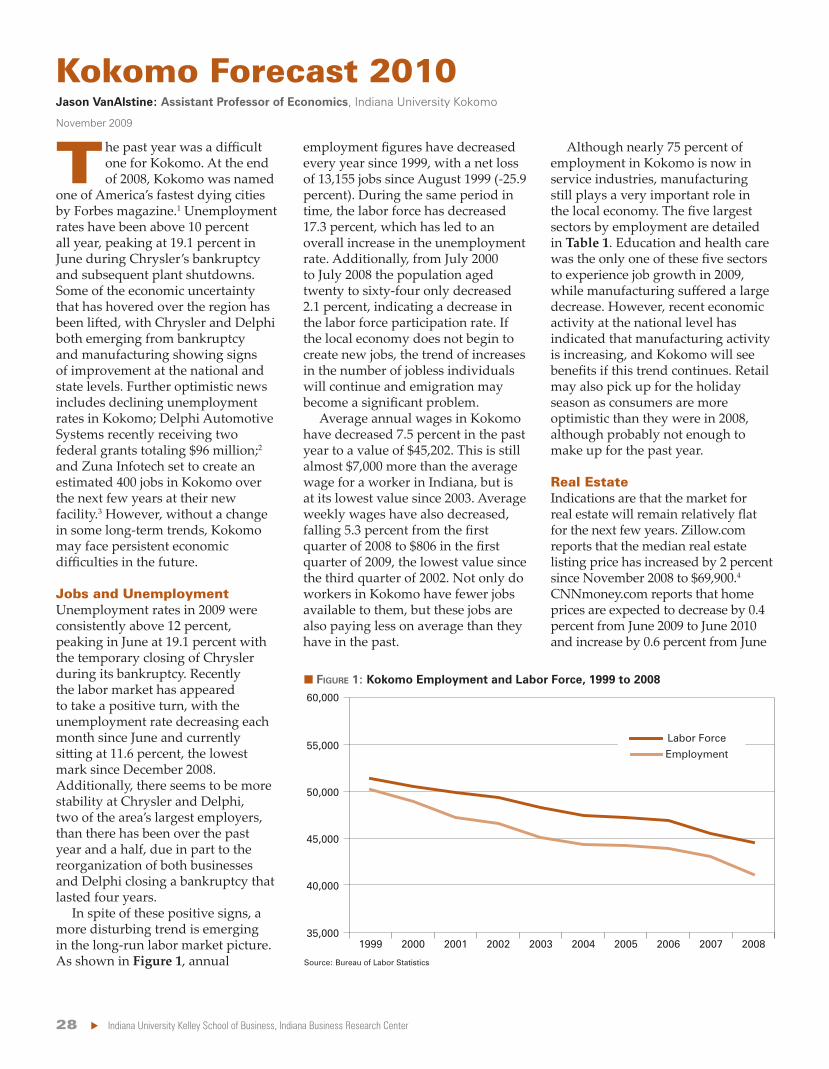
� FIGURE 1: Kokomo Employment and Labor Force, 1999 to 2008
40,000
35,000
45,000
50,000
55,000
60,000
1999 2000 2001 2002 2003 2004 2005 2006 2007 2008
Labor Force
Employment

Indiana Business Review, Winter 2009 29
Outlook
References
Notes
A
Labor
Lafayette Forecast 2010Tanya Hall: Economic Research Analyst, Indiana Business Research Center, Kelley School of Business, Indiana University
November 2009
Source: Bureau of Labor Statistics
� TABLE 1: Kokomo’s Largest Economic Sectors by Employment, January 2007 to September 2009
September 2009
Sector 2007 2008 Employment Percent of Total Jobs
Manufacturing 14,100 12,000 9,600 23.4
Government 7,700 7,800 7,800 19.0
Retail 5,700 5,600 5,400 13.2
Education and Health 4,100 4,200 4,500 11.0
Leisure and Hospitality 4,500 4,500 4,300 10.5

30 Indiana University Kelley School of Business, Indiana Business Research Center
Year MonthLabor Force Unemployed
Unemployment Rate
2008
August 95,748 4,775 5.0
September 98,140 4,558 4.6
October 99,055 4,660 4.7
November 98,471 5,301 5.4
December 97,507 5,919 6.1
Annual 97,413 4,744 4.9
2009
January 99,108 8,287 8.4
February 98,871 8,292 8.4
March 98,742 8,619 8.7
April 98,815 8,148 8.2
May 100,501 8,826 8.8
June 101,237 10,540 10.4
July 96,528 10,381 10.8
August 93,169 8,318 8.9
0
500
1,000
1,500
2,000
2,500
3,000
3,500
4,000
2001 2002 2003 2004 2005 2006 2007 2008
Ann
ual P
op
ulat
ion
Cha
nge
Lafayette MSATippecanoe County
� TABLE 1: Labor Force and Unemployment for the Lafayette MSA, 2008 to 2009
� FIGURE 1: Annual Population Change in the Lafayette MSA and Tippecanoe County, 2001 to 2008
Source: IBRC, using Bureau of Labor Statistics data
Source: IBRC, using Bureau of Labor Statistics data
Industry 2009*Change
since 2008
Percent Change
2008–2009
Total Nonfarm 94,244 -1,556 -1.6
Total Private 65,378 -1,756 -2.6
Goods-Producing 18,556 -1,653 -8.2
Manufacturing 15,356 -1,369 -8.2
Mining, Logging, and Construction
3,200 -283 -8.1
Service-Providing 75,689 56 0.1
Professional and Business Services
5,567 -158 -2.8
Trade, Transportation, and Utilities
14,244 -131 -0.9
Financial Activities 3,811 -22 -0.6
Other Services 2,978 3 0.1
Leisure and Hospitality 8,767 67 0.8
Private Educational and Health Services
10,456 197 1.9
Government 28,867 158 0.6
� TABLE 2: Lafayette MSA Employment, 2008 to 2009
*January through September average. September data are preliminary. Annual data are used for 2008.Source: IBRC, using Bureau of Labor Statistics data
Indiana Business Review, Winter 2009 31
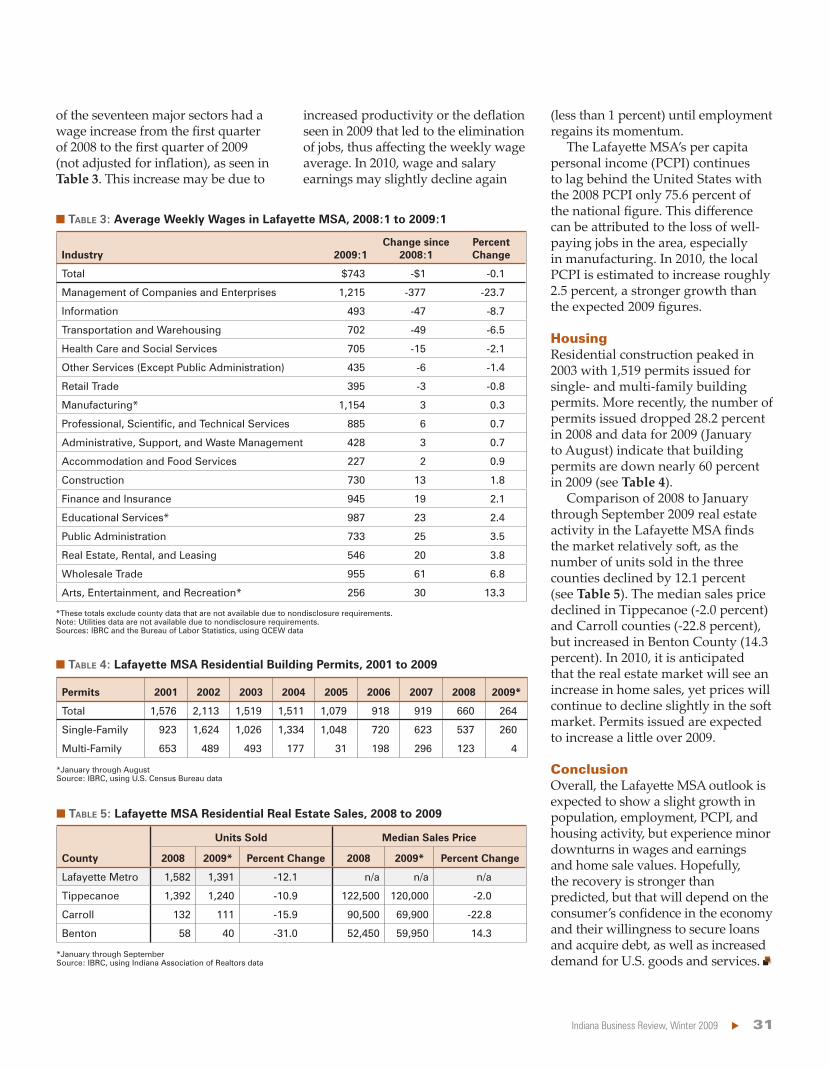
Housing
Conclusion
Industry 2009:1Change since
2008:1Percent Change
Total $743 -$1 -0.1
Management of Companies and Enterprises 1,215 -377 -23.7
Information 493 -47 -8.7
Transportation and Warehousing 702 -49 -6.5
Health Care and Social Services 705 -15 -2.1
Other Services (Except Public Administration) 435 -6 -1.4
Retail Trade 395 -3 -0.8
Manufacturing* 1,154 3 0.3
Professional, Scientific, and Technical Services 885 6 0.7
Administrative, Support, and Waste Management 428 3 0.7
Accommodation and Food Services 227 2 0.9
Construction 730 13 1.8
Finance and Insurance 945 19 2.1
Educational Services* 987 23 2.4
Public Administration 733 25 3.5
Real Estate, Rental, and Leasing 546 20 3.8
Wholesale Trade 955 61 6.8
Arts, Entertainment, and Recreation* 256 30 13.3
County
Units Sold Median Sales Price
2008 2009* Percent Change 2008 2009* Percent Change
Lafayette Metro 1,582 1,391 -12.1 n/a n/a n/a
Tippecanoe 1,392 1,240 -10.9 122,500 120,000 -2.0
Carroll 132 111 -15.9 90,500 69,900 -22.8
Benton 58 40 -31.0 52,450 59,950 14.3
Permits 2001 2002 2003 2004 2005 2006 2007 2008 2009*
Total 1,576 2,113 1,519 1,511 1,079 918 919 660 264
Single-Family 923 1,624 1,026 1,334 1,048 720 623 537 260
Multi-Family 653 489 493 177 31 198 296 123 4
� TABLE 3: Average Weekly Wages in Lafayette MSA, 2008:1 to 2009:1
� TABLE 4: Lafayette MSA Residential Building Permits, 2001 to 2009
� TABLE 5: Lafayette MSA Residential Real Estate Sales, 2008 to 2009
*These totals exclude county data that are not available due to nondisclosure requirements.Note: Utilities data are not available due to nondisclosure requirements.Sources: IBRC and the Bureau of Labor Statistics, using QCEW data
*January through AugustSource: IBRC, using U.S. Census Bureau data
*January through SeptemberSource: IBRC, using Indiana Association of Realtors data

32 Indiana University Kelley School of Business, Indiana Business Research Center
T
The Labor Markets
Manufacturing
Louisville Forecast 2010Uric Dufrene: Sanders Chair in Business, Indiana University Southeast, New Albany
November 2009
� TABLE 1: Percent Change in Louisville Metro Nonfarm Payroll Employment, 2006 to 2009*
� FIGURE 1: Unemployment Rates for Selected Regions, 2008 to 2009
*Calculated using January through September data for each yearSource: Bureau of Labor Statistics
*Includes Clark, Floyd, Harrison, and Washington counties**Includes Crawford, Jackson, Jefferson, Orange, and Scott countiesSource: Bureau of Labor Statistics
Industry 2006–2007 2007–2008 2008–2009
Total 6.1 -7.4 -23.6
Construction 1.4 0.0 -5.7
Transportation and Utilities 1.5 -1.8 -4.5
Manufacturing -2.5 -7.4 -3.9
Retail 1.2 -1.5 -3.9
Professional and Business Services 0.8 0.3 -2.7
Wholesale 0.1 -0.2 -1.7
Leisure and Hospitality 0.5 0.9 -1.5
Financial Activities 1.1 0.1 -0.8
Other Services 0.1 -0.6 -0.4
Information 0.4 0.4 -0.2
Education and Health Services 2.0 1.7 0.8
Government -0.5 0.7 0.9
Une
mp
loym
ent R
ate
Jan Mar MarMay MayJul Sep Nov Jan Jul Sep0%
2%
4%
6%
8%
10%
12%
Southern Indiana Metro Counties*Southern Indiana Nonmetro Counties**Louisville MetroIndiana
2008 2009

Indiana Business Review, Winter 2009 33
Consumer-Related Sectors
Housing and Real Estate
Outlook for 2010
Notes
*Includes Clark, Crawford, Floyd, Harrison, Scott, and Washington countiesSource: Indiana Department of Workforce Development
Note: Calculated using January through August data of each year.Source: State of the Cities Data Systems
� FIGURE 2: Unemployment Claims for Economic Growth Region 10, January 2008 to September 2009*
Jan
Jun
Dec Jan
Jun
Sep
Une
mp
loym
ent
Cla
ims
0
1,000
2,000
3,000
4,000
5,000
6,000New ClaimsContinuing Claims
2008 2008 20092009
� FIGURE 3: Building Permits for the Louisville Metro, 2005 to 2009
0
1,000
2,000
3,000
4,000
5,000
6,000
7,000
2005 2006 2007 2008 2009
Total Permits
Single-Family
Multi-Family
Bui
ldin
g Pe
rmits
34 Indiana University Kelley School of Business, Indiana Business Research Center
Muncie Forecast 2010Dagney Faulk, Ph.D.: Director of Research, Center for Business and Economic Research, Ball State University
November 2009
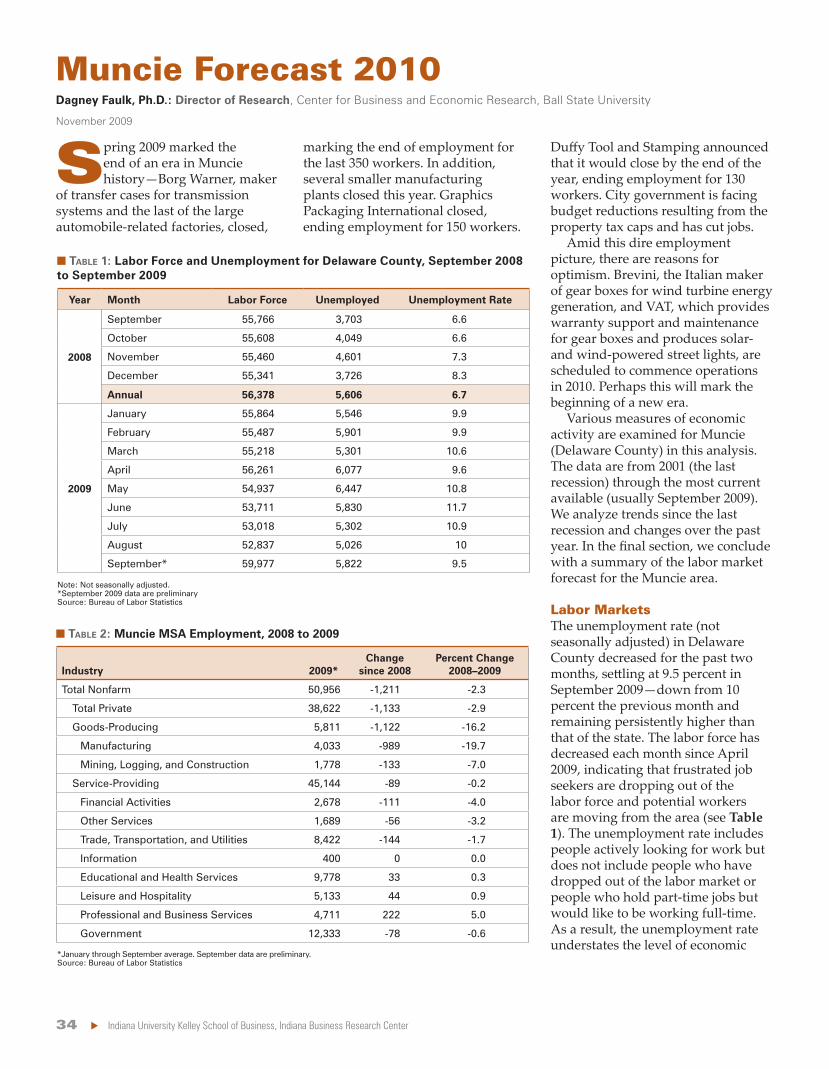
S
Labor Markets
Year Month Labor Force Unemployed Unemployment Rate
2008
September 55,766 3,703 6.6
October 55,608 4,049 6.6
November 55,460 4,601 7.3
December 55,341 3,726 8.3
Annual 56,378 5,606 6.7
2009
January 55,864 5,546 9.9
February 55,487 5,901 9.9
March 55,218 5,301 10.6
April 56,261 6,077 9.6
May 54,937 6,447 10.8
June 53,711 5,830 11.7
July 53,018 5,302 10.9
August 52,837 5,026 10
September* 59,977 5,822 9.5
Industry 2009*Change
since 2008Percent Change
2008–2009
Total Nonfarm 50,956 -1,211 -2.3
Total Private 38,622 -1,133 -2.9
Goods-Producing 5,811 -1,122 -16.2
Manufacturing 4,033 -989 -19.7
Mining, Logging, and Construction 1,778 -133 -7.0
Service-Providing 45,144 -89 -0.2
Financial Activities 2,678 -111 -4.0
Other Services 1,689 -56 -3.2
Trade, Transportation, and Utilities 8,422 -144 -1.7
Information 400 0 0.0
Educational and Health Services 9,778 33 0.3
Leisure and Hospitality 5,133 44 0.9
Professional and Business Services 4,711 222 5.0
Government 12,333 -78 -0.6
� TABLE 1: Labor Force and Unemployment for Delaware County, September 2008 to September 2009
� TABLE 2: Muncie MSA Employment, 2008 to 2009
Note: Not seasonally adjusted. *September 2009 data are preliminarySource: Bureau of Labor Statistics
*January through September average. September data are preliminary. Source: Bureau of Labor Statistics
Indiana Business Review, Winter 2009 35
Industry 2009:1Change Since
2008:1 Percent Change
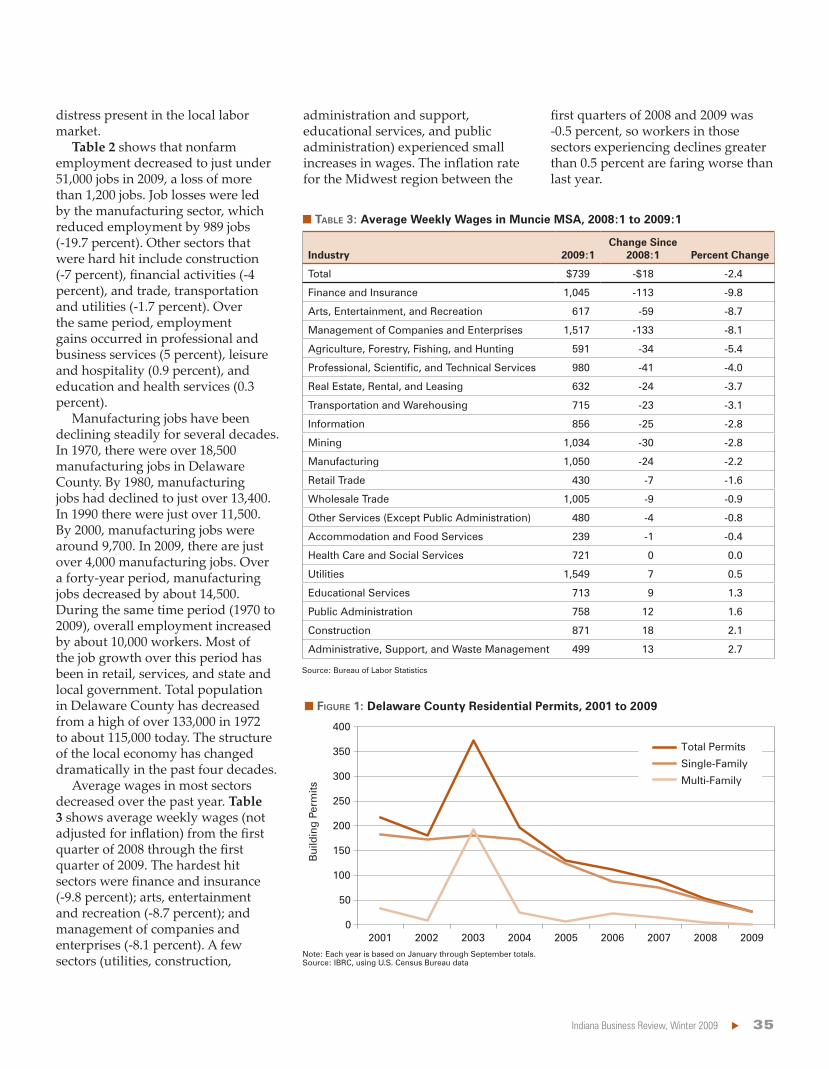
Total $739 -$18 -2.4
Finance and Insurance 1,045 -113 -9.8
Arts, Entertainment, and Recreation 617 -59 -8.7
Management of Companies and Enterprises 1,517 -133 -8.1
Agriculture, Forestry, Fishing, and Hunting 591 -34 -5.4
Professional, Scientific, and Technical Services 980 -41 -4.0
Real Estate, Rental, and Leasing 632 -24 -3.7
Transportation and Warehousing 715 -23 -3.1
Information 856 -25 -2.8
Mining 1,034 -30 -2.8
Manufacturing 1,050 -24 -2.2
Retail Trade 430 -7 -1.6
Wholesale Trade 1,005 -9 -0.9
Other Services (Except Public Administration) 480 -4 -0.8
Accommodation and Food Services 239 -1 -0.4
Health Care and Social Services 721 0 0.0
Utilities 1,549 7 0.5
Educational Services 713 9 1.3
Public Administration 758 12 1.6
Construction 871 18 2.1
Administrative, Support, and Waste Management 499 13 2.7
� TABLE 3: Average Weekly Wages in Muncie MSA, 2008:1 to 2009:1
Source: Bureau of Labor Statistics
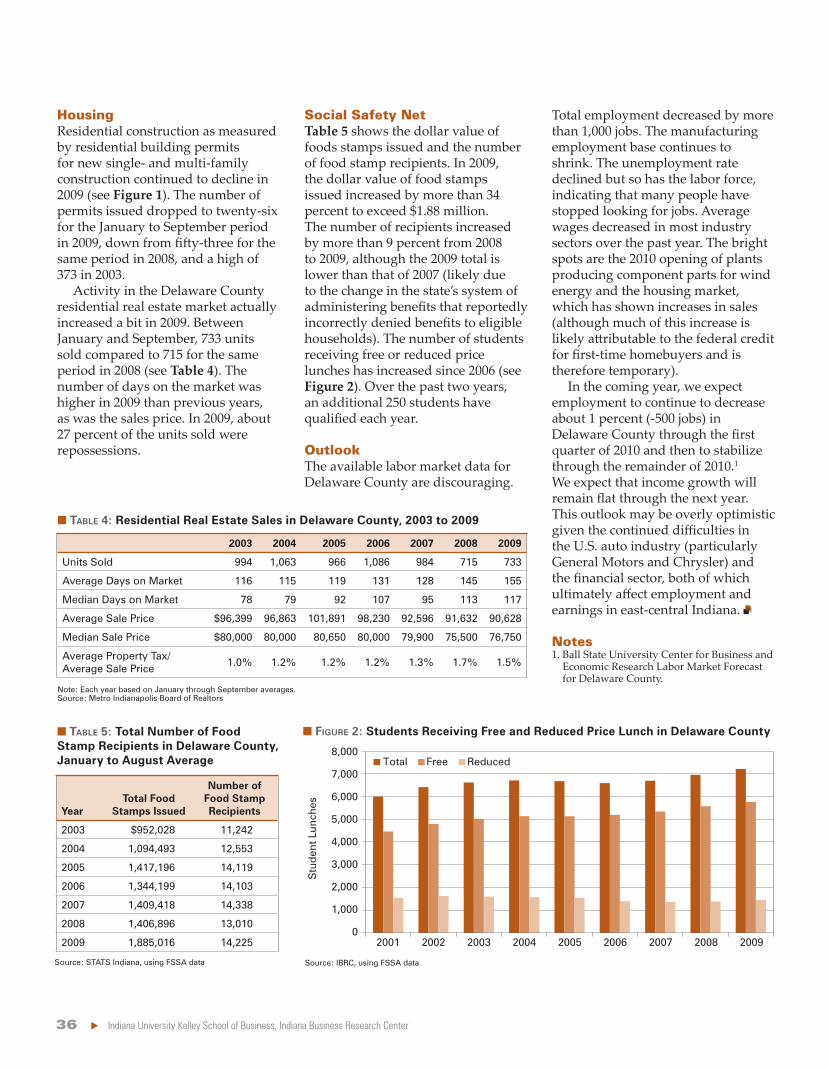
Bui
ldin
g Pe
rmits
0
50
100
150
200
250
300
350
400
2001 2002 2003 2004 2005 2006 2007 2008 2009
Total Permits
Single-Family
Multi-Family
� FIGURE 1: Delaware County Residential Permits, 2001 to 2009
Note: Each year is based on January through September totals.Source: IBRC, using U.S. Census Bureau data
36 Indiana University Kelley School of Business, Indiana Business Research Center
Housing Social Safety Net
Outlook
Notes
2003 2004 2005 2006 2007 2008 2009
Units Sold 994 1,063 966 1,086 984 715 733
Average Days on Market 116 115 119 131 128 145 155
Median Days on Market 78 79 92 107 95 113 117
Average Sale Price $96,399 96,863 101,891 98,230 92,596 91,632 90,628
Median Sale Price $80,000 80,000 80,650 80,000 79,900 75,500 76,750
Average Property Tax/Average Sale Price
1.0% 1.2% 1.2% 1.2% 1.3% 1.7% 1.5%
YearTotal Food
Stamps Issued
Number of Food Stamp Recipients
2003 $952,028 11,242
2004 1,094,493 12,553
2005 1,417,196 14,119
2006 1,344,199 14,103
2007 1,409,418 14,338
2008 1,406,896 13,010
2009 1,885,016 14,225
Stu
den
t Lun
ches
Total Free Reduced
0
1,000
2,000
3,000
4,000
5,000
6,000
7,000
8,000
2001 2002 2003 2004 2005 2006 2007 2008 2009
� TABLE 4: Residential Real Estate Sales in Delaware County, 2003 to 2009
� FIGURE 2: Students Receiving Free and Reduced Price Lunch in Delaware County� TABLE 5: Total Number of Food Stamp Recipients in Delaware County, January to August Average
Source: STATS Indiana, using FSSA data
Note: Each year based on January through September averages.Source: Metro Indianapolis Board of Realtors
Source: IBRC, using FSSA data

Indiana Business Review, Winter 2009 37
A
Richmond Forecast 2010Tim G. Rogers: President/CEO, Economic Development Corporation of Wayne County
Renee L. Doty: Manager of Community Affairs, Economic Development Corporation of Wayne County
November 2009
CountySeptember 2009
Unemployment Rate2007 Median
Household Income2008
PopulationPopulation Growth
since 1990
Wayne 10.9 $39,239 67,795 -5.8
Henry 12.0 42,306 47,162 -2.0
Randolph 10.2 40,071 25,801 -5.0
Fayette 13.4 39,948 24,265 -6.7
Union 8.6 41,103 7,157 2.9
Darke, OH 9.9 46,556 52,027 -3.0
Preble, OH 11.1 48,323 41,643 3.8
� TABLE 1: Unemployment, Household Income and Population in Wayne and Surrounding Counties
Sources: Bureau of Labor Statistics, U.S. Census Bureau, and Ohio Department of Jobs and Family Services
38 Indiana University Kelley School of Business, Indiana Business Research Center
T
Gross Domestic Product
Employment
South Bend and Elkhart Area Forecast 2010Grant C. Black: Director of the Bureau of Business and Economic Research and Assistant Professor of Economics, Indiana University South Bend
November 2009
0%
5%
10%
15%
20%
1990
1991
1992
1993
1994
1995
1996
1997
1998
Une
mp
loym
ent R
ate
1999
2000
2001
2002
2003
2004
2005
2006
2007
2008
2009
Elkhart-Goshen
South Bend-Mishawaka
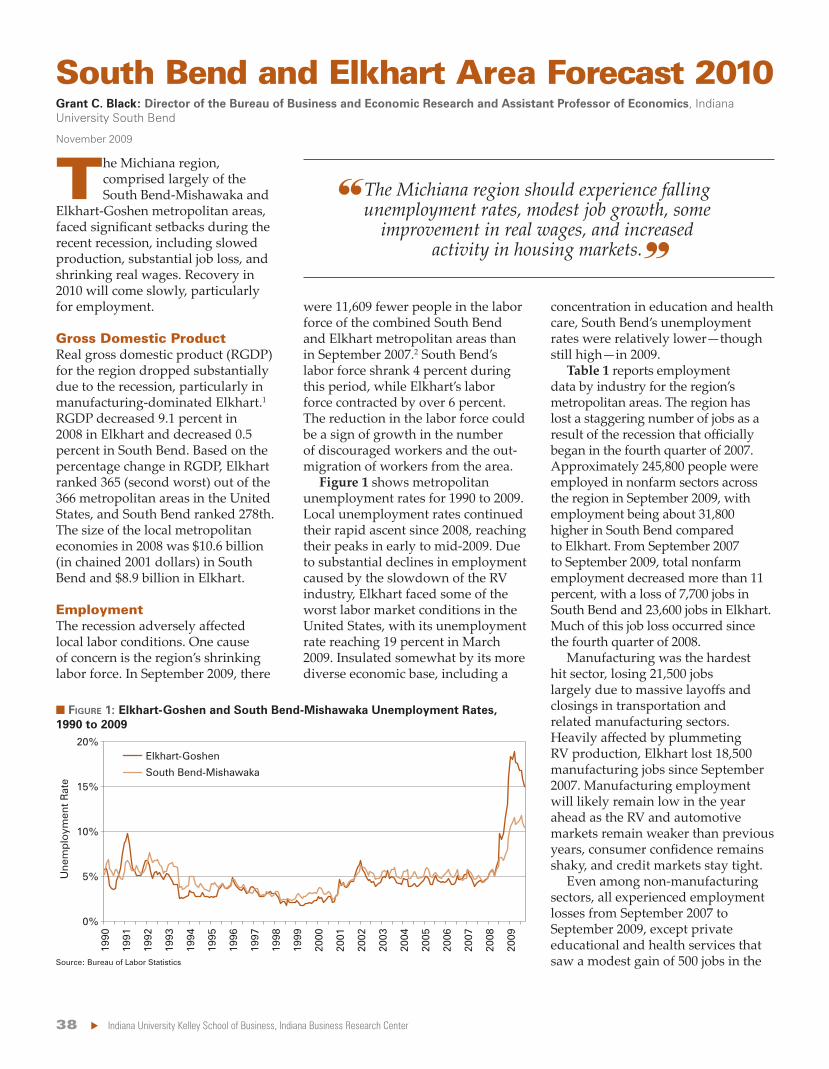
� FIGURE 1: Elkhart-Goshen and South Bend-Mishawaka Unemployment Rates, 1990 to 2009
Source: Bureau of Labor Statistics
Indiana Business Review, Winter 2009 39
WagesHousing
Industry
South Bend Elkhart Combined
EmploymentChange since
September 2007 EmploymentChange since
September 2007 EmploymentChange since
September 2007
Total Nonfarm 138,800 -7,700 107,000 -23,600 245,800 -31,300
Manufacturing 16,800 -3,000 44,000 -18,500 60,800 -21,500
Professional and Business Services 13,000 -1,200 7,200 -1,900 20,200 -3,100
Trade, Transportation, and Utilities 27,200 -1,200 17,400 -1,200 44,600 -2,400
Natural Resources, Mining, and Construction
5,600 -1,000 3,800 -700 9,400 -1,700
Leisure and Hospitality 12,600 0 6,700 -900 19,300 -900
Other Services 5,400 -400 3,600 -400 9,000 -800
Government 16,300 -900 9,200 200 25,500 -700
Financial Services 6,600 -400 3,100 -100 9,700 -500
Information 2,000 -100 700 -100 2,700 -200
Educational and Health Services 33,300 500 11,300 0 44,600 500
0
10
20
30
40
50
60
70
Jan
Jan
Jan
Jan
Jan
Sep2005 2006 2007 2008 2009
Sin
gle-
Fam
ily B
uild
ing
Perm
its
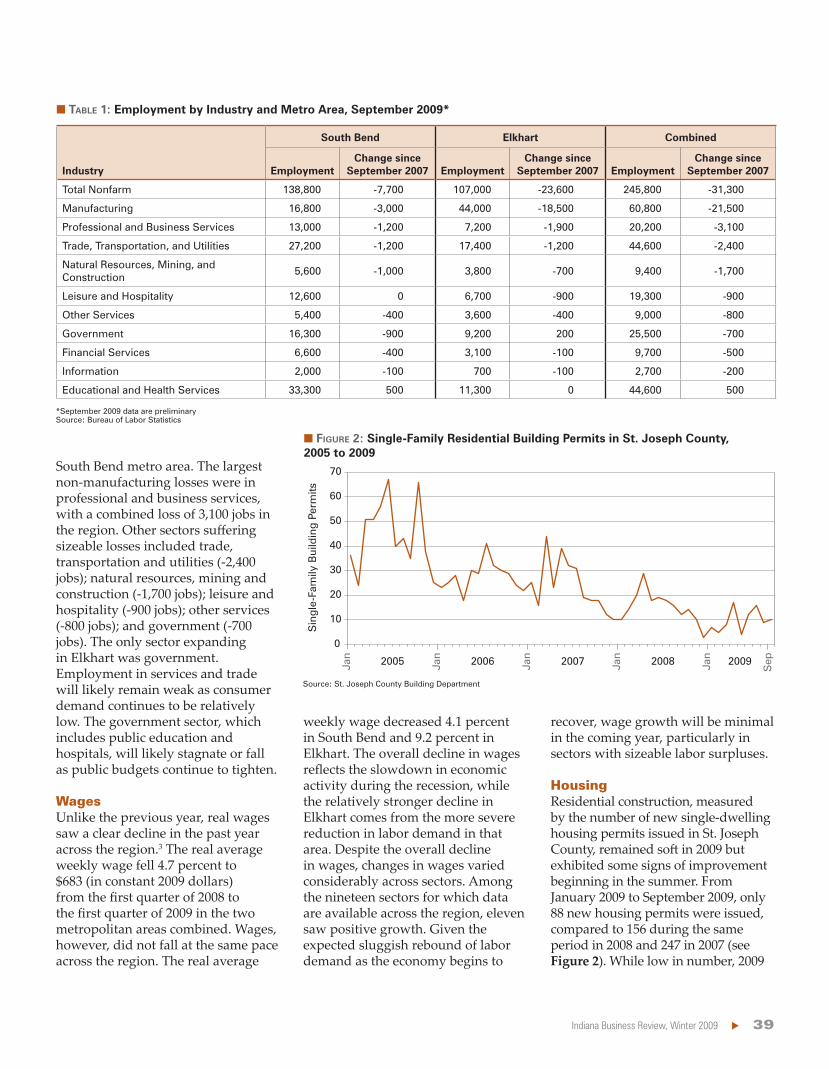
� TABLE 1: Employment by Industry and Metro Area, September 2009*
� FIGURE 2: Single-Family Residential Building Permits in St. Joseph County, 2005 to 2009
*September 2009 data are preliminarySource: Bureau of Labor Statistics
Source: St. Joseph County Building Department
40 Indiana University Kelley School of Business, Indiana Business Research Center
Terre Haute Forecast 2010Kevin Christ: Associate Professor of Economics, Rose-Hulman Institute of Technology
Robert Guell: Professor of Economics, Indiana State University
November 2009
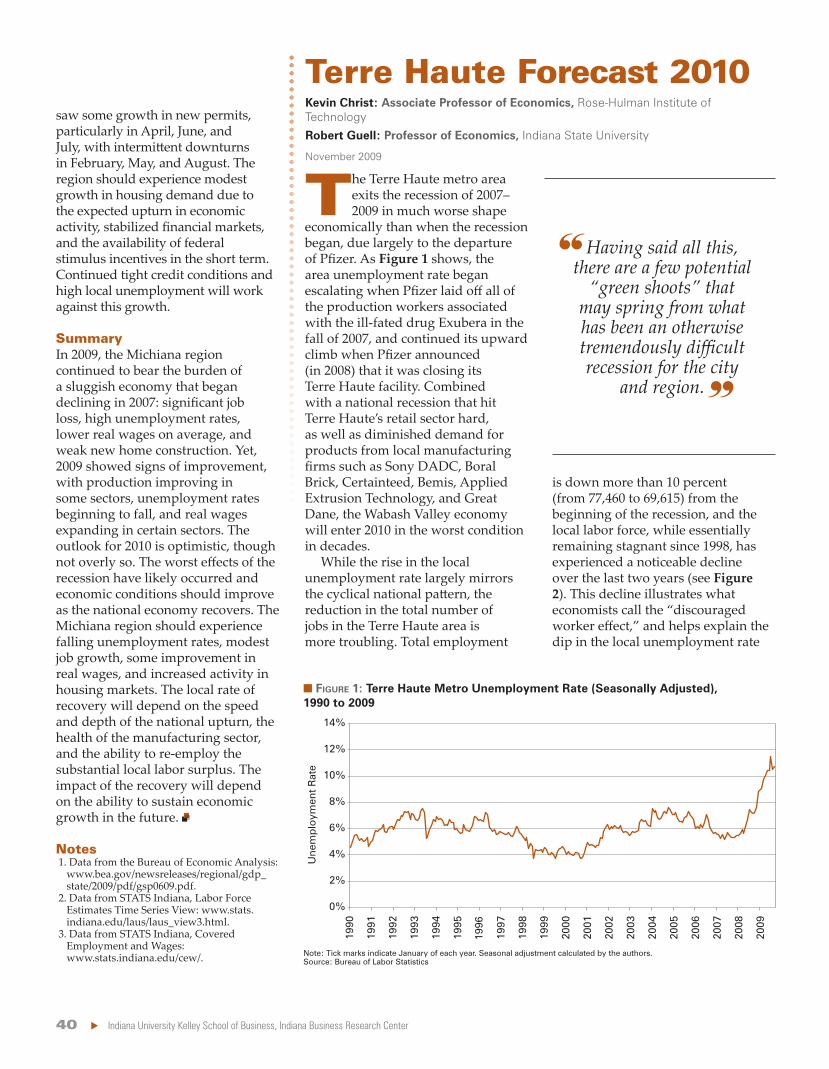
T
Summary
Notes
� FIGURE 1: Terre Haute Metro Unemployment Rate (Seasonally Adjusted), 1990 to 2009
Note: Tick marks indicate January of each year. Seasonal adjustment calculated by the authors.Source: Bureau of Labor Statistics
1990
1991
1992
1993
1994
1995
1996
1997
1998
1999
2000
2001
2002
2003
2004
2005
2006
2007
2008
2009
0%
2%
4%
6%
8%
10%
12%
14%
Une
mp
loym
ent R
ate
Indiana Business Review, Winter 2009 41
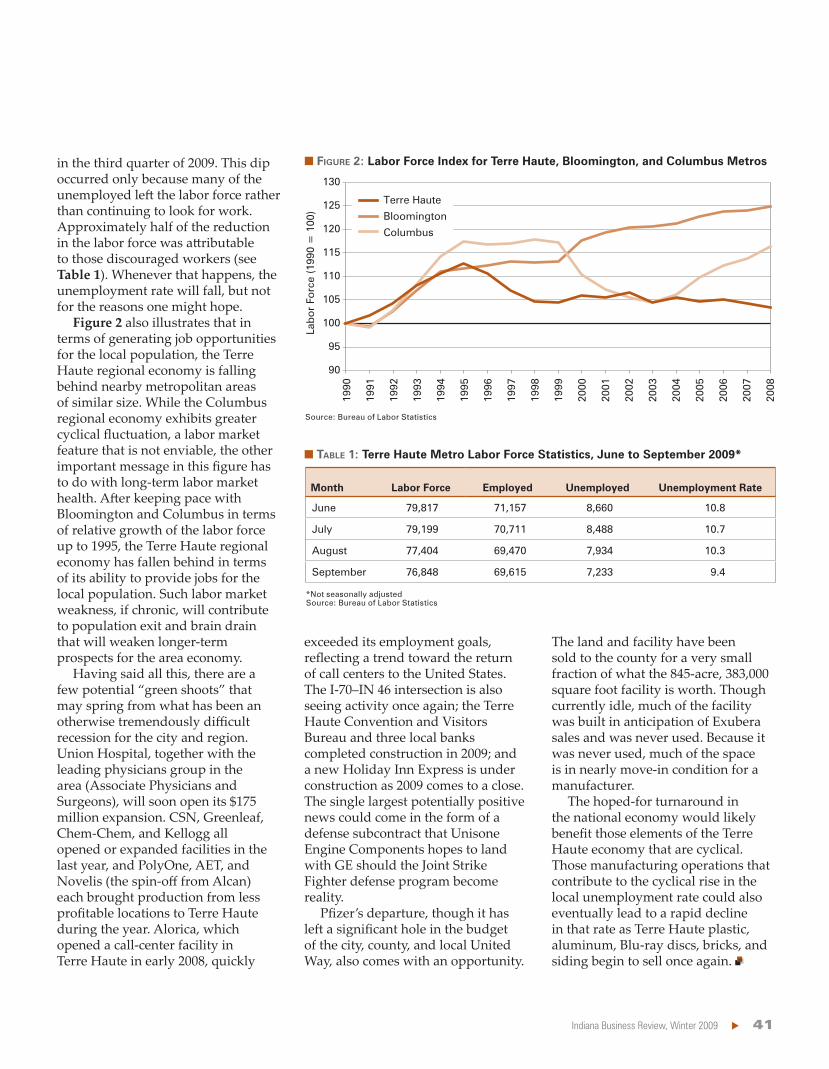
Month Labor Force Employed Unemployed Unemployment Rate
June 79,817 71,157 8,660 10.8
July 79,199 70,711 8,488 10.7
August 77,404 69,470 7,934 10.3
September 76,848 69,615 7,233 9.4
� FIGURE 2: Labor Force Index for Terre Haute, Bloomington, and Columbus Metros
� TABLE 1: Terre Haute Metro Labor Force Statistics, June to September 2009*
Source: Bureau of Labor Statistics
*Not seasonally adjustedSource: Bureau of Labor Statistics
Lab
or
Forc
e (1
990
= 1
00)
90
95
100
105
110
115
120
125
130
1990
1991
1992
1993
1994
1995
1996
1997
1998
1999
2000
2001
2002
2003
2004
2005
2006
2007
2008
Bloomington
Columbus
Terre Haute

Indiana Business Research CenterKelley School of Business, Indiana University100 S. College Ave., Suite 240Bloomington, IN 47404
ADDRESS SERVICE REQUESTED
Nonprofit OrganizationU.S. Postage
PAIDBloomington, Indiana
Permit No. 2
AN
DE
RS
ON
BLO
OM
ING
TON
CO
LUM
BU
S
ELK
HA
RT
EV
AN
SV
ILLE
FOR
T W
AY
NE
GA
RY
IND
IAN
AP
OLI
S
KO
KO
MO
LA
FAY
ET
TE
LOU
ISV
ILLE
MU
NC
IE
RIC
HM
ON
D
SO
UT
H B
EN
D
TE
RR
E H
AU
TE
Employment will continue to decrease about half a percent (-200 jobs) through the first quarter of 2010 and then stabilize through the remainder of 2010.
The region has faced some of the worst labor market conditions in the United States, but economic conditions should improve as the national economy recovers.
Total employment will rise somewhere between 800 to 2,200 jobs (0.3 percent to 0.8 percent), and the unemployment rate will remain above 9 percent.
The coming year should bring some modest improvement. Unemployment will peak by early 2010 and then begin to decline, but job creation will take several years.
Without more job opportunities or a decrease in the population, unemployment will continue to increase, placing downward pressure on wages and the local economy.
Employment in the service-providing sector will continue to grow, yet its rate of growth will be dependent on the goods-producing sector, which will likely continue to struggle.
The region will continue to experience elevated rates of unemployment (exceeding 8 percent) through 2010, with some individual counties faring better.
Employment should continue to decrease about 1 percent (-500 jobs) through the first quarter of 2010 and then stabilize through the remainder of 2010.
Loss of traditional manufacturing jobs and population decline were issues prior to the recession and will likely continue to be areas of concern.
As the national economy recovers, the South Bend-Mishawaka region should experience falling unemployment rates and modest job growth.
While a national recovery will cause improvements to the cyclical causes of unemployment, a declining labor force is cause for concern.
In the Evansville metro, employment is projected to decrease by 1,900 jobs during 2010.
Unemployment for Fort Wayne and surrounding counties is likely to range from 10 percent to 11.5 percent for most of 2010.
Employment losses are likely at the beginning of the year with gains to follow. Overall, 2010 will likely register a flat or slightly negative job picture.
Employment may not pick up noticeably until early in 2010 when job creation begins to outweigh slight decreases in the labor force.
10.2
14.9
9.2
8.1 8.2 9.9
10.9 10.3 9.7
6.5
7.4
8.1 12
10.3
8.6
Graphs show annual unemployment rates from October 1999 through October 2009. The shaded region shows rates from 3 percent to 6 percent.
Source: IBRC, using Bureau of Labor Statistics Local Area Unemployment Rates