agriculture - india brand equity foundation, ibef, business
TRANSCRIPT
AGRICULTURENovember 2010
2
Contents
Advantage India
Market overview
Industry Infrastructure
Investments
Policy and regulatory framework
Opportunities
Industry associations
AGRICULTURE November 2010
3
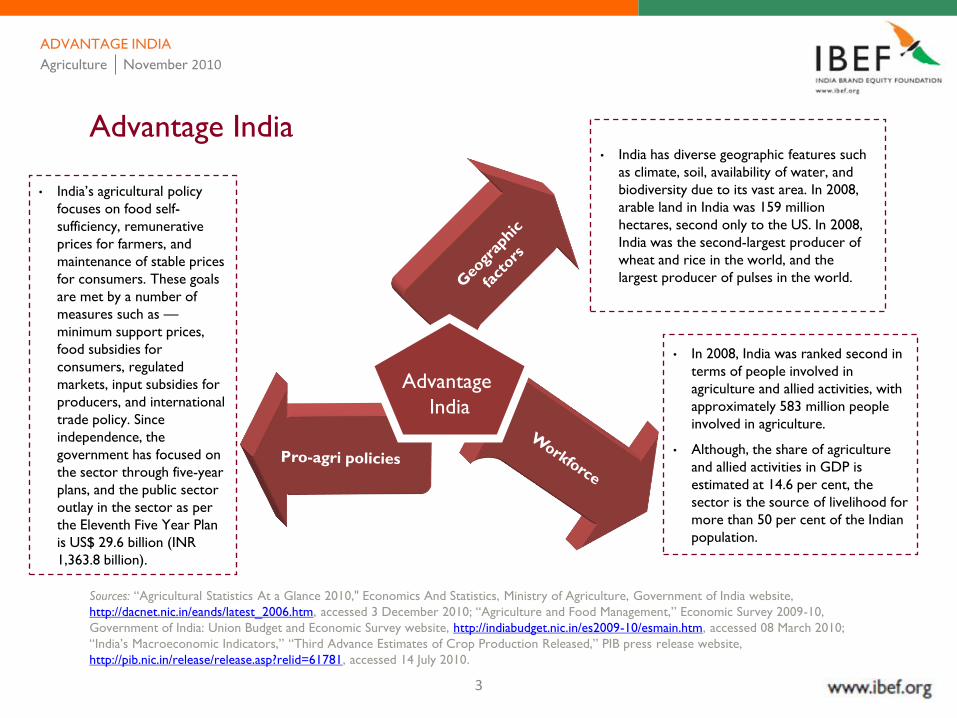
Advantage India
Sources: ―Agricultural Statistics At a Glance 2010," Economics And Statistics, Ministry of Agriculture, Government of India website,
http://dacnet.nic.in/eands/latest_2006.htm, accessed 3 December 2010; ―Agriculture and Food Management,‖ Economic Survey 2009-10,
Government of India: Union Budget and Economic Survey website, http://indiabudget.nic.in/es2009-10/esmain.htm, accessed 08 March 2010;
―India’s Macroeconomic Indicators,‖ ―Third Advance Estimates of Crop Production Released,‖ PIB press release website,
http://pib.nic.in/release/release.asp?relid=61781, accessed 14 July 2010.
• India’s agricultural policy
focuses on food self-
sufficiency, remunerative
prices for farmers, and
maintenance of stable prices
for consumers. These goals
are met by a number of
measures such as —
minimum support prices,
food subsidies for
consumers, regulated
markets, input subsidies for
producers, and international
trade policy. Since
independence, the
government has focused on
the sector through five-year
plans, and the public sector
outlay in the sector as per
the Eleventh Five Year Plan
is US$ 29.6 billion (INR
1,363.8 billion).
• In 2008, India was ranked second in
terms of people involved in
agriculture and allied activities, with
approximately 583 million people
involved in agriculture.
• Although, the share of agriculture
and allied activities in GDP is
estimated at 14.6 per cent, the
sector is the source of livelihood for
more than 50 per cent of the Indian
population.
• India has diverse geographic features such
as climate, soil, availability of water, and
biodiversity due to its vast area. In 2008,
arable land in India was 159 million
hectares, second only to the US. In 2008,
India was the second-largest producer of
wheat and rice in the world, and the
largest producer of pulses in the world.
Advantage
India
Agriculture November 2010
ADVANTAGE INDIA
4
Contents
Advantage India
Market overview
Industry Infrastructure
Investments
Policy and regulatory framework
Opportunities
Industry associations
AGRICULTURE November 2010
5
1950s 1960s and 70s
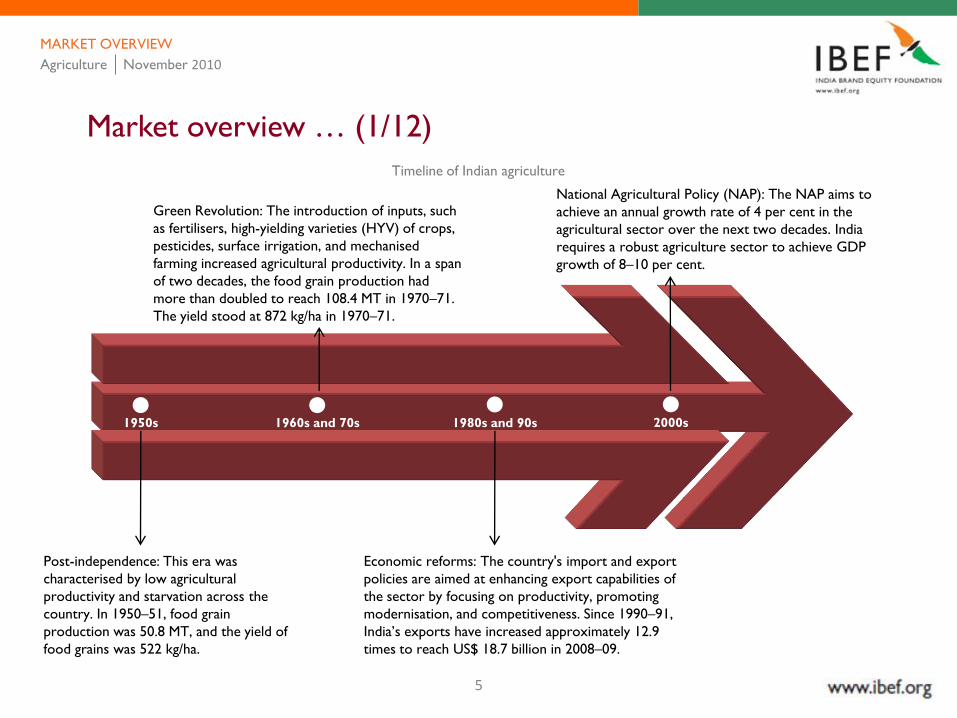
Post-independence: This era was
characterised by low agricultural
productivity and starvation across the
country. In 1950–51, food grain
production was 50.8 MT, and the yield of
food grains was 522 kg/ha.
Green Revolution: The introduction of inputs, such
as fertilisers, high-yielding varieties (HYV) of crops,
pesticides, surface irrigation, and mechanised
farming increased agricultural productivity. In a span
of two decades, the food grain production had
more than doubled to reach 108.4 MT in 1970–71.
The yield stood at 872 kg/ha in 1970–71.
Economic reforms: The country's import and export
policies are aimed at enhancing export capabilities of
the sector by focusing on productivity, promoting
modernisation, and competitiveness. Since 1990–91,
India’s exports have increased approximately 12.9
times to reach US$ 18.7 billion in 2008–09.
1980s and 90s 2000s
National Agricultural Policy (NAP): The NAP aims to
achieve an annual growth rate of 4 per cent in the
agricultural sector over the next two decades. India
requires a robust agriculture sector to achieve GDP
growth of 8–10 per cent.
MARKET OVERVIEW
Market overview … (1/12)
Timeline of Indian agriculture
Agriculture November 2010
6
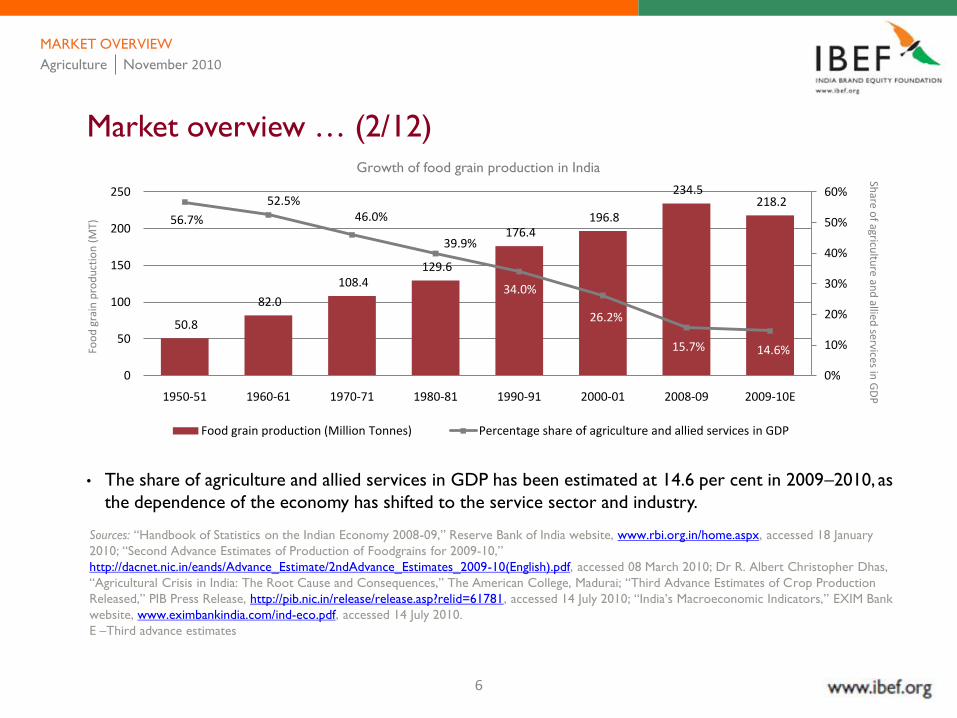
• The share of agriculture and allied services in GDP has been estimated at 14.6 per cent in 2009–2010, as
the dependence of the economy has shifted to the service sector and industry.
Market overview … (2/12)
MARKET OVERVIEW
Growth of food grain production in India
Sources: ―Handbook of Statistics on the Indian Economy 2008-09,‖ Reserve Bank of India website, www.rbi.org.in/home.aspx, accessed 18 January
2010; ―Second Advance Estimates of Production of Foodgrains for 2009-10,‖
http://dacnet.nic.in/eands/Advance_Estimate/2ndAdvance_Estimates_2009-10(English).pdf, accessed 08 March 2010; Dr R. Albert Christopher Dhas,
―Agricultural Crisis in India: The Root Cause and Consequences,‖ The American College, Madurai; ―Third Advance Estimates of Crop Production
Released,‖ PIB Press Release, http://pib.nic.in/release/release.asp?relid=61781, accessed 14 July 2010; ―India’s Macroeconomic Indicators,‖ EXIM Bank
website, www.eximbankindia.com/ind-eco.pdf, accessed 14 July 2010.
E –Third advance estimates
50.8
82.0
108.4 129.6
176.4 196.8
234.5 218.2
56.7%
52.5%46.0%
39.9%
34.0%
26.2%
15.7% 14.6%
0%
10%
20%
30%
40%
50%
60%
0
50
100
150
200
250
1950-51 1960-61 1970-71 1980-81 1990-91 2000-01 2008-09 2009-10E
Food grain production (Million Tonnes) Percentage share of agriculture and allied services in GDP
Foo
d g
rain
pro
du
ctio
n (
MT)
Share o
f agricultu
re and
allied services in
GD
P
Agriculture November 2010
7
• Over the 50-year period, i.e. , from 1950–51 to 2000–01, food grain production in India has increased at
a compound annual growth rate (CAGR) of approximately 2.7 per cent, to reach 196.8 million tonnes
(MT) in 2000–01. The increase in food grain production is largely attributed to the Green Revolution,
which took place in the 1960s and 1970s. Agri-inputs, such as fertilisers, high-yielding varieties (HYV) of
crops, pesticides, surface irrigation, and mechanised farming were primarily responsible for the increase
in agricultural productivity.
Market overview … (3/12)
Sources: ―Handbook of Statistics on the Indian Economy 2008-09,‖ Reserve Bank of India website, www.rbi.org.in/home.aspx, accessed 18
January 2010; ―Second Advance Estimates of Production of Foodgrains for 2009-10,‖
http://dacnet.nic.in/eands/Advance_Estimate/2ndAdvance_Estimates_2009-10(English).pdf, accessed 08 March 2010; Dr R. Albert Christopher
Dhas, ―Agricultural Crisis in India: The Root Cause and Consequences,‖ The American College, Madurai; ―Third Advance Estimates of Crop
Production Released,‖ PIB Press Release, http://pib.nic.in/release/release.asp?relid=61781, accessed 14 July 2010; ―India’s Macroeconomic
Indicators,‖ EXIM Bank website, www.eximbankindia.com/ind-eco.pdf, accessed 14 July 2010.
E –Third advance estimates
MARKET OVERVIEW
Agriculture November 2010

8
Sources: ―Agricultural Statistics At a Glance 2010," Economics And Statistics, Ministry of Agriculture, Government of India website,
http://dacnet.nic.in/eands/latest_2006.htm, accessed 17 November 2010; ―Second Advance Estimates of Production of Foodgrains for 2009-10,‖
http://dacnet.nic.in/eands/Advance_Estimate/2ndAdvance_Estimates_2009-10(English).pdf, accessed 08 March 2010.
*Fourth Advance Estimates as released on 19 July 2010
Kharif and Rabi seasons
India has two crop seasons, Kharif and Rabi, based on the dependence of crop productivity on the monsoons. The Kharif season is during the summer and monsoon months, lasting from April to September, and rice is the main crop grown during the season. The Rabi season is during the winter months of October to March, and wheat is the main crop of this sesason.
Market overview … (4/12)
India — Kharif and Rabi (production in million tonnes)
51.9% 52.7% 49.9% 54.9% 52.1% 52.7% 50.9% 52.4% 50.4% 46.0%
48.1% 47.3% 50.1% 45.1% 47.9% 47.3% 49.1% 47.6% 49.6% 54.0%
2000-01 2001-02 2002-03 2003-04 2004-05 2005-06 2006-07 2007-08 2008-09 2009-10*
Kharif Rabi
100%= 196.8 212.9 174.8 213.2 198.4 208.6 217.3 230.8 234.5 218.2
MARKET OVERVIEW
Agriculture November 2010
9
Sources: ―Agricultural Statistics At a Glance 2010," Economics And Statistics, Ministry of Agriculture, Government of India website,
http://dacnet.nic.in/eands/latest_2006.htm, accessed 17 November 2010; ―Second Advance Estimates of Production of Foodgrains for 2009-
10,‖ http://dacnet.nic.in/eands/Advance_Estimate/2ndAdvance_Estimates_2009-10(English).pdf, accessed 08 March 2010.
*Fourth Advance Estimates as released on 19 July 2010
• According to estimates by the Department of Agriculture and Cooperation, production of food grains
in 2009–2010 is estimated to be 218.2 million tonnes, with the Rabi crops accounting for 117.83
million tonnes and Kharif crops accounting for 100.37 million tonnes. According to first advance
estimates by the Department of Agriculture and Cooperation, production of food grains in 2010–11 is
estimated to be 114.63 million tonnes.
Market overview … (5/12)
MARKET OVERVIEW
Agriculture November 2010
1010
Sources: ―Agricultural Statistics At a Glance 2010," Economics And Statistics, Ministry of Agriculture, Government of India website,
http://dacnet.nic.in/eands/latest_2006.htm, accessed 17 November 2010; ―Second Advance Estimates of Production of Foodgrains for 2009-10,‖
http://dacnet.nic.in/eands/Advance_Estimate/2ndAdvance_Estimates_2009-10(English).pdf, accessed 08 March 2010; ―Handbook of Statistics on
the Indian Economy 2008-09,‖ Reserve Bank of India website, www.rbi.org.in, accessed 18 January 2010.
*Fourth Advance Estimates as released on 19 July 2010; Note: For cotton production is in million bales of 170 kg each
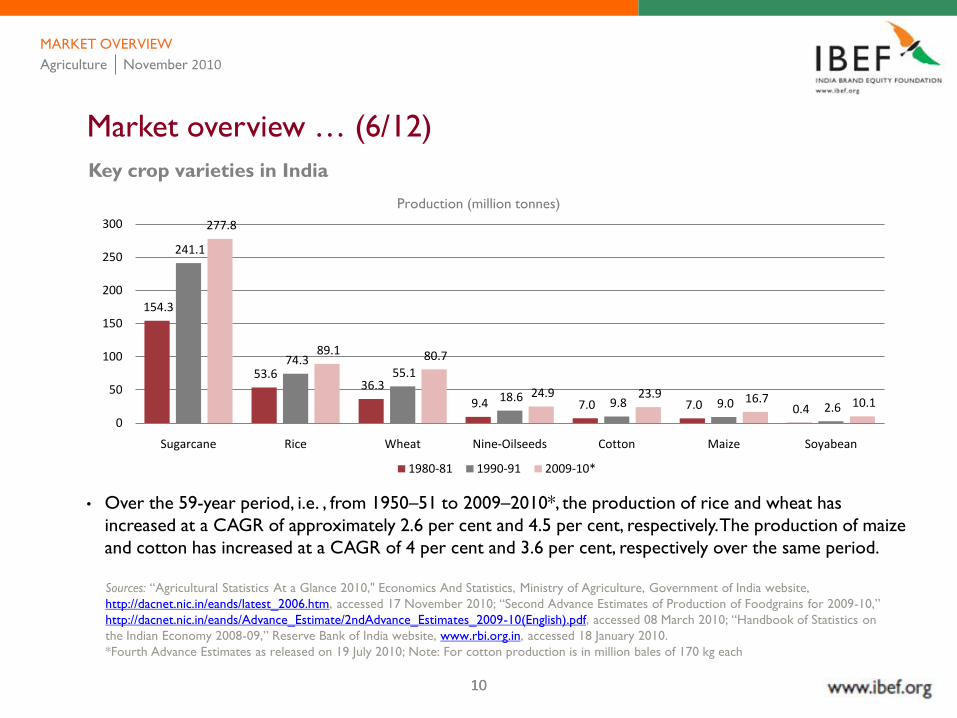
• Over the 59-year period, i.e. , from 1950–51 to 2009–2010*, the production of rice and wheat has
increased at a CAGR of approximately 2.6 per cent and 4.5 per cent, respectively. The production of maize
and cotton has increased at a CAGR of 4 per cent and 3.6 per cent, respectively over the same period.
Market overview … (6/12)
Key crop varieties in India
Production (million tonnes)
154.3
53.6 36.3
9.4 7.0 7.0 0.4
241.1
74.3 55.1
18.6 9.8 9.0 2.6
277.8
89.1 80.7
24.9 23.9 16.7 10.1
0
50
100
150
200
250
300
Sugarcane Rice Wheat Nine-Oilseeds Cotton Maize Soyabean
1980-81 1990-91 2009-10*
MARKET OVERVIEW
Agriculture November 2010
1111
Sources: ―Agricultural Statistics At a Glance 2010," Economics And Statistics, Ministry of Agriculture, Government of India website,
http://dacnet.nic.in/eands/latest_2006.htm, accessed 17 November 2010; ―Second Advance Estimates of Production of Foodgrains for 2009-10,‖
http://dacnet.nic.in/eands/Advance_Estimate/2ndAdvance_Estimates_2009-10(English).pdf, accessed 08 March 2010; ―Handbook of Statistics on
the Indian Economy 2008-09,‖ Reserve Bank of India website, www.rbi.org.in, accessed 18 January 2010.
*Fourth Advance Estimates as released on 19 July 2010; ** First Advance Estimates as released on 23.09.2010.
Note: For cotton production is in million bales of 170 kg each
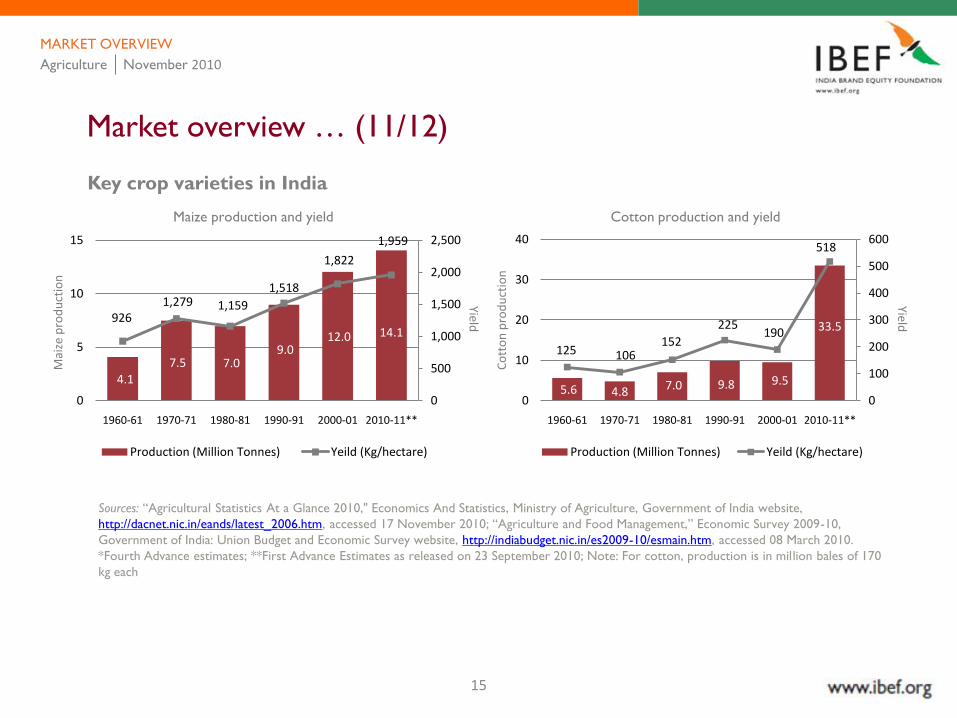
• The yield of crops has witnessed an increase since the Green Revolution. Between 1950–51 and 2009–
2010*, the yield of rice and wheat has increased by 3.3 and 4.4 times, to reach 2,130 kg/ha and 2,830
kg/ha, respectively. The yield of sugarcane has doubled since 1950–51 to reach around 66,922 kg/ha in
2010–11**.
Market overview … (7/12)
Key crop varieties in India
MARKET OVERVIEW
Agriculture November 2010
12
Sources: ―Agricultural Statistics At a Glance 2010," Economics And Statistics, Ministry of Agriculture, Government of India website,
http://dacnet.nic.in/eands/latest_2006.htm, accessed 17 November 2010; ―Agriculture and Food Management,‖ Economic Survey 2009-10,
Government of India: Union Budget and Economic Survey website, http://indiabudget.nic.in/es2009-10/esmain.htm, accessed 08 March 2010.
*Fourth Advance estimates;
**First Advance Estimates as released on 23 September 2010
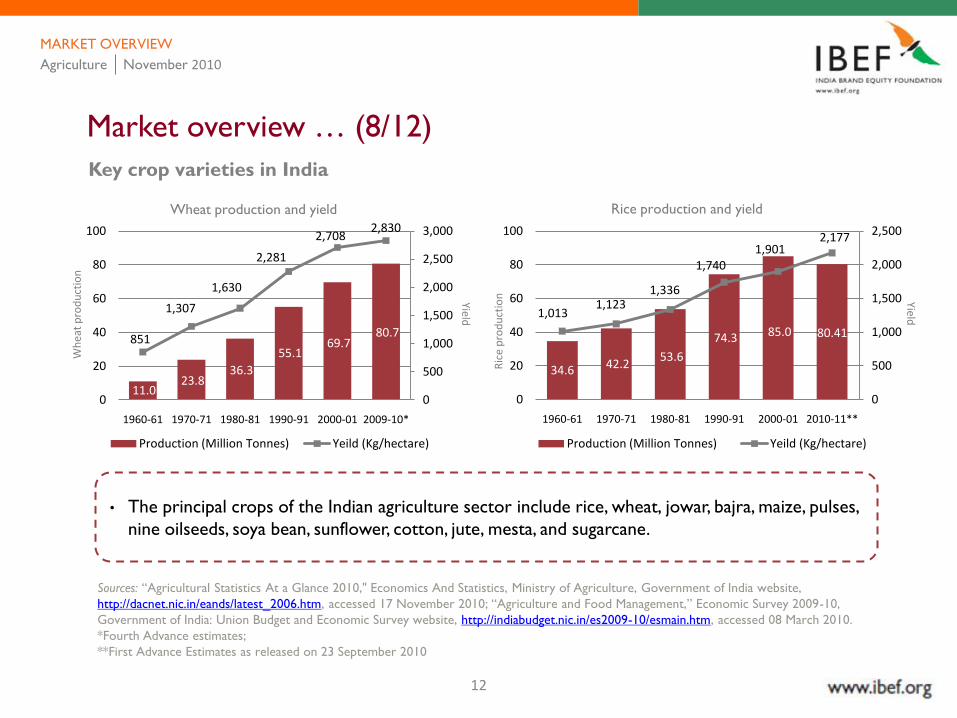
• The principal crops of the Indian agriculture sector include rice, wheat, jowar, bajra, maize, pulses,
nine oilseeds, soya bean, sunflower, cotton, jute, mesta, and sugarcane.
Market overview … (8/12)
Key crop varieties in India
Wheat production and yield Rice production and yield
11.0 23.8
36.3
55.1 69.7
80.7 851
1,307
1,630
2,281
2,7082,830
0
500
1,000
1,500
2,000
2,500
3,000
0
20
40
60
80
100
1960-61 1970-71 1980-81 1990-91 2000-01 2009-10*
Production (Million Tonnes) Yeild (Kg/hectare)
34.6 42.2 53.6
74.3 85.0 80.41
1,0131,123
1,336
1,7401,901
2,177
0
500
1,000
1,500
2,000
2,500
0
20
40
60
80
100
1960-61 1970-71 1980-81 1990-91 2000-01 2010-11**
Production (Million Tonnes) Yeild (Kg/hectare)
MARKET OVERVIEW
Wh
eat
pro
du
ctio
n
YieldR
ice
pro
du
ctio
n Yield
Agriculture November 2010
13
Sources: ―Agricultural Statistics At a Glance 2010," Economics And Statistics, Ministry of Agriculture, Government of India website,
http://dacnet.nic.in/eands/latest_2006.htm, accessed 17 November 2010; ―Agriculture and Food Management,‖ Economic Survey 2009-10,
Government of India: Union Budget and Economic Survey website, http://indiabudget.nic.in/es2009-10/esmain.htm, accessed 08 March 2010.
*Fourth Advance estimates
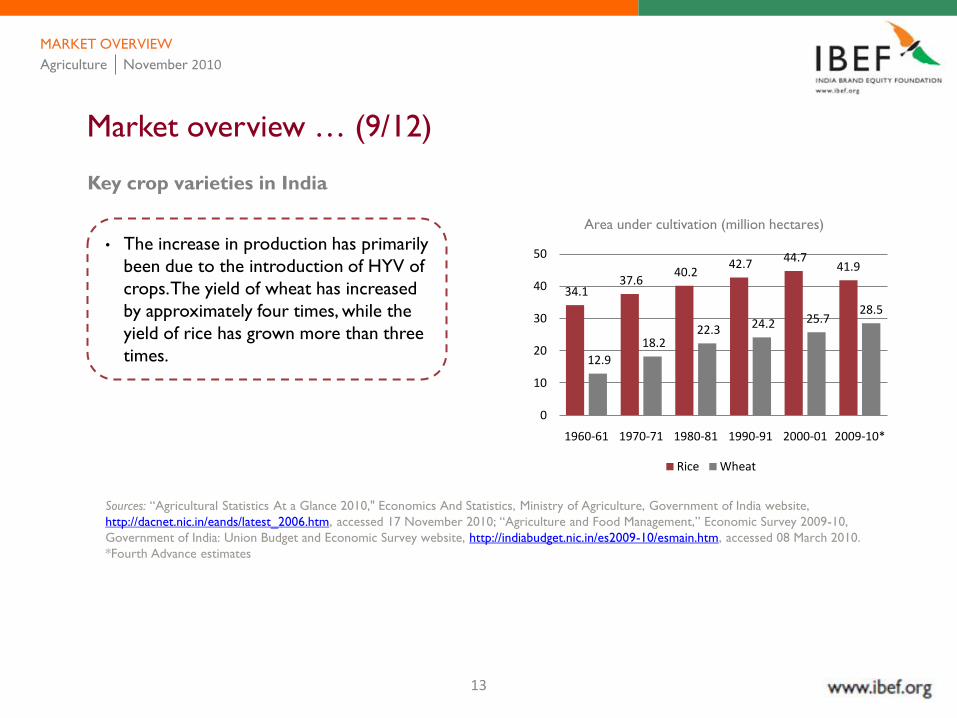
• The increase in production has primarily
been due to the introduction of HYV of
crops. The yield of wheat has increased
by approximately four times, while the
yield of rice has grown more than three
times.
Market overview … (9/12)
Area under cultivation (million hectares)
Key crop varieties in India
34.1 37.6
40.2 42.7 44.7
41.9
12.9
18.2 22.3 24.2 25.7
28.5
0
10
20
30
40
50
1960-61 1970-71 1980-81 1990-91 2000-01 2009-10*
Rice Wheat
MARKET OVERVIEW
Agriculture November 2010

14
Sources: ―Agricultural Statistics At a Glance 2010," Economics And Statistics, Ministry of Agriculture, Government of India website,
http://dacnet.nic.in/eands/latest_2006.htm, accessed 17 November 2010; ―Agriculture and Food Management,‖ Economic Survey 2009-10,
Government of India: Union Budget and Economic Survey website, http://indiabudget.nic.in/es2009-10/esmain.htm, accessed 08 March 2010.
*Fourth Advance estimates;
**First Advance Estimates as released on 23 September 2010
Market overview … (10/12)
Key crop varieties in India
Nine oilseeds production and yieldSugarcane production and yield
110.0 126.4154.3
241.1296.0 324.9
45,549
48,322
57,844 65,395
68,577 66,922
0
20,000
40,000
60,000
80,000
0
100
200
300
400
1960-61 1970-71 1980-81 1990-91 2000-01 2010-11**
Production (Million Tonnes) Yeild (Kg/hectare)
7.0 9.6 9.4
18.6 18.4 24.9
507 579
532
771 810
955
0
200
400
600
800
1,000
1,200
0
5
10
15
20
25
30
1960-61 1970-71 1980-81 1990-91 2000-01 2009-10*
Production (Million Tonnes) Yeild (Kg/hectare)
MARKET OVERVIEWSu
garc
ane
pro
du
ctio
n
Yield
Nin
e-O
ilsee
ds
YieldAgriculture November 2010
15
Sources: ―Agricultural Statistics At a Glance 2010," Economics And Statistics, Ministry of Agriculture, Government of India website,
http://dacnet.nic.in/eands/latest_2006.htm, accessed 17 November 2010; ―Agriculture and Food Management,‖ Economic Survey 2009-10,
Government of India: Union Budget and Economic Survey website, http://indiabudget.nic.in/es2009-10/esmain.htm, accessed 08 March 2010.
*Fourth Advance estimates; **First Advance Estimates as released on 23 September 2010; Note: For cotton, production is in million bales of 170
kg each
Market overview … (11/12)
Key crop varieties in India
Maize production and yield Cotton production and yield
4.1 7.5 7.0
9.0 12.0 14.1
926 1,279 1,159
1,518
1,822
1,959
0
500
1,000
1,500
2,000
2,500
0
5
10
15
1960-61 1970-71 1980-81 1990-91 2000-01 2010-11**
Production (Million Tonnes) Yeild (Kg/hectare)
5.6 4.8 7.0 9.8 9.5
33.5
125 106 152
225 190
518
0
100
200
300
400
500
600
0
10
20
30
40
1960-61 1970-71 1980-81 1990-91 2000-01 2010-11**
Production (Million Tonnes) Yeild (Kg/hectare)
MARKET OVERVIEWM
aize
pro
du
ctio
n
Yield
Co
tto
n p
rod
uct
ion
YieldAgriculture November 2010
16
Source: ―Handbook of Statistics on the Indian Economy 2008-09,‖ Reserve Bank of India website, www.rbi.org.in/home.aspx, accessed 18 January
2010; ―Agricultural Statistics At a Glance 2010," Economics And Statistics, Ministry of Agriculture, Government of India website,
http://dacnet.nic.in/eands/latest_2006.htm, accessed 3 December 2010.
Note: Total production does not include Union Territories
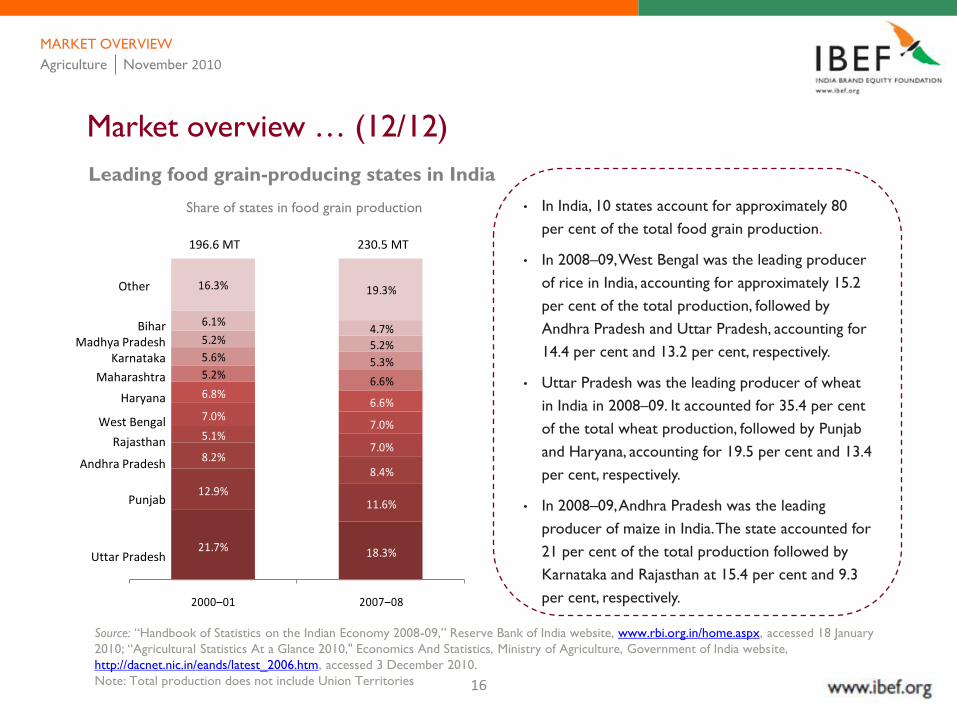
• In India, 10 states account for approximately 80
per cent of the total food grain production.
• In 2008–09, West Bengal was the leading producer
of rice in India, accounting for approximately 15.2
per cent of the total production, followed by
Andhra Pradesh and Uttar Pradesh, accounting for
14.4 per cent and 13.2 per cent, respectively.
• Uttar Pradesh was the leading producer of wheat
in India in 2008–09. It accounted for 35.4 per cent
of the total wheat production, followed by Punjab
and Haryana, accounting for 19.5 per cent and 13.4
per cent, respectively.
• In 2008–09, Andhra Pradesh was the leading
producer of maize in India. The state accounted for
21 per cent of the total production followed by
Karnataka and Rajasthan at 15.4 per cent and 9.3
per cent, respectively.
Market overview … (12/12)
Leading food grain-producing states in India
MARKET OVERVIEW
21.7% 18.3%
12.9%11.6%
8.2%8.4%
5.1%7.0%
7.0%7.0%
6.8%6.6%
5.2%6.6%
5.6% 5.3%
5.2% 5.2%
6.1%4.7%
16.3% 19.3%
2000–01 2007–08
196.6 MT 230.5 MT
Uttar Pradesh
Punjab
Andhra Pradesh
Rajasthan
West Bengal
Haryana
Maharashtra
KarnatakaMadhya Pradesh
Bihar
Other
Share of states in food grain production
Agriculture November 2010
17
Source: ―Agricultural Statistics At a Glance 2010," Economics
And Statistics, Ministry of Agriculture, Government of India
website, http://dacnet.nic.in/eands/latest_2006.htm, accessed
17 November 2010.
P – Provisional
EXIM scenario … (1/4)
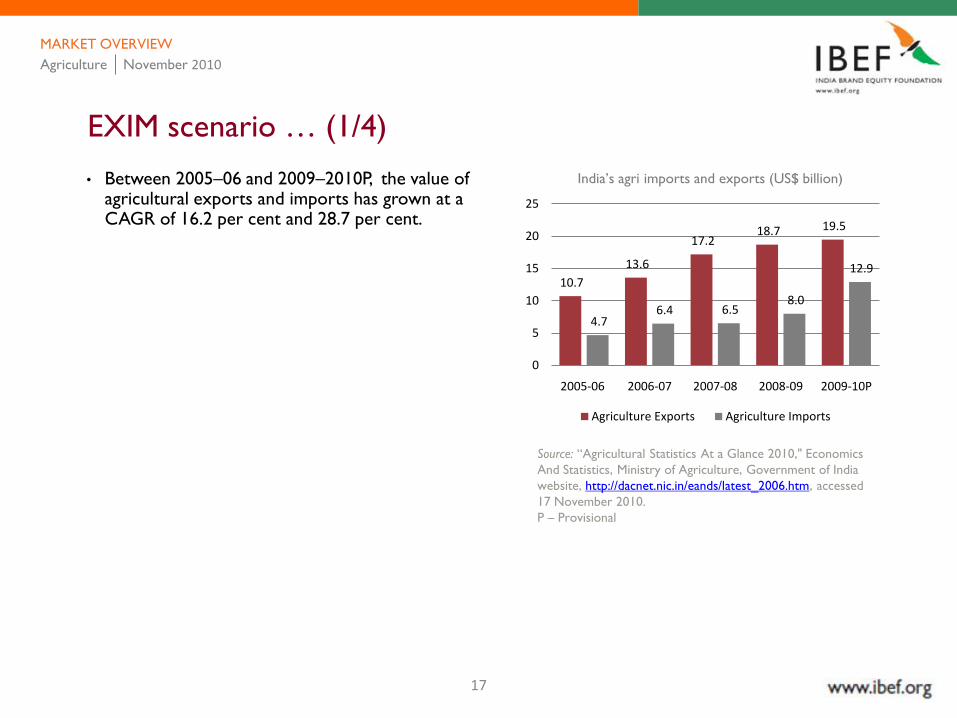
• Between 2005–06 and 2009–2010P, the value of agricultural exports and imports has grown at a CAGR of 16.2 per cent and 28.7 per cent.
India’s agri imports and exports (US$ billion)
10.7
13.6
17.2 18.7 19.5
4.7 6.4 6.5
8.0
12.9
0
5
10
15
20
25
2005-06 2006-07 2007-08 2008-09 2009-10P
Agriculture Exports Agriculture Imports
MARKET OVERVIEW
Agriculture November 2010
18
Source: ―Agricultural Statistics At a Glance 2010," Economics And
Statistics, Ministry of Agriculture, Government of India website,
http://dacnet.nic.in/eands/latest_2006.htm, accessed 17
November 2010.
P – Provisional
EXIM scenario … (2/4)
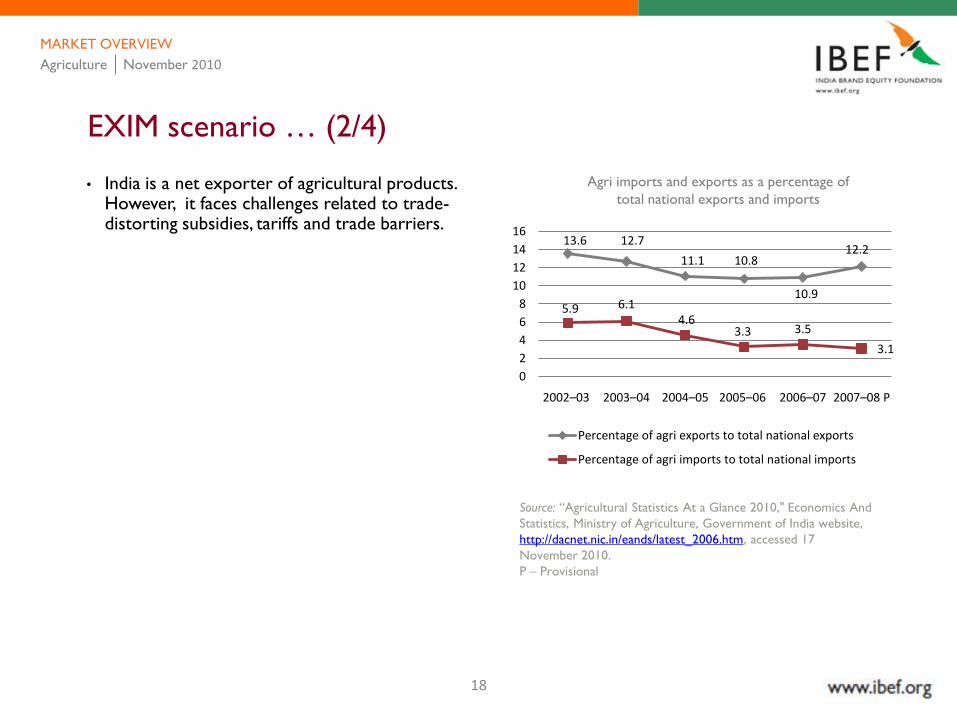
• India is a net exporter of agricultural products. However, it faces challenges related to trade-distorting subsidies, tariffs and trade barriers.
Agri imports and exports as a percentage of
total national exports and imports
MARKET OVERVIEW
Agriculture November 2010
13.6 12.7
11.1 10.8
10.9
12.2
5.9 6.1 4.6
3.3 3.5
3.1
0
2
4
6
8
10
12
14
16
2002–03 2003–04 2004–05 2005–06 2006–07 2007–08 P
Percentage of agri exports to total national exports
Percentage of agri imports to total national imports

19
Source: ―Agricultural Statistics At a Glance 2010," Economics And
Statistics, Ministry of Agriculture, Government of India website,
http://dacnet.nic.in/eands/latest_2006.htm, accessed 17 November
2010.
*Provisional
EXIM scenario … (3/4)
• In 2008–09, India’s export of cereals amounted to US$ 3.29 million, with Saudi Arabia, the UAE and Malaysia being the leading export destinations. Rice (basmati and non-basmati) and other cereals were the leading cereals exported from the country.
100%= US$ 19.5 billion
Key agri products exported by India, 2009–2010*
(US$ billion)
8.8%
12.1%
11.0%
6.9%
6.3%7.0%
0.1%
47.8%
Oil Meals
Rice Basmati
Marine Products
Spices
Paper/Wood products
Meat & Preparations
Sugar
Other
MARKET OVERVIEW
Agriculture November 2010

20
Source: ―Agricultural Statistics At a Glance 2010," Economics And
Statistics, Ministry of Agriculture, Government of India website,
http://dacnet.nic.in/eands/latest_2006.htm, accessed 17 November
2010.
*Provisional
EXIM scenario … (4/4)
• Vegetable oil is a leading agricultural product imported by India from developing countries such as Malaysia and Indonesia. 100%= US$ 12.9 billion
Key agri products imported by India, 2009–2010*
(US$ billion)
44.6%
12.6%
16.3%
0.4%
26.1%
Vegetable Oils Fixed (Edible)
Wood & Wood Products
Pulses
Wheat
Other
MARKET OVERVIEW
Agriculture November 2010
21
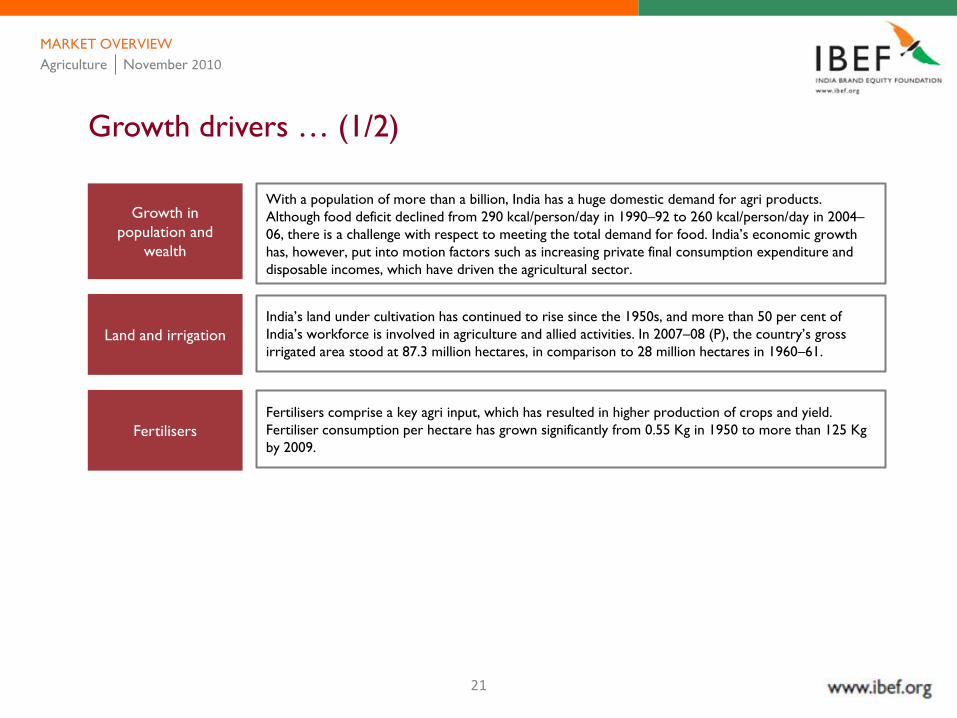
Growth drivers … (1/2)
Growth in
population and
wealth
Land and irrigation
Fertilisers
With a population of more than a billion, India has a huge domestic demand for agri products.
Although food deficit declined from 290 kcal/person/day in 1990–92 to 260 kcal/person/day in 2004–
06, there is a challenge with respect to meeting the total demand for food. India’s economic growth
has, however, put into motion factors such as increasing private final consumption expenditure and
disposable incomes, which have driven the agricultural sector.
India’s land under cultivation has continued to rise since the 1950s, and more than 50 per cent of
India’s workforce is involved in agriculture and allied activities. In 2007–08 (P), the country’s gross
irrigated area stood at 87.3 million hectares, in comparison to 28 million hectares in 1960–61.
Fertilisers comprise a key agri input, which has resulted in higher production of crops and yield.
Fertiliser consumption per hectare has grown significantly from 0.55 Kg in 1950 to more than 125 Kg
by 2009.
MARKET OVERVIEW
Agriculture November 2010
22
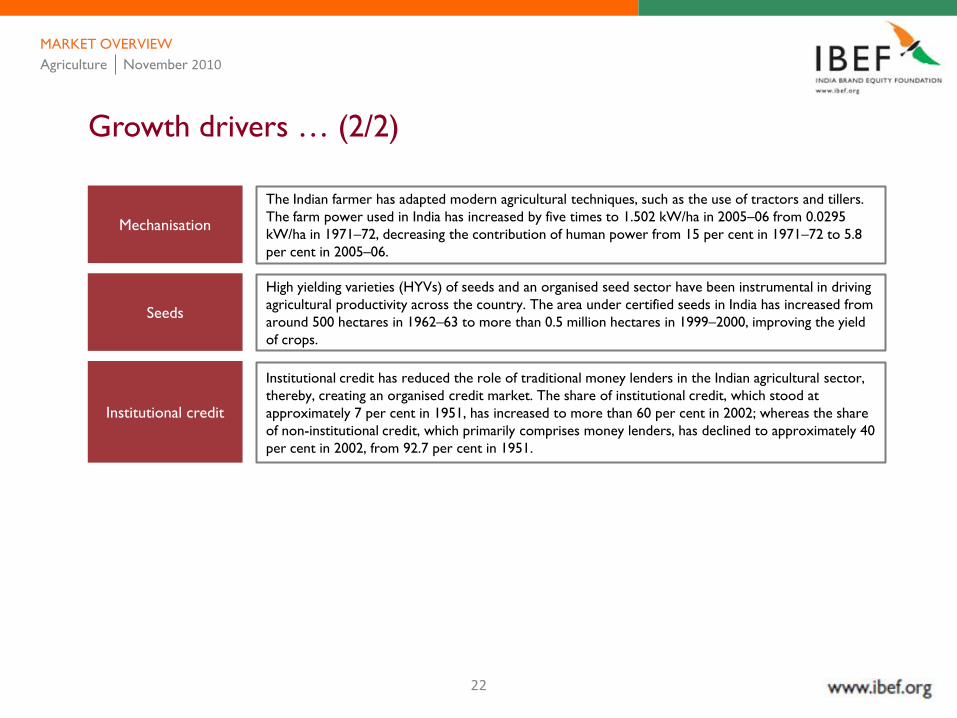
Growth drivers … (2/2)
Mechanisation
Institutional credit
Seeds
The Indian farmer has adapted modern agricultural techniques, such as the use of tractors and tillers.
The farm power used in India has increased by five times to 1.502 kW/ha in 2005–06 from 0.0295
kW/ha in 1971–72, decreasing the contribution of human power from 15 per cent in 1971–72 to 5.8
per cent in 2005–06.
High yielding varieties (HYVs) of seeds and an organised seed sector have been instrumental in driving
agricultural productivity across the country. The area under certified seeds in India has increased from
around 500 hectares in 1962–63 to more than 0.5 million hectares in 1999–2000, improving the yield
of crops.
Institutional credit has reduced the role of traditional money lenders in the Indian agricultural sector,
thereby, creating an organised credit market. The share of institutional credit, which stood at
approximately 7 per cent in 1951, has increased to more than 60 per cent in 2002; whereas the share
of non-institutional credit, which primarily comprises money lenders, has declined to approximately 40
per cent in 2002, from 92.7 per cent in 1951.
MARKET OVERVIEW
Agriculture November 2010
23
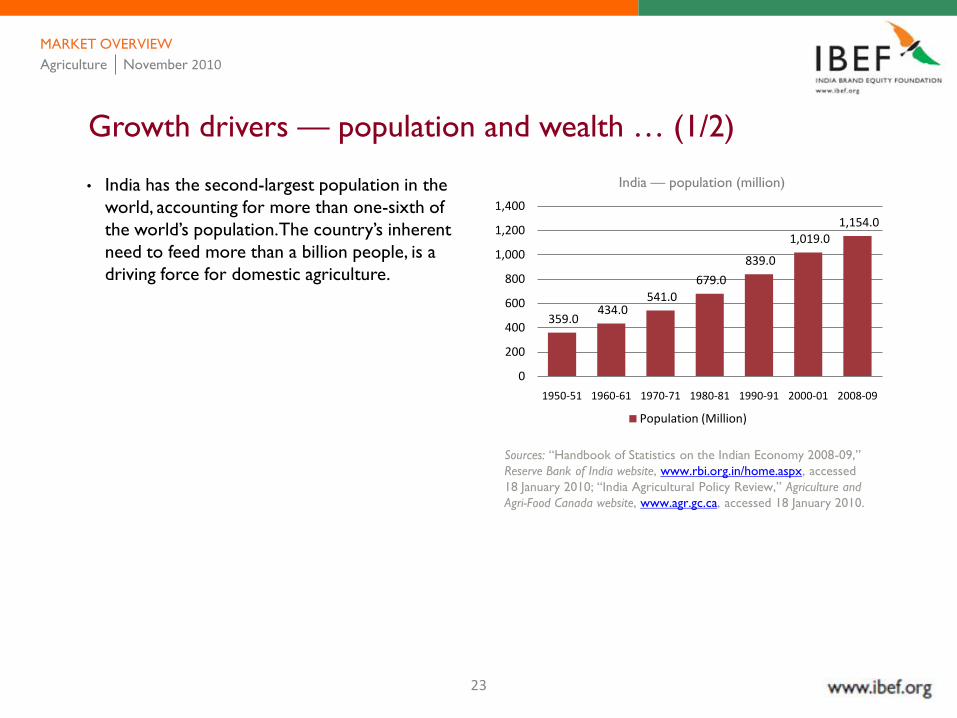
• India has the second-largest population in the
world, accounting for more than one-sixth of
the world’s population. The country’s inherent
need to feed more than a billion people, is a
driving force for domestic agriculture.
Growth drivers — population and wealth … (1/2)
Sources: ―Handbook of Statistics on the Indian Economy 2008-09,‖
Reserve Bank of India website, www.rbi.org.in/home.aspx, accessed
18 January 2010; ―India Agricultural Policy Review,‖ Agriculture and
Agri-Food Canada website, www.agr.gc.ca, accessed 18 January 2010.
India — population (million)
359.0 434.0
541.0
679.0
839.0
1,019.0 1,154.0
0
200
400
600
800
1,000
1,200
1,400
1950-51 1960-61 1970-71 1980-81 1990-91 2000-01 2008-09
Population (Million)
MARKET OVERVIEW
Agriculture November 2010
24
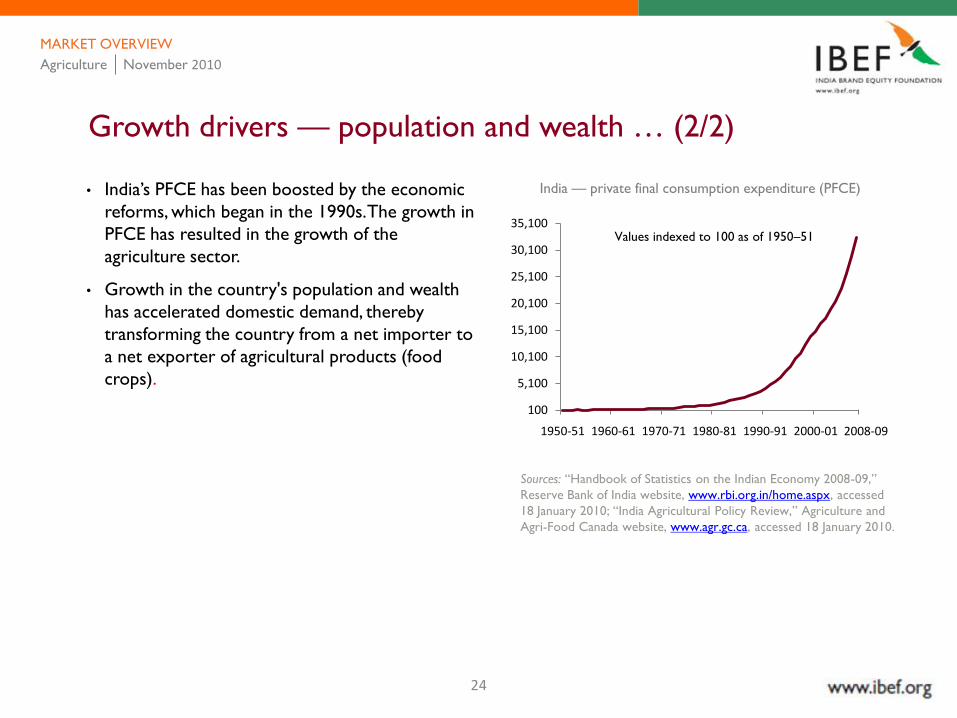
• India’s PFCE has been boosted by the economic
reforms, which began in the 1990s. The growth in
PFCE has resulted in the growth of the
agriculture sector.
• Growth in the country's population and wealth
has accelerated domestic demand, thereby
transforming the country from a net importer to
a net exporter of agricultural products (food
crops).
Growth drivers — population and wealth … (2/2)
Sources: ―Handbook of Statistics on the Indian Economy 2008-09,‖
Reserve Bank of India website, www.rbi.org.in/home.aspx, accessed
18 January 2010; ―India Agricultural Policy Review,‖ Agriculture and
Agri-Food Canada website, www.agr.gc.ca, accessed 18 January 2010.
India — private final consumption expenditure (PFCE)
100
5,100
10,100
15,100
20,100
25,100
30,100
35,100
1950-51 1960-61 1970-71 1980-81 1990-91 2000-01
Values indexed to 100 as of 1950–51
2008-09
MARKET OVERVIEW
Agriculture November 2010
25
Sources: ―Agricultural Statistics At a Glance 2010," Economics
And Statistics, Ministry of Agriculture, Government of India
website, http://dacnet.nic.in/eands/latest_2006.htm, accessed 17
November 2010
P – Provisional
Growth drivers — agricultural land in India
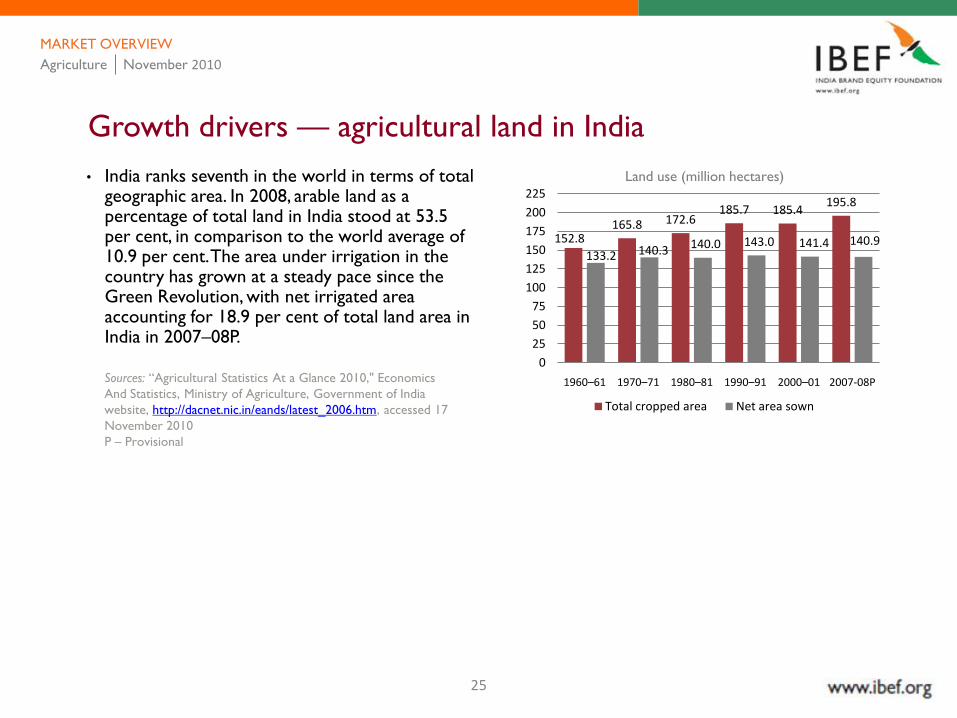
• India ranks seventh in the world in terms of total geographic area. In 2008, arable land as a percentage of total land in India stood at 53.5 per cent, in comparison to the world average of 10.9 per cent. The area under irrigation in the country has grown at a steady pace since the Green Revolution, with net irrigated area accounting for 18.9 per cent of total land area in India in 2007–08P.
Land use (million hectares)
MARKET OVERVIEW
152.8165.8 172.6
185.7 185.4195.8
133.2 140.3 140.0 143.0 141.4 140.9
0
25
50
75
100
125
150
175
200
225
1960–61 1970–71 1980–81 1990–91 2000–01 2007-08P
Total cropped area Net area sown
Agriculture November 2010
26
Sources: "Agricultural Statistics At a Glance 2008,‖ Economics And Statistics, Ministry of Agriculture, Government of India website,
http://dacnet.nic.in/eands/At_Glance_2008.htm, accessed 18 January 2010; "Agricultural Statistics At a Glance 2009," Economics And Statistics,
Ministry of Agriculture, Government of India website, http://dacnet.nic.in/eands/pdf%20files/tb14.5U.pdf, accessed 14 July 2010; P Kataria and
AS Joshi, ―Energy Use in Indian Agriculture,‖ Department of Economics, Punjab Agricultural University, Ludhiana, India; ―Agriculture and Food
Management,‖ Economic Survey 2009-10, Government of India: Union Budget and Economic Survey website, http://indiabudget.nic.in/es2009-
10/esmain.htm, accessed 08 March 2010.
P – Provisional
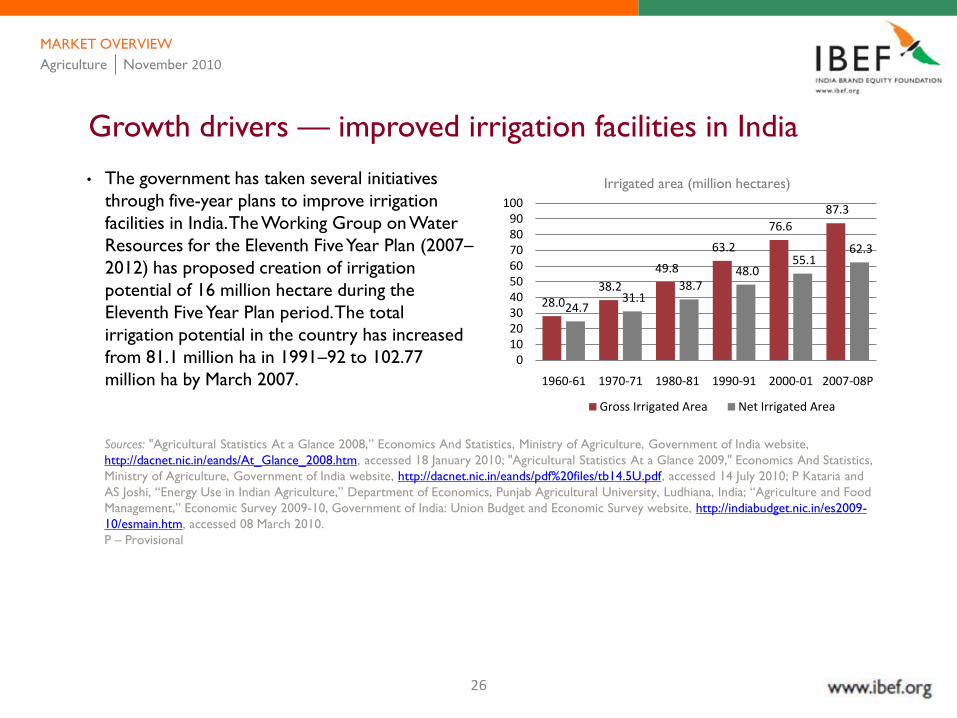
Growth drivers — improved irrigation facilities in India
Irrigated area (million hectares)
28.0 38.2
49.8
63.2
76.6
87.3
24.7 31.1
38.7 48.0
55.1 62.3
0102030405060708090
100
1960-61 1970-71 1980-81 1990-91 2000-01 2007-08P
Gross Irrigated Area Net Irrigated Area
• The government has taken several initiatives
through five-year plans to improve irrigation
facilities in India. The Working Group on Water
Resources for the Eleventh Five Year Plan (2007–
2012) has proposed creation of irrigation
potential of 16 million hectare during the
Eleventh Five Year Plan period. The total
irrigation potential in the country has increased
from 81.1 million ha in 1991–92 to 102.77
million ha by March 2007.
MARKET OVERVIEW
Agriculture November 2010

27
• In 1950, per hectare use of fertilisers in India was 0.55 Kg. However, backed by government policies and
initiatives, the consumption increased to more than 125 Kg per hectare by 2009.
• The government has taken various policy initiatives for the fertiliser sector, such as pricing policy for
indigenous urea, new investments in the urea sector, nutrient-based pricing, production and availability
of fortified and coated fertilisers, uniform freight subsidy on all fertilisers under the fertiliser subsidy
regime, concession scheme for decontrolled phosphatic and potassic fertilisers, etc.
Source: ―Agriculture and Food Management,‖ Economic Survey 2009-10, Government of India: Union Budget and Economic Survey website,
http://indiabudget.nic.in/es2009-10/esmain.htm, accessed 08 March 2010.
Growth drivers — increasing role of fertilisers
Fertilisers — production and consumption Fertiliser consumption per hectare
0.2 1.1 3.0
9.0
14.8 14.3
0.3 2.2
5.5
12.5
19.7
24.9
0
5
10
15
20
25
30
1960-61 1970-71 1980-81 1990-91 2000-01 2008-09
Production (Million Tonnes) Consumption (Million Tonnes)
88.9
105.5 111.8 116.8
128.6
0
20
40
60
80
100
120
140
2000-01 2005-06 2006-07 2007-08 2008-09
Consumption (Kg/ha)
MARKET OVERVIEW
Agriculture November 2010
28
Sources: ―Annual Report 2009–10,‖ Department of Agriculture &
Cooperation, Ministry of Agriculture, Government of India website,
http://agricoop.nic.in/AnnualRepor2009-10/AR.pdf, accessed 14 July
2010; P Kataria and AS Joshi, ―Energy Use in Indian Agriculture,‖
Department of Economics, Punjab Agricultural University, Ludhiana,
India.
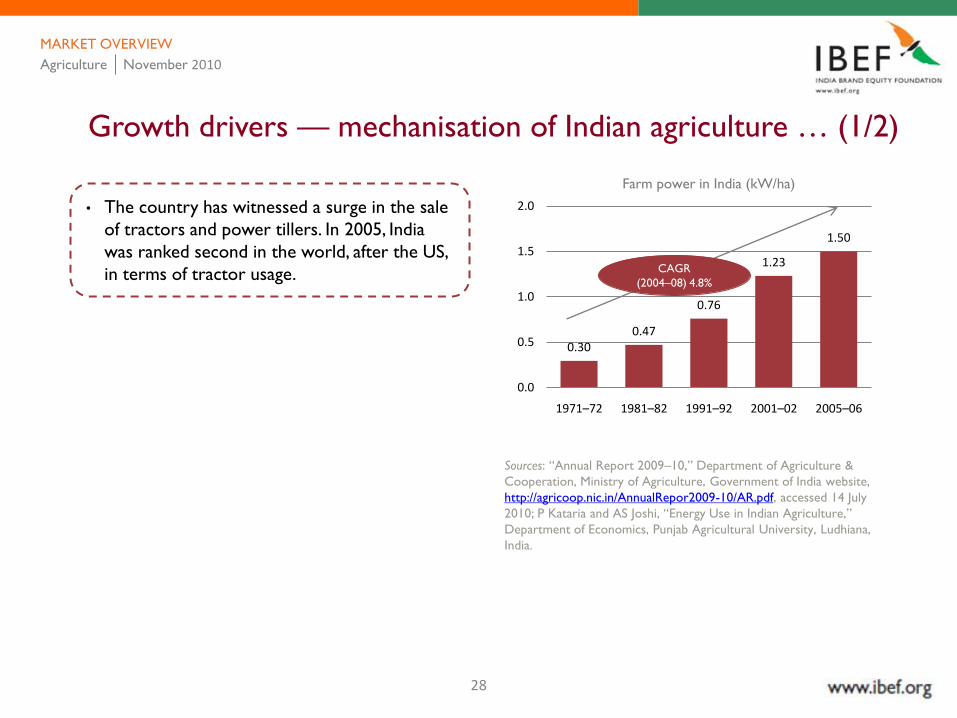
Growth drivers — mechanisation of Indian agriculture … (1/2)
• The country has witnessed a surge in the sale
of tractors and power tillers. In 2005, India
was ranked second in the world, after the US,
in terms of tractor usage.
Farm power in India (kW/ha)
MARKET OVERVIEW
0.300.47
0.76
1.23
1.50
0.0
0.5
1.0
1.5
2.0
1971–72 1981–82 1991–92 2001–02 2005–06
CAGR
(2004–08) 4.8%
Agriculture November 2010
29
Sources: ―Annual Report 2009–10,‖ Department of Agriculture & Cooperation, Ministry of Agriculture, Government of India website,
http://agricoop.nic.in/AnnualRepor2009-10/AR.pdf, accessed 14 July 2010; P Kataria and AS Joshi, ―Energy Use in Indian Agriculture,‖
Department of Economics, Punjab Agricultural University, Ludhiana, India.
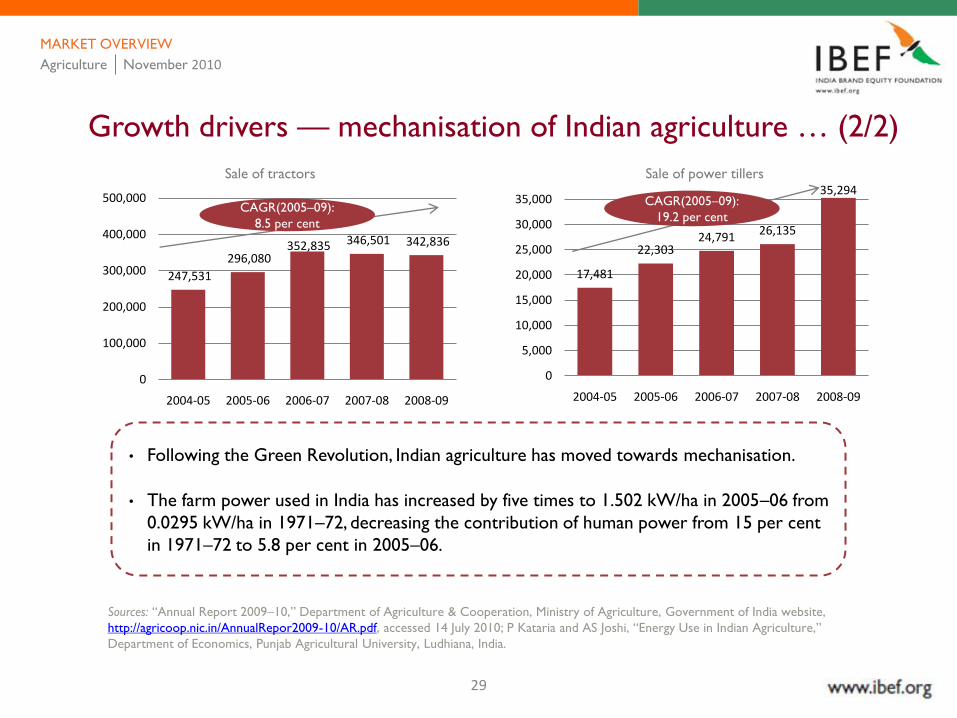
Growth drivers — mechanisation of Indian agriculture … (2/2)
• Following the Green Revolution, Indian agriculture has moved towards mechanisation.
• The farm power used in India has increased by five times to 1.502 kW/ha in 2005–06 from
0.0295 kW/ha in 1971–72, decreasing the contribution of human power from 15 per cent
in 1971–72 to 5.8 per cent in 2005–06.
Sale of tractors Sale of power tillers
MARKET OVERVIEW
247,531
296,080 352,835 346,501 342,836
0
100,000
200,000
300,000
400,000
500,000
2004-05 2005-06 2006-07 2007-08 2008-09
CAGR(2005–09):
8.5 per cent
17,481
22,30324,791
26,135
35,294
0
5,000
10,000
15,000
20,000
25,000
30,000
35,000
2004-05 2005-06 2006-07 2007-08 2008-09
CAGR(2005–09):
19.2 per cent
Agriculture November 2010
30
Source: ―Annual Report 2009–10,‖ Department of Agriculture & Cooperation, Ministry of Agriculture, Government of India website,
http://agricoop.nic.in/AnnualRepor2009-10/AR.pdf, accessed 14 July 2010.
A – Anticipated
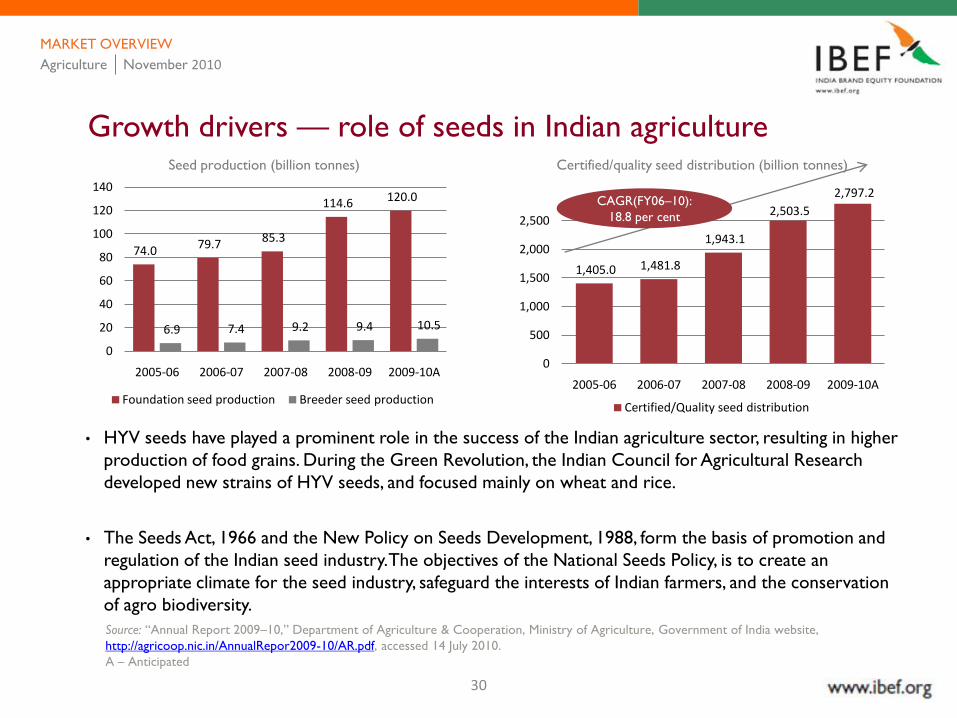
Growth drivers — role of seeds in Indian agriculture
• HYV seeds have played a prominent role in the success of the Indian agriculture sector, resulting in higher
production of food grains. During the Green Revolution, the Indian Council for Agricultural Research
developed new strains of HYV seeds, and focused mainly on wheat and rice.
• The Seeds Act, 1966 and the New Policy on Seeds Development, 1988, form the basis of promotion and
regulation of the Indian seed industry. The objectives of the National Seeds Policy, is to create an
appropriate climate for the seed industry, safeguard the interests of Indian farmers, and the conservation
of agro biodiversity.
Seed production (billion tonnes) Certified/quality seed distribution (billion tonnes)
MARKET OVERVIEW
74.0 79.7 85.3
114.6 120.0
6.9 7.4 9.2 9.4 10.5
0
20
40
60
80
100
120
140
2005-06 2006-07 2007-08 2008-09 2009-10A
Foundation seed production Breeder seed production
1,405.0 1,481.8
1,943.1
2,503.5
2,797.2
0
500
1,000
1,500
2,000
2,500
2005-06 2006-07 2007-08 2008-09 2009-10A
Certified/Quality seed distribution
CAGR(FY06–10):
18.8 per cent
Agriculture November 2010

31
Sources: ―Annual Report 2009–10,‖ Department of Agriculture & Cooperation, Ministry of Agriculture, Government of India website,
http://agricoop.nic.in/AnnualRepor2009-10/AR.pdf, accessed 14 July 2010; ―Flow of institutional credit to agriculture and allied activities,‖ Economic
Survey 2008–09; Ramesh Golait, ―Current Issues in Agriculture Credit in India: An Assessment,‖ Summer 2007, Reserve Bank of India Occasional
Papers, RBI website, http://rbidocs.rbi.org.in/rdocs/Publications/PDFs/82933.pdf, accessed 18 January 2010.
P – Provisional
Growth drivers — improved agricultural credit
• Institutional credit, which comprises loans from commercial banks, cooperatives societies and banks as
well as regional rural banks (RRBs), has grown at a CAGR of about 25 per cent between 2002–03 and
2008–09.
• In 2008–09, the amount disbursed by all banks (including cooperative banks and RRBs) to agriculture
and allied activities stood at US$ 57.5 billion (INR 2,644.6 billion), with commercial banks accounting
for more than three-fourth of the amount disbursed.
Flow of institutional credit to agriculture and allied activities (US$ billion)
MARKET OVERVIEW
57.2% 60.3% 65.0% 69.5% 72.6% 71.1% 76.7%
34.1% 31.0% 25.1% 22.0% 18.5% 19.0% 13.5%
8.7% 8.7% 9.9% 8.4% 8.9% 9.9% 9.8%
2002-03 2003-04 2004-05 2005-06 2006-07 2007-08 2008-09P
Commercial banks Cooperative banks RRBs
100%=
US$ billion15.1 18.9 27.2 39.2 49.9 55.4 57.5
Agriculture November 2010
32
Contents
Advantage India
Market overview
Industry Infrastructure
Investments
Policy and regulatory framework
Opportunities
Industry associations
AGRICULTURE November 2010
33
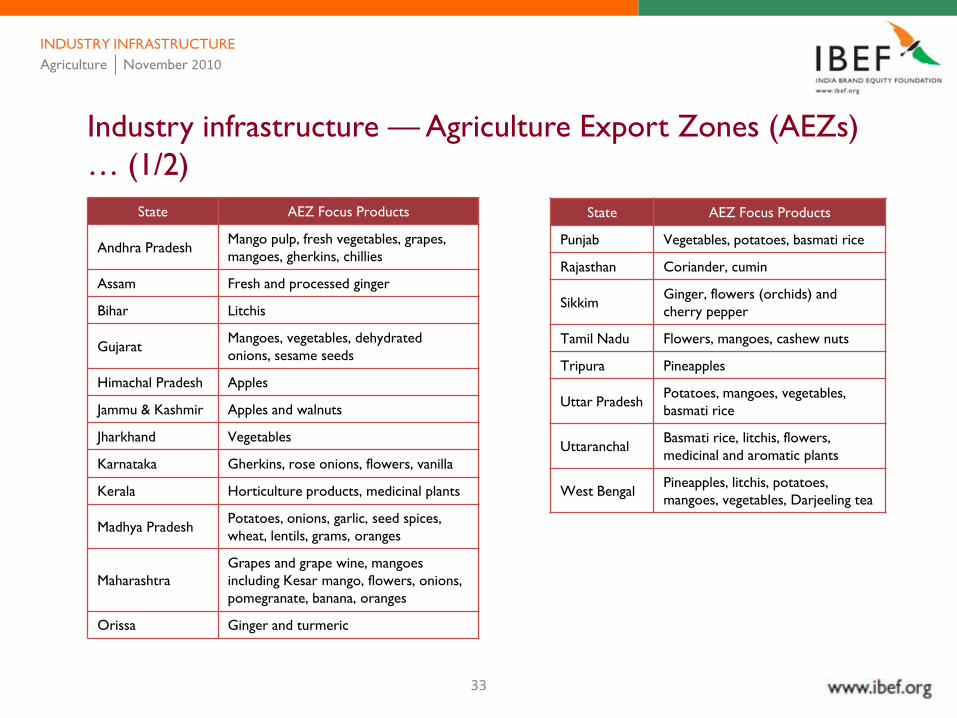
Industry infrastructure — Agriculture Export Zones (AEZs)
… (1/2)
State AEZ Focus Products
Andhra PradeshMango pulp, fresh vegetables, grapes,
mangoes, gherkins, chillies
Assam Fresh and processed ginger
Bihar Litchis
GujaratMangoes, vegetables, dehydrated
onions, sesame seeds
Himachal Pradesh Apples
Jammu & Kashmir Apples and walnuts
Jharkhand Vegetables
Karnataka Gherkins, rose onions, flowers, vanilla
Kerala Horticulture products, medicinal plants
Madhya PradeshPotatoes, onions, garlic, seed spices,
wheat, lentils, grams, oranges
Maharashtra
Grapes and grape wine, mangoes
including Kesar mango, flowers, onions,
pomegranate, banana, oranges
Orissa Ginger and turmeric
State AEZ Focus Products
Punjab Vegetables, potatoes, basmati rice
Rajasthan Coriander, cumin
SikkimGinger, flowers (orchids) and
cherry pepper
Tamil Nadu Flowers, mangoes, cashew nuts
Tripura Pineapples
Uttar PradeshPotatoes, mangoes, vegetables,
basmati rice
UttaranchalBasmati rice, litchis, flowers,
medicinal and aromatic plants
West BengalPineapples, litchis, potatoes,
mangoes, vegetables, Darjeeling tea
INDUSTRY INFRASTRUCTURE
Agriculture November 2010
34
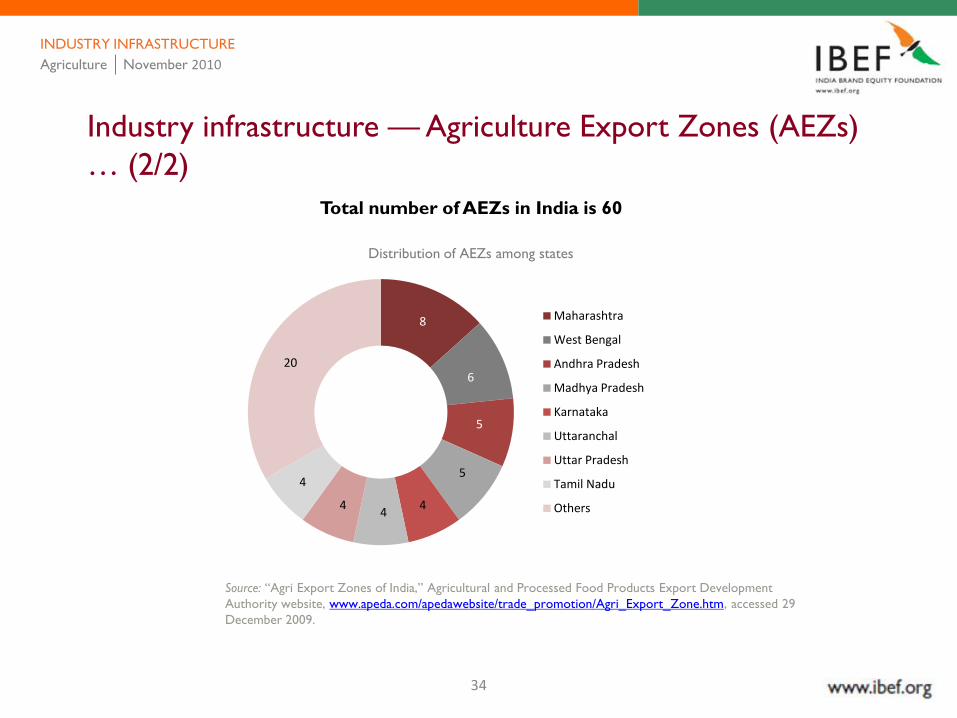
Industry infrastructure — Agriculture Export Zones (AEZs)
… (2/2)
Source: ―Agri Export Zones of India,‖ Agricultural and Processed Food Products Export Development
Authority website, www.apeda.com/apedawebsite/trade_promotion/Agri_Export_Zone.htm, accessed 29
December 2009.
Distribution of AEZs among states
Total number of AEZs in India is 60
8
6
5
5
44
4
4
20
Maharashtra
West Bengal
Andhra Pradesh
Madhya Pradesh
Karnataka
Uttaranchal
Uttar Pradesh
Tamil Nadu
Others
Distribution of AEZs among states
INDUSTRY INFRASTRUCTURE
Agriculture November 2010
35
Contents
Advantage India
Market overview
Industry Infrastructure
Investments
Policy and regulatory framework
Opportunities
Industry associations
AGRICULTURE November 2010
36
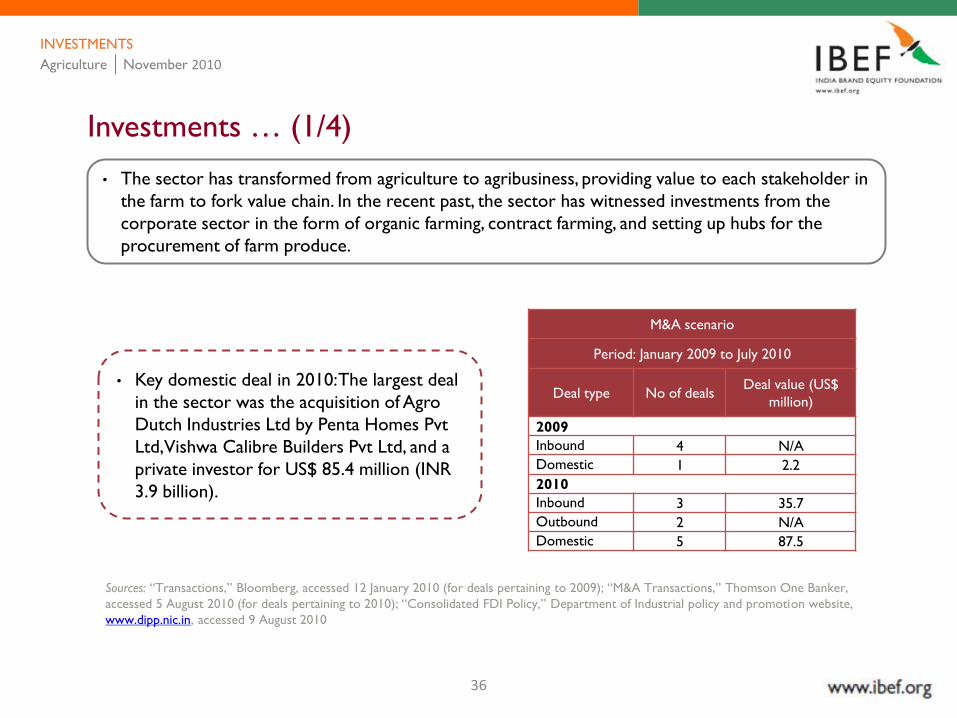
Investments … (1/4)
• The sector has transformed from agriculture to agribusiness, providing value to each stakeholder in
the farm to fork value chain. In the recent past, the sector has witnessed investments from the
corporate sector in the form of organic farming, contract farming, and setting up hubs for the
procurement of farm produce.
INVESTMENTS
Sources: ―Transactions,‖ Bloomberg, accessed 12 January 2010 (for deals pertaining to 2009); ―M&A Transactions,‖ Thomson One Banker,
accessed 5 August 2010 (for deals pertaining to 2010); ―Consolidated FDI Policy,‖ Department of Industrial policy and promotion website,
www.dipp.nic.in, accessed 9 August 2010
M&A scenario
Period: January 2009 to July 2010
Deal type No of dealsDeal value (US$
million)
2009
Inbound 4 N/A
Domestic 1 2.2
2010
Inbound 3 35.7
Outbound 2 N/A
Domestic 5 87.5
• Key domestic deal in 2010: The largest deal
in the sector was the acquisition of Agro
Dutch Industries Ltd by Penta Homes Pvt
Ltd, Vishwa Calibre Builders Pvt Ltd, and a
private investor for US$ 85.4 million (INR
3.9 billion).
Agriculture November 2010
37
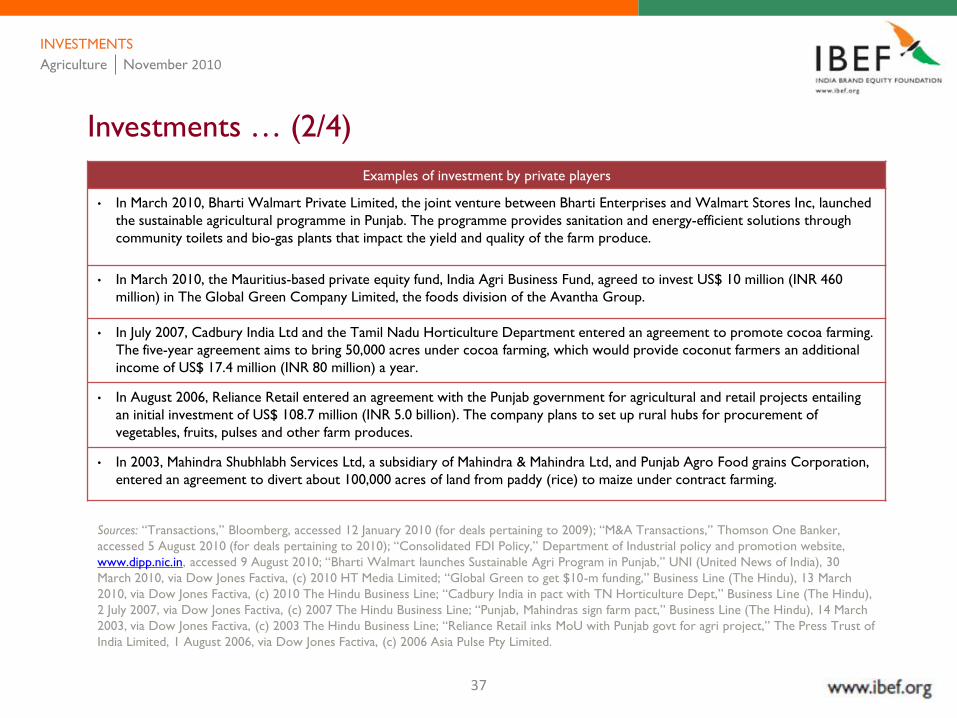
Investments … (2/4)
INVESTMENTS
Examples of investment by private players
• In March 2010, Bharti Walmart Private Limited, the joint venture between Bharti Enterprises and Walmart Stores Inc, launched
the sustainable agricultural programme in Punjab. The programme provides sanitation and energy-efficient solutions through
community toilets and bio-gas plants that impact the yield and quality of the farm produce.
• In March 2010, the Mauritius-based private equity fund, India Agri Business Fund, agreed to invest US$ 10 million (INR 460
million) in The Global Green Company Limited, the foods division of the Avantha Group.
• In July 2007, Cadbury India Ltd and the Tamil Nadu Horticulture Department entered an agreement to promote cocoa farming.
The five-year agreement aims to bring 50,000 acres under cocoa farming, which would provide coconut farmers an additional
income of US$ 17.4 million (INR 80 million) a year.
• In August 2006, Reliance Retail entered an agreement with the Punjab government for agricultural and retail projects entailing
an initial investment of US$ 108.7 million (INR 5.0 billion). The company plans to set up rural hubs for procurement of
vegetables, fruits, pulses and other farm produces.
• In 2003, Mahindra Shubhlabh Services Ltd, a subsidiary of Mahindra & Mahindra Ltd, and Punjab Agro Food grains Corporation,
entered an agreement to divert about 100,000 acres of land from paddy (rice) to maize under contract farming.
Sources: ―Transactions,‖ Bloomberg, accessed 12 January 2010 (for deals pertaining to 2009); ―M&A Transactions,‖ Thomson One Banker,
accessed 5 August 2010 (for deals pertaining to 2010); ―Consolidated FDI Policy,‖ Department of Industrial policy and promotion website,
www.dipp.nic.in, accessed 9 August 2010; ―Bharti Walmart launches Sustainable Agri Program in Punjab,‖ UNI (United News of India), 30
March 2010, via Dow Jones Factiva, (c) 2010 HT Media Limited; ―Global Green to get $10-m funding,‖ Business Line (The Hindu), 13 March
2010, via Dow Jones Factiva, (c) 2010 The Hindu Business Line; ―Cadbury India in pact with TN Horticulture Dept,‖ Business Line (The Hindu),
2 July 2007, via Dow Jones Factiva, (c) 2007 The Hindu Business Line; ―Punjab, Mahindras sign farm pact,‖ Business Line (The Hindu), 14 March
2003, via Dow Jones Factiva, (c) 2003 The Hindu Business Line; ―Reliance Retail inks MoU with Punjab govt for agri project,‖ The Press Trust of
India Limited, 1 August 2006, via Dow Jones Factiva, (c) 2006 Asia Pulse Pty Limited.
Agriculture November 2010

38
Investments … (3/4)
Sources: ―Agriculture and Food Management,‖ Economic Survey 2009-10, Government of India: Union Budget and Economic Survey
website, http://indiabudget.nic.in/es2009-10/esmain.htm ,accessed 08 March 2010.
INVESTMENTS
Key state-wise contract farming initiatives by private sector
State Crop Company/Corporate Area (Hectares)
Maharashtra Soyabean Tinna Oils and Chemicals 134,800
Madhya Pradesh Wheat Hindustan Lever Ltd (HLL) 15,000
Punjab Rice (Basmati)
Satnam Overseas, DD Intenational Inc,
Amira Foods India Ltd (Escorts Ltd & Grain
Tech)
14,700
PunjabRice (Basmati), Groundnut & Potato,
tomato, chilliPepsiCo India Ltd ~6,000
Karnataka Marigold & Caprica Chili AVT Natural Products Ltd 4,000
Punjab Rice (Basmati), Maize Satnam Overseas 4,000
Punjab Barley United Breweries Ltd 2,270
Agriculture November 2010
39
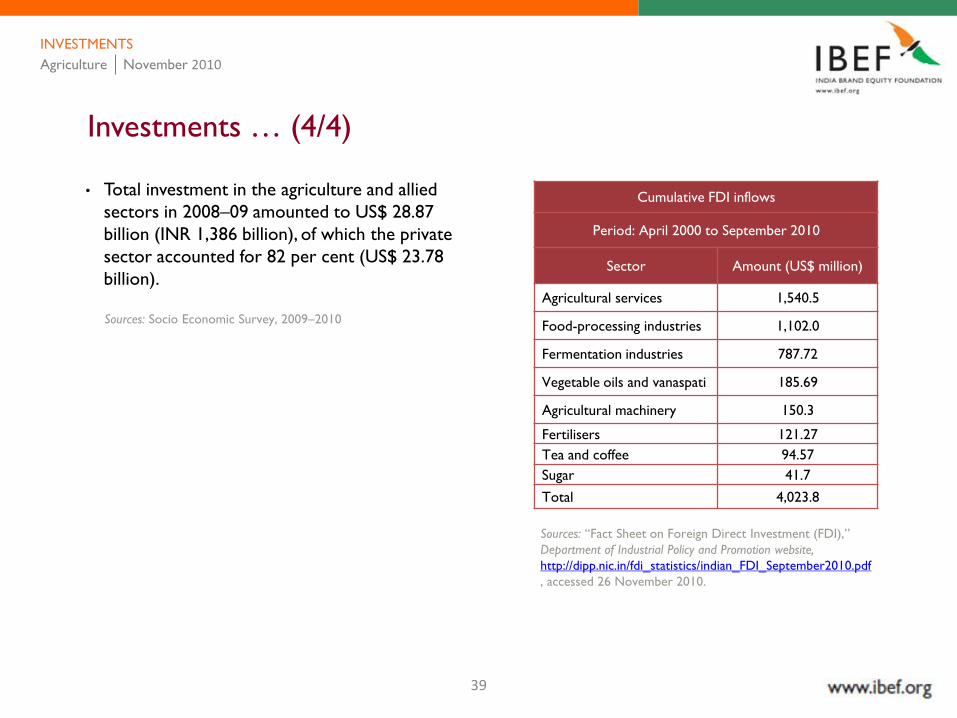
Investments … (4/4)
INVESTMENTS
Cumulative FDI inflows
Period: April 2000 to September 2010
Sector Amount (US$ million)
Agricultural services 1,540.5
Food-processing industries 1,102.0
Fermentation industries 787.72
Vegetable oils and vanaspati 185.69
Agricultural machinery 150.3
Fertilisers 121.27
Tea and coffee 94.57
Sugar 41.7
Total 4,023.8
• Total investment in the agriculture and allied
sectors in 2008–09 amounted to US$ 28.87
billion (INR 1,386 billion), of which the private
sector accounted for 82 per cent (US$ 23.78
billion).
Sources: Socio Economic Survey, 2009–2010
Sources: ―Fact Sheet on Foreign Direct Investment (FDI),‖
Department of Industrial Policy and Promotion website,
http://dipp.nic.in/fdi_statistics/indian_FDI_September2010.pdf
, accessed 26 November 2010.
Agriculture November 2010

40
Contents
Advantage India
Market overview
Industry Infrastructure
Investments
Policy and regulatory framework
Opportunities
Industry associations
AGRICULTURE November 2010

41
Policy and regulatory framework … (1/8)
The various ministries within the Government of India and other agencies responsible
for the development of the agricultural sector include
• Ministry of Food Processing Industries
• Department of Agriculture & Cooperation (National Horticulture Board)
• Department of Animal Husbandry, Dairying and Fisheries
• Ministry of Commerce and Industry (commodity boards for rubber, coffee, tea and spices)
• National Dairy Development Board (NDDB)
POLICY AND REGULATORY FRAMEWORK
Agriculture November 2010
42
Policy and regulatory framework … (2/8)
The major acts and rules pertaining to the agro industry:
• Agriculture Produce (Grading & Marking) Act, 1937
• Fruit Products Order, 1955
• Coconut Development Board Act, 1979
• National Cooperative Development Corporation (NCDC Act), 1962
• Seed Act, 1966
• Seeds Control Order, 1983
POLICY AND REGULATORY FRAMEWORK
Agriculture November 2010
43
Policy and regulatory framework … (3/8)
FDI policy
• 100 per cent FDI is allowed under the automatic route in floriculture, horticulture, development of seeds, cultivation of vegetables and mushrooms under uncontrolled conditions and services related to the agriculture and allied sectors.
• 100 per cent FDI is allowed in the tea sector, including tea plantations, under the government route, subject to the following conditions:
• Compulsory divestment of 26 per cent equity of the company in favour of an Indian partner/the public within a period of five years.
• Prior approval of the state government, in the event of any future land use change.
POLICY AND REGULATORY FRAMEWORK
Agriculture November 2010

44
Policy and regulatory framework … (4/8)
Government initiatives
1. Vishesh Krishi Gram UdyogYojana (VKGUY) — special agriculture and village industry scheme
The objective of this scheme is to promote exports in the following areas
• Agricultural produce and its value-added products
• Minor forest produce and its value-added variants
• Gram udyog products
• Forest-based products
• Other products
POLICY AND REGULATORY FRAMEWORK
Agriculture November 2010
45
Policy and regulatory framework … (5/8)
Government initiatives
2. Rashtriya KrishiVikasYojana (RKVY)
RKVY was launched in 2007 to achieve the objective of attaining 4 per cent growth in the agricultural sector
during the Eleventh Plan Period.
The key objectives of the scheme are:
• To incentivise states to increase public investment in agriculture and allied sectors
• To ensure the preparation of agriculture plans in the districts and states, based on agro-climatic conditions, and the availability of technology and natural resources
• To maximise returns to farmers engaged in the agriculture and allied sectors
• To bring about quantifiable changes in the production and productivity of various components of agriculture and allied sectors by addressing them in a holistic manner
Sources: Department of Agriculture and Cooperation, Department of Industrial Policy and Promotion
POLICY AND REGULATORY FRAMEWORK
Agriculture November 2010
46
Sources: ―Share of Public Sector Outlays and Expenditure under Agriculture and Allied Activities during Ninth Plan, Tenth Plan, and Eleventh Plan,‖
Department of Agriculture & Cooperation, Ministry of Agriculture, Government of India,
http://dacnet.nic.in/eands/At_Glance_2008/Agriculture_new.html accessed 18 January 2010; Source: "Agricultural Statistics At a Glance 2008,‖
Economics And Statistics, Ministry of Agriculture, Government of India website, http://dacnet.nic.in/eands/At_Glance_2008.htm, accessed 18
January 2010.
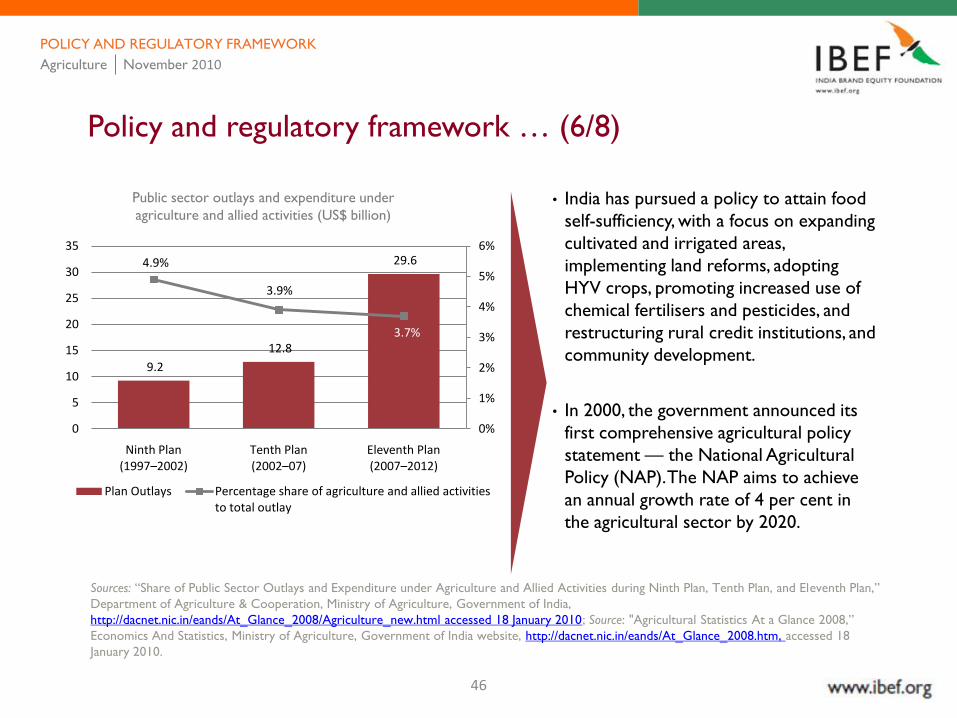
Policy and regulatory framework … (6/8)
Public sector outlays and expenditure under
agriculture and allied activities (US$ billion)
POLICY AND REGULATORY FRAMEWORK
• India has pursued a policy to attain food
self-sufficiency, with a focus on expanding
cultivated and irrigated areas,
implementing land reforms, adopting
HYV crops, promoting increased use of
chemical fertilisers and pesticides, and
restructuring rural credit institutions, and
community development.
• In 2000, the government announced its
first comprehensive agricultural policy
statement — the National Agricultural
Policy (NAP). The NAP aims to achieve
an annual growth rate of 4 per cent in
the agricultural sector by 2020.
9.2
12.8
29.6 4.9%
3.9%
3.7%
0%
1%
2%
3%
4%
5%
6%
0
5
10
15
20
25
30
35
Ninth Plan (1997–2002)
Tenth Plan (2002–07)
Eleventh Plan (2007–2012)
Plan Outlays Percentage share of agriculture and allied activities to total outlay
Agriculture November 2010
47
Policy and regulatory framework … (7/8)
• Currently, India’s agricultural policy focuses on food self-sufficiency, remunerative prices for farmers, and
maintaining stable prices for consumers. These goals are met by a number of instruments such as —
minimum support prices (MSP), food subsidies for consumers, regulated markets, input subsidies for
producers, and international trade policy.
• Since independence, the country has focused on the agricultural sector, through five year plans. The
government’s Eleventh Five Year Plan (2007–2012), focuses on inclusive growth, and rests upon substantial
increase in public sector outlay. In the Eleventh Plan, the public sector outlay towards agriculture and
allied activities stands at US$ 29.6 billion (INR 1,363.8 billion).
POLICY AND REGULATORY FRAMEWORK
Sources: ―Share of Public Sector Outlays and Expenditure under Agriculture and Allied Activities during Ninth Plan, Tenth Plan, and Eleventh Plan,‖
Department of Agriculture & Cooperation, Ministry of Agriculture, Government of India,
http://dacnet.nic.in/eands/At_Glance_2008/Agriculture_new.html accessed 18 January 2010;
Source: "Agricultural Statistics At a Glance 2008,‖ Economics And Statistics, Ministry of Agriculture, Government of India website,
http://dacnet.nic.in/eands/At_Glance_2008.htm, accessed 18 January 2010.
Agriculture November 2010
48
Policy and regulatory framework … (8/8)
The Union Budget 2010–11 focused on the following:
• Provision of US$ 86.9 million (INR 4 billion) to extend the Green Revolution to the eastern region of the country, comprising Bihar, Chhattisgarh, Jharkhand, Eastern Uttar Pradesh, West Bengal and Orissa.
• Provision of US$ 65.2 million (INR 3 billion) to organise 60,000 pulses and oil-seed villages in rain-fed areas in 2010–11 and to provide an integrated intervention for water harvesting, watershed management and soil health to improve productivity of the dry land farming areas.
• Provision of US$ 43.4 million (INR 2 billion) to sustain the gains already made in the green revolution areas through conservation farming, which involves concurrent attention to soil health, water conservation and preservation of biodiversity.
• Banks have been consistently meeting the targets set for agricultural credit flow in the past few years. For the year 2010–11, the agricultural credit flow target has been set at US$ 81.5 billion (INR 3.7 billion).
• In addition to the 10 mega food park projects already being set up, the government has decided to establish five more similar parks.
• External commercial borrowings are to be available for cold storage or cold room facility, including those for farm level pre-cooling, for preservation or storage of agricultural and allied products, marine products and meat.
POLICY AND REGULATORY FRAMEWORK
Source: ―India Agricultural Policy Review,‖ Agriculture and Agri-Food Canada website, www4.agr.gc.ca/AAFC-AAC/display-
afficher.do?id=1201538787839&lang=eng, accessed 18 January 2010.
Agriculture November 2010
49
Contents
Advantage India
Market overview
Industry Infrastructure
Investments
Policy and regulatory framework
Opportunities
Industry associations
AGRICULTURE November 2010

50
Opportunities … (1/3)
Sources: ―Surabhi Mittal, ―Working Paper No 209: Demand-Supply Trends and Projections of Food in India,‖ Indian Council For Research On
International Economic Relations (ICRIER) website, www.icrier.org, accessed 22 January 2010; ―India needs a pulses revolution,‖ The Economic
Times website, http://economictimes.indiatimes.com/opinion/perspectives/India-needs-a-pulses-revolution/articleshow/5035613.cms, accessed 21
September 2009.
OPPORTUNITIES
Demand–supply gap of cereals in India (MT)
188.5
245.1
277.2
209.7242.2
260.2
0
50
100
150
200
250
300
350
2011P 2021P 2026P
Demand Supply
• The demand-supply gap
for food in India shows
that in the short to
medium term, supply will
meet demand
requirements; from 2021
demand will outstrip
supply for cereals, pulses,
edible oil and sugar. Food
commodity prices are
likely to be high and
volatile for the next 10–
15 years. India needs a
pulses revolution in order
to meet the increasing
demand.
Agriculture November 2010
51
Opportunities … (2/3)
Sources: ―Surabhi Mittal, ―Working Paper No 209: Demand-Supply Trends and Projections of Food in India,‖ Indian Council For Research On
International Economic Relations (ICRIER) website, www.icrier.org, accessed 22 January 2010; ―India Agricultural Policy Review,‖ Agriculture and
Agri-Food Canada website, www4.agr.gc.ca/AAFC-AAC/display-afficher.do?id=1201538787839&lang=eng, accessed 18 January 2010.
OPPORTUNITIES
Demand-side
growth along
with
government
initiatives
expected to
help India
become a
leading agro
country
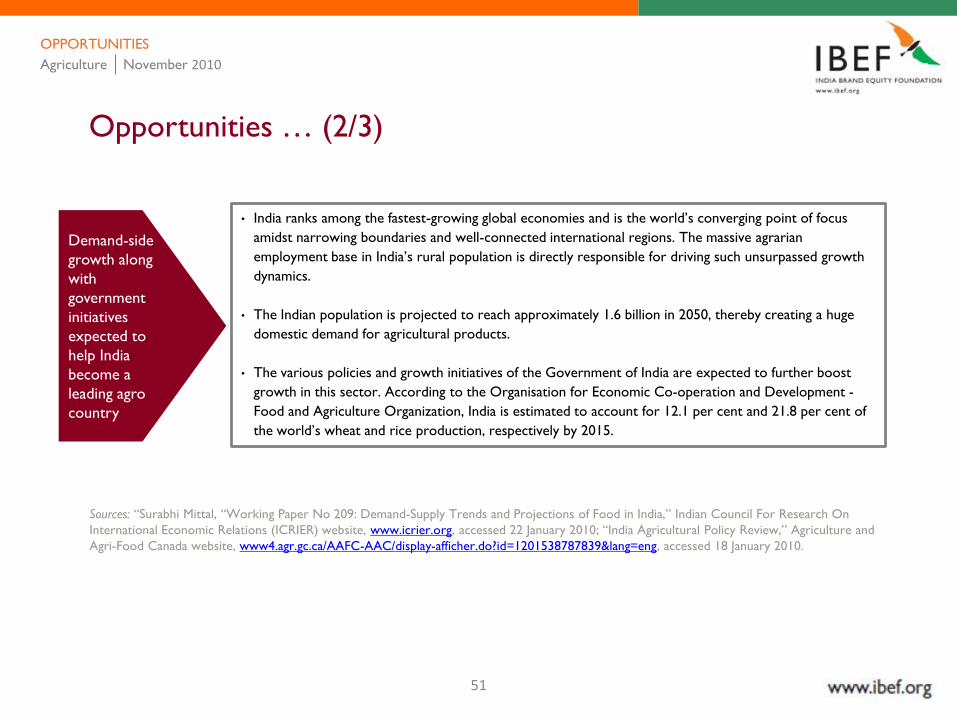
• India ranks among the fastest-growing global economies and is the world’s converging point of focus
amidst narrowing boundaries and well-connected international regions. The massive agrarian
employment base in India’s rural population is directly responsible for driving such unsurpassed growth
dynamics.
• The Indian population is projected to reach approximately 1.6 billion in 2050, thereby creating a huge
domestic demand for agricultural products.
• The various policies and growth initiatives of the Government of India are expected to further boost
growth in this sector. According to the Organisation for Economic Co-operation and Development -
Food and Agriculture Organization, India is estimated to account for 12.1 per cent and 21.8 per cent of
the world’s wheat and rice production, respectively by 2015.
Agriculture November 2010
52
Opportunities … (3/3)
Sources: ―Surabhi Mittal, ―Working Paper No 209: Demand-Supply Trends and Projections of Food in India,‖ Indian Council For Research On
International Economic Relations (ICRIER) website, www.icrier.org, accessed 22 January 2010; ―India Inc urged to invest more in agriculture,‖
Business Line (The Hindu), 23 September 2010, via Dow Jones Factiva, © 2010 The Hindu Business Line; ―PE funds invest $300 mn in food processing,
agri-based companies,‖ Business Standard, 21 July 2010, via Dow Jones Factiva, © 2010 Business Standard Ltd.
OPPORTUNITIES
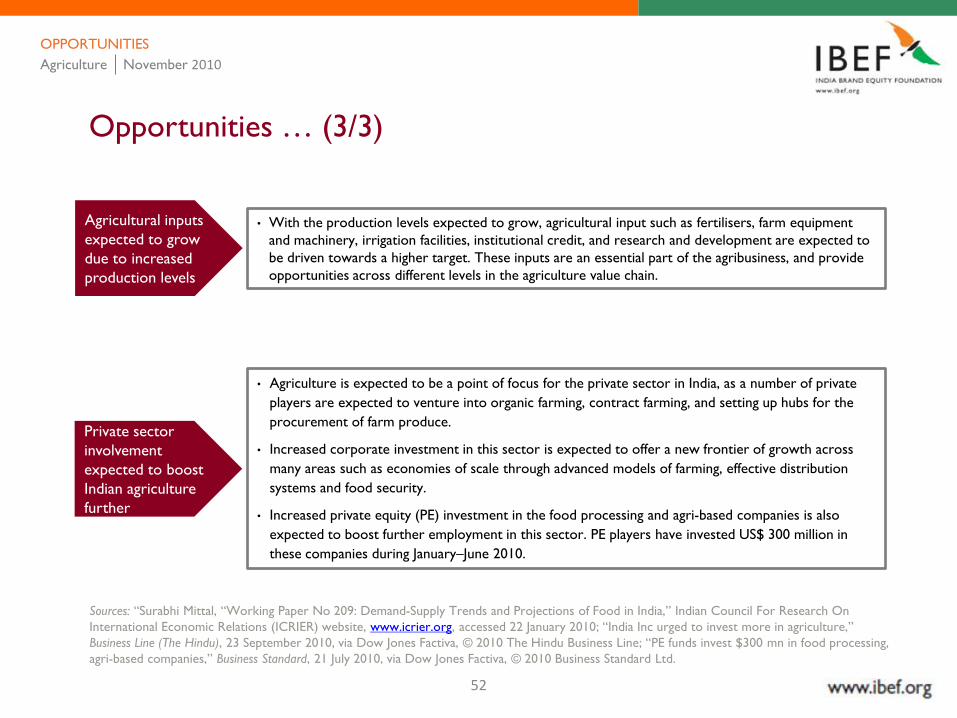
Agricultural inputs
expected to grow
due to increased
production levels
Private sector
involvement
expected to boost
Indian agriculture
further
• With the production levels expected to grow, agricultural input such as fertilisers, farm equipment
and machinery, irrigation facilities, institutional credit, and research and development are expected to
be driven towards a higher target. These inputs are an essential part of the agribusiness, and provide
opportunities across different levels in the agriculture value chain.
• Agriculture is expected to be a point of focus for the private sector in India, as a number of private
players are expected to venture into organic farming, contract farming, and setting up hubs for the
procurement of farm produce.
• Increased corporate investment in this sector is expected to offer a new frontier of growth across
many areas such as economies of scale through advanced models of farming, effective distribution
systems and food security.
• Increased private equity (PE) investment in the food processing and agri-based companies is also
expected to boost further employment in this sector. PE players have invested US$ 300 million in
these companies during January–June 2010.
Agriculture November 2010
53
Contents
Advantage India
Market overview
Industry Infrastructure
Investments
Policy and regulatory framework
Opportunities
Industry associations
AGRICULTURE November 2010

54
Industry associations … (1/3)
Autonomous Bodies
• National Institute of Agricultural Extension Management (MANAGE)
Rajendranagar, Hyderabad–500 030, Andhra Pradesh
Phone: 040-24016702 to 706
Fax: 040-24015388
• National Institute of Agricultural Marketing (NIAM)
Bambala, Kota RoadJaipur–302033, RajasthanPhone: 0141-2770027Fax: 0141-2771938, 2770027
INDUSTRY ASSOCIATIONS
Agriculture November 2010
55
Industry associations … (2/3)
Boards
• Central Insecticides Board and Registration Committee
Machinary Store Building,
N.H.IV Faridabad
Phone: 0129 -2413002
• Coconut Development Board
Kera Bhavan, SRVHS Road, Kochi
Kerala–682011Phone: 0484-2376265, 2377267, 2376553Fax: 0484-2377902
• National Dairy Development Board (NDDB)
PB No 40, Anand–388 001
Phone: 02692-260148/260149/260160
Fax: 02692-260157
INDUSTRY ASSOCIATIONS
Agriculture November 2010
56
Industry associations … (3/3)
Boards
• National Horticulture Board (NHB)
Ministry of Agriculture, Government of India85, Institutional Area, Sector-18Gurgaon–122015, Haryana
• National Oilseeds and Vegetable Oils Development Board (NOVOD)
86, Institutional Area, Sector-18
Gurgaon–122015, Haryana
Councils
• Indian Council of Agricultural Research (ICAR)
Krishi Bhavan, New Delhi 110 114
INDUSTRY ASSOCIATIONS
Agriculture November 2010
57
Wherever applicable, numbers in the report have been rounded off to the nearest whole number.
Conversion rate used: US$ 1= INR 48 and INR 46
Note
NOTE
Agriculture November 2010
58
AGRICULTURE November 2010
DISCLAIMER
India Brand Equity Foundation (IBEF) engaged Ernst &
Young Pvt Ltd to prepare this presentation and the same
has been prepared by Ernst & Young in consultation with
IBEF.
All rights reserved. All copyright in this presentation and
related works is solely and exclusively owned by IBEF. The
same may not be reproduced, wholly or in part in any
material form (including photocopying or storing it in any
medium by electronic means and whether or not
transiently or incidentally to some other use of this
presentation), modified or in any manner communicated
to any third party except with the written approval of
IBEF.
This presentation is for information purposes only. While
due care has been taken during the compilation of this
presentation to ensure that the information is accurate to
the best of Ernst & Young and IBEF’s knowledge and belief,
the content is not to be construed in any manner
whatsoever as a substitute for professional advice.
Ernst & Young and IBEF neither recommend nor endorse
any specific products or services that may have been
mentioned in this presentation and nor do they assume
any liability or responsibility for the outcome of decisions
taken as a result of any reliance placed on this
presentation.
Neither Ernst & Young nor IBEF shall be liable for any
direct or indirect damages that may arise due to any act
or omission on the part of the user due to any reliance
placed or guidance taken from any portion of this
presentation.