agro-economic policy briefs
TRANSCRIPT

Agro-Economic Policy BriefsAiding the Future of India’s Farmers and Agriculture
On Critical Policy Issuesin India’s AgriculturalEconomy
For kind attention of:
The Hon’ble Prime Minister’s Office,the Ministry of Agriculture and Farmers’ Welfare,
and all others interested
For kind attention of:
The Hon’ble Prime Minister’s Office, the Ministry of Agriculture and Farmers’ Welfare,
and all others interested
Agro-Economic Policy BriefsAiding the Future of India’s Farmers and Agriculture
On Critical Policy Issues in India’s Agricultural Economy
Issue 14, December 2019
Contents1. Rescuing Sugarcane Crop
through Drip Irrigation in Maharashtra 2
2. Role of Non-Farm Sector in Doubling Farmers’ Income 3
3. Causes of Low Productivity of Pome and Stone Fruits in Himachal Pradesh 7
4. Status of Dairying and Potential to improve the Socio–Economic Status of Milk Producers in Assam 10
Compiled and Edited by Centre for Management in Agriculture (CMA), Indian Institute of Management AhmedabadContact: Prof. Poornima Varma Co-ordinator, or Prof. Sukhpal Singh Chairperson CMA, or Nikita Pandey Research Associate [email protected] Phone: +91-79-6632-4651
Based on Research & Contributions of: 15 Agro-Economic Research Centres and Units, supported by Ministry of Agriculture & Farmers’ Welfare
(Photo Source: www.bit.ly/32bW5WI)
Issue 19, October 2020
Contents
1. The Possible Implications of Farm Acts 2020 2
2. Problems and Prospects of Bamboo Products Marketing in Assam 4
3. Nutritional Food Security at Household Level calls for Distribution Efficiency of Seed Minikits of Pulses 9
4. Sugarcane Cultivation & Marketing Issues in Punjab 13
Compiled and Edited by Centre for Management in Agriculture (CMA)Indian Institute of Management Ahmedabad Contact: Prof. Poornima Varma Co-ordinator & Chairperson CMA, or Nicky Johnson Research Associate, or Kashish Academic Associate [email protected] Phone: +91-79-7152-4651
Based on Research &Contributions of: 15 Agro-Economic Research Centresand Units, supported byMinistry of Agriculture &Farmers’ Welfare
(Photo Source: https://bit.ly/3oWVMJm)

| 2 |
The Possible Implications of Farm Acts 2020Brajesh Jha
Introduction• Small and marginal farmers dominate Indian
agriculture; those that hardly have any surplus to invest in agriculture. Since a significant part of their income comes from off-farm sources, they are often not in a position to provide undivided attention to farming. Furthermore, agriculture has increasingly become home to residuals in the labor market. Rural stagnation in large parts of India is on the rise. Therefore, there is a reason for stepping up of growth in agriculture and farm income, and any significant improvement in agriculture and farm incomes will affect around 45 percent of the population in the country.
• Betterment of agriculture (farming) requires increased private activities in agriculture. However, the same has not been happening as per its potential. The existing restriction on market and market functionaries is perceived as an important reason for low private activities in agriculture. Additionally, the involvement of private enterprises has also improved technologies in agriculture.
• The farm acts recently passed in Parliament aimed at encouraging private activities in agriculture. These are Farmers’ Produce Trade and Commerce (Promotion and Facilitation) Act (FPTCA) 2020, Essential Commodities (Amendment) Act (ECA) 2020, and Farmers Empowerment and Protection Agreement on Price Assurance and Farm Services Act (FEPAPA&FS) 2020.
Findings• The FPTCA encourages trade and commerce
of farm produce outside physical premises of market or deemed market notified under various state Agricultural Produce Market legislation. It is supposed to promote transparent, barrier-free inter-state and intra-state trade of farmers’ produce. It also presents a framework for electronic trading and matters connected in addition to that. Lastly, FPTCA aims to provide remunerative prices to farmers through competitive alternate trade channels.
• The FEPAPA&FS Act empowers farmers to engage with agribusiness firms (processors, wholesalers, exporters, large retailers) for farm services and
sale of farm produce fairly and transparently. This calls for a written agreement (farm agreement) between the agreed parties, and it has a mandatory electronic registration. The ‘farm agreement’ is not complete without the inclusion of dispute settlement mechanism for timely disposition of disputes. The act (FEPAPA&FS) thus encourages contract farming by providing a national framework for ‘farm agreements’.
• The third farm act relates to the amendment of Essential Commodities Act. Following this amendment, commodities like cereals, pulses, oilseeds, edible oil, onion and potatoes will be removed from the list of essential commodities unless an ‘extraordinary situation’ emerges. The same arises in situations of war, famine, natural calamities and extraordinary price rises. The amendment aims to provide freedom to produce, hold, move, distribute and supply produce to harness economies of scale and attract investment (including FDI) in post-harvest infrastructures in normal circumstances. This enactment, while liberalizing regulatory framework for the benefit of market functionaries, also safeguards the interest of consumers by regulating stocks of the above commodities in case of emergence of ‘extraordinary situations’.
• There are several apprehensions about these farm acts. One of the important apprehensions is about corporatization of agriculture and possibility of corporates taking control of farming and dispossessing farmers from their land. But the objective of different farm acts has been to increase private activities in post-harvest infrastructures via corporate investments. Farmers’ engagement with corporates will be governed by the ‘farm agreement’ (as per the FEPAPA&FS) which is a mutual agreement for sale of produce or services. It is not about land or assets of farmers.
• In the ‘farm agreement’, there are provisions for conciliation of disputes and timely resolution of the same. It will be resolved in a time bound framework at local level (Sub-division Authority). There are enough provisions in the act to check farmers’ interests. Moreover, the corporate (in most cases)

| 3 |
will be engaged with a group of farmers than an individual farmer for the produce and service they desire. Therefore, fear of corporates taking control of land and dispossessing farmers of their land is a long drawn misconception about farm acts.
• Another important apprehension is about the removal of government procurement and ineffectiveness of Minimum Support Prices (MSP) for crops. There are studies to show that MSP has been an important signal for allocation of land in agriculture. Though MSP is announced for around 24 commodities, often it has not been effective for many regions (wholesale markets) of the country. With farm acts, there is an apprehension that the prices of commodities will go down further with collusion among post-harvest operators. Though such a collusion is inimical for long-term association and sustainable agriculture production as in the case of e-choupal. The farm acts do not speak- directly or indirectly against the MSP but an assurance from government for prevalence of MSP would probably help farmers.
• The public (government) procurement of food grains has been an important part of country’s food security. This largely happens for some selected crops (water intensive crops like paddy and wheat) in specific regions (semi-arid regions, Punjab and Haryana) and has significant economic, ecological and social costs. Despite realization of the same, farmers of the region continue to grow these crops as government has been concentrating on those regions for procurement. A heavy procurement from the regions and its distribution across the nation incurs additional cost.
• Rationality demands that cultivation of water intensive crops in semiarid regions must reduce. This may happen with the reduction in procurement of fine cereals from the region. Therefore, farmers’ fear about lessened government procurement from the region is not untrue, but this is not because of farm acts. Additionally, the fear of removal of procurement is not true as the National Food Security Act requires (government) procurement of the food grain.
• It is also argued upon that one of the important objectives of farm acts is about freedom from government monitoring of stocks of post-harvest operators (wholesaler, processor, exporters). However, this expectation is not true as price of
essential commodities often rises and the present amendment is linked to extraordinary situations (price rise). The apprehension about ‘extraordinary rise in price’ is not untrue, as prices of perishables and non-perishables (as per agmarknet.gov.in) frequently rise by 100 and 50 percent respectively over the reference period. However, the situation of ‘extraordinary price rise’ emerges for specific commodities, not for all essential commodities. The post-harvest operators of many essential commodities will therefore be free from government monitoring of stocks.
• The periodic restrictions on post-harvest operators (from monitoring of stock) may not be construed as unjust, since essential commodities account for around 60 percent of food basket of average consumers in India and the country is marginally sufficient in many of the essential commodities. The restriction on post-harvest operators after the emergence of an ‘extraordinary situation’ would possibly keep them alert. This rightly prioritizes consumers’ interest over concern of post-harvest operators. In fact, ‘freedom from government monitoring of food stocks’ requires significant improvement in productivity of many essential commodities.
Conclusions• The farm acts have often been denounced as an
attack on the Federal structure of the country. However, the essentials of farm acts have been on the table for a significant time now. For example, many elements of the Farmers’ Produce Trade and Commerce (Promotion and Facilitation) Act, 2020 are in accordance with the model APMC Act of 2003. But only a few states have adopted the model act, and so the idea of a ‘one nation and one market’ remains distant. The fragmented market was realized as the biggest hurdle in the modernization of the market. Similarly, a demand for change in Essential Service Act to free post-harvest operators from inspection of stocks has existed for more than 25 years.
• Similarly, contract farming has been happening in different parts of the country already. However, this was discontinued frequently because of irritants of either party (farmers or corporates). The irritants in contract farming were addressed by one state, but not by others. While contract farming can be an

| 4 |
answer to many ills in agriculture, the present act guides the interested parties. The enactment of farm acts is therefore not unexpected for an observer of agriculture and rural economy.
• The enactment of farm acts at times is also termed as the watershed moment equivalent to trade liberalization of early 1990s. Enactment of such acts cannot be perceived so. The implementation of these acts has to be monitored cautiously to realize the intended effects of these acts across the country. The legislation has to be complemented with the desired facilities.
• A relatively cheaper availability of necessary inputs is
the key for private participation. The state of Bihar is an example where the absence of APMC (regulated) market could not attract meaningful investment in the post-harvest infrastructures. The interested parties should have less difficulties in getting suitable land and logistics for the establishment of post-harvest infrastructures. Some key public investments from government and governance is a precursor for realizing the benefits of these farm acts.
For further details, contact:Brajesh JhaInstitute of Economic Growth, Delhi University, [email protected]; Phone: 9818670096
Problems and Prospects of Bamboo Products Marketing in AssamMoromi Gogoi and Gautam Kakaty
Introduction• Bamboo is one of the most important forestry
species with wide distribution channels throughout the country. It makes significant contribution to the rural economy in many states of the country by acting an important source of income for livelihood sustenance. According to Forest Survey of India (2017), the total bamboo bearing area of the country was estimated at 15.70 million hectares. The annual production of bamboo in India was of about 14.60 million tones and the bamboo & rattan industry of India was worth Rs.28,005 crores in 2017. The global bamboo market value had touched $68.80 billion in 2018 and is expected to grow at a CAGR of 5.0% from 2019 to 2025 (Bamboos Market Size & Share, Global Industry Report, 2019-25).
• Assam, one of the largest bamboo producing states in India, is rich in sylvan resources and most of its forests are richly stocked with bamboos of various species. Bamboos play an important role in the day to day life of the common people of Assam and have become an integral part of the cultural, social and economic traditions of the State.
• Total bamboo area in Assam is about 2.23 million hectares as against India’s total area of 15.70 million hectares under bamboo. Out of the 130 bamboo species available in India, 51 species are grown in Assam and they are being used for diverse purposes, mainly for buildings, furniture and diverse contraptions.
• Assam is the hub of 36 different species of bamboo which are suitable for producing different varieties of products including edible items like bamboo shoot, agricultural implements, fishing equipment, furniture, musical instruments, household items, ornaments and, decorative items. Although bamboo products were initially used by the rural artisans for their own requirement, its popularity and demand is now on the rise throughout the country due to its unique style and elegance. The products are bio-degradable and environment friendly and free from ecological hazards created by plastic materials.
• The main objectives of the study were to study the potentialities of bamboo products in Assam, to explore the marketing channels of bamboo products in the sample districts, identify the critical issues encountered by the producers in marketing of bamboo products and suggest policy measures. It was based on primary data collected in the year 2019 in two districts of Assam, viz., Jorhat and Sivasagar. From each selected district, two blocks were selected randomly. Then from each selected block, 40 bamboo artisans involved in bamboo products marketing were interviewed to collect the primary level information. Moreover, 10 bamboo product wholesalers from each district were also interviewed to study the marketing aspects of bamboo products. The artisans had then been divided into four groups based on their annual turnover (those earning below Rs.1 lakh, Rs.1–2 lakh, Rs.2-3 lakh and Rs.3 lakhs and above) from marketing bamboo products.

| 5 |
Inputs from 160 artisans and 20 bamboo product wholesalers were taken for this study.
Findings• Based on the sample from study area it was inferred
that the artisans produced different types of bamboo items for the study, viz. household, decorative, musical items, & fishing, weaving equipment etc. Notably, the artisans primarily followed traditional techniques of production and did not focus much on promotional measures to attract customers on a continuous basis. As a matter of fact, the study
showed that complete commercialization of bamboo products was yet to take place.
• The total material cost for all the income groups was found to be Rs. 55,79,885. The household expenditure was found to be the highest in the income group of Rs. 3 lakh & above (Rs. 47,034), followed by Rs. 2-3 lakh income group (Rs. 42,490), Rs. 1-2 lakh income group (Rs. 29,820) and below Rs. 1 lakh income group (Rs. 26,115) with overall average of Rs. 34,874 (Figure 1).
Figure 1: Average Material Cost incurred by the Sample Artisans across the Income Groups 8
Source: Survey
• Each household incurred cost in producing different bamboo products.
Cost incurred by artisans in the below Rs.1 lakh income group was Rs.73,597 for income group of Rs.1-2 lakh it was found to be Rs.83,496, for Rs.2-3 lakh income group, it was estimated at Rs.1,51,796 and for Rs.3 lakh & above income group, it was recorded at Rs.1,56,834. The overall average cost was found at Rs.1,08,833. Household gross return was found to be highest against the income group of Rs.3 lakh & above (Rs.3,05,419) followed by Rs.2-3 lakh income group (Rs.2,29,509) Rs.1-2 lakh income group (Rs.1,20,913) and income group of below Rs.1 lakh (Rs.97,053) (Figure.2)
Figure.2: Average Total Cost and Gross Return from Different Bamboo Products by the Sample Artisans across the Income Groups
0
10000
20000
30000
40000
50000
Below Rs1 lakh
Rs. 1-2lakh
2-3 lakh Rs. 3lakh &above
Average
26115 29820
4249047034
34874
<--
Cos
t (
Rs.
) --
>
<--Income Groups (Rs.)-->
Source: Survey
• Each household incurred cost in producing different bamboo products. Cost incurred by artisans in the below Rs.1 lakh income group was Rs. 73,597, for income group of Rs. 1-2 lakh it was found to be Rs. 83,496, for Rs. 2-3 lakh income group, it was estimated at Rs. 1,51,796 and for Rs.3 lakh & above income group, it was recorded at Rs. 1,56,834. The
overall average cost was found at Rs. 1,08,833. Household gross return was found to be highest against the income group of Rs. 3 lakh & above (Rs. 3,05,419) followed by Rs. 2-3 lakh income group (Rs. 2,29,509), Rs. 1-2 lakh income group (Rs. 1,20,913) and income group of below Rs.1 lakh (Rs. 97,053) (Figure 2).

| 6 |
Figure2: Average Total Cost and Gross Return from Different Bamboo Products by the Sample artisans across the Income Groups
9
Source: Survey
• The BCR (Benefit-Cost Ratio) were found to be positive for all the income
groups. It was worked out at 1.32:1 for below Rs.1 lakh income group, 1.45:1 for 1-2 lakh income group, 1.51:1 for 2-3 lakh income group and 1.95:1 for 3 lakh and above income group. The overall BCR was estimated at 1.61:1. (Figure.3)
Figure.3: Estimated BCR of Bamboo Products Produced by the Sample Artisans Across the Income Groups
Source: Survey
• Artisans under study disposed of their produce through a number of
marketing channels. The common and popular marketing channels prevailing are- (i)Producer–Retailer–Consumer, (ii)Producer–
0
50000
100000
150000
200000
250000
300000
350000
Below Rs. 1lakh
Rs. 1 - 2 lakh Rs. 2 - 3 lakh Rs. 3 Lakh &above
73,597 83,496
1,51,796 1,56,834
97,053 1,20,913
2,29,509
3,05,419
<--
Inco
me
(Rs.
)-->
<-- Income Group (Rs.)-->Cost Return
1.32 1.45 1.51
1.95
0.00
0.50
1.00
1.50
2.00
2.50
Below Rs. 1lakh
Rs. 1 - 2 lakh Rs. 2 - 3 lakh Rs. 3 Lakh &above
<--
BC
R--
>
<-- Income Group-->BCR
Source: Survey
• The BCR (Benefit-Cost Ratio) were found to be positive for all the income groups. It was worked out at 1.32:1 for below Rs.1 lakh income group, 1.45:1 for 1-2 lakh income group, 1.51:1 for 2-3
lakh income group and 1.95:1 for 3 lakh and above income group. The overall BCR was estimated at 1.61:1. (Figure 3).
Figure 3: Estimated BCR of Bamboo Products Produced by the Sample Artisans across the Income Groups
9
Source: Survey
• The BCR (Benefit-Cost Ratio) were found to be positive for all the income
groups. It was worked out at 1.32:1 for below Rs.1 lakh income group, 1.45:1 for 1-2 lakh income group, 1.51:1 for 2-3 lakh income group and 1.95:1 for 3 lakh and above income group. The overall BCR was estimated at 1.61:1. (Figure.3)
Figure.3: Estimated BCR of Bamboo Products Produced by the Sample Artisans Across the Income Groups
Source: Survey
• Artisans under study disposed of their produce through a number of
marketing channels. The common and popular marketing channels prevailing are- (i)Producer–Retailer–Consumer, (ii)Producer–
0
50000
100000
150000
200000
250000
300000
350000
Below Rs. 1lakh
Rs. 1 - 2 lakh Rs. 2 - 3 lakh Rs. 3 Lakh &above
73,597 83,496
1,51,796 1,56,834
97,053 1,20,913
2,29,509
3,05,419
<--
Inco
me
(Rs.
)-->
<-- Income Group (Rs.)-->Cost Return
1.32 1.45 1.51
1.95
0.00
0.50
1.00
1.50
2.00
2.50
Below Rs. 1lakh
Rs. 1 - 2 lakh Rs. 2 - 3 lakh Rs. 3 Lakh &above
<--
BC
R--
>
<-- Income Group-->BCR
Source: Survey
• Artisans under study disposed of their produce through a number of marketing channels. The common and popular marketing channels prevailing are (i) Producer–Retailer–Consumer, (ii) Producer–Wholesaler-Retailer–Consumer and
(iii) Producer-Commission Agent/Middleman Wholesaler – Retailer–Consumer. It was found that maximum volume of bamboo products was traded through channel-III (63.59 %) followed by channel-II (28.24%) and Channel-I (8.17%) (Table-1)

| 7 |
Table 1: Volume of Transaction of Bamboo Products through different Marketing Channels by the Sample Artisans
ChannelsIncome Groups (Rs.) Amount of
transactions (Rs.) PC (%)Below Rs.1 lakh Rs.1-2 lakh Rs.2-3 lakh Rs.3 lakh & above
Channel-I 545,925 609,888 424,133 714,680 2,294,626 8.17Channel-II 1,484,916 1,949,125 1,421,123 3,073,126 7,928,289 28.24Channel-III 2,336,559 3,728,488 3,662,971 8,123,534 17,851,551 63.59Total 28,074,466 100
Source: AERC, Assam
• Although the maximum amount of transactions took place through Channel-III, yet, Channel-I could be the most efficient one because of the fact that the number of market intermediaries were less
in Channel-I as compared to the other channels and thus producers could earn higher margin in channel-I in the study area (Table-2).
Table 2: Market Efficiency of Different Channels based on Marketing Transactions of Bamboo Products by Sample Artisans in Jorhat and Sivasagar District
S.No. Particulars Bamboo Sofa Set
Fishing Equipment
Murha (Bamboo Sitting Tool)
Pasi & Kharahi (Bamboo basket)
Decorative Items
1Channel -I :Jorhat 2.05 1.5 1.69 1.79 1.55Sivasagar 2.17 1.53 1.83 1.87 1.65
2Channel -II:Jorhat 1.39 1.2 1.21 1.15 1.08Sivasagar 1.41 1.23 1.25 1.19 1.17
3Channel-III:Jorhat 0.86 0.76 0.82 0.84 0.79Sivasagar 0.88 0.78 0.89 0.87 0.83
Source: AERC, Assam
• The major problems cited by the artisans in production and marketing of bamboo products were high cost of raw materials, shortage of labor, lack of technical guidance, unsound economic conditions, problems of quality and vulnerability to pests, lack of strong marketing network etc. Inflow of low cost durable products was another major problem. Dearth of market linkages, lack of organized market were the other problems cited.
• During the survey, it was found that although the Central and the state Government had taken various measures to develop the bamboo sector
with timely initiatives to uplift the bamboo artisans under different components of NBM, yet, only 40 percent of the sample respondents heard about the NBM programme. Nearly 92 percent of the bamboo artisans wanted to take bamboo products marketing as a main occupation for commercial production of bamboo items while only 8 percent of the respondents were averse to expansion of their business. 82 percent of them took part in national and international exhibitions organized by various Government organizations and NGOs and 50 percent of them considered those to be very useful.

| 8 |
Figure 4: Bamboo Products Produced by the Sample Artisans
Source: AERC, Assam
Conclusion and Recommendations• The prices of handicraft products are very much
erratic. There is a significant difference in prices of the same article if purchased from two different shops or from two different places and the customer feels exploited. Pricing could be based on categorization of art in itself, skill exhibited and quality of raw materials used.
• Majority of the artisans are not aware of various schemes and programmes launched by the Government extending loan at concessional rates, free tools and implements, dyes and chemical, work shed-cum-housing facilities, training programmes etc. Benefits of the subsidy policy, if any, should reach the rural artisans. Promotional campaigns could be undertaken to make them aware of all these benefits & opportunities. They could also be given the opportunity to avail some training in this line so that can make a living with bamboo craft.
• Continuous research and development efforts could be made for modernization of product-process and upgradation of techniques to meet the changing requirements of the customers.
• The Government’s policy of announcing minimum support prices has helped the growers of agricultural crops. State Governments could be empowered to enact pricing policy for fixing minimum prices for the bamboo items produced by the artisans.
• An institutional approach may create a positive environment to attract the younger generation to adopt the traditional handicraft practices as an alternative avenue for livelihood. For that matter, effective measures may be taken to educate on potentialities and profitability of bamboo & bamboo products. They could exploit better marketing techniques and uplift a large chunk of people in terms of income and employment.
• There lies an immense potentiality of growing bamboo plantation in the state of Assam and so is the future of bamboo products. Bamboo craft continues to be a household enterprise and no serious look has been given for marketing of bamboo products as yet. The critical issues as encountered by the bamboo artisans are needed to be addressed through Government intervention, which may include market intelligence, market support & an efficient price mechanism. A concerted effort, if made and executed in true sense of the term, it can open up a new vista for bamboo craft in the state of Assam, which in turn will uplift a large chunk of people in terms of income & employment.
For further details, contact:Moromi GogoiAgro-Economic Research Centre, Assam Agricultural University, Jorhat, [email protected]; Phone: 9435351250

| 9 |
Nutritional Food Security at Household Level calls for Distribution Efficiency of Seed Minikits of Pulses H. O. Sharma, Deepak Rathi, Hemant Kumar Niranjan
Introduction• Pulses are normally grown in all ecological
conditions in India but the contribution of pulses in overall production is more from Central India as compared to other part of the country. Government is implementing Seed Minikit programme under various schemes of the Ministry of Agriculture. Seed Minikits of different field and fodder crops are to be used to given farmers including those below poverty line in order to introduce new varieties/hybrids and to encourage farmers for seed multiplication of various crops at grass root level.
• Pulses provide high quality protein complementing cereal proteins for pre-dominantly substantial vegetarian population of the country. Although being one of the largest pulses cultivating State in the country, pulses area and production share to total food grain is only 23.38 & 9 and 44 & 24.25 percent in the Country and Madhya Pradesh, respectively. The cultivation of pulses builds up a mechanism to fix atmospheric nitrogen in their root nodules and thus meet their nitrogen requirements to a great extent.
• In India, pulses can be produced with minimum use of resources hence making it less costly than animal protein. In comparison to other vegetables, pulses are rich in protein which are less expensive and can be cultivated as an inter-crop and also as mixed crop. It is mostly cultivated under rain fed conditions and does not require intensive irrigation facility. This is the reason why pulses are grown in areas left after satisfying the demand for cereals/cash crops. Even in such conditions, pulses give better returns. Apart from this, pulses possess several other qualities such as it improves soil fertility and physical structure of the soil, fit in mixed/inter-cropping system, crop rotations.
• India, a country with high concentration of poor and malnourished people, has for long promoted a cereal-centric diet composed of subsidized staples
such as rice and wheat. Today, however, dietary patterns are changing. Policy makers, researchers and health activists are looking for ways to fight malnutrition in the country and not just hunger. As attention is being shifted from calorie intake to nutrition, neglected foods such as pulses (the dried, edible seeds of legumes) are gaining popularity. It is right time to distribute the Seed Minikits across the pulse growing areas not only to increase the Seed and Varietal Replacement Rate but also to break the yield barriers by bridging the yield gap there by achieving nutritional security at household level which is only possible by developing new varieties. Its supply chain and access to farming community through proper and efficient distribution of seed Minikits of pulses. There are three kinds of hunger that need to be dealt with calorie inadequacy, protein deficiency and micronutrient deficiency.
• During 2017-18, pulses were cultivated over 29813.16 thousand hectares of area and recorded the highest ever production of 25416.62 thousand tones with a productivity level of 853 kg/ha. Ten states occupied major area under pulses and contributed more than 90 percent production of pulses in the country. The percentage share in area and production levels were Madhya Pradesh (25.09% & 31.91%), Rajasthan (17.88% & 13.40%), Maharashtra (14.12% & 13.17%), Karnataka (10.14% & 7.68%), Uttar Pradesh (7.59% & 8.66%), Andhra Pradesh (4.72% & 4.79%), Gujarat (3.05% & 3.63%), Tamil Nadu (2.77% & 3.29%), Jharkhand (2.66% & 2.19%) and Chhattisgarh (2.65% & 2.16%) respectively.
• Based on triennium ending 2017-18, out of total pulses area, area occupied under chickpea, black gram, pigeon pea, lentil and green gram was found to be 49.10, 19.79, 9.57, 8.35 and 6.07 percent respectively in Madhya Pradesh with overall productivity of pulses (1872 kg/ha) as shown in Table 1 below:

| 10 |
Table 1: Share of Area under Pulses in Madhya Pradesh (TE 2017-18)
Particulars Area (000 ha)
% share of Area
Production (000 ton)
% share of Production
Productivity (Kg/ha)
Gram 3276.33 49.10 3834.41 53.61 1170.00Lentil 556.95 8.35 506.20 7.08 909.00Urd 1320.67 19.79 893.89 12.50 677.00Tur 638.67 9.57 715.52 10.00 1120.00Moong 405.33 6.07 230.91 3.23 570.00Others 475.12 7.12 970.92 13.58 2044.00Total Pulses 6673.07 100.00 7151.85 100.00 1072.00
Source: MPkrishi.org
Findings• Out of total Seed Minikit (200) distributed in the
year 2018 (171) and 2017 (29), 86 percent were found to be distributed in 2018 among marginal (42.5%) and small (43.5%) respondents, while
14 percent among medium (9%) and large (5%) categories of respondents in 2017. Around 75 percent respondents were found following line sowing (Figure 1).
Figure 1: Methods of Sowing Pulses in the Study Area
15
Particulars Area (000 ha)
% share of Area
Production (000 ton)
% share of Production
Productivity (Kg/ha)
Gram 3276.33 49.10 3834.41 53.61 1170.00 Lentil 556.95 8.35 506.20 7.08 909.00 Urd 1320.67 19.79 893.89 12.50 677.00 Tur 638.67 9.57 715.52 10.00 1120.00 Moong 405.33 6.07 230.91 3.23 570.00 Others 475.12 7.12 970.92 13.58 2044.00 Total Pulses 6673.07 100.00 7151.85 100.00 1072.00
Source: MPkrishi.org
Findings • Out of total Seed Minikit (200) distributed in the year 2018 (171) and
2017 (29), 86 percent were found to be distributed in 2018 among marginal (42.5%) and small (43.5%) respondents, while 14 percent among medium (9%) and large (5%) categories of respondents in 2017. Around 75 percent respondents were found following line sowing (Figure 1).
Figure.1: Methods of Sowing pulses in the study area
Source: Field survey
0102030405060708090
Marginal Small Medium Large
31.03 29.3721.95
11.76
68.97 70.6378.05
88.24
Per
cen
tag
e
Broadcasting Line Sown
Source: Field survey
• Ninety percent became aware about distribution of Seed Minikits which was found to be distributed only through agricultural officers of department of
agriculture of the State. Number of Seed Minikit distributed among different size of farms are shown in Table 2.

| 11 |
Table 2: Number of Seed Minikit Distributed among Different Sizes of Farms
MethodDistribution Awareness
Distribution Channel Agriculture Department2017 2018 % age Increase
over 2018Agriculture
OfficerFarmer
FacilitatorFellow Farmer
Marginal 14 71 80 90.22 5.43 4.34 42.5Small 14 73 81 90.00 5 5 43.5Medium 1 17 94 88.89 11.11 0 9Large 0 10 100 84.62 15.38 0 5Overall 29 171 83 89.66 6.47 3.87 100
Source: Field survey
• The majority of respondents opined that seed distributed was only of short duration varieties superior in quality (73%) and yield (74%) as compared to local varieties which fetches more prices (64%) in the market as compared to local variety. 65.50% of the respondents were found to identify the variety of crops and 54.50% were opined that yield is better than the local variety. The 33%
respondents opined that there must be supervision of field by the experts in the period of cultivation of crop especially at the time of sowing. 61 percent respondents support quality seed distribution by the agriculture department. Respondents’ opinion regarding quality of seed supplied and distribution of Seed Minikits in 2018 are shown in Table 3.
Table 3: Respondents’ Opinion Regarding Quality of Seed Supplied and Distribution of Seed Minikits in the Reference Year 2018 (%)
Particulars Marginal Small Medium Large OverallDistribution of Seed Minikita. Yield Difference 70.59 74.71 83.33 80.00 74.00b. Quality difference 69.41 73.56 83.33 80.00 73.00c. More profitable 62.35 63.22 72.22 70.00 64.00d. Short duration of crop 100.00 100.00 100.00 100.00 100.00Quality of Seed Supplied Identify variety of the crop 51.76 78.82 16.47 7.06 65.50Yield is better 54.12 56.32 50.00 50.00 54.50Supervision of the field by expert 15.29 43.68 61.11 40.00 33.00Support to seed distribution 43.53 74.71 77.78 60.00 61.00
Source: Field Survey
• Poor quality of seed (27%) and non availability of Seed Minikits on time (73%) were found to be major problems as shown in Table 4.
Table 4: Major Problems Faced by Respondents in Availing the Seed Minikit (%)
Particulars Marginal Small Medium Large OverallPoor quality of Seed 23.53 29.89 33.33 20.00 27.00Non-availability of seed minikit in time 76.47 70.11 66.67 80.00 73.00Total 100.00 100.00 100.00 100.00 100.00
Source: Field Survey
• The Majority of respondents want short duration varieties of pulses (12.50%) and arrangement of field demonstration in the villages (39.50%) for effectiveness of Seed Minikit programme. Some of the respondents reported that more advertisement
was needed (23.50%) for effectiveness of the programme. Some of the respondents also wanted that seed germination test should be made compulsory (24.50%) in the respondent’s fields for better plant population in the field (Table 5).

| 12 |
Table 5: Measures to Improve the Effectiveness of the Scheme (%)
Particulars Marginal Small Medium Large OverallShort duration variety 11.76 14.94 11.11 0.00 12.50More Advertisement 18.82 22.99 50.00 20.00 23.50Field demonstration with full packages of practices of pulses production 40.00 42.53 16.67 50.00 39.50
Seed Germination test should be compulsory 29.41 19.54 22.22 30.00 24.50Total 100.00 100.00 100.00 100.00 100.00
Source: Field Survey
• Out of the total respondents, the majority of them suggested that the Seed Minikits should be supplied at minimum rate (25.78%), they wanted to be informed about latest available varieties of pulses and their sources of availability (21.68%), there should be proper monitoring and supervision
after sowing (20.08%), enhanced advertisement (17.74%) and produce of the beneficiaries should be distributed among farming community (14.72%). The respondent’s suggestion to improve the reach of the scheme across size of farms are sown in Table 6.
Table 6: Respondents Suggestions to Improve the Reach of the Scheme (%)
Particulars Marginal Small Medium Large OverallDisseminate the Knowledge about latest available varieties of pulses and their sources of availability 14.34 19.91 25.95 26.53 21.68
Minikits should be supply at Minimum rate 33.28 31.02 20.07 18.76 25.78Monitoring/Supervision after sowing 23.69 21.67 10.08 24.88 20.08Enhanced advertisement 16.93 17.46 24.39 12.18 17.74Produce of the Beneficiaries should be distributed among farming community 11.76 9.94 19.51 17.65 14.72
Total 100.00 100.00 100.00 100.00 100.00
Source: Field Survey
Conclusion and Recommendations• Before distribution of Seed Minikits, result
demonstrations should be conducted on field. Other major inputs could also be clubbed together and distributed among farming communities to generate real impact of technology.
• Farmers may be exposed to crop cafeterias grown by the KVKs where different popular/improved varieties are grown to help them recognize different varieties of a particular crop with its characteristics. They can then adopt the varietal diversification for enhancing the efficiency of resources being used on one hand and increase the productivity on the other, which could lead to doubling farm incomes.
• In order to meet the domestic demand for pulses, a sustainable production and productivity approach could be maintained by deploying multi-pronged short-term and long-term strategies. Imports can help tide over supply deficits in the short term. In
the long run, measures would need to focus on sustainable production system with increased productivity envisaging public capital formation in irrigation, quality seeds of promising varieties and their availability to meet a minimum 33% Seed Replacement Rate (SRR), research and efficient use of water, plant nutrition and other necessary inputs including remunerative prices to the farmers.
• Policy initiatives may lead to efficient domestic production and help to maintain balance between domestic production and demand. If potential yield levels are achieved, then increasing demand in the country can be met in future.
For further details, contact:H. O. Sharma Agro-Economic Research Centre, Jawaharlal Nehru Krishi Vishwa Vidyalaya, [email protected]; Phone: 9893980715

| 13 |
Sugarcane Cultivation & Marketing Issues in PunjabJ.M.Singh, Arjinder Kaur, Parminder Kaur & Satwinder Singh
Introduction• Sugarcane is one of the most important commercial
crops of Punjab, being cultivated on 95 thousand hectares with a production of 7774 thousand tones during the year 2018-19. The productivity of sugarcane was 818 quintals per-hectare. It can be called an agro-industrial crop as it is mainly grown for sugar production in the state. It is grown in two seasons - autumn (September-October) as well as spring (February-March) and lasts for 2-3 years. The autumn grown sugarcane can be considered better with higher yield for the growers and thus higher returns along with higher recovery from the cane by the sugar mills. It also advances cane crushing season enabling farmers to grow other winter crops, thus increasing the profitability from farming (Sanghera et al, 2018).
• There are 16 sugar mills in the state with daily crushing capacity of 53266 tones and recovery percentage of sugar in the state is 10.12. Out of the total existing mills, nine are cooperative mills while seven are in the private sector. According to estimates, Punjab needs to cover almost double the area under the crop to approximately 1.8 lakh hectares so as to meet the technical and economic viability of the mills i.e. at least 900 lakh quintals of sugarcane is needed every year to run each mill for 180 days as per the installed capacity.
• Low risk susceptibility of sugarcane and almost assured returns to an extent even in adverse conditions makes it popular among the farming community. But certain factors like delayed payments by the sugar mills and less or even zero increase in State Advisory Price (SAP) for the crop were hampering its increase in acreage. Considering the remunerative returns and suitable climatic conditions along with good infrastructural facilities, this crop has good potential in the state barring some marketing related issues.
• A survey regarding harvesting and transportation cost of this crop was undertaken in the state as these two major components of cost remain out of the purview of estimating cost of cultivation of crop by the Commission for Agricultural Costs & Prices
(CACP). Two top ranking districts in the state on the basis of area were selected for the survey namely Hoshiarpur and Gurdaspur, roughly comprising 50, percent of the area under sugarcane crop in the state. A sample of 100 sugarcane cultivators was selected from each district thus comprising a total sample of 200 cultivators. Besides, four sugar mills were also selected from the districts which cater to the needs of sugarcane growers in the study area. Two sugar mills selected from Hoshiarpur district operated in the private sector while from Gurdaspur district, one private sugar mill and one co-operative sugar mill had been selected for the survey.
Findings
Area, production and productivity scenario of sugarcane in the state • The sugarcane production in the state has undergone
many ups and downs since the inception of ‘Green Revolution’ era which focused on the cultivation of cereal crops. Thus, with the shifting of cropping pattern exclusively in favor of paddy and wheat crops, variations in area under other crops has been witnessed.
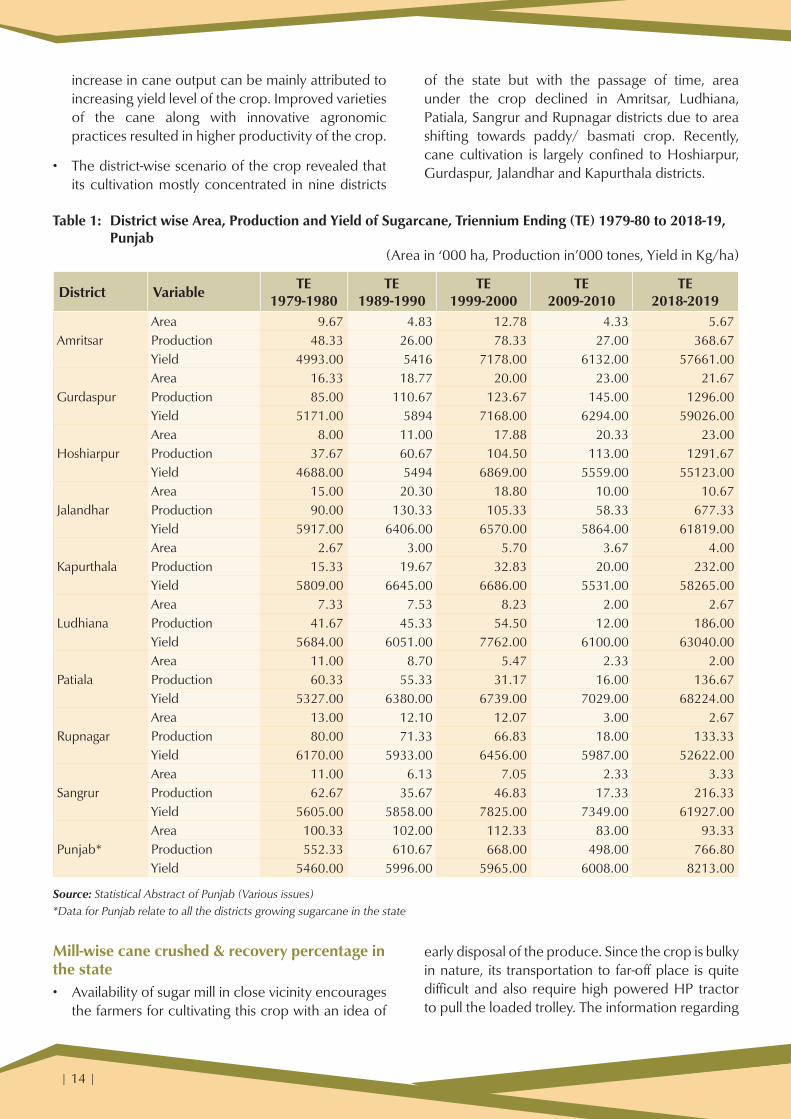
• The status of area, production and yield under sugarcane cultivation in major districts of the state has been shown in Table 1. A perusal of the Table reveals that during the 1970’s and 80’s decade, the area under this crop hovered around one lakh hectares in the state which increased to 1.12 lakh hectares during the Triennium Ending (TE) 1999-2000. But in the following decade, a drop of about 26 percent was witnessed in the area under this crop, which later on improved to 93 thousand hectares by Triennium Ending (TE) 2018-19. The decline in area may be attributed to problem of delayed payments by sugar mills to the farmers. This problem lingered on resulting in decline in area, however, some improvement has been witnessed during the last couple of years.
• The production of sugarcane crop has shown an upward trend over the years except for the period when area under the crop had declined sharply. The
| 14 |
increase in cane output can be mainly attributed to increasing yield level of the crop. Improved varieties of the cane along with innovative agronomic practices resulted in higher productivity of the crop.
• The district-wise scenario of the crop revealed that its cultivation mostly concentrated in nine districts
of the state but with the passage of time, area under the crop declined in Amritsar, Ludhiana, Patiala, Sangrur and Rupnagar districts due to area shifting towards paddy/ basmati crop. Recently, cane cultivation is largely confined to Hoshiarpur, Gurdaspur, Jalandhar and Kapurthala districts.
Table 1: District wise Area, Production and Yield of Sugarcane, Triennium Ending (TE) 1979-80 to 2018-19, Punjab
(Area in ‘000 ha, Production in’000 tones, Yield in Kg/ha)
District Variable TE 1979-1980
TE 1989-1990
TE 1999-2000
TE 2009-2010
TE 2018-2019
AmritsarArea 9.67 4.83 12.78 4.33 5.67Production 48.33 26.00 78.33 27.00 368.67Yield 4993.00 5416 7178.00 6132.00 57661.00
GurdaspurArea 16.33 18.77 20.00 23.00 21.67Production 85.00 110.67 123.67 145.00 1296.00Yield 5171.00 5894 7168.00 6294.00 59026.00
HoshiarpurArea 8.00 11.00 17.88 20.33 23.00Production 37.67 60.67 104.50 113.00 1291.67Yield 4688.00 5494 6869.00 5559.00 55123.00
JalandharArea 15.00 20.30 18.80 10.00 10.67Production 90.00 130.33 105.33 58.33 677.33Yield 5917.00 6406.00 6570.00 5864.00 61819.00
KapurthalaArea 2.67 3.00 5.70 3.67 4.00Production 15.33 19.67 32.83 20.00 232.00Yield 5809.00 6645.00 6686.00 5531.00 58265.00
LudhianaArea 7.33 7.53 8.23 2.00 2.67Production 41.67 45.33 54.50 12.00 186.00Yield 5684.00 6051.00 7762.00 6100.00 63040.00
PatialaArea 11.00 8.70 5.47 2.33 2.00Production 60.33 55.33 31.17 16.00 136.67Yield 5327.00 6380.00 6739.00 7029.00 68224.00
RupnagarArea 13.00 12.10 12.07 3.00 2.67Production 80.00 71.33 66.83 18.00 133.33Yield 6170.00 5933.00 6456.00 5987.00 52622.00
SangrurArea 11.00 6.13 7.05 2.33 3.33Production 62.67 35.67 46.83 17.33 216.33Yield 5605.00 5858.00 7825.00 7349.00 61927.00
Punjab*Area 100.33 102.00 112.33 83.00 93.33Production 552.33 610.67 668.00 498.00 766.80Yield 5460.00 5996.00 5965.00 6008.00 8213.00
Source: Statistical Abstract of Punjab (Various issues) *Data for Punjab relate to all the districts growing sugarcane in the state
Mill-wise cane crushed & recovery percentage in the state • Availability of sugar mill in close vicinity encourages
the farmers for cultivating this crop with an idea of
early disposal of the produce. Since the crop is bulky in nature, its transportation to far-off place is quite difficult and also require high powered HP tractor to pull the loaded trolley. The information regarding

| 15 |
number of sugar mills, cane crushed and sugar produced in Punjab has been provided in Table 2.
• A perusal of the table reveals that presently there are 16 sugar mills operating in the state, with nine in the co-operative sector and seven in the private sector. All these mills taken together have daily crushing capacity of 53266 tones. The sugar
production by sugar mills in Punjab during the year 2018-19 was 786 thousand tones with recovery rate of 10.12 percent. On an average these mills were operational for 144 days in 2018-19 which is less than the norm of 180 days per year as envisaged by technical experts. This is pertinent to mention that eight sugar mills in the state are under liquidation.
Table 2: Mill-wise Cane Crushed and Sugar Produced by Sugar Mills in Punjab, 2018-19
Sugar MillDaily Crushing
capacity (Tonnes)
Cane Crushed
(000 Tonnes)
Sugar production
(000 Tonnes)
Recovery percentage
No. of days worked in
year
Bhogpur Co-operatives Sugar Mills Ltd., Bhogpur 1016 212 23 11.00 160
Morinda Co-operative Sugar Mills Ltd., Morinda 2500 286 31 10.13 125
Batala Co-operative Sugar Mills Ltd., Batala 1500 214 21 9.87 157
Doaba Co-operative Sugar Mills Ltd., S.B.S Nagar 2500 350 35 9.85 156
Wahid Sandhar Sugar Ltd., Phagwara 4500 599 49 9.57 136
Bhagwanpura Sugar Mills Ltd., Dhuri 2500 347 38 10.95 123
Gurdaspur Co-operative Sugar Mills, Ltd. 2000 273 25 9.27 158
Fazilka Co-operative Sugar Mills, Ltd., Fazilka 1250 153 15 9.66 114
Budhewal Co-operative Sugar Mills, Ltd., Budhewal 1250 198 21 10.32 138
Nakodar Co-operative Sugar Mills, Ltd., Nakodar 1250 204 20 9.88 151
Ajnala Co-operative Sugar Mills, Ltd., Ajnala 2500 309 28 9.11 157
Indian Sucrose Ltd Mukerian 6500 1238 131 10.6 123Rana Sugar and Allied Ind. Ltd., Butter Savian 4500 957 97 10.13 138
Nahar Industrial Enterprises Ltd., Amloh 5000 453 50 11.06 124
A.B. Sugar Ltd., Dasuya 7000 1144 110 9.63 155Chadha Sugar Mill & Industries Ltd., Kiri Afgana (Gurdaspur) 7500 907 92 10.22 142
Punjab 53266 7844 786 10.12 144
Source: Statistical Abstract of Punjab
Sugarcane harvesting cost and transportation charges in the study area• It was found out during the survey that harvesting
of sugarcane was under contractual labor system. Wage rate was found to be varying in the range of Rs.50-60 per-quintal. All the cane harvesting laborers were males and no female laborer was involved
in harvesting operation. Total harvesting cost of sugarcane on the sample farms was estimated at Rs.15,071 per-acre. This cost included harvesting, detrashing, and loading of cane in the trolley.
• The transportation of sugarcane from farm gate to sugar mills was totally mechanized and tractor-trolley was the only mode of transportation.

| 16 |
CENTRE FOR MANAGEMENT IN AGRICULTURE (CMA) Indian Institute of Management Ahmedabad (IIMA)
Vastrapur, Ahmedabad, Gujarat 380015e-mail: [email protected] | Phone: +91-79-7152-4650, 7152-4651, 7152-4652
Web: www.iima.ac.in
Average load per-trolley was found to be in the range of 150-170 quintals. No other purchase center, except sugar mills, was found to be existing in the study area. Loading was completely manual in the sampled villages and loading charges were included in the contractual amount of harvesting. Total transportation cost on the sample farms was estimated at Rs.3,479 per acre depending upon the distance of sugar mill from the farmer’s farm. Unloading system was mechanized and exclusively undertaken by sugar mills. No unloading charges were borne by the sugarcane cultivators. Average distance travelled from farms to sugar mills was worked out to be 13 kilometers.
• The produce was purchased by the sugar mills at State Advisory Price (SAP) i.e. Rs.310 per-quintal which is same for the last three seasons. About five percent of sampled farmers were also found to be selling a small proportion of their produce to Gur manufactures at a price of Rs.250-275 per-quintal. Transportation cost in the state is totally borne by the farmers and sugar mills were not contributing anything towards it. Private sugar mills under study were rated as better by the cultivators due to prompt payments. However, co-operative sugar mill in Gurdaspur district was found to be having some payment issues with the cultivators.
• Certain issues were highlighted regarding sugarcane purchase by the sampled farmers. Biased distribution of purchase slips by the sugar mills in favor of large farmers or politically sound/connected people was reported during the survey. Many a times waiting period for selling cane at the sugar mills for the farmers was extended up to 2 to 3 days.
• Farmers also reported bearing extra charges on hiring JCB machines if the trolley gets overturned enroute sugar mill or if it gets stuck in the sludge. Farmers have to hire high HP tractor to pull it out. There was no provision of any compensation for these extra charges which were quite common during the transportation of cane to sugar mills.
Farmers’ payment related issues• There are reports regarding pending payment
issues with the sugar mills in the state. Private mills had a pending payment of Rs.240 crores while co-operative mills have arrears of Rs.123 crores which have to be paid to the sugarcane growers in Punjab1. This is a major issue often reported by the print and electronic media concerning farmer’s welfare.
Recommendations• Farmers incurring losses due to untoward incident/
accident during transportation of cane to the sugar mills could be suitably compensated or at least timely evacuated/rescued by the concerned sugar mill.
• Sugar mills could ensure timely purchase of cane from farmers so that they are not harassed for days together while waiting their turn to dispose of their produce. Also, purchase slips may be timely supplied to the cane growers by the sugar mills.
• Pending payment of farmers by sugar mills may be timely released without further delay. It should be binding on the mill owners to pay the farmers within a stipulated time period after cane purchase.
Acknowledgement• Field survey results are the outcome of data collected
under the project ‘Sugarcane transportation and harvesting cost in Punjab’ undertaken under the guidelines of Ministry of Agriculture and Farmers’ Welfare.
Referencesi. Statistical Abstract of Punjab, Economic Adviser to Government,
Punjab. (2019).ii. Sanghera G.S., Singh R.P., Singh Onkar and Tyagi Vikrant (2018)
Initiatives for sustainable sugarcane farming in Punjab, Journal of Plant Science Research 34(2): 137-152.
For further details, contact:J.M. SinghAgro-Economic Research Centre, Punjab Agricultural Universi-ty, [email protected]; Phone: 9872301032
1The Tribune, Chandigarh, Page 3, August 24, 2020.