agronomic values of anaerobically digested cattle manure (adm) · 2014-02-21 · agronomic values...
TRANSCRIPT

Agronomic values of
anaerobically digested cattle manure (ADM)
Xiying Hao
Agriculture and Agri-Food Canada,
Lethbridge Research Centre
Presented at 2014 Agri-Energy Forum, Pacific Agricultural Show

Livestock
• Current trend is towards large confined operations
o Produce huge quantities of manure
o Applied to relatively a small land area
• Alberta has 4.9 M cattle (40% of the national herd)
o County of Lethbridge licensed feedlot capacity: ~900,000 head
o Several feedlots >25,000 head
• Manure is disposed of rather than used as fertilizer
• Manure management is becoming a environmental issue

Land application
Livestock manure handling
Stockpiling
Composting
Bio-digestion Manure in feedlot pen

Digestate
• Anaerobic digestion (AD) of animal manure is an
environmentally attractive option
• Anarerobically digested manure (ADM), also called
“digestate,” is one of the final by-products of the biogas
energy industry
• ADM is rich in available N and P
5
5
Objective:
• To investigate agronomic values of the AD o Barley forage yield
o Forage barley nutrient uptake and quality
• Soil quality
• Greenhouse gas emission

Materials and methods
• Five treatments and two application rates
o (1) control: no amendment (CK)
o (2) fresh manure (M and M2)
o (3) ADM (D and D2)
o (4) liquid in ADM removed to produce separated solids
(SS and SS2)
o (5) SS processed into pellets (PE and PE2)

Materials and methods
Materials:
• Fresh cattle manure (33-50% solid)
• Digestate (4-9% solid)
• Separated solids (24-44% solid)
• Pellets (65 to 80% solid)
Experimental sites
• St. Albert (Central Alberta)
• Lethbridge (Southern Alberta)

Biogas plant
Vegreville, AB

Materials and methods
• Two rates (Assuming 50% TN available for current crop year):
– 100 and 200 kg N per ha per year for Lethbridge
– 135 and 270 kg N per ha per year for St. Albert
• Recommended rate of synthetic fertilizer N for forage barley is 45 to 148 kg N ha-1 for irrigated soil and 45 to 113 kg N ha-1 for non-irrigated Black soil
• Surface applied without incorporation (no-till soil conservation practice)
• Manually raked soil surface to mix with top 2-5 cm soil
• Seeded on same day or one day after amendment application

10
Materials and methods
• Duration: four years (2008-2011 for Lethbridge, 2009-
2012 for St. Albert),
• Residual year in 2012 for Lethbridge
• Barley grown and harvested at the soft dough stage as
forage for making silage feed
• AC Metcalf 2-row barley for 2008 to 2010, and Chigwell
2-row barley for 2011 and 2012.

11
Measurements
• Yield, TN, TP and other macro (K, Ca and Mg) and
micro-nutrients (Cu and Zn) contents
• Soil physical and chemical properties after four years
• GHG emission during the growing season over four
years

Cattle manure Separated solids Pellets 1 Pellets 2
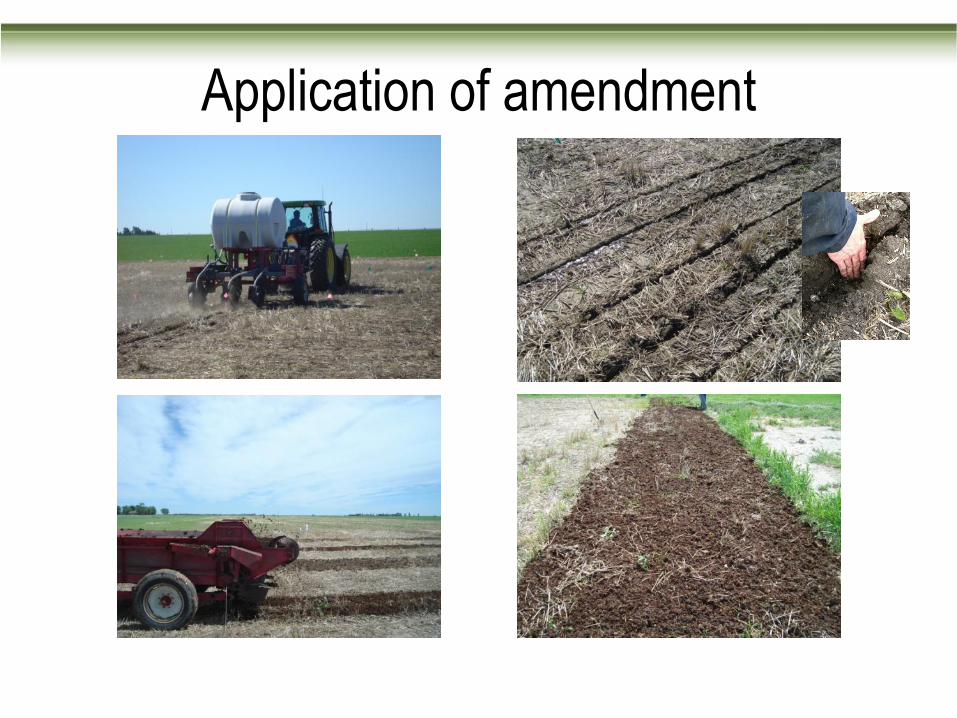
Application of amendment

14
Results
Site Soil Depth OM OC TN TP NH4-N NO3-N Olsen-P
cm % % % % mg/kg mg/kg
mg/kg
Leth. D. Brown 0-5 4.5 2.60 0246 0.056 11 32 20
Irrigated 5-15 3.2 1.87 0.192 0.049 8 21 11
15-30 2.2 1.30 0.141 0.047 5 20 6
30-60 20
60-90 18
St. Al. Black 0-5 15.0 8.69 0.886 0.130 15 41 51
Rain-fed 5-15 13.1 7.60 0.756 0.120 10 26 32
15-30 4.2 2.69 0.246 0.048 3 7 3
30-60 3
60-90 2
Initial soil conditions
Green color indicate a higher NO3 content than typically observed in soil

15
Weather conditions
Site Temperature Precipitation
Seeding date Annual June-Sept Annual June-Oct
Leth. 2008 June 17 6.2 16.0 522 300
2009 June 4 5.8 16.6 417 207
2010 June 29 6.3 15.5 607 273
2011 July 7 6.1 17.0 537 189
2012 May 9 7.1 17.5 422 168
Long-term 5.4 15.7 405 200
St. Al. 2009 June 19 1.8 14.9 231 129
2010 June 9 4.2 14.7 441 258
2011 June 2 2.8 14.6 345 257
2012 May 31 3.3 15.8 349 233
Long-term 3.1 14.3 466 304
Green color indicates a higher and red color lower than the long-term average

Lethbridge barley forage yield
† PE and PE2 received pellet application in 2010, other years same as SS and SS2
0
2
4
6
8
10
12
14
16
2008 2009 2010 2011 2012
(a) 1 X rate
CK
M
D
SS
PE
2008 2009 2010 2011 2012
(b) 2 X rate
CK
M2
D2
SS2
PE2
Met
ric
t/h
a

Year Julian date T ppt
°C mm
2008.6.17 169 6.2 300
2009.6.04 155 5.8 207
2010.6.29 180 6.3 273
2011.7.07 188 6.1 189
2012.5.09 131 7.1 168
Long-term 5.4 200
Yie
ld (
kg h
a-1)
Julia date

St. Albert barley forage yield
PE and PE2 received no pellets in 2009
0
2
4
6
8
10
12
14
16
2009 2010 2011 2012
(a) 1 X rate CK M D SS PE
2009 2010 2011 2012
(a) 2 X rate CK M2 D2 SS2 PE2

Yield difference compared to fresh manure at Lethbridge M
etri
c t/
ha
-2
0
2
4
6
2008 2009 2010 2011 2012 Avg
(a) 1 X rate
D-M
SS-M
PE-M
2008 2009 2010 2011 2012 Avg
(b) 2 X rate
D-M
SS-M
PE-M

Yield difference compared to fresh manure at St. Albert M
etri
c t/
ha
2009 2010 2011 2012 Avg
(b) 2 X rate
D-M
SS-M
PE-M
-2
0
2
4
6
8
2009 2010 2011 2012 Avg
(a) 1 X rate
D-M
SS-M
PE-M

Lethbridge barley forage N uptake – kg N / ha
There were no pellets for 2008, 2009 and 2011
0
50
100
150
200
250
2008 2009 2010 2011 2012 Avg
(a) 1 X rate CK M D SS PE
2008 2009 2010 2011 2012 Avg
(b) 2 X rate CK
M2
D2
SS2
PE2

St. Albert barley forage N uptake
There were no pellets in 2009
N u
pta
ke k
g N
/ h
a
0
50
100
150
200
250
300
350
2009 2010 2011 2012 Avg.
(a) 1 X rate
CK M D SS PE
2009 2010 2011 2012 Avg.
(b) 2 X rate CK M2 D2 SS2 PE2
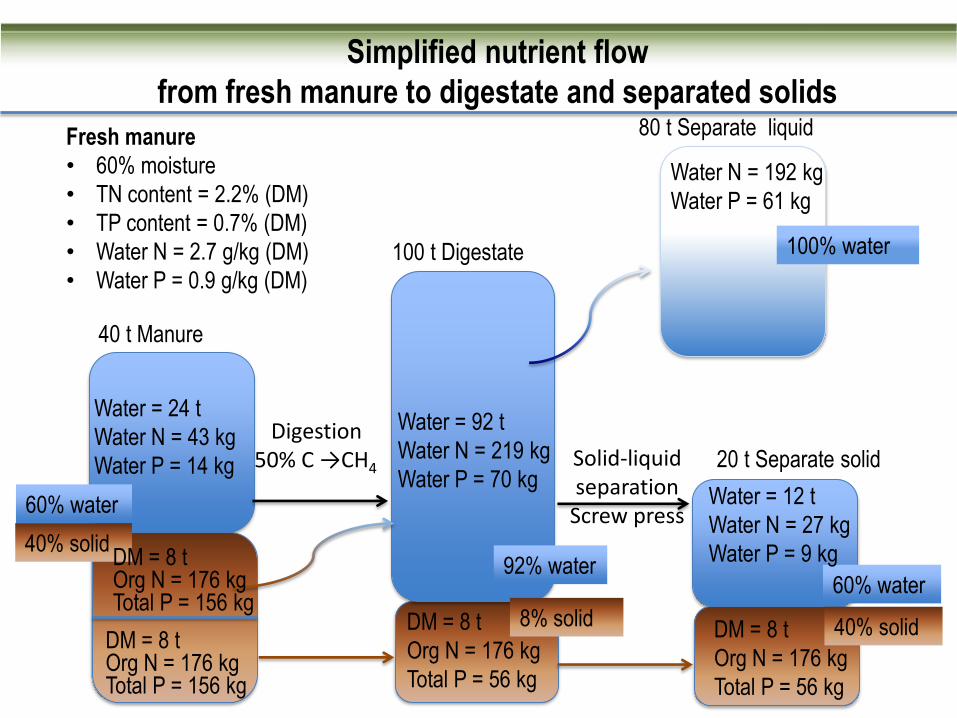
Simplified nutrient flow
from fresh manure to digestate and separated solids
40 t Manure
60% water
40% solid
DM = 8 t Org N = 176 kg Total P = 156 kg
Water = 24 t
Water N = 43 kg
Water P = 14 kg
DM = 8 t
Org N = 176 kg
Total P = 56 kg
Digestion
50% C →CH4
Water = 92 t
Water N = 219 kg
Water P = 70 kg
92% water
8% solid
60% water
40% solid DM = 8 t
Org N = 176 kg
Total P = 56 kg
Water = 12 t
Water N = 27 kg
Water P = 9 kg
Solid-liquid separation
Screw press
100 t Digestate
20 t Separate solid
Fresh manure
• 60% moisture
• TN content = 2.2% (DM)
• TP content = 0.7% (DM)
• Water N = 2.7 g/kg (DM)
• Water P = 0.9 g/kg (DM)
Water N = 192 kg
Water P = 61 kg
80 t Separate liquid
100% water
DM = 8 t Org N = 176 kg Total P = 156 kg
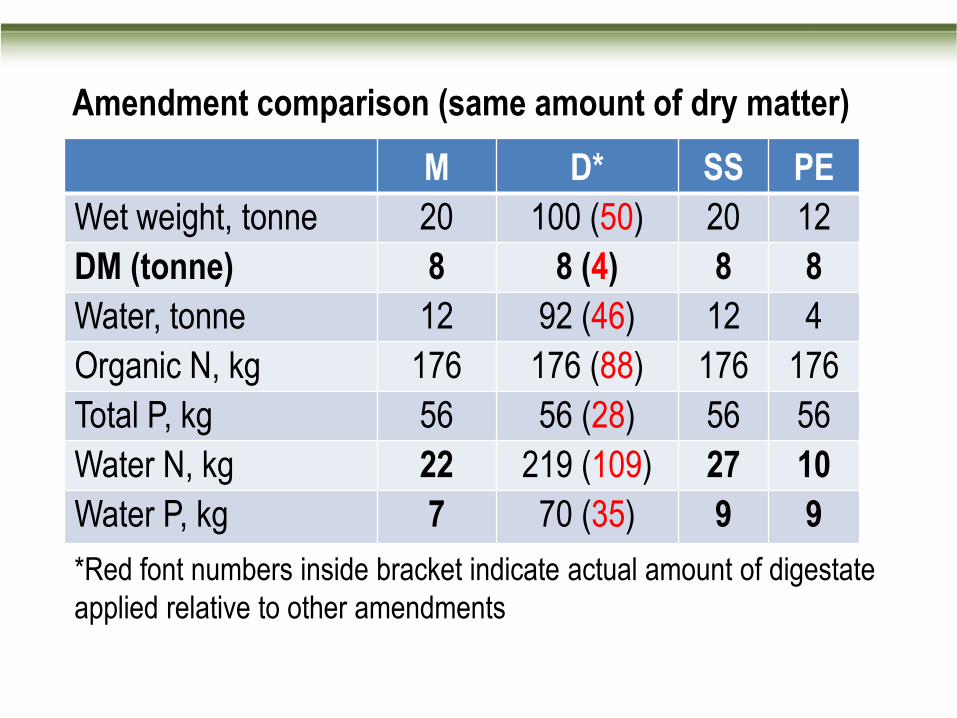
Amendment comparison (same amount of dry matter)
M D* SS PE
Wet weight, tonne 20 100 (50) 20 12
DM (tonne) 8 8 (4) 8 8
Water, tonne 12 92 (46) 12 4
Organic N, kg 176 176 (88) 176 176
Total P, kg 56 56 (28) 56 56
Water N, kg 22 219 (109) 27 10
Water P, kg 7 70 (35) 9 9
*Red font numbers inside bracket indicate actual amount of digestate
applied relative to other amendments

0
10
20
30
40
2008 2009 2010 2011 2012 Avg
(a) 1x rate CK M D SS PE
2008 2009 2010 2011 2012 Avg
(b) 2x rate CK M2 D2 SS2 PE2
Lethbridge barley forage P uptake – kg P / ha

St. Albert barley forage P uptake – kg P / ha
0
10
20
30
40
2009 2010 2011 2012 Avg
(a) 1x rate
CK
M
D
SS
PE
0
10
20
30
40
2009 2010 2011 2012 Avg
(b) 2x rate CK
M2
D2
SS2
PE2

Ca/P ratio in Lethbridge barley forage
• Optimum Ca/P ratio is 1.5 to 2
• > Ca/P < 1 could cause hyperparathyroidism in cattle and decreased milk
production and fertility (Smart and Cymbaluk 1997).
0
2
4
6
8
2008 2009 2010 2011 2012 Avg.
(a) 1x rate CK M D SS PE
0
2
4
6
8
2008 2009 2010 2011 2012 Avg.
(b) 2xr ate CK M2 D2 SS2 PE2

0
2
4
6
8
2009 2010 2011 2012 Avg.
(b) 2x rate CK
M2
D2
SS2
PE2
Ca/P ratio in St. Albert barley forage
• Optimum Ca/P ratio is 1.5 to 2
• > Ca/P < 1 could cause hyperparathyroidism in cattle and decreased milk
production and fertility (Smart and Cymbaluk 1997).
0
2
4
6
8
2009 2010 2011 2012 Avg.
(a) 1x rate CK
M
D
SS
PE

K/(Ca+Mg) ratio in Lethbridge barley forage
0
1
2
3
4
2008 2009 2010 2011 2012 Avg.
(a) 1x rate CK
M
D
SS
PE
0
1
2
3
4
2008 2009 2010 2011 2012 Avg.
(b) 2x rate CK
M2
D2
SS2
PE2
• K/(Ca+Mg) > 2.2 increases occurrence of grass tetany illness in cattle
• No pellets in 2008, 2009 and 2011

0
1
2
3
4
2009 2010 2011 2012 Avg
(b) 2x rate CK
M2
D2
SS2
PE2
K/(Ca+Mg) ratio in St. Albert barley forage
0
1
2
3
4
2009 2010 2011 2012 Avg
(a) 1x rate CK M D SS PE
• K/(Ca+Mg) > 2.2 increases occurrence of grass tetany illness in cattle
• No pellets in 2009

Other consideration
• Type of amendment used had minimum effect on feed
quality in our 5-year study at two Alberta locations
• Other factors
o Crop variety
o Soil type
oWeather condition
o Agronomic practice (seeding date)
• Effective use and cycling of nutrients is critical for
livestock – crop production
• Digestate (liquid form) application seems to produce
highest yields, N and P uptake
• Separated solids performed as well as fresh cattle
manure
• Pellets did not performed as well as fresh manure
• We need to improve our understanding of nutrient
behaviour to ensure long-term sustainability
Summary

Acknowledgements
• The workshop organizers
• Collaborators:
o Alberta Agriculture and Rural Development (ARD)
o University of Manitoba
• Technical staff at AAFC Lethbrige and ARD Ag-Tech Centre
at Lethbridge
• Digestate from Highmark Renewables Inc.
