agyemang, ernest - diva - simple search
TRANSCRIPT

TRAFFIC CONGESTION:
THE BANE OF A BUS RAPID TRANSIT SYSTEM IN ACCRA, GHANA?
Agyemang, Ernest
Master of Philosophy Thesis in Development Studies (specializing in Geography)
Department of Geography
Trondheim, May 2009

i
DECLARATION
With the exception of references used, for which due acknowledgement has been made, I,
Agyemang Ernest, do hereby declare that this dissertation is an end product of my own
research under the supervision of Associate Professor Jan Ketil Rod of the Department of
Geography of the Norwegian University of Science and Technology, Trondheim, Norway.
....................................................................
Agyemang, Ernest.
....................................................................
Jan Ketil Rød (Assoc. Prof.)

ii
DEDICATION
To the Lady whose love beautifies my World and inspires me to greater heights, Miss Abigail
Oduro-Kwarteng; the world’s greatest mum, Mary Abora Barfi and my sweet sister Ernestina
Nyanta, I dedicate this work.

iii
ACKNOWLEDGEMENT
“Give thanks to the Lord, for HE is good. His love endures forever” (Psalm 136:1). But for
your protection, love and care during my entire study period, this thesis would never have
seen the light of day. Thank you, Jesus.
Secondly, I am grateful to Associate Professor Jan Ketil Rød, who broadened my
knowledge in GIS and made quality time to supervise this work. I also wish to express thanks
to the Norwegian State Educational Loan Fund for financially supporting my studies here at
NTNU. You made the 15th of each month such a delight! Tusen takk for ditt hjelp!
To Professors Samuel Tetteh-Addo, Alex Boakye Asiedu, Samuel Agyei-Mensah and my
former teaching assistant Dr. Joseph Kofi Teye, all of the Geography Department of the
University of Ghana, I am so grateful for the solid foundation you laid. Indeed, a teacher can
never tell the extent to which his influence reaches!
Again, to all my respondents, especially Mr. Henk Visschers, MD of the Metro Mass
Transit Limited, I am extremely thankful for your help. Messrs Samuel Mawutor, Collins
Sarkodie, Owuraku Kusi Ampofo, Phillip Kassah (Chief Internal Auditor, Ministry of
Transportation); Mrs. Jennifer Asiedu-Dartey (of CERSGIS, Legon) and the Tettey family at
Adenta, Accra who assisted in the geospatial and traffic congestion data collection and
editing, God bless you all. I am grateful also to Kyrre Svarva, the senior adviser at the IT
section of the Faculty of Social Sciences and Technology Management, NTNU for
meticulously processing the field data for this thesis.
I am also grateful to my entire colleague Mphil. students, especially Mari ‘Ama
Buroni’ H. Størvold for your constructive criticisms at the progress meetings which have led
to this final thesis. To all the Ghanaian students at Moholt Studentby who in diverse ways
provided me with ‘a home-away-from-home’ experience, especially Suzanne B. Arthur, Kofi
Amo, Kofi Adutwum and Cephas Delalorm, I am grateful. Nyame nhyira mo nyinaa!!
To my Norwegian family in Trondheim Melvin and Laila Jakobsen, Roger and Tine
Flåløkken, Christofer Kjølner, Maya and the entire members of the Adventkirken, may God
recompense you bountifully for all the joy, inspiration and love that you showered on me and
which has enabled this study too see the light of the day. Takk for familie!!

iv
ABSTRACT
The role of transportation to urban dwellers cannot be overemphasised. Transportation
enables employment, education, health services and leisure. Indeed, it ensures proper “urban
insertion” (Wane, 2001, p.1). However, owing to high levels of motorization, in recent times,
inadequate traffic management strategies, as well as inadequate land use and transportation
planning, traffic congestion is not uncommon in cities all over the world. The economic,
social, environmental and safety costs of traffic congestion are numerous and have gained
much attention in the existing literature. This study proceeds with the aim of identifying the
causes and the extent to which traffic congestion in the Ghanaian capital city of Accra,
conspired with other factors to collapse a pilot Bus Rapid Transit System which was
introduced to curb traffic congestion in the city once and for all.
With the use of the triangulation approach, research tools belonging to both the
quantitative and qualitative methods of doing research, such the GIS-based techniques; five
key informant in-depth interviews; three semi-structured interviews; a focus group discussion
and participatory observation, in addition to using the Time-Geographic framework, the
Structuration and General Systems theories respectively as interpretative guides, this study
made interesting findings.
Improper land use practises, poor siting of terminals and transit points regardless of
planning and architectural principles, activities of the informal economy and the woefully
inadequate transport infrastructure were identified as the factors that cause traffic congestion
on the Kimbu-Adenta highway on which the pilot BRTS operated. While traffic congestion
made it impossible to operate scheduled bus services and increased the operational costs of
the pilot project, other factors such as unhealthy competition among transport operators in
Accra, the absence of a supporting legislative instrument, internal human lapses and the lack
of public education were also identified as having contributed to the demise of the pilot
BRTS.
Proposals to reduce traffic congestion such as improving transport infrastructure,
congestion pricing, enhancing accidents management mechanisms and the implementation of
the comprehensive Urban Transport Project (UTP) would not only mitigate traffic congestion
but will improve the overall performance of public transportation provision in the city and
ensure the success of a future BRTS in Ghana.

v
CONTENTS
Page
DECLARATION ........................................................................................................................ i
DEDICATION ........................................................................................................................... ii
ACKNOWLEDGEMENT ....................................................................................................... iii
ABSTRACT .............................................................................................................................. iv
TABLE OF CONTENTS ........................................................................................................... v
LIST OF FIGURES .................................................................................................................. ix
LIST OF TABLES ..................................................................................................................... x
LIST OF PLATES ................................................................................................................... xii
LIST OF APPENDICES ........................................................................................................ xiii
LIST OF ACRONYMS ......................................................................................................... xiii
CHAPTER ONE: GENERAL INTRODUCTION TO THE STUDY ................................ 1
1.1. Introduction ..................................................................................................................... 1
1.2. Statement of Research Problem ...................................................................................... 4
1.3. Statement of Research Objectives .................................................................................. 6
1.4. Statement of Research Questions.................................................................................... 6
1.5. Organisation of Chapters ................................................................................................ 6
CHAPTER TWO: THEORY AND LITERATURE REVIEW ........................................... 8
2.1. Introduction and Definition of Theory ................................................................................ 8
2.2. Theory: The Philosophical Debate in Geography ............................................................... 8
2.3. Concepts and Theories Employed in this Study ............................................................... 10
2.3.1. Time-Geographic Framework ........................................................................................ 10
2.3.2. Structuration Theory ...................................................................................................... 15

vi
2.3.3. General Systems Theory ................................................................................................ 17
2.4. Literature Review.............................................................................................................. 22
2.4. 1. Introduction ................................................................................................................... 22
2.4. 2. Definition and Types of Traffic Congestion ................................................................. 22
2.4. 3. Why Does Traffic Congestion Occur? .......................................................................... 23
2.4. 4. Procedures Involved in Measurement of Traffic Congestion ....................................... 24
2.4. 5. The Geography and Characteristics of BRTS ............................................................... 25
2.4. 6. Arguments For and Against BRTS ............................................................................... 28
CHAPTER THREE: RESEARCH METHODOLOGY .................................................... 29
3.1. Introduction ....................................................................................................................... 29
3.2. Sources of Primary Data ................................................................................................... 29
3.3. Quantitative Versus Qualitative Sources of Data Generation ........................................... 30
3.4. Research Tools Employed in Primary Data Generation ................................................... 33
3.4.1. GIS-based Techniques ................................................................................................... 33
3.4.2. Interviews with Key Informants and a Discussion ........................................................ 34
3.4.3. Participant Observation .................................................................................................. 36
3.5. Secondary Sources of Data ............................................................................................... 37
3.6. Challenges Faced in this Study ......................................................................................... 37
3.7. Validity, Reliability and Limitations of this Study ........................................................... 39
3.8. Techniques for Data Analysis and Presentations of Findings .......................................... 41
CHAPTER FOUR: THE STUDY AREA ............................................................................ 42
4.1. Location and Size .............................................................................................................. 42
4.2. Topography and Climate ................................................................................................... 45
4.3. Demographic characteristics of the Study Area ................................................................ 46
4.3.1. Population size and Growth ........................................................................................... 47

vii
4.3.2. Population Density ......................................................................................................... 48
4.3.3. Age and Sex Structure ................................................................................................... 48
CHAPTER FIVE: PUBLIC TRANSPORTATION SERVICES AND TRAFFIC
CONGESTION IN ACCRA ................................................................................................. 50
5.1. Introduction ....................................................................................................................... 50
5.2. The Transport Sector ......................................................................................................... 50
5.3. The Road Network of Accra ............................................................................................. 51
5.4. Evolution of Accra’s Present Urban Transport System .................................................... 52
5.5. Traffic Congestion in Accra.............................................................................................. 56
5.5.1. Causes of Traffic Congestion in Accra .......................................................................... 56
CHAPTER SIX: RESULTS AND DISCUSSIONS ............................................................ 61
6.1. Introduction ....................................................................................................................... 61
6.2.1. The Metro Mass Transit: Brief History and Ownership ................................................ 61
6.2.2. The Metro Mass Transit: Services Provided .................................................................. 62
6.3. BRTS in Ghana: Characteristics ....................................................................................... 63
6.4. Traffic Congestion on the Kimbu-Adenta Highway ......................................................... 66
6.4.1 Traffic Congestion by Time of the Day .......................................................................... 67
6.4.2 Traffic Congestion by Day of Week ............................................................................... 72
6.4.3. Reasons for the Observed Traffic Congestion Pattern ................................................... 74
6.5. Factors that collapsed the Pilot BRTS in Accra ................................................................ 83
6.5.1. Traffic Congestion ......................................................................................................... 83
6.5.2. Unhealthy Competition from Other Commercial Drivers ............................................. 84
6.5.3. Lack of Supporting Legislative Instruments .................................................................. 87
6.5.4. Bad Attitudes of Driving Crew and Maladministration of the Service ......................... 88
6.5.5 Inadequate Publicity about the Service ........................................................................... 89
viii
CHAPTER SEVEN: SUMMARY, CONCLUSION AND RECOMMENDATIONS ..... 91
7.1. Introduction ....................................................................................................................... 91
7.2. Summary and Conclusion ................................................................................................. 91
7.2.1. What are the factors that culminate in the occurrence of traffic congestion on the BRTS
corridor? .................................................................................................................................. 92
7.2.2. To what extent did traffic congestion affect the operations of the pilot BRTS? ............ 93
7.2.3. Are there other factors that jointly contributed to the collapse of the pilot BRTS project
in Accra? .................................................................................................................................. 93
7.3. Recommendations ............................................................................................................. 95
7.3.1 Traffic Congestion .......................................................................................................... 95
7.3.2 “A Successful BRTS in Ghana? Of course! And why not?” .......................................... 99
7.4. Areas for Further Research ............................................................................................. 102

ix
LIST OF FIGURES
Page
Figure 2.1 The space-time path................................................................................................13
Figure 2.2 The space-time prism..............................................................................................13
Figure 2.3. The Urban Transport System.................................................................................21
Figure 4.1 A Map of the Greater Accra Region Showing the Study Area..............................46
Figure 4.2 Average Weather Conditions in Accra..................................................................48
Figure 5.1 Percentages of Road Space Usage per Transport Mode in Accra..........................60
Figure 5. 2 Percentages of Passengers Carried per Transport Mode in Accra.........................60
Figure 6.1 AM Peak Thematic Map.........................................................................................69
Figure 6.2 Off Peak Thematic Map..........................................................................................71
Figure 6.3 PM Peak Thematic Map.........................................................................................72
Figure 6.4 Traffic Congestion by Day of the Week.................................................................73

x
LIST OF TABLES
Page
Table 4.1 Demographic Characteristics of Accra....................................................................49
Table 4.2. Comparative Characteristics of the Greater Accra Region....................................50
Table 5.1. GRTCC Membership.............................................................................................56
Table 6.1 Fleet Size and Passenger Capacity of MMT Buses................................................63

xi
LIST OF PLATES
Page
Plate 5.1 Transport terminal on road shoulder........................................................................61
Plate 5.2 Commerce compete for space with vehicles............................................................61
Plate 5.3 Blocking of the Walkway with Adverts..................................................................61
Plate 5.4. Driving on shoulder of road further compounds traffic congestion.......................61
Plate 6.1. A passenger buying a bus ticket at an MMT ticket booth.....................................66
Plate 6.2 Land Use practises at the Zongo Junction..............................................................78
Plate 6.3 An informal economy along the Kimbu-Adenta Highway....................................80
Plate 6.4 Road Infrastructure on the Kimbu-Adenta Highway.............................................82

xii
LIST OF APPENDICES
Page
Appendix 1 Traffic Congestion Registration Form................................................................111
Appendix 2 Interview Guide for Key Informants (Management of the MMT)..................112-3
Appendix 3 Interview Guide for MMT Drivers and Passengers............................................114
Appendix 4 Interview Guide for Key Informants (Public transport
policy makers and experts).................................................................115
Appendix 5 Congestion Scorecard on the Kimbu-Adenta Highway....................................116
Appendix 6 Design of the BRTS Terminals..........................................................................117

xiii
LIST OF ACRONYMS
AMA........................................... Accra Metropolitan Area
AVI..............................................Automatic Vehicle Identification
AVL.............................................Automatic Vehicle Location
BRTS........................................... Bus Rapid Transit System
CBD............................................ Central Business District
CERSGIS................................Center for Remote Sensing & Geographic Information Services
CES..............................................City Express Service
DVLA......................................... Driver Vehicle and Licensing Authority
ESRI............................................ Environmental Systems Research Institute
ERP..............................................Economic Recovery Programme
GDA........................................... Ga District Area
GhIE........................................... Ghana Institution of Engineers
GIS.............................................. Geographic Information Systems
GPS..............................................Global Positioning System
GSS..............................................Ghana Statistical Service
GTTC...........................................Government Technical Training Centre
HCM............................................Highway Capacity Manual (HCM)
HOV............................................High Occupancy Vehicles
IEA.............................................. International Energy Agency
ITS............................................... Intelligent Transportation Systems
LDV.............................................Light-Duty Vehicles
MD...............................................Managing Director
MMT............................................Metro Mass Transit Limited
NRSC..........................................National Road Safety Commission
OSA............................................Omnibus Services Authority
KTC............................................ Koforidua Training Center
STC............................................. State Transport Corporation
SPSS........................................... Statistical Package for the Social Scientist

xiv
TMA...........................................Tema Municipal Area
ROW..........................................Right of Way
UTP............................................Urban Transport Project
1
CHAPTER ONE: GENERAL INTRODUCTION TO THE STUDY
1.1. Introduction
The role of transportation in human life cannot be overemphasised. According to Intikhab et
al. (2008), efficient transportation system plays an important role in catering to the daily
necessities in the lives of the citizens. These include access to amenities and services that are
central to the lives of all individuals, like employment, education, health services and leisure.
At the individual level, Wane (2001, p.1) also points out that ‘transportation is a crucial
vector for urban insertion since it gives access to economic activity, facilitates family life and
helps in spinning social networks. It links the different spaces of the city on which an
individual or a family has to implement his or its tri-dimensional strategy of life (i.e. family,
work, residence). So, urban mobility is at the heart of the challenges faced by any city-
dweller’.
Consequently, cities in the world have witnessed tremendous motorisation during the
recent century, especially since 1988 global car population exceeded 400 million (Walsh,
1990). The reason for this phenomenon, according to Dimitriou (1991) is that in both the
Developed and Third World countries, few activities are more poorly managed than urban
transport. As such, the failure of public transport to meet the needs of travellers has
intensified the demand for private cars. A leading think tank in the UK, The Optimum
Population Trust reported that in the year 2000, about one in nine of the world's 6.1 billion
people owned a car or van. For the same year, the Mobility 2030 report, issued by the World
Business Council for Sustainable Development (2004), suggests that there were nearly 700
million light-duty vehicles (LDVs) i.e. automobiles, light trucks, and derivatives such as sport
utility vehicles and minivans in cities of the world. The LDV numbers, according to the
report, are said to be growing at 2 % annually until it reaches about 1.3 billion by 2030 and to
just over 2 billion by 2050. Interestingly, it is said that nearly all of these increases will be in
cities of the Developing World due to expanding economic growth (ibid).
Owing to this high level of motorization, combined with inadequate traffic
management strategies, an aging and ill maintained vehicle stock, as well as inadequate land
use and transportation planning, especially in the Developing Economies, modern-day cities
have witnessed very significant proportion of traffic congestion. Described as a phenomenon
of increased disruption of traffic movement on an element of the transport system, traffic

2
congestion is most visible when the level of demand for movement approaches or exceeds the
present capacity of the element (Taylor, 1999). As Taylor et al. (2000) argue, traffic
congestion presents a common, if not inevitable, facet of traffic activity in a region,
particularly in urban areas.
This phenomenon has resulted in, among other things, longer travel times, additional
fuel consumption, high pollution levels, vehicle wear and tear, disutility from crowding; and
(in the longer run) the costs of relocating jobs and residences and a deteriorating urban
environment that has a direct bearing on sustainable development (Intikhab et al., 2008;
Palma & Lindsey, 2002).
The consequences of congestion in both the Advanced and Developing Economies are
of special concern in urban policy making and transport planning (Taylor et al., 2000). On the
economic front, it is believed that in the US alone, traffic congestion resulted in a loss of $72
billion to some sixty-eight large urban areas in 1997 (Schrank & Lomax, 1999). This figure
includes time delay valued at $12 per hour (88 % of the total) and extra fuel consumption. In
another study conducted by the Texas Transportation Institute (2004), it came to light that
congestion had caused the US economy 3.7 billion hours of travel delay and 8.7 billion litres
of wasted fuel. These figures represent an increase of 79 million hours and 262 million litres
from 2002 to a total cost of more than $63 billion for the year 2003. In the UK, the
Commission for Integrated Transport notes that while drivers in Central London spend up to
about 50 % of their time crawling in jammed traffic, businesses in the city are also losing
about £2 million a week.1
For the rest of Western Europe, the European Commission in 1995 reported the costs
of traffic congestion to be about two percent of Gross Domestic Product (Prud'homme, 1997)
which is more than double the equivalent US figure quoted above. Although traffic
congestion is a global challenge, the economic impact is most disturbing when one considers
the situation in the developing countries.
Willoughby (2000; cited in Carisma & Lowder, 2008)2 indicates that estimated costs
of congestion in terms of Gross Domestic Product are particularly high in the Asian cities of
Bangkok, Manila and in the Republic of Korea (1.0 to 6.0 %, 4.0 %, and 4.4 % respectively).
1 http://www.cfit.gov.uk/ruc/factsheets/london/index.htm. Accessed on 05.12.2008.
2 http://greenconsumerism.net/wp-content/uploads/2008/08/the-cost-of-traffic-congestion3.pdf Accessed on
10.01.2009

3
This may be due to level of development (particularly as in the case of Bangkok and Manila)
and density of population (as in the case of Bangkok, Manila and Republic of Korea). Thus,
congestion costs are inversely related to the level of development and directly related to
population density (ibid). However, comparatively large cities like Mexico City, Sao Paulo,
Santiago and Dakar recorded low congestion costs figures (i.e. 2.6 %; 2.4 %; 1.4 % and 3.4
% of GDP respectively). These figures appear worrisome given the fact that these losses
could have been used for development and improvement of the general living conditions of
the citizenry. Aside the economic costs, traffic congestion can have profound adverse impacts
on the social (e.g. people unable to physically contact relations on time), environmental (e.g.
excessive emission of carbon dioxide to cause global warming) and safety concerns.
Given the enormity of the problem, policy makers all over the world have
implemented several measures to cut down or minimise the impacts of traffic congestion by
properly maintaining the current road and bridge system; constructing new roads, bridges,
and non-highway infrastructure; encouraging an appropriate balance between different
modes, especially by developing alternatives such as public transportation, and finally,
employing transportation systems management and operations strategies to maximize the
capacity of the infrastructure already in place (Paniati, 2004). Cities such as Curitiba (Brazil),
Lagos (Nigeria), Ottawa (Canada), Los Angeles, and Honolulu (the United States), just to
mention but a few, have developed what is termed as Bus Rapid Transit System (BRTS), as
one remedy to solving the problem of traffic congestion.
It is interesting to note that even though traffic congestion is such a critical problem in
some major urban areas of the world, Palma & Lindsey (2002) are of the opinion that it is not
a recent phenomenon at all. It is said that the ‘problems of traffic congestion in urban areas
were prevalent during the 18th and 19th centuries and also during the heyday of the Roman
Empire’ (Stopher & Meyburg, 1975, cited in Ogunjumo & Agbemi (1991, p.391). Indeed,
chariot riding was banned in Rome during peak hours because of traffic jams (Gibbs 1997).
However, the current prevalence of congestion in surface travel has been exacerbated by
sheer volume of the automobile and other motorized forms of transportation on the roads.
The situation is further aggravated by the human population explosion, especially at the urban
centres.
Ghana, like most countries in the Third World, is no exception to the above described
phenomenon. Indeed, with its high growth rate and the natural desire among the population to
have vehicles of their own, Kwakye and Fouracre (1998, p.1) notes with concern that ‘the

4
high urban growth rate in the country is outpacing the provision of services... thereby making
it difficult to plan and programme transport in harmony with urban development’.
1.2. Statement of Research Problem
Located at latitude 5°33' North and longitude 0°13' West, Accra is Ghana’s largest
administrative and economic centre. As at 2005, a little fewer than 2 million people lived in
this urban conurbation and it is estimated that the figure would have risen to 4 million by
2020 (GSS, 2002; Yankson & Grant, 2003). Consequently, one of the key challenges to
government and stakeholders is to provide sustainable public transport to the teeming
population.
Until the recent last two decades of the twentieth century, Accra had a well planned
and managed public transport system that was owned by the state. This public transport
system operated using big and comfortable buses which were not only safe and regular, but
were reliable as well. However, this state-run urban transport system collapsed due to poor
performance of the economy and associated mismanagement (Addo, 2002). This provided the
impetus for the growth and development of the famous trotro system3 which has become the
major public transport provider in Accra and beyond. Besides this system, a greater number
of residents in the city own and use private cars for their daily transportation needs.
Not only are the vehicle stock used under the trotro system old and poorly
maintained, but they also account for the acute traffic congestion experienced in the city.
Therefore, Fouracre et al. (1994) propose a shift to the use of larger vehicles such as buses in
order to overcome traffic congestion. Again, it is said that a system of bus service which is
convenient, accessible, comfortable, reliable and operating within acceptable levels of noise,
vibration and pollution would be such welcoming news to majority of people (Guohua et al.,
2007).
Following from the above and against the backdrop of Ghana’s desire to achieve a
middle-income status by the year 2020, the nation has sought to ‘establish an efficiently and
modally complementary and integrated transport network for the movement of people and
goods at least cost throughout the country’ (Kwakye & Fouracre, 1998, p.2). In line with this
agenda, the Metro Mass Transit system was introduced in October 2003 with a vision ‘to
3 See Chapter 5. TRANSPORT AND CONGESTION IN ACCRA

5
provide an efficient urban mass transport system in Ghana through the use of buses’. The
Metro Mass Transit Limited was tasked with the operation of this bus service.4
The company introduced what was referred to as the Bus Rapid Transit System
(BRTS)5 on a pilot basis in Accra, in September, 2005, to mitigate the traffic congestion
phenomenon in the city. Following an overwhelming success that was chalked by the pilot
project in the initial phase of its implementation, as seen by the massive public ridership, one
would have thought that the operator of the scheme – the Metro Mass Transit Limited –
would now be basking in the glory of being the pacesetter in implementing a BRTS in the
whole country. However, in just a little over two years of its operation, the company reverted
back to the provision of ‘regular’ bus service to the travelling public of Accra. What this
simply means is that their buses can now hawk for prospective passengers, just like the
private commercial drivers do, besides those who queue at their various designated bus stops.
A lot of researches have been conducted into the phenomenon of urban transportation
across the globe and especially in cities of the developing economies. Most of the research is
about travel behaviour (Dissanayake & Morikawa, 2008); pollution (Atash, 2007); regulation
and management (Sohail et al., 2004); motorization policies (Willoughby, 2001) and
congestion (Daganzo & Cassidy, 2008).
Few authors have shown interest in urban transportation issues in Ghana. These
authors have researched on issues such as injuries or traffic accidents (Mock et al., 1999;
Jørgensen & Abane (1999) and modal choice (Abane, 1993). Aside these notable ones, not
much has been written on the issue of transportation in the urban setting, especially as it
relates to the impacts of traffic congestion on public transport provision.
Therefore, this study aims to delve into the problem of traffic congestion in Accra,
and how it contributed to the collapse of the pilot BRTS. This will go a long way to provide
the requisite feedback that could influence transportation practitioners, policy makers,
transportation geographers and planners in general, to put in practical measures to address the
challenge. This will ensure a general improvement in the transport sector which will have
several positive impacts on the residents of Accra.
Coupled with the above, this research perfectly fit into the comprehensive package of
measures known as the Urban Transport Project (UTP) in Ghana which aims at enhancing the
efficiency and affordability of the urban transport sector, bearing in mind that the overall aim
4 http://metromass.com/pub_trans_gh.htm. Retrieved on 20.12.2007 5 See 6.4. BRTS in Ghana: Characteristics

6
of its development is to contribute to the improvement in the quality of life of the community
(Kwakye & Fouracre, 1998).
1.3. Statement of Research Objectives
The erstwhile pilot Bus Rapid Transit System (BRTS) on the Kimbu-Adenta Highway will
form the main theme for this research. Specifically, the study aims to:
1. identify the causes of traffic congestion on the Kimbu-Adenta corridor;
2. identify the extent to which traffic congestion adversely affected the pilot BRTS;
3. identify other potential causes for the demise of the pilot BRTS.
1.4. Statement of Research Questions
Emanating directly from the above stated objectives, the following research-worthy questions
are asked:
1. what are the factors that culminate in the occurrence of traffic congestion on the
former pilot BRTS corridor?
2. to what extent did traffic congestion affect the operations of the pilot BRTS?
3. are there other factors that jointly contributed to the collapse of the pilot BRTS project
in Accra?
1.5. Organisation of Chapters
This study has been organised into seven chapters. The first chapter proceeds with a general
introduction which is meant to serve as the foundation stone upon which to build the entire
thesis. Readers are then introduced to the main research problem and objectives to be
addressed, as well as research questions for which answers are sought for in the subsequent
chapters. Chapter two presents the theoretical underpinning on which this study positions
itself, in addition to a review of relevant and current literature on the subject under
discussion.
7
The main theme for chapter three is a discussion of the methodology employed in this
research. Sub-themes such as data sources, research tools used, challenges faced, reliability
and limitation issues, as well as how the data is analysed and presented are thoroughly
discussed. In chapter four, readers are introduced to the various characteristics of the study
area which directly or jointly affect the chosen topic and which will help answer the research
questions posed.
With a general discussion on the nature of public transportation services and the
severe traffic congestion phenomenon in Accra, chapter five serves as the forerunner for
chapter six, which discusses in-depth, the results and findings from the research field vis-à-
vis the theories, reviewed literature as well as the stated objectives and questions in this
study.
Chapter seven draws the curtain on the study with a summary of the various findings,
and the associated policy implications as well as strategic recommendations which when
implemented, will go a long way to improve the overall performance of public transport
provision in Ghana.
The preceding chapter is a discussion of the theories employed in this study and a
literature review.

8
CHAPTER TWO: THEORY AND LITERATURE REVIEW
2.1. Introduction and Definition of Theory
Theory may be defined ‘as a system of interconnected abstractions or ideas that condenses
and organizes knowledge about the social world’ (Mikkelsen, 2005, p. 157). It is used in
explanation (Johnston et al., 2000) and helps us to think through research (Pryke et al., 2003).
Therefore, it is argued that ‘without theory, there is nothing to research’ (Kitchin & Tate,
2000, p.32; Silverman, 1993).
There is no one unified theory that is applied by all social and physical scientists to
explain the world. Instead, there are myriad explanatory frameworks that invoke different
theoretical paradigms and approaches, some of which are more dominant at different points
in time and space (Del Casino, 2006, p. 484).
In most instances, theories are derived from what is called metatheories. Metatheories
are ‘constituted by epistemological assumptions (how we know the world) and ontological
assumptions (how the world is structured to produce knowledge)’. Is it also said that
‘ontology and epistemology, taken in conjunction, frame our theories about how the world
might work and how best to study that world’ (ibid, p. 485).
2.2. Theory: The Philosophical Debate in Geography
The greater majority of the late 20th and early 21st century geographic inquiries have been
informed by four major metatheoretical paradigms. These, according to Del Casino (2006)
are: spatial science, humanism, critical realism and poststructuralism.
These schools of thought within the discipline of geography have advanced strong
arguments as to which approach to theory is best for understanding the complex human-
environment relationships in both space and time. Their respective characteristics and
arguments, as documented by Del Casino (2006), are presented and discussed.
Spatial science historically is based in the philosophical tradition of logical
positivism. Epistemologically, positivism favours objectivity; ontologically, it favours order.
Positivism operates within the assumption that through the generation of hypotheses, and the
empirically testing of those hypotheses, it is possible to generate laws about how the world
works. Once the laws are proven, they ‘may be generalisable for universal application’. The
spatial scientist, operating from the position of objectivity, treats the field as something ‘out

9
there’; the subject position of the researcher is distinct and separate from the people the
researcher claims to study.
In contrast, humanism in geography favours subjective experience to objective law.
Epistemologically, whereas spatial science favours generalisability, humanism favours
individuality. Humanists, through a focus on subjective experience, eschew the notion that it
is possible to test hypothesis of the social world empirically; thus they shy away from
deductive theories. Theoretically, humanism’s interests lie in the area of emotions, individual
control and agency, and embodied experience. Similarly, humanists theoretically believe the
world to be orderly, although that ordered world is situated and experienced at the individual
level. They are also interested in intersubjectivity, that is, relations between subjects and
relations between subjects and their place in the world.
Critical realism, the third important theoretical framework in geographical research,
is ‘based in part in structuralism’. Ontologically, critical realists still assert that there is a real
set of processes that structure social life but contend that those processes are mediated by
human knowledge and experience. Theoretically, critical realists understand the world
through empirical investigations of it, although they have become increasingly interested in
the role of discourse and language as objects of analysis of contingent relations. In this school
of thought, oppositional tendencies to bifurcate objectivity and subjectivity, as in spatial
science and humanism, are collapsed.
Epistemologically, poststructuralism operates under the assumptions that the world is
understood through subjective experience; ontologically the world is chaotic. The
assumptions that experience is subjective but that subjectivity is mediated by the deployment
of power through representations and representational practices, therefore, allow
poststructuralists to turn their attention not only to the social construction of space but also to
the ways in which theorists themselves construct the world through the use of their own
epistemological lenses.
While agreeing with Ragurman (1994), cited in Kitchin & Tate (2000, p.6), that such
complex philosophical debates often lead to ‘a lot of apprehension, disenchantment and an
uneasy feeling of being lost in a philosophical wilderness’, it is nevertheless recognised that
such debates are helpful: first, it enables the researcher to understand what other researchers
have done and why, and secondly, it allows for an approach on which to base one’s research
on, in addition to having a theoretical context in which to justify the outcomes of one’s
research.

10
Added to the above, theories and theoretical thinking are important because they inform the
overall research process. Indeed, they are more than just our epistemological and ontological
assumptions as they greatly influence on the choice of methodology a researcher may adopt.
However, one must not lose sight of the fact that in spite of which ‘paradigm’ or
metatheory a researcher applies, ‘theories are only explanations of how the world operates’
(Del Casino, 2006, p. 478). Then again, it is possible that the boundaries between theories
and their objects of analyses may remain blurry. Therefore, it is best to ‘create theories that
are multi-paradigmatic and multi-methodological and that it might be best to consider what
various theories have in common rather than drawing on the boundaries around what might
be different’ (ibid,p.487).
2.3. Concepts and Theories Employed in this Study
The Time-Geographic framework is employed, in addition to elements in the Structuration
and General Systems theories respectively in answering the research questions. It is aimed
that by the use of these framework and theories, an understanding of the factors that
conspired to collapse the pilot BRTS could be obtained. Moreover, as in all researches
conducted in human geography, the reality associated with the human-environment
relationship, both in space and time are often multi-faceted and complex. Therefore, a
combination of concepts and theories may illuminate more than any single concept or theory
will do.
2.3.1. Time-Geographic Framework
Taylor (2003) maintains that time and space form the basic physical dimensions of the
universe. It is believed that our world is a dynamic place and examining how things change
over time allows us to discover temporal patterns (Peuquet, 2006).
Thus, even though Hägerstrand’s (1970) Time-Geography framework was originally
proposed to focus mainly on the relationships between human activities and various
constraints in a space-time context (Golledge and Stimson, 1997), this framework has been
used frequently in a lot of researches to study spatial and temporal characteristics of human
activities in physical space (for example, see Carlstein, 1982; Ellegård, 1999; Parkes &
Thrift, 1980; Yu and Shaw, 2007).

11
In order to posit the Time-Geographic framework in its proper perspective for the purpose of
this study, the discussion begins with the geographical concept of space first. This is then
followed by an in-depth discussion of the framework itself and how it applies to this study.
Space as a concept in geography is as relevant as is divisive. Indeed, the argument has
been made that ‘the importance of the concept of space in geography has always been
controversial (Holt-Jensen, 1999; Unwin, 1992) and whether geography or geographers
should primarily focus on, or at the very least, give some recognition to the importance of
space remains a fundamental question for the discipline’ (Kent, 2003, p. 109).
Historically, special importance has been attached to the power to fix the locations of
events, places and phenomena on the surface of the earth and to represent these on maps. In
his The Nature of Geography (1939), Richard Hartshorne argues that areal differentiation is
the pivot and pinnacle of geographical enquiry, and he treated geography as a ‘correlative
discipline’ whose research methodology involved making comparisons between maps in
order to disclose ‘the functional integration of phenomena’ over space (Johnston et al., 2000).
However, Hartshorne, like most of his peers, took it for granted that space (like time)
was a universal of human existence, an external coordinate of reality, an empty grid of
mutually exclusive points, ‘an unexchanging box’ within which objects exists and events
occur: all of which is to say that he privileged the concept of absolute space (Smith, 1984, p.
ix, cited in Johnston et al., 2000, p. 67-8).
According to Holt-Jensen (1999), the proponents of absolute space treat space as a
container in which ‘first we delimit a spatial section of the earth and then start to examine its
content’. He goes on to argue that the notion of vertical connections i.e. humanity’s
dependence upon local natural resources was the conceptual basis for such studies. Also,
even though Johnston et al. (2000) acknowledge that Hartshorne’s work occupies a strange
position within modern geographical discourses about space, he nevertheless failed to provide
a systematic discussion of the concept of space and even his subsequent genealogy of
geography as one of the ‘spatial sciences’ (with astronomy and geophysics) failed to
elucidate the conceptual basis of his claim.
Other critics also argue that in contrast to the views expressed above whereby spatial
relations are viewed exclusively between the fixed points of a coordinate system, the focus
within current discourse on spatial relations must be defined between objects and events and
thereby made relative to the objects and events that constituted spatial system or spatial
structure. Hence, the concept of relative space – the location of, and distance between,
12
different phenomena in the structure –gained prominence among geographers, especially the
critics of Hartshorne.
By introducing the concept of relative space, horizontal spatial relations and distance
measured in different ways could be given explanatory power. Distance could be measured in
terms of transport costs, travel time, mileage through a transport network and even as
perceived distance. However, Werlen (1993; also cited in Holt-Jensen, 1999) maintains that
the notion of relative space is a blind alley and that actions, rather than space, should be the
focus of human geographic inquiry. As noted previously, the concept of space and its various
characteristics have been the subject of many debates among human geographers to the
extent that newer conception of space as ‘real, material, concrete, non-real, imagined and
symbolic have all emerged in the discipline (Johnston et al., 2000).
Hägerstrand (1970) and his colleagues at Lund did manage to use the concept of space
together with the concept of time, which until that era had been considered only as an
external factor in activity study. Time, according to Hägerstrand, was as essential as space
and should be explicitly included in the investigation process.
Therefore, his conception of Time-Geography employs a two-dimensional space as a
base map to which time is added as a vertical dimension to conceptualise the time-space
paths of individuals ‘upwards’ and sideways through this three-dimensional diagram as they
carried out their everyday tasks. For each individual, he argues, that depending on his or her
access to travel facilities, there is a time-space prism that defines the boundaries of what
activities are possible from his or her home base. Occasionally, an individual’s time-space
will crash with that of other people as they also carry out their daily activities. A classical
case of this scenario, according to Taylor (2003), is a typical ‘rush hour’ where commuters’
time-space paths converge to create a time-space population concentration.
According to an exposition provided by Yu and Shaw (2007), Time Geography
assumes that an individual’s activities are limited by various constraints. Three types of
constraints that can impact an individual’s ability to conduct activities in space and time are:
capability constraints, authority constraints, and coupling constraints (Golledge & Stimson,
1997; ibid). Physiological necessities (e.g. sleeping, eating) and available resources (e.g., auto
ownership) that can constrain a person from participating in activities are recognized as
capability constraints. Authority constraints reflect general rules or laws that limit a person’s
access to either spatial locations (e.g., a military base) or time periods (e.g., open hours of a
library). Coupling constraints are spatial and temporal requirements that allow an individual

13
to bundle with others to conduct certain activities (e.g., having a meeting at a conference
centre at 3pm). Among these three types of constraints, capability and authority constraints
focus on issues related to separate individuals while coupling constraints deal with
interactions among multiple persons.
There are two major time geographic concepts. These are the space-time path and prism.
Figure 2.1 The space-time path. Figure 2.2 The space-time prism. (Hägerstrand 1970)
As illustrated in Figure 2.1, the space-time path traces the individual’s physical movement in
space with respect to time. According to Miller (2003), the path highlights the constraining
effects of a person’s need to be at different locations at different times. It also highlights the
role of transportation in mitigating these constraints. The slope of the curve illustrates the
relationship between time and space in movement. A steeper slope indicates less efficiency in
trading time for space, i.e., more time required per unit space in movement. The path is
vertical when the individual is stationary in space. The path can never be horizontal. The
space-time path can be applied at any temporal scale from real time to a lifespan
(Hägerstrand 1970; ibid).
The space-time prism, as illustrated in Figure 2.2, delimits the possible locations for the
space-time path. In the words of Miller (in press),6 fixed activities anchor a space-time prism since (by
definition) these allow only one spatial possibility during their duration. For example, the two
anchoring locations in Figure 2.2 could be the person’s home (which s/he can leave no earlier than
time ti) and work (where s/he must be no later than time tj). At some time during the time interval tij =
(tj− ti), the person must stop at some location to conduct an activity that will require at least a time
6 http://www.geog.utah.edu/~hmiller/papers/Activities_Space_Time.pdf. Accessed on 12.02.2009
space
space-time path
time
. .
ti
ti j
v
tj
a

14
units. Finally, the person can move with an average maximum velocity v. The interior of the prism is
the potential path space which shows the points in space and time that the person could occupy during
this travel episode. A person cannot participate in an activity unless its space-time path (reflecting its
location and time available) intersects the potential path space to a sufficient degree. Miller further
contends that the projection of the potential path space to geo-space provides the potential path area
i.e. all spatial locations that the person could occupy. A person cannot participate in an activity unless
its location falls within the potential path area (ignoring the temporal duration of activities).
Gatrell (2006) remarks that the Time Geographic concept has been critiqued, first, for
being reductionist i.e. humans are reduced to actors travelling paths to and from stations (or
locations) determined primarily by capability, coupling, and authority constraints. Second,
the method is intensive and requires a great deal of resources to effectively establish the time
geography of an individual, place or local culture, therefore the scale of analysis is highly
localised. Third, Time Geography became embedded within the larger structure and agency
debate of the late 1970s through the mid 1980s. Expectedly, Time Geography was critiqued
by humanists and structuralists alike as either too dependent on structure or too dependent on
agency, respectively.
One could, however, contest Gatrell’s (2006) second critique of the Time-Geography
framework. The method may have been intensive and required lot of resources in the past but
with modern-day GPS tracking technology, it is less laborious to generate time-space
diagrams. The GPS tracking technology records where and when an individual has been. The
data is then imported into 3-Dimensional lines for visualisation and subsequent generation of
the time-space diagrams. If a researcher cannot afford the ‘high-tech’ GPS technology,
perhaps a ‘low tech’ technology such as the traffic congestion registration form, as has been
used in this study, could be employed as well.
Again, in spite of the above criticisms and the apparent difficulty associated with its
application to real world problems, Miller (in press) acknowledges that a good number of
transportation geographic studies, such as Janelle et al. (1998); Kwan (1998); Miller (1999)
and Thill & Horowitz (1997a, 1997b) have made good use of the Time Geographic
framework. Special mention must, however, be made of the use of the Time Geographic
framework in recent GIS-Transportation studies i.e. the application and adaptation of GIS to
research, plan, and manage transportation. Wu & Miller (2001) have developed what they
call a dynamic potential path tree (DPPT), which is an improvement of the earlier network
time prism (NTP), to show variations in accessibility in space based on the individual’s

15
departure time in a network with discrete-time flow dynamics, in addition to studying
variation in traffic flow and congestion over time.
How is the Time Geographic framework of relevance to this study? For the purpose of
this study, ‘human activities’, as used as used by the proponents of the Time Geographic
framework, is replaced with ‘pilot BRT operations’. As the pilot BRTS buses plied their
time-space prism i.e. the Kimbu-Adenta highway, their operational success or otherwise is a
function of the various constraints. Capability constraints (e.g. availability and maintenance
of high capacity buses and other operational logistics, service quantity and quality, etc.),
authority constraints (e.g. availability of road infrastructure, traffic law enactment and
enforcement), and coupling constraints (e.g. unhealthy competition from trotro and taxi
operators, traffic congestion) are some of the potential factors that might have jointly
conspired to collapse the pilot BRTS in Accra.
2.3.2. Structuration Theory
According to Gregory (1994, p. 600), the structuration theory is seen as ‘an approach to
social theory concerned with the intersection between knowledgeable and capable social
agents and the wider social systems and structures in which they are implicated’ (emphasise
mine). Even though authors such as Bourdieu (1977), and Bhaskar (1979) had mentioned this
theory in their writings, it was the work of the British sociologist Anthony Giddens (1979;
1984) that popularised the theory and made the most profound impact in human geography
(Holt-Jensen, 1999, p. 124).
Structuration theory is based on the proposition that ‘structure is always both enabling
and constraining, in virtue of the inherent relation between structure and agency (and agency
and power)’ (Giddens 1984, p. 169). Moreover, the dualism between subject (the
knowledgeable human agent) and the object (society) has to be reconceptualised as a duality
– the duality of structure’ (ibid, p. xxi).
Structure, as used here, may be considered as rules and resources. Resources may be
of two kinds: authoritative resources, which derive from the coordination of the activity of
human agents, and allocative resources, which stem from control of material products or of
aspects of the material world” (ibid, p. xxxi).
He, therefore, draws attention to the fact that structure must be viewed as the
‘structuring properties allowing the binding of time-space in social system, the properties
which make it possible for discernibly similar social practices to exist across varying spans of

16
time and space and which lend them ‘systemic’ form’. Therefore, in his view, ‘those practises
which have the greatest time-space extension within such totalities can be referred to as
institutions’ (ibid, p. 17).
Institutions, by definition, are the more enduring features of social life (ibid, p. 24) or
as North (1993, p. 3) calls it, ‘the rules of the game in society or, more formally, are the
humanly devised constraints that shape human interaction’.
North (1993) identifies three kinds of institutions. These are political, which
mobilizes ‘authoritative resources’ in that it wields ‘the transformative capacity generating
command over persons or actors’. The second is economic, which controls ‘allocative
resources’, i.e. ‘capabilities or more accurately, forms of transformative capacity, generating
command over objects, goods or material phenomena’ (ibid, p. 33). The third and final is
legal institutions.
Constraints, as used by Giddens, also refer to the ‘limit which the physical capacities
of the human body, plus relevant features of the physical environment, place upon the
feasible options open to agents’ (ibid, p. 174)
The structuration theory has not gone without scathing criticism. For instance, John B.
Thompson, a close friend and colleague of Giddens at the Cambridge University, draws
attention to the ‘looseness’ of the latter’s explanation of structures as rules and resources and
argues that Giddens has not provided adequate account that will make it ‘useful and
satisfactory to identify social structure with rules (and resources)’ (Stones, 2005, p. 47;
Thompson, 1989, p. 64). Other critics, such as Archer (2004) and Parker (2000) believe that
‘the moment of structuration theory passed sometime ago. It still figures prominently in
routine social theoretical talk, but its force is only that of a tired conventional wisdom’ (cited
in Stones, 2005, p. 45). The main reason for such uneven fortunes of structuration theory ‘has
been the absence of any concerted and systematic attempt to respond to criticisms at the
theoretical level. The person one might expect to undertake this task, Anthony Giddens,
defied any such expectations’ Stones (2005, p. 2).
Be that as it may, this study finds some elements of the structuration theory quite
useful. I will, in the ensuing paragraphs, explain the relevance of employing the structuration
theory.
The supply of public transport is limited to a large degree by the existing structures or
resources available to the provider. The Metro Mass Transit Limited’s operation of an
‘express’ bus service in Accra could only take place on the existing infrastructure, the major
17
of which is roads, whose construction and maintenance is largely the function of the political
institutions of Ghana. Political institutions can undertake certain decisions that may enable
or constrain human interactions. In the early 1980’s, Ghana underwent series of structural
adjustments aimed at ‘improving the competitiveness and efficiency of the economy’ (Ellis,
2000, p. 164). Such adjustment is also typically taken to include attention to infrastructure,
both economic infrastructure (roads, railways, telecommunications, energy supplies) and
social infrastructure (health and education services) (ibid, 165).
Thus, the structuration theory illuminates on the research objective of identifying the
challenges of urban transport provision in general, and of particular interest, the factors that
culminate in the occurrence of traffic congestion in Accra and the extent to which the existing
transport structures enabled or constrained the operations of the former ‘BRTS’.
Even though the structuration theory is a sociological concept, Giddens’ (1984)
assertion that ‘there are no logical or methodological differences between human geography
and sociology’, (p. 368) and that the structuration theory ‘will not be of much value if it does
not help to illuminate problems of empirical research’ (p. xxix), provides further justification
for its usage in this study.
2.3.3. General Systems Theory
Hammond, (2002, p. 429) writes the history of systems theory by quoting West Churchman
that ‘it all began with four people: Bertalanffy, Boulding, Gerard and Rapoport who met in
1954 at the Stanford Center for Advanced Study in the Behavioral Sciences.’
She notes furthermore that one of the famous founders, Ludwig von Bertalanffy and
his three categories of systems thinking – technology, science, and philosophy – provide a
useful starting point for an analysis of the philosophical and ethical foundations of the
systems field (Hammond, 2005, p. 20).
As postulated by L. von Bertalanffy (1968), all things (as objects primarily but also as
ideas) have connections with many other things and the significance of any one depends on
its relationships with others. Hence, the unit of study should be not a single thing but a
system of interrelated objects or ideas (Chisholm, 1967, p. 45).
System is a group of elements organised such that each one is in some way
interdependent (either directly or indirectly) with every other element. In addition, it is
required that the systems have a function, goal or purpose (Johnston et al, 2000 p. 818).

18
Furthermore, studies of systems, according to Johnston et al. (2000), have always
tended to address four key issues. First, whether a system is closed (i.e. has no links to or
from a surrounding environment) or open (i.e. have and interact with the milieux). The latter
is more common in geographical inquiry. Second, whether the system can be divided into
subsystems, or clusters of interdependent elements which are only weakly-linked to the
remainder of the system. Third, whether the links involve flows, causal relationships or
‘black-box’ relationship (in which the consequence of the link is known but the causal factors
are not). Lastly, whether there is a feedback in the system such that change in x may stimulate
change in y, and this will in turn have an impact on x, either positive or negative. When there
is negative feedback, it means that there is disharmony between and among the various sub-
systems and this may lead to inefficiencies, or what Bertalanffy (1968) refer to as entropy or
disorder in the whole system.
However, the problem with the systems thinking is that systems may be embedded in
systems, and that what we choose to regard as an element at one level of analysis may itself
constitute a system at a lower level of analysis. However, these difficulties in the notion of
systems embedded within systems ad infinitum, according to Harvey (1969, p. 453), is an
attractive one.
In geography, the systems theoretical concept has found much relevance, especially in
the physical aspects of the discipline. Contemporary physical geographers have extensively
used the theory in researching on themes such as atmosphere, weather, climate,
biogeographic processes, soils, weathering, mass wasting and land forms (Christopherson,
2005; Pidwirny, 2006; Strahler & Strahler. 2003). The reason for its relevance to physical
geography might not be far-fetched especially when one considers the fact that the objects of
study and modus operandi of physical geographers are similar or almost the same as the
physical sciences from which the general systems theory first evolved.
However, the same cannot be said of human geographers. In fact since its introduction
into the discipline of geography by the British geographers, R. J. Chorley (1962) and P.
Haggett (1965), it has been said that the ‘applications of general systems theory principles
within human geography made few substantive achievements, however (the early work on
macrogeography was a partial exception), and few geographers now search for such
universals’ (Johnston et al., 2000, p. 293). Chisholm is even quoted to have described the
concept as ‘irrelevant distraction’ (ibid).
19
The reason for the lack of popularity of the general systems theory in human
geography may be that the concept was introduced during the Quantitative Revolution of the
discipline in the 1960s. Studies conducted during this era have been generally labelled as
positivistic in the sense that not only did the proponents seek to make generalised statements
about human spatial behaviours but they also attempted to incorporate physical laws directly
into a social science discipline like geography.
It needs to be mentioned also that this theory has received its share of criticisms by
renowned scholars, especially Giddens (1984), who for instance, criticises the theory for what
he refers to as its ‘empire-building endeavours’ by emphasising the pre-eminence of the
social whole over its individual parts. Also, in line with hermeneutic tradition, he regards the
social and natural sciences as radically discrepant.
Be that as it may, Chisholm’s (1967 p. 48) argument that ‘the General Systems
Theory seems to offer a means of unification through the discovery of principles that are
relevant to both physical and human geography’ and Bertalanffy’s (1968, p. 34) own
assertion that, ‘it seems, therefore, that a general theory of systems would be a useful tool,
providing, on the one hand, models that can be used in, and transferred to, different fields,
and safeguarding, on the other hand, from vague analogies which often have marred the
progress in these fields’ (emphasise mine), provide major sources of justification for the use
of this theory in this study.
This study does not seek to make generalisations. Neither does it seek to relive a futile
attempt to force physical laws into the social sciences but certain basic assumptions and
concepts of the general systems theory such as sub-systems, relationships and flow and
feedback are not only appealing, but it is also believed that they will help illuminate on the
factors that conspired to collapse the pilot BRTS in Accra. These are the justifications for the
choice of the General Systems Theory.
Transport geographers are concerned primarily with ‘the provision of transport
systems, the use of those systems for the movement of people and goods, and the relationship
between transport and other geographical phenomena’ (Johnston, 2000 p.855). Transport
systems, it is argued, ‘are complex and subject to continual change. Furthermore, there is no
simple definition of what constitutes a transport system. Much depends on the eye of the
beholder’ (Button & Hensher, 2001, p. 2). In analysing the urban transport system using the
general systems theory, three influencing key subsystems have been identified for the
purpose of this study. These are land use, transport supply and traffic.
20
Land use may be seen as the legal use of land, the type of structures and
socioeconomic activities. Transport supply, according to Jean-Paul et al. (2006), refers to the
capacity of transportation infrastructures and modes, generally over a geographically defined
transport system and for a specific period of time. Therefore, supply is expressed in terms of
infrastructures (capacity), services (frequency) and networks. The number of passengers,
volume (for liquids or containerized traffic), or mass (for freight) that can be transported per
unit of time and space are commonly used to quantify transport supply. According to Addo
(2002), traffic, the third subsystem, is a direct function of land use. Urban transport system is
seen as a sub-system which is an integral part of the much wider urban system.
As illustrated in Figure 2.3. below, traffic congestion in Accra, be it recurring due to
insufficient capacity, unrestrained demand and ineffective management of capacity (e.g. poor
signal timing); or non-recurring due to accidents, work zones, weather events etc.7, is a direct
function of land use, which is in turn shaped by national and local policies. Again, such
policies have direct bearing on transport supply which also influences the occurrence of
traffic congestion. All these sub-systems affect public transport services. The urban
environment acts as the wider system under which all these sub-systems exist and operate.
With the use of General Systems Theory, the linkages or relationships, flow and feedbacks
between and among the various sub-systems are illuminated. Besides, it will be useful for this
study, to assess the roles, responsibilities and dynamic interactions between and among the
various actors (e.g drivers, pedestrians, hawkers, the transport policy makers and legislators
such as the political administrators, traffic law enforcers e.g. the police) as parts of one whole
system in order to get the full picture as to some of the other possible factors that might have
conspired against the successful implementation of the pilot BRTS in Accra.
7 http://ops.fhwa.dot.gov/program_areas/reduce-non-cong.htm. Accessed on 07.05.2008

21
Figure 2.3. The Urban Transport System
THE URBAN ENVIRONMENT
Exhibits one-way relationship
Exhibits series relationship
Source: Authors’ own construct, 2009
PUBLIC
TRANSPORT
SERVICES e.g.
National& Local
policies
� Central
Government
� Municipalitie
s
� District
Assemblies
� Law
enforcement
agencies (e.g.
MTTU)
� Others
Transport Supply
� Private/Public
� Infrastructure
� Roads/railways
� Terminals/Stations/
Ports
� Pedestrian
walkways
� Bicycle lanes
� Signage & traffic
management
systems
� Others
Land Use
� Residential
� Commercial &
Services (e.g.
hawkers)
� Markets
� Recreation/Open
Space/Parks &
Gardens
� Industrial
� Transportation,
Communications
& Utilities
� Others
Traffic
� Recurring
congestion
� Non-recurring
congestion

22
2.4. Literature Review
2.4. 1. Introduction
Owing to its ubiquitous occurrence, especially in cities across the world, various academic
disciplines, such as geography, economics, planning, computer applications and engineering
have given tremendous attention to the subject of traffic congestion. The greater part of the
current literature, however, seems to be concentrated on issues like modelling traffic
dynamics (Chevallier et al., 2009); modelling traffic flow (Cho et al., 2009), and visual
based traffic monitoring system (Wang & Ruskin, 2002).
This chapter reviews other relevant literature that defines and characterises traffic
congestion as well as the impacts of the phenomenon. Special attention is also given to
existing literature on the bus rapid transit system.
2.4.2 Definition and Types of Traffic Congestion
It has been argued, and rightly so, that ‘traffic congestion presents a common if not inevitable
facet of traffic activity in a region, particularly in urban areas’ (Taylor et al., 2000, p. 267).
Although this phenomenon is human-induced and it is seen as an integral element in any
transport system all over the world, a unanimous definition has defied scholars.
A review of the several definitions reveals three basic recurrent themes. First of all,
congestion involves the imposition of additional costs on all users of a transport facility by
each user of that facility. Secondly, transport facilities (such as road links, intersections, lanes
and turning movements) have finite capacities to handle traffic, and congestion occurs when
the demand to use a facility approaches or exceeds the capacity. Finally, congestion occurs on
a regular, cyclic basis, reflecting the levels and scheduling of social and economic activities
in a given area. This may be properly termed as recurring congestion. On the other side of
the coin, special episodes of congestion may occur at different points in a network due to
irregular incidents, such as road works, breakdowns or accidents. This may also be referred
to as non-recurring congestion (Taylor, 1992; Taylor et al., 2000). Following this review, a
more comprehensive definition which has gained acceptance for use in traffic studies is that
of Taylor (1999). He notes:
traffic congestion is the phenomenon of increased disruption of traffic movement
on an element of the transport system, observed in terms of delays and queuing,
that is generated by the interactions amongst the flow units in a traffic stream or in

23
intersecting traffic streams. The phenomenon is most visible when the level of
demand for movement approaches or exceeds the present capacity of the element
and the best indicator of the occurrence of congestion is the presence of queues
(Taylor et al., 2000, p. 269).
One other theme worth mentioning is that traffic congestion is dynamic and thus, varies
spatio-temporally, that is to say, it varies with space and time.
2.4.3. Why Does Traffic Congestion Occur?
Palma & Lindsey (2002) note that the occurrence of congestion in all transportation facilities
may be accounted for by three features that characterise travel demand and supply. The
reasons are that demand varies over time, supply is relatively fixed over long time periods
and output is not storable.
Expatiating further, these authors note that travel demand varies significantly with
time. For instance, systematic daily and weekly variations in travel demand are informed by
work and school schedules, and by the operating hours of businesses, shopping, and
entertainment establishments. Also, annual fluctuations in travel demand are affected by the
timing and length of school holidays and religious festivals, by sporting event schedules, and
by the seasonal nature of outdoor recreational activities. Other social activities such as
sporting meets, fairs, and other ‘special events’, may as well cause travel demand to fluctuate.
While demand has been noted to be variable, transportation supply, on the other hand, is
static.
Transportation supply consists of infrastructure and mobile plant. The authors note
that whereas infrastructure generally has a longer life span, involves lots of capital, thus,
making it very costly and time-consuming to alter, mobile plant, on the other hand, comes in
smaller and cheaper units than infrastructure, and has a shorter lifetime, but it still lasts much
longer than the time scale of demand fluctuations. The scope to alter the supply of vehicle
services is limited by the mobility of the plant itself and by the degree to which differences
between regions and traveller groups in the timing of peak demands can be exploited.
Coupled with the above, they note that output is not storable in the sense that a
traveller or freight shipment must be present to be transported. Thus, like other services such

24
as haircuts and concerts, but unlike commodities such as grain and steel, production cannot
be stored to smooth imbalances between supply and demand.
Simply put, as a direct function of demand fluctuations, rigid supply and the
impossibility of storage, the utilization rate of transportation facilities varies over time.
Variations in utilization are magnified by intermittent reductions in capacity due to accidents,
strikes, bad weather and so on. Because land is scarce and capacity is expensive, it would be
prohibitively expensive to build enough capacity to prevent congestion at all times, hence, the
occurrence and perpetuation of traffic congestion in the transport system.
2.4.4. Procedures Involved in Measurement of Traffic Congestion
A lot of literature abound that proposes several techniques that may be employed in studying
and quantifying congestion (Francois and Willis, 1995; Schwartz et al., 1995; Lomax et al.,
1997). According to a review conducted by Lomax et al. (1997), these techniques could be
generally classified under highway capacity manual (HCM) measures; queuing-related
measures; and travel time-based measures respectively.
Of these three, the travel time-based measures are the commonly used methods in
studying travel time, travel speed and delay. This is because they are easy to understand by
both professionals and the travelling public. Also their flexibility makes it easy to describe
traffic conditions at various levels of resolutions in both space and time. Not surprisingly, it is
said that, ‘an increasing number of transportation agencies are switching to travel time
measures to monitor and manage congestion’ (Quiroga, 2000, p. 290.). The only major
disadvantage is ‘budgetary limitation which usually imposes severe restrictions on the
number and coverage of travel time studies’ (ibid.). This particular reason is, perhaps, among
the several reasons why this technique was adopted and adapted for use in this study.
There are two main sets of travel time data collection techniques. These are roadside
and vehicle techniques respectively. The former includes license plate matching and
automatic vehicle identification (AVI). The latter i.e. vehicle techniques, are based on the use
of detection devices carried inside the vehicle. Examples of these techniques include the
traditional stopwatch and clipboard technique as well as the automatic vehicle location
(AVL) technique. It is said that in ‘the stopwatch and clipboard technique, the travel time
and passage of specific landmarks are manually recorded along the route’ (ibid, p. 294).
Following their extensive studies in three metropolitan areas in Louisiana: Baton
Rouge, Shreveport and New Orleans where over 180,000 segment travel time and speed

25
records were generated between 1995 and 1996 from close to three million GPS data points,
Quiroga and Bullock (1998) propose the need to compute representative speed values by
aggregating the data at the segment level first. This approach enabled them to reduce the huge
volumes of data and made it possible to produce simplified reports out of them. They then
proceeded to devise several equations that could be used to aggregate the data. One of such
equations which calculate the average travel time per segment is stated thus:
Where mi is the number of runs (or sample size) per segment; Li is the length of each segment
and uij is the jth speed record associated with segment i (ibid. p. 110).
However, this equation measures only the harmonic mean, which by definition, is
very sensitive to individual values which are much lower than the rest in the series. As a
result, these authors note that outlying low speeds, which usually are the case on a typically
adverse traffic conditions, could result in very small average speeds.
In order to avoid this situation, their conclusion is that the median segment travel
times should be calculated instead. It is argued by Duncan, 1986 (cited in Quiroga & Bullock
(1998) that ‘the median is known for not being seriously affected by others and in many cases
it is preferred by statisticians as a measurement of central tendency’. Indeed, it is argued that
‘a high median speed represents average traffic condition much better than a low harmonic
mean speed’ (Ibid, p.124).
2.4.5 The Geography and Characteristics of BRTS
Basically, the IEA (2002) identifies a Bus Rapid Transit System (BRTS) as a system that
emphasises priority for rapid movement of buses by securing segregated bus ways. Wright
(2002) notes that the BRTS may also be referred to as ‘high-capacity bus systems’; ‘high-
quality bus systems’; ‘metro-bus’ or ‘express bus systems’.
It is argued that BRTS in South America started in Curitiba (Brazil) and have now
become widespread in the region including Bogota (Columbia), and Quito (Ecuador). In
North America, a number of cities have begun to develop BRTS, including Ottawa (Canada),
Pittsburgh, Los Angeles, and Honolulu (the United States). In Oceania, Brisbane and

26
Adelaide (Australia) have BRTS. In Europe, BRTS are becoming increasingly common in
cities in the United Kingdom, including Leeds, London, Reading, and Ipswich. Cities in Asia
have started to introduce BRTS, such as the systems in Nagoya (Japan), Taipei (China),
Jakarta (Indonesia), and Seoul (Korea). Introductions of BRTS are being considered in
Beijing (China), Bangkok (Thailand), Delhi, Pune, Hyderabad (India), and Dhaka
(Bangladesh) (see Fjellstrom 2003a; 2003b; IEA, 2002, ITDP, 2003; Wright 2002). In Africa,
Lagos (Nigeria) has a functioning BRTS and Cape Town (South Africa) is constructing a
BRTS which is set to kick off in March, 2010.8
A very well planned BRTS not only have high capacities to carry passengers in a
comfortable, rapid, and secure manner, but can also provide low-cost public transport
alternatives. It is documented that the use of large capacity bi-articulated buses, for instance,
could result in flow rates of 22 000 passengers per hour (in each direction) in Curitiba
(Brazil) (Jefferson, 1996; Webb, 1993).
A recent study conducted by the Federal Transit Administration has also revealed that
Bogota’s Transmilenio, New York’s Lincoln Tunnel XBL, and the Sao Paolo BRTS, for
instance, could individually have peak capacities of at least 25,000 passengers per hour. Also,
systems in Curitiba (Brazil) and Ottawa (Canada) carry up to 15,000 passengers per hour.9
Given the ubiquitous distribution of the BRTS, it can be difficult to pinpoint exactly which
specifications a particular system must possess in order to be called as a ‘proper’ BRTS.
However, after extensive studies, the Bus Rapid Transit Policy Center of the Breakthrough
Technologies Institute, which is an independent, Washington DC-based think-tank, has
identified seven major components of a BRTS. These are:
(1) Dedicated Right of Way. BRTS vehicles usually operate in their own right-of-way
(ROW), thus greatly increasing speed and reducing travel time. Unlike rail, this ROW can be
shared with emergency vehicles, providing congestion-free travel for public safety, or with
other high occupancy vehicles (HOV’s).Where appropriate, BRTS vehicles can leave the
dedicated ROW to take passengers directly to their destination. This avoids the need for
feeder bus systems, driving, or other options to reach an individual’s final destination. While
off from the dedicated ROW, BRTS vehicles can use special technologies to keep traffic
lights green as the vehicle approaches, thus minimizing red light delays.
8 http://www.capetown.gov.za/EN/IRT/Pages/default.aspx. Accessed on 13.02.2009
9 http://www.gobrt.org/ Accessed on 13.02.2009
27
(2) Stations: BRTS stations are convenient and easily accessible. They can range from
enhanced bus shelters to complete subway-like facilities. This flexibility in station design
enables communities to invest in the stations that are right for them. Stations may include
parking, shops, bicycle and pedestrian access. Stations also may include amenities that
provide customers with a better transit experience, such as passenger information signs and
“next vehicle” displays and announcements.
Good station design normally includes “passing lanes” that enable BRTS vehicles to
get around docked vehicles. This enables express service and increases travel speeds. Good
station design also includes a passenger platform that is level with the door of the BRTS
vehicle. This enables passengers to directly board the vehicle without steps or other obstacles,
and thus reduces the waiting time the vehicle must be in the station.
(3) Vehicles: There are many vehicles available for BRTS service. Generally, these
vehicles are easy to board, comfortable to ride, and quiet. They also use clean fuel
technologies, protecting the local environment. Some vehicles look and feel like light rail and
have the option of using overhead power, but they are not limited to that power or to tracks.
Other vehicles look more like traditional buses, but are easier to board and have no diesel
exhaust. The most advanced vehicles offer optical or magnetic guidance, enhancing safety
and allowing the vehicle to pull within inches of the platform, just like a subway. BRTS
vehicles also include low floors and multiple, double-wide doors. This makes boarding easy
and convenient, even for disabled persons. Some vehicles include on-board information
systems, telling passengers where they are and when they can expect to reach their
destination. Vehicle capacities vary greatly depending on the size and design of the vehicle.
Double and triple-section “articulated” vehicles can carry 150 or more passengers, providing
ample capacity for peak rush hour demand.
(4) Fare Collection: Like rail systems, BRTS fares can be collected before entering
the platform. This is important, because the longer the vehicle spends in the station, the
longer the total trip time. Where a city also has a rail system, the same fare collection
technology can be used, enabling passengers to use a single fare card or token system.
(5) Service: BRTS provides high frequency service throughout the day, eliminating
the need to consult a trip schedule. BRTS also provides the unique ability to offer a
combination of express and local service. Depending upon demand, vehicles can stop at all
stations, some stations, or no stations between their origin and destination.
28
(6) Route Structure: The BRTS system’s flexibility makes it possible to design
systems that offer more passengers the option of a no-transfer, one-seat ride to their
destination. Multiple BRTS routes can be implemented, offering the community a thicker
network of rapid transit routes. Moreover, these routes can go into neighbourhoods and office
parks, thus bringing transit to the people, rather than forcing people to get to a rail station by
driving or via feeder bus systems. Once passengers are delivered to these “off-line” stations,
the BRTS vehicle can return to its dedicated ROW. The route structure is usually presented in
easy to read format, eliminating the need to follow complicated bus maps. This makes the
system more attractive to a greater number of customers, thus enhancing ridership.
(7) Intelligent Transportation Systems (ITS): BRTS uses ITS systems to track vehicle
locations, control traffic signals, update passengers on travel times, and perform other
important functions. These technologies can provide “next vehicle” displays, announce
arrivals and departures, ensure better traffic flow, and enhance safety and security on the
vehicle and in the station. Some ITS technologies are in fixed locations, such as at the station
or on board the vehicle. Through digital wireless, however, next bus and other information
can be transmitted to a customer’s cell phone.
2.4.6 Arguments For and Against BRTS
Given the fact the one of the characteristics of the BRTS vehicles is to manipulate the traffic
signage mechanism to suit their operations, it is reasonable to expect that other vehicle types
that also depend on the traffic signage system could be in serious traffic congestion. In effect,
the BRTS does not actually deal with the congestion problem.
However, in view of the numerous positive characteristics of the BRTS, for instance, the use
of high occupancy vehicles to move people en masse, a lot of vehicles would have been taken
from the roads than if all of these passengers had driven their own cars, and therefore, one
could safely conclude that the BRTS initiative does indeed tackle traffic congestion in a very
significant manner.
Again, in their study about the positive impacts of the BRTS, Wohrnscimmel et al.
(2008) noted that exposures to gaseous air pollutants and elemental carbon were by far the
highest for commuters who use private and low-capacity public transport vehicles as against
those who use high capacity public transport vehicles like a BRTS.

29
CHAPTER THREE: RESEARCH METHODOLOGY
3.1 Introduction
Seen as ‘the process of enquiry and discovery’ (Kitchin & Tate, 2000, p.1), research has also
been defined as ‘knowledge production, seeking answers to questions through inquiry’
(Mikkelsen, 2005, p. 135). Usually, research proceeds along a methodology, which in the
words of Kitchin & Tate (2000, p. 6), may be described as ‘a coherent set of rules and
procedures which can be used to investigate a phenomenon or situation (within the
framework dictated by epistemological and ontological ideas)’.
Thus, research methodology may be described as including all the scientific
procedures a researcher adopt to generate, analyse, interpret and present data. The adoption
and rationale of a particular methodological approach is usually a function of the research’s
theoretical framework or construct. In the words of Warf (2006, p. 486), methodology is ‘a
meso-level theoretical construct that allows researchers to translate their epistemological and
ontological assumptions into data’.
This chapter involves discussions on the research methodological approach used in
this study. Sub-topics that will be discussed include: sources of primary and secondary data,
research instruments used, strengths and weaknesses of the methodological approaches
employed, challenges faced in this study, reliability and validity of the data as well as the
techniques of data analysis and presentation.
3.2 Sources of Primary Data
In the generation of primary data for this study, which took place during the months of June,
July and August of 2008, both quantitative and qualitative methods were employed.
Quantitative methods have been defined as ‘the use of mathematical techniques,
theorems and proofs in understanding geographical forms and relations. Two main types of
application exist: statistical methods, which are employed in generating and testing
hypotheses using empirical data, and pure mathematical modelling, which is employed when
deriving formal models from a set of initial abstract assumptions. The two types come
together in calibration: statistical methods are used to estimate, and test the significance of,
various parameters associated with a given mathematical model’ (Johnston et al., 2000, p.
663).

30
Qualitative methods ‘are concerned with how the world is viewed, experienced and
constructed by social actors. They provide access to the motives, aspirations and power
relationships that account for how places, people and events are made and represented’ (ibid.
p.660). These methods represent what Cloke et al. (1992) have aptly described as ‘the
peopling of human geography’ (ibid).
3.3 Quantitative Versus Qualitative Sources of Data Generation
Quantitative data, according to Kitchin and Tate (2000, p. 40) are ‘generally structured and
the data consists of numbers or empirical facts that can easily be ‘quantified’ and analysed
using numeric (statistical) techniques’. Quantitative methods, we are told, measure objective
facts and focus on variables. Reliability is their key. They are value free and in most
instances, independent of context. The quantitative approaches deal with many cases or
subjects and rely heavily on statistical analysis. The added strength is that the researcher is
detached (Mikkelsen, 2005; Neuman, 2003).
Qualitative data, on the other hand, are ‘generally unstructured and consists of words,
pictures and sounds’ (Kitchin & Tate, 2000, p. 40). It has been argued that the qualitative
methods have the advantages of being able to effectively construct social reality or cultural
meaning and focuses on interactive process or event. Also, authenticity is their hallmark and
values are present and explicit. They are situationally constrained and their main focus is on
thematic analyses. However, in contrast with quantitative data, the qualitative tradition
usually deals with few cases or subjects and the researcher is involved (Mikkelsen, 2005;
Neuman, 2003).
Controversies have raged over which research method is appropriate. At the risk of
over-generalization, quantitative methods have been identified with positivism. Propounded
by Comte (1798-1857) in response to the ‘negative philosophy’ during pre-revolution France,
positivists argue that ‘by carefully and objectively collecting data regarding social
phenomena, we can determine laws to predict and explain human behaviour in terms of cause
and effect. Like empiricists, positivists reject normative and metaphysical (relating to being)
questions that cannot be measured scientifically’ (Kitchin & Tate, 2000, p.8). The major
point of departure from empiricism, however, is that positivism ‘requires propositions to be
verified (logical positivism) or hypothesis falsified (critical rationalism) rather than simply
presenting findings’ (ibid).

31
Among the several criticisms levelled against positivism, Gregory (1986) notes that
the first is its empiricist position by the seeming underestimation of the ‘complex relationship
between theory and observation’. Also, positivism has been criticised for its exclusivity by
assuming that ‘methods of the natural sciences can be effectively used to explain social
phenomena’, thus, failing to ‘recognise that spatial patterns and processes are bound up in
economic, social and political structures’ (Cloke et al, 1992; Kitchin & Tate, 2000, p.8).
Lastly, positivist’s insistence on scientific research being autonomous, value-free, neutral and
objective has been rejected. This autonomy argument ‘creates a false sense of objectivity by
artificially separating the observer from the observed’ (ibid). Added to the above, it is argued
that quantitative methods, like any specialized language, ‘are very useful in answering some
questions but not all questions’ (Pratt, 1989; cited in Johnston et al, 2000, p. 664).
By being situationally-constrained and dealing with only a few cases or subjects, a
major weakness associated with the qualitative methods is the inability to make universal
conclusions. Also, reliability—‘the ability of a measure to produce consistent results’
(Rudestam & Newton, 1992, p. 67)—is hard to obtain. Moreover, with the observer being
involved in the observed, there is the inherent disadvantage of researcher bias. It must be
pointed out, however, that this problem of researcher bias is not limited only to the qualitative
methods but to the so-called ‘value-free’ quantitative methods as well.
Therefore, it is argued that ‘both qualitative and quantitative approaches have their
strengths and weaknesses. Neither one is markedly superior to the other...in many studies you
need to combine both the qualitative and quantitative approaches’ (Kumar, 1996, p. 12). A
further argument is made that ‘research which combines different qualitative methods and
exploits the complementarity of qualitative and quantitative findings looks poised to gain a
new respectability within the discipline’ (Johnston et al, 2000, p. 664).
Referred to as ‘triangulation’ by social scientists, a combination of both quantitative
and qualitative methods is said to enable researchers ‘have a more critical attitude towards the
mechanistic use of quantitative methods and a more relaxed attitude to the use of qualitative
methods; allow flexibility and improvisations in choice of practical methods, i.e., iteration
between data and partial results; the people researched are seen as subjects rather than objects
and are often involved in the research process’ (Mikkelsen, 2005, p. 144). Furthermore, the
triangulation approach, as is adopted in this study, is to enable me gather evidence from
multiple sources to address my research questions from different points of view. The added
advantage is that the research work is broadened and its validity strengthened (Baker, 1990).

32
While conceding that the distinction between the qualitative and quantitative methods
is good in that it provides an avenue to discuss differences in methodologies, I am of the
opinion, just as a good number of scholars, that the division should only be seen as artificial
and that the two approaches need to be seen ‘as a continuum rather than polar opposites’
(Kitchin & Tate, 2000, p.40). After all, it is said that ‘there is no law that states that
qualitative and quantitative methods have to be used in isolation from each other’
(Mikkelsen, 2005, p. 40) and that ‘if modelling is not accompanied by qualitative analysis,
complex but nevertheless comprehensible social forms may be reduced to...‘contentless
abstractions’ which are easy to manipulate but difficult to interpret’ (Sayer, 1992, p. 201).
Also, my choice of the triangulation method is to be able to understand the ‘interpretation and
meaning that people give to events they experience’ (Polkinghorne 1991, p. 112; Rudestam &
Newton, 1992, p.31).
GIS-based techniques were the main research tool employed in generating the
quantitative data for this study. Against this backdrop, it is salient to reiterate my awareness
of the over-generalised critique against the quantitative methods as being closely associated
with positivism. Thus, if a study, like this one, employs statistical methods and/or GIS, it is
too often wrongly labelled as being positivistic. Readers must take note that even though it
has been demonstrated that GIS has antecedents in cartography and quantitative methods, an
argument is put forward that ‘there is an inchoate but emphatic sense, among researchers, that
GIS extends quantitative techniques’ (Schuurman, 2004, p. 7). In actual fact, Fotheringham et
al. (2000, p. 234) have traced the metamorphosis in the geneology of GIS and they conclude
that ‘we have witnessed the progression from models whose only justification was an
empirical regularity and an analogy to gravitational attraction; to models derived from either
non-behavioural or aspatial theories imported from other disciplines; and finally to models
based on principles of spatial information processing, sub-optimality, hierarchical decision
making and spatial cognition. Current research lies in consolidating and improving this latest
framework’.
Again, it is believed that ‘GIS has re-established the importance of intuition and
simplicity of exploration over those very hard-core confirmatory hypothesis-testing
techniques’ (Schuurman, 2004, p.112). These authors provide ample justification for the use
of the GIS-based techniques for the quantitative data generation.

33
In order to identify the other potential factors that led to the collapse of the pilot
BRTS, in-depth interviews with key informants; focus group discussion and participatory
observation were the used as research tools for the generation of qualitative primary data.
3.4 Research Tools Employed in Primary Data Generation
3.4.1. GIS-based Techniques
In the view of Affum & Taylor (1999), the temporal and spatial distribution of congestion in
a region is important, and the use of GIS software for database integration, data analysis and
data display is most advantageous. Basically, GIS is seen by Thill (2000, p.4) as a ‘computer-
based systems for the capture, storage, manipulation, display and analysis of geographic
information’. Indeed, GIS technology is able to integrate common database operations such
as query and statistical analysis with the unique visualization and geographic analysis
benefits offered by maps (Derekenaris et al., 2001; ESRI, 2009; Franklin, 1992; Muller,
1993). Also, GIS ‘presents geographers with ways to visualize spatial arrangements and, in
the process, restore intuition as a valid heuristic technique’ (Schuurman, 2004, p. 112). In
recent times, transportation experts have found the benefit of using the GIS as a powerful tool
in their work. According to Thill (2000, p. 4), it is now common to come across the acronym
GIS-T which simply refers to ‘the application and adaptation of GIS to researching, planning,
and management in transportation’.
In compliance with the suggestion by Taylor et al. (2000) that ‘rigorous spatial
analysis using GIS is only possible when the appropriate map databases are available’,
existing spatial data comprising the road network of Accra was obtained from the Centre for
Remote Sensing and Geographic Information Services (CERSGIS) of the University of
Ghana and the Ghana Geological Survey Department respectively. With these geographic
data and with the use of the ArcGIS 9.3 software, a base vector map with links to a database
was made by the author.
Using the Global Positioning System (GPS), which is a satellite-based navigation
system consisting of a network of 24 satellites placed into orbit by the U.S. Department of
Defence, and which until the 1980s was primarily the preserve of the military, the locational
coordinates of all bus stops designated for the pilot BRTS, from Kimbu to Adenta, were

34
manually picked and recorded in a log book. This was done with the use of the high-
sensitivity, WAAS-enabled eTrex Vista HCx GPS receiver.10
These GPS points were co-referenced with the existing spatial data on Accra. The
actual exercise to map the geography of traffic congestion on the selected corridor then
followed. This was done by adopting and adapting to the traditional stopwatch and clipboard
technique as suggested in the literature by Quiroga (2000, p. 294) that ‘the travel time and
passage of specific landmarks are manually recorded along the route’.
In this study, I made use of the traditional stopwatch and traffic congestion
registration form technique (see Appendix 1 Traffic Congestion Registration Form). This
digitally formatted form was used to measure travel time on the Kimbu-Adenta highway by
recording the time an MMT bus departed from a particular stop to the next stop. This process
continued for the entire duration of the journey. This process was repeated many times and
with different bus drivers in order to avoid the danger of being unduly influenced by the
driver’s driving style (Taylor et al., 2000). As a general rule of thumb, it is suggested that in
‘order to overcome the sampling problem, each route should be driven at least 15 times with
different drivers each time’, even though ‘this is seldom a practical proposition, and may
introduce its own inaccuracies’ (ibid, p.264).
Taking into the consideration the fact that traffic congestion varied spatio-temporally,
the data was captured during the ‘rush hour’ periods, i.e. morning and evening peaks as well
as the afternoon off-peak periods. Working only during the weekdays, i.e. Monday to Friday
and making six trips daily, a total number of 120 trips were made.
3.4.2. Interviews with Key Informants and a Discussion11
As part of the methods for generating qualitative data for this study, in-depth interviews were
conducted on operators of the former pilot BRTS and policy makers in charge of public
transportation in Accra, in addition to a transportation expert at the University of Ghana.
In the words of Kvale (1996, p. xvii), interviews are ‘conversations where the
outcome is a co-production of the interviewer and the subject’. Indeed, it is ‘an inter view, an
inter change of views between two persons conversing about a theme of mutual interest’
(ibid, p. 2)
10
For further information, visit http://www8.garmin.com/aboutGPS/waas.html 11
See Appendixes 2-4. For Question or interview guides.

35
In order to obtain special knowledge about the operations of the Metro Mass Transit Limited,
in general, and specifically on the pilot BRTS, the General Manager of the company was
interviewed for a little above one hour, due to intermittent distractions from telephone calls
and workers who needed one form of assistance or the other from him. The interview was
done with the use of a flexible checklist or guide. This interview guide outlined the topics and
issues to be covered. However, the sequential arrangement of the questions was occasionally
ignored in order to follow the responses I received from the informant. According to Patton
(2002), by adopting such an approach, the comprehensiveness of the data is increased. Also,
the data collection is made somewhat systematic for each respondent and logical gaps in data
can be anticipated and closed. Lastly, the interviews remain fairly conversational and
situational. However, this approach is limited in that important and salient topics may be
inadvertently omitted. Also, interviewer flexibility in sequencing and wording questions can
result in substantially different responses from different perspectives, thus reducing the
comparability of responses (ibid).
The Deputy Managing Director of the company was also interviewed via telephone
due to time constraints. This approach was necessitated by the fact that even though the
responses from the first key informant was generally helpful, he was ignorant about some
specific facts about the pilot BRTS since he had not assumed office by then. The interview
with the Deputy went smoothly and most salient points were clarified for the study, even
though a face-to-face encounter, rather than a phone conversation, would have been ideal.
Owing to the huge financial costs involved in making telephone calls, this was the only
telephone interview I could arrange and it lasted for less than thirty minutes. Consequently,
the telephone interview was not as in-depth as I had wanted it to be.
On the other side of the coin, three MMT drivers who have been working on the
Kimbu to Adenta corridor before, during and after the pilot BRTS were accosted and
interviewed as well. The selection of these interviewees was based on the discretion of the
author, on the basis of the criteria mentioned above and with the use of the judgemental or
purposive sampling technique. While admitting that this sampling approach is seriously
flawed in that it is subjective and that ‘individuals may be selected on the basis of the sort of
responses they are likely to give, and the responses the interviewer is looking for’ (Kitchin &
Tate, 2000, p. 54), this exercise was meant to solicit information from the drivers who were
actually on the ground and implemented the service. The interviews were done in the MMT
buses as they waited at the main bus stations to be filled to capacity with passengers before

36
taking off. Even though this approach to data generation proved quite helpful, the
comprehensiveness or otherwise of each interview was a function of the time it took for the
buses to be full, an average of fifteen minutes.
In order to present the views of the end users of the now defunct pilot BRTS, three
passengers –a man and two women –who were on-board the MMT buses plying the Kimbu-
Adenta corridor and who had been using the bus service since 2005 when the pilot BRTS was
introduced were accosted and engaged in a focus group discussion with the question guide as
above. These passengers were among the first to board the buses and also met the above
criterion. They were interviewed until the buses were full to capacity and was about to depart,
a procedure which lasted for an average of fifteen minutes. The sampling technique for
selecting the participants and the associated weaknesses are the same as noted above.
For the purpose of this study, key players in charge of making and implementing
government transportation policies in Ghana were interviewed as well. These key informants
include: the Deputy Director (Planning and Development) at the Department of Urban Roads,
and a senior team member at the Urban Transport Project office, all of the Ministry of
Transportation (Roads). These informants provided useful and insightful details for the
study.
Lastly, a professor and expert in transportation geography at the University of Ghana
was also interviewed as a key informant for this study. This interview lasted for close to one
hour. These key informants, just like the management of the company, have special
knowledge on the given topic but according to Mikkelsen (2005), they are not necessarily the
‘leaders’ and readers must be aware that there is also the risk of being misled by the key
informants’ sometimes biased information.
3.4.3. Participant Observation
Participant observation was done simultaneously with the traffic congestion data collection
exercise. Also referred to as ethnography and field studies, participant observation involves
‘the researcher participating directly in the setting, if not also the activities, in order to collect
data in a systematic manner’ (Brewer, 2000, p. 6; cited in Silverman, 2006a, p. 69).
Providing a justification for this method of data generation, it is said that ‘all social
research is a form of participant observation, because we cannot study the social world
without being part of it’ (ibid).

37
With the use of a field notebook, pens, pencils and a photo camera, I acted as a
passenger on-board the Kimbu-Adenta bound MMT buses to observe at first hand, the nature
of service provided on this corridor. This method of data generation was meant to
identify where, when and why traffic congestion occurs on the said corridor and how it
negatively conspired, with other potential factors, to collapse the express transit system. This
also afforded me the opportunity to verify the data obtained from the key informants.
3.5. Secondary Sources of Data
Secondary sources of data can be seen as already existing data. According to Johnston et al.
(2000), this sort of data set is used for research projects other than that for which it was
originally collected. Data set such as censuses may be stored in computer data bases, on the
internet or housed in archives from where they are made available to other researchers. This
further use of the data, it is argued, ‘allows for both efficiency in data collection and the
conduct of comparative studies (across space and time) that otherwise will be impossible’
(ibid, p. 730.). The added advantage is that it enables the researcher to have a basis for
corroborating upon or filling in the gaps in existing knowledge. However, it may be difficult
for a researcher to adopt and adapt to some secondary data since they might either be
irrelevant or unsuitable to a particular topic of research interest.
Secondary sources of data for this study were obtained from books and journals, in
the libraries and on the internet, especially the Transportation Research Part C; official
reports such as census data from the Ghana Statistical Service data base and newsletters of
the Metro Mass Transit Limited.
3.6. Challenges Faced in this Study
This study had some challenges, particularly during the primary data generation.
First, since this study was conducted in a post pilot BRTS scenario, the travel time
data generated via the traffic congestion registration form may not represent the true account
of how the situation was during pilot BRTS era. This is because during the pilot BRTS
period, the ‘express’ buses were only supposed to stop at their designated terminals. Even
though the same fleet of buses and possibly the same drivers were used for generating the
data in this study, the current service is such that the drivers may stop at any point on the
corridor to pick up and/or allow passengers to disembark, in addition to stopping at their

38
designated terminals. This challenge obviously lengthens the total travel time. However, there
were instances when some drivers did not stop at the designated bus stops or elsewhere on the
corridor due to the fact that no passenger was embarking or disembarking.
Second, unlike the pilot BRTS which operated on the basis of ‘one-passenger-one-
seat’, there was serious overcrowding in the buses, especially during the evening peak hours
when passengers clamoured for any available space in the bus in order to get home. This was
the culture of stress I encountered during the whole month of making 120 uninterrupted
travels. Such stress affected my health and I had to seek the help of two research assistants
from the University of Ghana to share the load with. While this approach was of immense
help in the conduct of this study, it may compromise the quality or reliability of the final data
if something went wrong with the assistants’ generation of data. We usually held series of
peer reviews to assess each other’s work and to re-strategise as the work progressed. I also
made sure that they all complied with the same coding principle. For instance, they were to
ensure that the number of data entries corresponded exactly with the available space provided
on the traffic congestion registration form. Lastly, each one of them was given extra forms
that could be used in the event that an error occurred in the data entry. These checks and
balances, it is believed, will greatly reduce the level of errors in the data generation.
Finally, all of my key informants, with the exception of the Deputy Managing
Director of the Metro Mass Transit Limited, proved extremely useful and devoted much of
their time to being interviewed, thus, enhancing the quality of the data. This key informant
was one of the key architects of the pilot BRTS. Not only was he involved in the hatching of
the concept, but he was also actively involved in the implementation of the pilot project.
Obviously, the contributions of such an individual would have been invaluable to this study.
However, try as I did to meet him for a face-to-face in-depth interview, it could never
materialised on grounds that he was extremely busy. Realising that I had limited time, all I
could do was to have a brief interview on the cell phone during one weekend with him. Given
the fact that most of the information he gave only corroborated upon that which had already
been given by the General Manager and that there were no other top level individuals in the
managerial position to be interviewed further, the data could be said to be generally accurate,
informative and reliable as well.

39
3.7. Validity, Reliability and Limitations of this Study
All good scientific research work aims at producing knowledge which is not only valid but
reliable as well. This study is no exception to that ideal. Rudestam & Newton (1992) have
defined reliability to mean the ability of a measure to produce consistent results. Validity, on
the other hand, indicates that a measure in fact measures what it purports to measure. In
other words, validity ‘concerns the soundness, legitimacy and relevance of a research theory
and its investigation’ while reliability may refer to ‘the repeatability or consistency of a
finding’ (Kitchin & Tate, 2000, p. 34). These two themes of validity and reliability are of
much relevance to qualitative-based studies as they are for quantitative-based studies
(Silverman, 1993b; Kitchin & Tate, 2000).
According to Rudestam & Newton (1992, p.74), limitations may refer ‘to restrictions
in the study over which you have no control’. The note-worthy limitations for this study were
especially related to the data generation.
For instance, the use of the qualitative research instruments, i.e. the interviews and the
participation observation in this study, behoves on me as a researcher to be more reflexive.
Reflexivity requires an awareness of the researcher's contribution to the
construction of meanings throughout the research process, and an
acknowledgment of the impossibility of remaining ‘outside of’ one's subject
matter while conducting research. Reflexivity then, urges us ‘to explore the
ways in which a researcher's involvement with a particular study influences,
acts upon and informs such research (Nightingale & Cromby, 1999; p. 228
cited in Ryan, 2005, p. 3).
Expatiating further, it is said that:
the concepts of reflexivity may be a way of bringing qualitative methods to
account for themselves in a way that goes to satisfy the demands of scientific
method. This is generally a matter of questioning how the processes of
research and analysis have an effect on research outcomes. This whole process
of self-examination has become known as ‘reflexivity’ (May, 1998; cited in
Ryan (2005, p. 3)
Concerning the use of the key informant interviews, I am aware of the risk of being misled by
key informants’ sometimes biased information (Mikkelsen, 2005). My position as a
researcher and a student gives me some power but my power may not be equal to that of my
informants, who are qualified professionals. There is the tendency on the part of the

40
management of the bus company, for instance, to speak only the politically correct language
and to polish up their own mistakes while exaggerating on other information as to why the
pilot BRTS collapsed. This unequal power relation might affect the quality of data to be
derived from the interview. Dowling (2000) suggests the identification and efficient
negotiation of such power relations. Perhaps the use of the checklist in the interviews helped
to create the necessary rapport that enabled the best possible responses to be obtained in spite
of the unequal power relations.
As much as possible, the purpose of the research was explained in detail to the
informants and their informed consent was sought before commencing with the interviews.
All these procedures were deliberately followed to assure the respondents of utmost
confidentiality, and in some cases, anonymity where it was so desired. This was to ensure that
the respondents will, out of their own volition, provide the right and reliable kind of
information for this study.
The quality and trustworthiness of data from the participatory observation may also be
affected by my own subjectivity. This is because I am familiar with the phenomenon under
investigation and there is the likelihood of my inability to completely detach my personal
views, opinions and prejudices in my capacity as a researcher and user of public transport on
the congested corridors of Accra.
The travel time data were recorded using minutes as the unit of measure. However,
due to high speeds at some of the less congested segments of the Kimbu-Adenta highway, the
total journey duration (i.e. the difference between the times of departing from the origin of a
segment to its point of exit, marked by the bus stops) recorded zero. In order to avoid
discrepancies in the data caused by the division of travel time by zero, when speeds were
high, I substituted zero with 0.75. This means that any segment run that took less than a
minute to cover was estimated to have taken three quarters of a minute or fourty five seconds.
Lastly, Quiroga (2000, p. 291) suggests that even though GIS packages can be used to
provide estimates of distance, ‘it is clear that the accuracy of these estimates depends on the
accuracy of the underlying digital base map’. The GIS data, notably the road network of
Accra, that was used in composing the base map in this study can be said to be out of date
with very recent changes due to construction and/or upgrading of the road network. A case in
point which readers should be aware of is that during the era of the pilot BRTS, the bus
drivers had to go round the Tetteh Quarshie Roundabout (refer Figure 4.1). By the time of
conducting the field work, however, the Roundabout had been reconstructed to an

41
interchange whereby the drivers have to drive straight through without having to make the
detour. This means that the total journey duration for that particular segment alone has been
shortened than it used to be hitherto. The rest of the spatial data represent accurately the road
network in Accra. Also, very recent GIS or spatial data are either unavailable or expensive to
obtain; hence, the decision to use the existing GIS data anyway.
With the exception of these limitations faced in this study, majority of which have
been addressed and tackled, the data used in this study can be said to be of relatively high
validity and reliability.
3.8. Techniques for Data Analysis and Presentations of Findings
Using the appropriate analytic technique, the field data was analyzed both quantitatively and
qualitatively. Concerning the quantitative data, the ReadSoft DOCUMENTS software was
used to scan and digitally retrieve the travel times as recorded on the Traffic Congestion
Registration form. This was then corrected for errors and exported into the Statistical Package
for the Social Scientist (SPSS) 15.0 software for further analyses. Analyses done include
calculating the median, mean and cumulative travel times for each segment of the highway
used in the study. The SPSS was also used to compose a bar chart representing the median
segment speed for the various days of the week (see Figure 6.4). With the use of Microsoft
Office Excel 2007 software, the data are also presented in a tabular format. In order to present
the data in a thematic map form, which is said to be typical in traditional time travel studies
(Quiroga, 1998), the ARCGIS 9.3 software was used to prepare the base map, out of which
the corridor of interest was selected. Again, it was possible to import the median travel times
from the Excel format to enrich the geographic database out of which the colour coded
thematic maps, as used in this study, were composed (see Figures 6.1-6.3).
With regards to the qualitative data, the information generated from the in-depth
interviews, the focus group discussion and from my own observations is presented by the use
of quotations and transcriptions. As noted earlier on, the qualitative data is meant to assist me
provide an interpretation and meaning of the quantitative data.

42
CHAPTER FOUR: THE STUDY AREA
4.1. Location and Size
Located at 5°33' North and 0°13' West and bounded by the Gulf of Guinea in the south, the
University of Ghana in the north, Tema Township in the east and by Korlee Lagoon in the
west is Accra, Ghana’s largest administrative and economic capital. Out of what used to be
the three townships of James Town, Christianborg and Ussher Town in the 1870s and
covering an area of less than 10 km2 (Yankson & Grant, 2003), Accra’s current size has
grown considerably.
Accra is found in the Greater Accra Region, the smallest of the 10 administrative
regions of Ghana, in terms of area, occupying a total land surface of 3,245 square kilometres
or 1.4 % of the total land area of Ghana. The political administration of the region, as in all
other regions in Ghana, is through the local government system. According to Article 35 (d)
of the Constitution of Ghana, the state is obliged ‘to take appropriate measures to ensure
decentralisation in administrative and financial machinery of government and to give
opportunities to people to participate in decision-making at every level in national life and
government’. The Constitution further provides for a minimum of 5 per cent of national
revenues to be paid to district assemblies for development purposes. Other significant
legislation supporting decentralisation includes the Local Government Act of 1993 (which
creates the district level structures and defines their functions), and the District Assemblies
Common Fund, 1993 (which provides the parameters for sharing of the recycled revenues).
The principal local government unit is called the District, with these being separately defined
in relation to their population. Depending on population size, we have the metropolitan
assemblies (population above 250,000), municipal assemblies (population above 95,000), and
district assemblies covering rural and urban communities over wider geographical areas in
Ghana (IBIS Transport Consultants Ltd, 2005).
Therefore, in the greater Accra conurbation, all the three classes are represented.
These are the Accra Metropolitan Area (AMA), with a total land size of 200 square
kilometres and 57 % of the total population of the city; Tema Municipal Area (TMA) which
has 17 % of the total population and the Ga District Area (GDA) with 26 % of the city
population. The Ga District has recently been split in two, recognizing its population growth
as a result of overspill from the metropolis (ibid).
43
Of the administrative regions, AMA is the most completely urbanized and largely constitutes
the city of Accra. However, broader definitions of Accra also exist and by current Local
Government Act, the Greater Accra Region now constitutes AMA, TMA, Ga East, Ga West,
Dangme West and Dangme East districts. However, other recently constituted districts
including the Ashaiman, Ledzekuku-Krowor, Weija and Adenta municipalities respectively
have been added.12 Dangme East is the least populated with a little above 3 % of the
population of Accra.
Particular attention has been given to explaining these political administrative bodies
in the city of Accra for the reason that whereas the provision of the road infrastructure is
essentially the work of the central government, public transport regulation is the sole
responsibility of the districts within which a particular transport service is found. In relation
to the focus of this study, i.e. the former pilot BRTS, the road network that was selected for
the project is mostly found within the administrative domain of the AMA. However, it
stretches along the Ga district and the Adenta municipality respectively. See Figure 4.1
below.
12
http://www.ghanadistricts.com/region/?r=1&sa=21&PHPSESSID=d58fb86d0 Accessed on 31.08.2008

44

45
4.2. Topography and Climate
Accra is characterised by low physical relief as the Precambrian rock system that underlies
most of the nation has been worn down by erosion almost to a plain.13 There are several
gently undulating slopes rising to a height of less than approximately 23 metres above sea
level.
Given the fact that Ghana is located only a few degrees north of the equator, the
climate is tropical. The only seasonal changes are the two distinct wet and dry seasons.
According to the Meteorological Services Department, two main rainy seasons occur in the
whole coastal plain, where Accra is located, with the principal reaching its maximum in May
and June and the subsidiary in October. The average annual rainfall is about 730mm which
falls primarily during the two rainy seasons. Rain is rarely prolonged and the average
duration of rain is between 2 and 3 hours. Rain persisting for over 12 hours is very
uncommon. In the dry months, rain is likely to fall on less than 10 hours in a month and even
in the wet seasons, the average total duration of rain is only about 30 to 40 hours in a month.
Variations in intensity of rainfall are considerable and rates of 203 mm per hour may be
reached and even exceeded for short periods.14 Short but heavy downpours in Accra usually
give rise to local flooding where drainage channels are obstructed. At times, portions of road
network may be washed away, potholes may be created in the middle of roads, or rain eroded
sand may accumulate usually along the sides of the roads. On such days, the average travel
speeds are reduced, thereby, creating very severe traffic congestion.
Ghana’s warm and humid climate has an annual mean temperature between 26 and 29
°C. Variations in the principal elements of temperature, rainfall, and humidity that govern the
climate are influenced by the movement and interaction of the dry tropical continental air
mass, the dry, dusty harmattan, which blows from the northeast across the Sahara. The
harmattan season usually begins from November to late March or April.
In Accra, as in most parts of the country, there is very little variation in temperature
throughout the year. The mean monthly temperature ranges from 24.7° in August (the
13
http://www.visitandlearn.co.uk/LocationFactfiles/Ghana/Economy/tabid/383/Default.aspx Accessed on 31.08.2008. 14
http://www.meteo.gov.gh/climatology.html downloaded 31.08.2008. Accessed on 31.08.2008.

46
coolest) to 28° in March (the hottest) with annual average of 26.8°. Figure 4.2 presents an
illustration of the average weather condition (i.e. rain, average maximum daily temperature
and average minimum temperature) for Accra.15
Figure 4.2 Average Weather Conditions in Accra
When temperatures are high, especially in the afternoon, commercial drivers in particular find
it unbearable to queue gently in the slowly moving traffic. Some of them resort to driving on
the shoulders of the road for a while but their attempt to force their way back into the main
traffic flow further exacerbate the traffic congestion situation in the city.
15
http://www.bbc.co.uk/weather/world/city_guides/results.shtml?tt=TT000240 (BBC weather homepage).
downloaded 31.08.2008

47
4.3. Demographic characteristics of the Study Area
Demographic features, such as population size, density and growth, sex and age structure as
well as distribution, are considered as important parameters that must be taken into
consideration in transportation studies and analysis, especially on the effects of these factors
on the incidence of traffic congestion.
4.3.1. Population size and growth
Accra, Ghana’s capital since 1877 is reputed to be among the most populated and fast
growing Metropolis of Africa with an annual growth rate of 3.36 %. With the second largest
population after the Ashanti region, the Greater Accra regional share of the total population
of Ghana has progressively soared from a little above 7 % in 1960 to about 15.4 % in 2000.
Due largely to the rapid industrialisation and expansion in the manufacturing and
commercial sectors in some major areas within the metropolis in the period between 1960
and 1970, there was the influx of migrants into Accra, largely from the Eastern Region in
view its proximity to and cultural links with, the Greater Accra Region. Beside this, there was
also a large migration from the Volta, Central and Ashanti Regions respectively in that order,
resulting in high population growth rate between 1960-1970 intercensal years.
The reverse is observed in the 1970-1984 intercensal years, when due to the acute
stagnation of the Ghanaian economy during the 1970’s, the growth rate of Accra’s population
took a nosedive. Again, the decline in agriculture in the agrarian communities in Ghana;
industrialisation in the region, coupled with the late 1980s and 1990s boom in the service
sector, the migratory flow into Accra resumed. A summary of demographic statistics of
Accra is presented in tabular form below:
Table 4.1 Demographic Characteristics of Accra
Characteristics 1960 1970 1984 2000 2002**
Population 338,396 636,667 969,195 1,658,937 1,801,606
Growth rate - 6.32% 7.51% 4.3% 4.3%
Source: Computed from 1960, 1970, 1984 and 2000 Population and Housing Censuses. **indicates Projected16.
It must be acknowledged that the census population figures above do not show the daily
generation of people into Accra. It is estimated that the city accommodates between 2.5
16
http://www.ghanadistricts.com/region/?r=1&sa=21&PHPSESSID=d58fb86d0 downloaded 31.08.2008

48
million to 3 million people in terms of socio-economic activities aside the residential
dimension captured by the 2000 National Population Census.
4.3.2. Population density
The region has remained the most densely populated region in the country since 1960.
Population density has increased from 151.6 in 1960 to 895.5 in 2000. The intercensal growth
rate of 4.4 % between 1984 and 2000 is much in excess of the national average of 2.7 % per
annum and implies a doubling time of 16 years. This is, in part, a result of migratory
movements to the region. The densely populated nature of the region is brought into sharp
focus when it is compared with the other regions. Table 4.2 compares the Greater Accra
region with the country as a whole as well as with the Northern region, by far the largest in
terms of land area but the smallest in terms of population size.
Table 4.2. Comparative Characteristics of the Greater Accra Region
Area (Sq.km) Population Density Growth Rate(%)
Greater Accra 3.245 2,905,726 895.5 4.4
Northern Region 70.384 1,820,806 25.9 2.8
Total Country 238,533 18,912,079 79.3 2.7
Source: 2000 Population and Housing Census, GSS17
4.3.3. Age and Sex Structure
The region’s age structure is still a youthful one with the proportion of persons under 15
years varying from 31.6 % in AMA to about 42 % in Dangme East, while that of the aged (65
years and older) ranges from 3 % in the Ga District to a little above 8 % in Dangme East.
The male population has grown from 261,547 in 1960 to 1,436,135 in 2000. The
corresponding female figures are 230,270 in 1960 and 1,469,591 in 2000. During the period
1960-2000, the female population grew much faster than the male population. According to
official sources, the factors responsible for the excess females in 2000 may include male out-
migration, female in-migration and higher male mortality. The seemingly severe economic
conditions of the 1980s and 1990s might have compelled relatively more male emigration.18
The primacy of the Accra as an administrative, educational, industrial and commercial centre
17
http://www.statsghana.gov.gh/docfiles/Ghana%20in%20Figures.pdf. Accessed on 31.08.2008.
18
http://www.ghanadistricts.com/region/?r=1&sa=21&PHPSESSID=d58fb86d0 Accessed on 31.08.2008
49
in attracting people from all over Ghana, continues to be the major force for rapid population
growth, with migration contributing to over 35% of the population increase. Until quite
recently when Accra has seen marked improvements with regards to the expansion of the
existing road infrastructure as well the construction of new ones, the traffic congestion
situation was most severe. The need to cater for the travelling needs of the teeming
population was nowhere near the available infrastructure. With human and vehicle population
soaring while the road infrastructure remained virtually constant, traffic congestion results.
Again, the dense population, especially during Christmas holidays when more people come to
the city to shop, could spill into the roads, causing vehicular movement to grind to a halt.

50
CHAPTER FIVE: PUBLIC TRANSPORTATION SERVICES AND
TRAFFIC CONGESTION IN ACCRA
5.1. Introduction
This author believes that the factors that led to the collapse of the express bus service on the
Kimbu-Adenta highway represent a microcosm of the overall factors that affect public
transport provision in general in Accra. As such, a discussion on the broader context within
which the pilot BRTS operated before its demise will be most ideal.
This chapter, therefore, takes a look at the public transport system as well as the
phenomenon of traffic congestion in the city of Accra. Sub-themes that will be considered
include an overview of the regulatory framework for public transport, the road network and
the types of public transport services provided in the city. Also, the incidence and the causes
of traffic congestion are discussed as well.
5.2. The Transport Sector
Generally, the Ghanaian transport system has been dominated by the road sector, even though
other modes such as air, rail, in-land water and marine are equally important. A recent survey
conducted by the National Road Safety Commission (2008) suggests that about 22 million
passengers are moved by road whilst a total of about 122 million tons of freight is moved per
annum19.
So important is this sector that the ministry of government responsible solely for the
planning, construction and maintenance of roads and highways of Ghana has been labelled
the ‘Ministry of Transportation’. To the outsider, this might create the impression that
transportation in the whole of Ghana is only about the road sector. The Ministry of
Transportation works through several Departments and Agencies.
These have been categorised as the Road Infrastructure Sub-Sector and may include
the Ghana Highway Authority (responsible for the administration, development and
maintenance of trunk roads and related facilities in the country); Department of Feeder Roads
(provision of access to rural communities and centres of socio-economic activities through
rural roads) and the Department of Urban Roads (responsible for administration, development
and maintenance of urban roads and related facilities).
19
http://nrsc.gov.gh/publications/doc/COMMERCIAL%20DRIVER%20STUDY.pdf. Accessed on 02.02.09.

51
The second group is the Road Transport Services and Safety Sub-Sector and may include
the Driver Vehicle and Licensing Authority (DVLA), the National Road Safety Commission
(NRSC) and the Metro Mass Transit Limited (MMT).
The last group is the Road Transport Training which includes the Government
Technical Training Centre (GTTC) and the Koforidua Training Center (KTC).
All these agencies and departments work together to ensure that Ghana becomes the
transport hub of West Africa20.Note again, the emphasis placed on road transport as the main
conduit for showcasing the country in the sub-region. It is therefore logical to conclude that
urban transport in Accra, the nation’s capital, ‘is synonymous with road transport’ (Addo,
2002, p.1).
5.3. The Road Network of Accra
Addo (2002) and Tamakloe (1993) are of the opinion that the road network in and around the
city of Accra is based on a system of radial routes converging on the Central Business
District. A major weakness in the network, as identified by these authors, is the lack of
adequate east-west corridors. It is said that the lack of a good road system causes a country’s
‘wheels of development [to be] mired in mud’ (Ellison 2002). As such, the relevant
government authority is undertaking infrastructural developments in the transport sector with
the hope that this identified weakness may be resolved in the near future. The Department of
Urban Roads notes for instance, that the designs for 106 km of arterial roads, 60 km of local
roads and 3 Interchanges have been completed for the Accra East corridor and the first 2.7
km of the proposed 15 km main arterial link to the west of Accra has been built already.21
Presently, however, there are only four radials, three of which are heavily used and
experience considerable traffic congestion. Following extensive studies on these arteries,
Segbefia (2000, cited in Addo, 2002) notes that flows of vehicles per minute ranged from 10
to 14 in morning peak hours and 8 to 12 in evening peak hours.
The road network of Accra, on the whole, is generally fairly extensive. According to
the Statistical and Analytical Report (2000-2006) issued by the Ministry of Transportation
20
http://www.mrt.gov.gh/pages.asp?page_Id=49&expandable=0 Downloaded on 02.02.09.
21
Status of Key On-going Programs (December 2007) http://www.mrt.gov.gh/userfiles//Document1.pdf. Accessed on 02.02.09.

52
and the Ghana Statistical Service, the Greater Accra Region has the highest road network size
of 5,123 km. The Ga District has the longest urban roads and sections of earth roads, about
2,070 km and 1,711 km respectively. Accra Metropolitan Area has the longest length of
asphaltic concrete roads, about 151 km. Earth roads constituted about 48 % of the network as
at the end of 2006. Compared with the national averages, the Ga District and Accra
Metropolitan Area have the highest share of the total national urban road network with 21%
and 19 % respectively followed by Tema with 12 %.
In addition to the above, Addo (2002) identifies what is considered as local roads
whose primary function is to provide access to residential areas. In his opinion, the structure
of the road network in Accra, as a whole, is however weakened by the haphazard location and
management of most terminal and transit points. Most often, residential areas are developed
without any consideration of public transport terminals. This unfortunate situation is a direct
consequence of lack of discipline and strict compliance with laid down planning principles. It
is not uncommon to identify terminals that are built either near streets or on privately owned
land, which inhibits the development of permanent structures. Hence, it is estimated that
whereas about 56 % of all terminals are between 1,000 and 3,000 square metres in size, only
5 % are of the size above 12,000 square metres. This unfortunate situation comes against
realisation that there is a positive correlation between the size of a terminal and the number of
vehicles handled within the hour (Addo, 2002; Oppong, 2000).
5.4. Evolution of Accra’s Present Urban Transport System
Within the above described environment, Accra’s present urban transport system has evolved
over the years from one that was characterised by a well planned and managed public
transport system that operated with big, comfortable, safe, regular and reliable buses, and
which enjoyed state monopoly, to the current transport system which is dominated by
individual operators.
The three state-owned bus companies that operated in Accra were the State Transport
Corporation (STC), Omnibus Services Authority (OSA) and City Express Service (CES).
However, it must be pointed out that the STC has no mandate to provide urban bus services.
Rather, it is responsible for providing inter-urban services, principally between regional
capitals, but also serving other large urban centres as well as cities in neighbouring countries.
OSA was constituted in 1969, under the then Ministry of Local Government, to provide

53
services previously provided by municipalities. In 1972 OSA was further empowered to
operate in any other areas prescribed by the then Commissioner for Local Government. Until
recently, OSA operated mainly country-wide urban-rural services.
CES was formed in 1981, as a special Department within the then Ministry of Transport and
Communications, following the delivery of 600 new Tata buses. They also operated urban-
rural services but, like OSA, made only a very small contribution to urban transport. Urban
mileage for CES in January 1992 was less than 10 % of total (Fouracre et al., 1994).
Against the backdrop of rising losses, overwhelming operating difficulties, and stiff
competition from the private sector, OSA had had to withdraw its services to the public.
Under Ghana’s Economic Recovery Programme (ERP) in the early eighties, the state
divested itself of its public investment in bus operations. The responsibility of running bus
services in cities like Accra was therefore relinquished to the private sector. This era marks
the genesis of the famous ‘trotros’ of Ghana which have become the mainstay of Ghana's
current public transport system.
Fouracre et al. (1994) argue that during this era, the growth in vehicle numbers
exceeded population growth over the same period. The majority of these vehicles (over 80 %
in 1991) are concentrated in the main urban centres. The high growth in vehicle numbers
between 1984 and 1991 seems to coincide with the ERP. Public transport accounts for just
over 80 % of total motorized trips in Accra. The majority of these trips are by trotros or
minibuses (48 %), with taxis and big buses carrying 23 and 11 % respectively (ibid).
Trotros are based on a range of vehicle types, but have commonality in their purpose
and mode of operation. In more recent times, the trotros have been augmented by purpose-
built mini-buses, due to the ban on their use for long distance journeys. Ofosu-Dorte (1992,
cited in Fouracre et al 1994) notes that due to a 1989 restriction imposed on all minibuses (up
to 23 seats) to limit their operations to routes of 50 km and below, an estimated 10,800
minibuses had been switched to urban operations. Also, saloon-cars are now used as shared
taxis. Taxis have a legal seating capacity of four passengers, while the trotros and minibus
seating capacity range in size from 12 to 30 seats. On basis of this, the available seats on offer
in Accra are about 720 per 10, 000 population. This would seem high, but must be offset
against a daily vehicle output which is probably quite low i.e. under 150 km (Fouracre et al.,
1994). All trotros, including mini-buses and shared taxis, are owned by the private sector.
There are no market entry limitations but a major hallmark of this sector is the presence of
very powerful and influential owner and driver unions.

54
According to the Ministry of Transportation and Ghana Statistical Service (2006),
there are currently twenty three identified public transport operators. These operators all
belong to one recognised umbrella union, called the Ghana Road Transport Co-ordinating
Council (GRTCC). However, the total number of operators, as mentioned above, could be
challenged. As observed in Table 5.1 below, only 22 operators are mentioned.
Table 5.1 GRTCC Membership
Number Name Acronym
1 INTERCITY STC COACHES COMPANY LIMITED STC
2 GHANA PRIVATE ROAD TRANSPORT UNION GPRTU
3 CONCERN TRANSPORT UNION CONCERN
4 ASSOCIATION OF LIBERAL TRANSPORT OPERATORS ALTOPS
5 GHANA NATIONAL CARGO TRANSPORT ASSOCIATION GNCTA
6 COMMERCIAL DRIVERS ASSOCIATION CDA
7 POSITIVE TRANSPORT UNION PTU
8 UNITY TRANSPORT UNION UNITY
9 EXPRESS DRIVE TRANSPORT AWOTWE
10 GHANA COACHES OWNERS ASSOCIATION GHACOA
11 GHANA CO-OPERATIVE TRANSPORT ASSOCIATION GCTA
12 GREAT IMPERIAL TRANSPORT IMPERIAL
13 GHANA HAULAGE TRANSPORT DRIVERS ASSOCIATION GHTDA
14 PROGRESSIVE TRANSPORT DRIVERS ASSOCIATION PROTOA
15 GHANA ROAD HAULAGE ASSOCIATION GRHA
16 PERGAH TRANSPORT SERVICE PERGAH
17 REDEEMER TRANSPORT SERVICE REDEEMER
18 LABOUR ENTERPRISE LET
19 KINGDOM TRANSPORT SERVICE KTS
20 TRANSCITY EXPRESS CITY EXPRESS
21 AGATE TRANSPORT SERVICE AGATE
22 MIGHTY TRANSPORT UNION MIGHTY
Source: Ministry of Transportation and Ghana Statistical Service (2006) Fouracre et al. (1994) contend that some of the unions have derived their power through the
patronage of earlier governments which encouraged their organization and development.
Their power is exerted through control of the terminals from which services are operated.
Without access to a terminal, independent operators have limited opportunities to generate
custom. Through their control of the terminals (which are referred to as lorry parks), the
unions have effective quantity control of the public transport sector and hence control of
service quality. From experience, passengers have learned that there is little prospect of

55
boarding a vehicle other than at the terminals which have thus become the main foci of
passenger demand. Since the financial rewards inherent in the control of lorry parks are high,
rivalries have developed between and even within unions. Monopoly access to its lorry parks
is jealously guarded by each union branch.
The ownership of all terminals rests with the Municipal Assemblies, who have firm
and unambiguous statutory powers to establish, maintain and control parks and terminal
facilities. However, management is assigned to the unions and the bus companies. Terminals
are usually shared by both taxis and minibuses. Each terminal consists of a number of parks.
According to a recent survey of one hundred and fifty-six minibus and taxi parks, spread over
33 terminals (95 % of the total in Accra) by TDP Consult, GPRTU, the largest of the unions,
administered 128 (82 %) while GCTA administered the rest.
Owing to the operational procedures of ‘queuing and holding’ at the terminals, unions
would rather compete for the terminals instead of the routes. According to this practise,
vehicles are ‘held’ at terminals and not released until they are full to capacity. This practice is
specified by the union constitution and violations of the queuing principle are a serious
offence, even though, a report released by the TDP Consult (cited in Fouracre et al, 1994)
suggests that some union officials use their privileged position to ‘jump’ the strict queuing
principle. Occasionally, some vehicles are also sent out empty, or as it is referred to in local
parlance, ‘waa-waa’, in order to service en-route passengers, but few drivers would volunteer
for this duty. This system ensures full loads for each driver, but relies for its success (to the
drivers) on the absence of competing groups.
Quite clearly, urban transport system is an urban issue and must be seen as an integral
part of the general urban planning and development. ‘Many cities throughout the world
organize their own transport policy and development, usually with a measure of supervision
by the relevant Urban Affairs Ministry, who control the budget. While this approach provides
the best hope for integrated urban planning, it depends critically for success on two
components: the creation of a professional cadre of urban transport planners (in both local
and central government administrations) which can command status and the availability of
staff that are qualified to establish and maintain the cadre. Neither of these two requirements
presently exists in Ghana, and is unlikely to exist for some time’ (Fouracre et al., 1994 p. 48).
Without any proper transport policy enforcement by the relevant government
authorities, the services of the private transport operators in Accra leave much to be desired.
For instance, Addo (2002) contends that the transport unions have not been able to regulate

56
effectively driver behaviour. As such, drivers and their aides could therefore be discourteous
to passengers and other road users knowing very well that severe sanctions are rarely applied
even when reports are made to the executive members of the unions. Again commercial
vehicle drivers even flout some of the Road Traffic Regulations such as driving on the
shoulders of the road to avoid the slow pace in the mainstream of traffic; stopping abruptly in
the middle of moving vehicular traffic to drop and pick passengers, and sometimes even
jumping red traffic light signals, probably due to the insufficient number of police personnel
in the city. Oppong (2000, cited in Addo, 2002) argues further that the absences of well
designed and properly located bus stops, as well as insufficient and inadequate terminals are
factors that also promote driver misconduct. The road network structure and orientation as
well as the disjointed location and distribution of terminals make it difficult for public
transport users to make uninterrupted journeys. Often, more than 80 % of public transport
users need to make two or more legs before getting to their final destinations (Oppong, 2000).
Consequently, many passengers are prepared to pay more for a better service by using
shared taxis which may charge two or three times the bus fare (Addo,2002) even though the
fact remains that the more than 30,000 taxis add very substantially to serious congestion and
pollution in Accra (Armstrong-Wright, 1989; Fouracre et al., 1994).
The Metro Mass Transit (MMT) has been added to the public transport services provided in
Accra in recent years.
5.5. Traffic Congestion in Accra
A recent urban transport study in major cities in Ghana conducted by the Dutch company
DHV Netherlands, with assistance from the Municipal Development Collaborative Limited of
Ghana, suggests that more than 70 % of major roads in Accra and Kumasi (the second largest
city) are congested with travel speed recording lower than 20 km/hr and it is likely to get
worse if current trends are maintained (Ghana Institution of Engineers (GhIE), 2008).
5.5.1. Causes of Traffic Congestion in Accra
Traffic congestion all over the world is a function of human activity. At a one-day conference
on ‘Traffic Congestion in Major Urban Cities in Ghana’ held at Accra on February 21, 2008
by the GhIE, seasoned engineers from all over the country took turns to address the problem

57
of traffic congestion. Some of their views, which I personally share, are presented and
discussed.
The first obvious cause of traffic congestion in Accra is the alarming rate at which
vehicles are growing in the capital city. As at 2004, a total number of 181,000 vehicles had
been registered in Accra. According to projections, this figure could rise above one million
by 2024 (ibid.) One may argue that the desire for car ownership is a reflection of people’s
improved standards of living. Under Ghana’s current Growth and Poverty Reduction
Strategy, the government’s thematic priorities include: macroeconomic stability; private
sector competitiveness; human resource development; and good governance and civic
responsibility. Sound macro-economic management along with high prices for gold and
cocoa helped sustain GDP real growth rate of 6.3 % in 2008 (CIA’s World Fact Book,
2009).22 In addition, with an expected boom to the Ghanaian economy from the oil industry
by 2010, people’s purchasing power is expected to improve, especially those in the middle
working class. Consequently, vehicular population might even exceed the projected figure for
Accra.
Some may counter argue, and rightly so, that in many countries, including Ghana’s
neighbour Nigeria, the discovery of oil has not always resulted in a general improvement in
people’s living standard except for the few elite in the society. This is referred to by Auty
(1993) as the ‘resource curse’ – the paradox that the local population do not benefit from the
oil wealth, but instead tend to have less economic growth and in addition suffer from the
environmental costs of harnessing the resource for the world market. However, by
strengthening Ghana’s democratic and accountability processes and thereby avoiding
corruption and governmental mismanagement of resources, it is expected that the benefits of
the discovered oil will improve the lot of the citizenry which will in turn reflect on their
vehicle ownership patterns.
The argument put forward by Olswewski & Turner (1993) explains the point which
has just been made regarding the relationship among economic well-being, vehicle ownership
and traffic congestion. According to them ‘economic growth and increased affluence leads to
a growth in vehicle ownership which in turn usually produces the unwelcome effects of urban
traffic congestion and major environmental problems’ ( ibid., p. 355). Although conceding
that the above assertion may be true, Dargay et al. (2007) are of the view that the relationship
between vehicle ownership and income levels is neither linear nor one-to-one. In fact, by 22
https://www.cia.gov/library/publications/the-world-factbook/geos/gh.html#Econ. Accessed on 10.01.2009

58
pooling annual data over the period 1960-2002 from the USA, Germany, Japan and South
Korea, these authors suggest an S-shaped relationship. Vehicle ownership grows relatively
slowly at the lowest levels of per-capita income, then about twice as fast as income at middle-
income levels (from $3,000 to $10,000 per capita), and finally, about as fast at higher income
levels, before reaching its maximum level (‘saturation’) at the highest levels of income.
Against the back drop of vehicle increase, Accra suffers from inadequate road
infrastructure capacity, the second factor that is believed to account for traffic congestion in
the city. Addressing the said GhIE conference, Kwablah (2008) noted that most of the arterial
routes in the city have some missing links or in very poor condition, thereby increasing the
overall travel time on most of parts of the network. Also, ongoing road infrastructure
development to widen the existing road network, and the development of interchanges jointly
account for massive traffic congestion in the city.
Moreover, inefficient use of the existing road capacity has been identified as a third
and major contributory cause of traffic congestion (ibid). In this chapter, I have already
discussed the nature of Accra’s urban transport system. As such, that will not be the focus of
further discussion but one obvious characteristic of the system that needs to be mentioned
again is the over-reliance on the use of low carrying-capacity trotro vehicles. Available
figures indicate that in 2004, 1.3 million passengers commuted the Central Business District
of Accra on a daily basis. Out of this figure, 1 million used trotro or taxi. By 2024, an
estimated 3.04 million passenger trips/day will enter or leave the CBD (GhIE, 2008). While
majority of the trotros are old and badly maintained, their carrying capacities are between 12-
15 and 22-33 passengers. The legal carrying capacity for taxis is 4 passengers. According to
Kwablah (2008), whereas trotros and taxis carry 52 % and 9 % respectively of the travelling
public, they use 27 % and 18 % road space. Another mode of transport which carries few
people i.e. 13 % but uses maximum road space (33 %) is private cars. The rest of the statistics
are presented in Figures 5.1 and 5.2.
Figure 5.1 Percentages of Road
space Usage per Transport
Mode in Accra (Source: GhIE,
2008).
Legend

59
Figure 5. 2. Percentages of Passengers
Carried per Transport Mode in Accra.
(Source: GhIE, 2008).
The land use and traffic nexus as observed in Accra could also account for the endemic traffic
congestion in the city. Addo (2002) notes that the attainment of a vibrant and comfortable
city life is a function of land use, transport, cultural values and the imagination and
management skills of city officials. However, owing largely to the unplanned nature of
Ghanaian cities, of which Accra is no exception, coupled with weak local governance and an
urban economy which is primarily trading-oriented, the various land use types such as
residential, commercial, industrial, recreational, educational, sanitary etc are haphazardly
developed. The plates below, obtained from the GhIE (2008), illustrate some of the land use
and traffic patterns which either cause or perpetuate the incidence of traffic congestion in
Accra.
Plate 5.1 Transport terminal on road shoulder Plate 5.2 Commerce compete for space with vehicles
(Traders erect umbrellas to provide shade!)
Legend

60
The over-concentration of economic activities in Accra, especially at the Central Business
District is symptomatic of planning failure. Also, Tema’s failure as a twin city with no viable
central business and magnetic commercial centre has worsened traffic congestion in Accra
(Tackie, GhIE, 2008). The spontaneity with which passenger terminals develop and their
ubiquitous distribution in wrong locations also generate avoidable traffic.
As if these are not enough, road reservations are abused with impunity especially for
commercial activities by residents of Accra.
Plate 5.3 Blocking of the Walkway with Adverts. Plate 5.4. Driving on shoulder of road further
(Source: ibid.) compounds traffic congestion (Source: ibid.)
61
CHAPTER SIX: RESULTS AND DISCUSSIONS
6.1. Introduction
This chapter presents the results from the fieldwork undertaken for the purpose of this study.
Discussions of the findings are also presented. An overview of the Metro Mass Transit
Limited, the operators of the former express service; the characteristics of the pilot BRTS,
traffic congestion on the Kimbu-Adenta highway as well as the other potential factors that
might have conspired to collapse the pilot BRTS are some of the key themes that will be
explored in this chapter.
6.2.1. The Metro Mass Transit: Brief History and Ownership
In order to salvage the situation and prevent further worsening of the afore mentioned
challenges to public transportation in the city, i.e. the domination of the Ghanaian public
transport scene by the single operator services, and the negative externalities such as traffic
congestion and the associated pollution, the current transport policy of the government of
Ghana has been to establish what is believed to be ‘an efficiently and modally
complementary and integrated transport network for the movement of people and goods at
least cost throughout the country’ (Kwakye & Fouracre, 1998, p.2). This is to enable the
country to achieve a middle-income status by the year 2020 and also to serve as the gateway
to the entire West African sub-region.
President Kufour advocated for the establishment of the Metro Mass Transit (MMT)
Bus system at his inauguration speech on January 7th, 2001. Expectedly, Ghanaians in
general, and those in Accra, in particular, heaved a sigh of relief when in October 2003, the
Metro Mass Transit or the ‘the Kufuor Bus’, as it came to be called, was established. The
Metro Mass Transit Limited, a joint venture between the Government of Ghana ( which owns
45 % shares through the assets of the now defunct Omnibus Services Authority) and private
investors (55 % ownership), which has a vision ‘to provide an efficient urban mass transport
system in Ghana through the use of buses’,23 was tasked with the operation of the bus service.
The private shareholders are National Investment Bank, State Insurance Company,
23
http://metromass.com/pub_trans_gh.htm. Retrieved on 14.02.2009

62
Agricultural Development Bank, Social Security and National Insurance Trust (SSNIT),
Ghana Oil (GOIL) and Prudential Bank limited.
The fleet of MMT buses were imported on a gradual basis from China, Holland, or
assembled locally. The Italian government also donated some buses to augment the Ghanaian
government’s laudable efforts. By the end of 2006, the total fleet had reached 677. See Table
6.1 below.
Table 6.1 Fleet Size and Passenger Capacity of MMT Buses
DESCRIP- SEATING CAPA-
STANDING CAPA- NUMBER TOTAL SEA- TOTAL STAN- TOTAL
TYPE TION CITY PER BUS CITY PER BUS OF TYPE TING CAPACITY
DING CAPACITY CAPACITY
YAXING SINGLE DECK BUS 35 65 310 10,850 20,150 31,000 YAXING DOUBLE DECK BUS 68 52 87 5,916 4,524 10,440
DAF PF BUS 63 73 4,599 - 4,599
DAF PE BUS 34 66 101 3,434 6,666 10,100
VD JONCKHEERE BUS 63 63 3,969 - 3,969
VDL NEOPLAN BUS 64 43 2,752 - 2,752
TOTALS 677 31,520 31,520 62,860
Source: Ministry of Transportation and Ghana Statistical Service (2006).
The total MMT staff strength as at the end of the same year stood at 2,536. Nearly half of this
work force i.e. about 45 % worked in Accra and its environs. The average driver to bus ratio
is 1:4. The MMT bus system operates three types of routes. These are: Intra-city, Intercity
and Long distance. Currently the most operated route is the intra-city, followed by the
intercity and long distance in that hierarchy (Ministry of Transportation and Ghana Statistical
Service, 2006).
6.2.2. The Metro Mass Transit: Services Provided
In an interview with Mr. Henk Visschers, the former Manager of Conexxion –the largest
Dutch public transport company –and now the Managing Director (M.D) of the MMT, he
pointed out that the company offers Intra-city services, by which he explained to mean
normal city bus operations that connect between central bus terminals with city outskirts
where people can board and alight at designated bus stops. This service is usually patronised
by commuters and market women that move in-between their homes and their various work

63
places. Yaxing, Iveco and VDL buses are the types of vehicles used for the intra-city
services.
He noted again that the company offers Rural-Urban services. Because of the long
journey, the rural service has a low but solid frequency. This service is meant to open up
villages in isolated districts for social and economical activities. An example is the Accra-Ho,
Accra-Assin Fossu route. The company has dedicated the DAF buses run the rural-urban bus
services.
The MMT limited also operates high frequency trips to short distances, such as
between Kimbu and Tema and between Kumasi and Obuasi or Kumasi and Sunyani
respectively. This is the shuttle services run by the company. Finally, the MMT offers
Intermediate and long distance services to link major cities like Accra and Kumasi, Accra
and Tamale etc.
As a bold attempt to solve perhaps one of the most common and disturbing of all the
problems of urban transportation, i.e. congestion, the MMT Limited introduced what they
referred to as the Bus Rapid Transit System (BRTS) on a pilot basis in Accra, in September,
2005.
6.3. BRTS in Ghana: Characteristics
The introduction of the pilot BRTS in Accra by the Metro Mass Transit Limited was
characterised by a fast trip connection between the southern Kimbu station and Nkrumah
Circle with the northern suburbs of Legon, Madina and Adenta, with Tetteh Quarshie acting
as a central transport hub and change over point.
According to the Managing Director of the MMT, the routes selected for the pilot
BRTS comprised of three loops, two of which were small as well as bigger one. The first was
scheduled bus services plying from Adenta to Tetteh Quarshie; the second, from Tetteh-
Quarshie to Kimbu and finally, between Kimbu and Adenta. According to the operational
plan, a VDL bus was supposed to pass on these routes every 15 minutes. He affirmed that the
company had planned to add Tetteh Quarshie to La-Paz and Tetteh Quarshie to Circle
respectively to the sphere of operation of the pilot BRTS.
The extension of the pilot project was informed by the massive ridership enjoyed by
the Kimbu-Adenta pilot BRTS as exhibited by the astronomical rise in daily ticket sales to
about twenty thousand, according to the management of the service.

64
Explaining how the pilot BRTS actually operated, Mr. Ernest Asare, an MMT driver from
Adenta to Kimbu since 2003, and who had taken part in the pilot BRTS had this to say:
‘Initially we operated a system that ensured one leg of journey from Adenta to
Kimbu in Accra until the BRTS was introduced. Thus, the journeys were now
divided into two legs: from Adenta to Tetteh Quarshie and Tetteh Quarshie to
Kimbu in Accra. Passengers were charged an initial fare of one thousand
cedis only from Adenta to Tetteh Quarshie. They continued their journeys in
different buses from Tetteh Quarshie to Kimbu in Accra, also at another fare
of one thousand cedis’.
Mr. George Ahiati, another MMT driver who has been working since 2006 on the Adenta-
Kimbu corridor also recounted that due to the availability of buses, passengers never had to
wait for longer periods of time at Tetteh Quarshie before their second journey to Kimbu.
As to why these particular routes were selected, the managing director intimated that
cognisance was given to the characteristics of the road network and as well as the
infrastructure. This view was corroborated upon by the deputy managing director who
suggested, for instance, that the Tetteh Quarshie-Kimbu highway was quite big due to the fact
that most part of the highway had four lanes which allowed free flow of vehicular traffic.
Another driver of the bus company, Mr. Emmanuel Opoku who had been part of the pilot
BRTS operation, in an interview, also recollected that a reconnaissance survey was done on
the Adenta-Kimbu highway to gather data on bus ridership in addition to identifying bus
stops that received massive patronage from passengers. After these exercises had been
conducted, the BRTS was introduced on a pilot basis to the public.
Another major feature of the pilot BRTS was the use of bus conductors. Initially the
conductors, together with the drivers, formed the driving crew. However, during the second
phase of the project, the conductors were replaced with ticket booths made out of wood and
placed at certain designated bus stops (See Plate 6.1 below). The drivers of the pilot BRTS
were banned from hawking for prospective passengers en route or allowing passengers from
disembarking at other points besides the designated bus stops. These booths therefore served
as the main foci for all activities related to the pilot BRTS. For instance, they served as
venues where passengers could buy their tickets before the buses arrived. The conductors will
then deface the tickets after which the passengers will be allowed to board the buses. The
booths also served as bus terminals where drivers of the express service could take a breather

65
as they waited for passengers to board. From observation, but for the main terminal at Kimbu,
none of these booths had adequate shelter to protect passengers from the vagaries of the
weather or comfortable seating places for passengers to rest while waiting for the buses.
Plate 6.1. A passenger buying a bus ticket at an MMT ticket booth (Author’s field work, 2009)
Apart from the above mentioned characteristics, the pilot BRTS in Accra never had most of
the seven components as had been reviewed in the literature, especially an important
component as a dedicated ROW. The buses were made to compete for road space with other
users of the Kimbu-Adenta highway.
As to whether one could therefore conveniently classify the erstwhile express bus
service in Accra as a BRTS, the response is divisive. Whereas management of the bus
company strongly believe it was a BRTS or had a semblance of it, and even argue that in
developing countries such as Ghana, one could not possibly introduce a state-of-the-art
technology aggressively without implementing it in a simple and gradual manner, the public
transport regulators at the Ministry of Transportation think otherwise.
According Dr. Darku, the Deputy Director in-charge of Planning and Development at
the Department of Urban Roads, the Metro Mass Transit Limited, as one of the numerous
public transport providers has never been mandated to operate anything called a BRTS.
Ticket Booth

66
While conceding that the bus company had requested his outfit to mark some segments of the
Kimbu-Adenta highways as ‘Bus Only’ which they did, he was of the view that that exercise
alone was simply not enough. Without effective enforcement of the law by the police to
ensure strict compliance by other motorists, the MMT express buses did not have a dedicated
ROW which is one major component that characterises a BRTS, thus making the project a
failure right from the onset. He concluded that the mere act of putting a number of buses on a
corridor and calling it as a BRTS does not make it as such. His views were similar to those
expressed by a senior member of the Urban Transport Project office of the Department of
Urban Roads who pleaded anonymity because he was not authorised to speak on the subject.
The differing opinions expressed above are an indication of the dichotomy that
usually prevail between policy makers, on the one hand and policy implementers on the
other. Be that as it may, readers are reminded of an assertion by the IEA (2002) that
communities can customise the building of a rapid transit system that meets their needs and
fits within their budget. They note further that the extent of dedicated infrastructure and the
level of sophistication of different systems vary considerably. Against this back drop, the
term ‘pilot’ as used by the company in describing their kind of BRTS is seen as most
appropriate.
6.4. Traffic Congestion on the Kimbu-Adenta Highway
As discussed previously, the entire road network of the city of Accra is congested. As such, it
is reasonable to anticipate traffic congestion on the Kimbu-Adenta highway on which the
pilot BRTS operated. However, the incidence of congestion on this corridor is not uniform.
Congestion varies with the time of the day, as well as the days in the week. This is a true
reflection of the variations in human activities during these noted times.
‘Average travel speeds’, as will be used in the ensuing paragraphs, actually represent
only the ‘median’ speed values that were obtained from the field survey. This is because
statisticians prefer this descriptive statistic over the ‘mean’ values in the measurement of
central tendency. As Quiroga and Bullock (1998, p.124) has suggested in the literature, ‘a
high median speed represents average traffic condition much better than a low harmonic
mean speed’. The mean traffic condition is added later on for comparative purposes only.
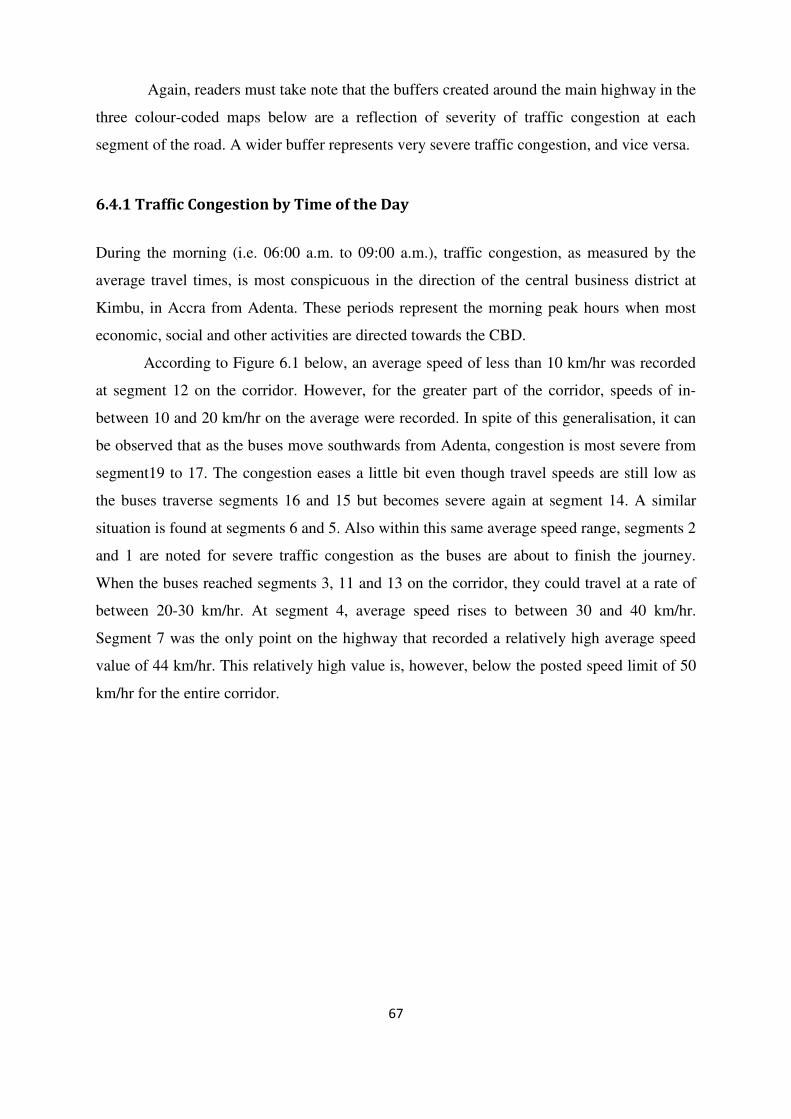
67
Again, readers must take note that the buffers created around the main highway in the
three colour-coded maps below are a reflection of severity of traffic congestion at each
segment of the road. A wider buffer represents very severe traffic congestion, and vice versa.
6.4.1 Traffic Congestion by Time of the Day
During the morning (i.e. 06:00 a.m. to 09:00 a.m.), traffic congestion, as measured by the
average travel times, is most conspicuous in the direction of the central business district at
Kimbu, in Accra from Adenta. These periods represent the morning peak hours when most
economic, social and other activities are directed towards the CBD.
According to Figure 6.1 below, an average speed of less than 10 km/hr was recorded
at segment 12 on the corridor. However, for the greater part of the corridor, speeds of in-
between 10 and 20 km/hr on the average were recorded. In spite of this generalisation, it can
be observed that as the buses move southwards from Adenta, congestion is most severe from
segment19 to 17. The congestion eases a little bit even though travel speeds are still low as
the buses traverse segments 16 and 15 but becomes severe again at segment 14. A similar
situation is found at segments 6 and 5. Also within this same average speed range, segments 2
and 1 are noted for severe traffic congestion as the buses are about to finish the journey.
When the buses reached segments 3, 11 and 13 on the corridor, they could travel at a rate of
between 20-30 km/hr. At segment 4, average speed rises to between 30 and 40 km/hr.
Segment 7 was the only point on the highway that recorded a relatively high average speed
value of 44 km/hr. This relatively high value is, however, below the posted speed limit of 50
km/hr for the entire corridor.

68
Figure 6.1 AM Peak Thematic Map

69
In the off-peak period, (i.e. 12:00-15:00 GMT) as represented in Figure 6.2 below,
movement of the buses in both directions, either from the CDB at Kimbu towards Adenta or
vice versa, was above the minimum average speed of 10 km/hr as was observed in the AM
Peak. This is perhaps the only major feature that differentiates the afternoon off peak travel
times from the peak travel times observed in the mornings. This is due to the fact that about
thirty-two percent of the segments had average speed values that ranged in-between 10 and
20 km/hr. This particular speed range begins with segment 15 all the way to 19 but as could
be observed from the varying sizes of the buffers around the road network, congestion is
more severe at segments 15 and 16 than it is for the rest of the journey northwards. A greater
part of the corridor, about fourty-two percent had speed values averaging from 20 to 30 km/hr
on the average. The severity of the congestion also varies. For instance, even though
segments 13 and 14 are within the same speed range, congestion is more severe at the former
than the latter. Also, four of the segments, representing twenty-one percent, had
comparatively higher speeds with an average of between 30 and 40 km/hr. However, only
segment 2 had an average speed value which was a little above 40 km/hr. Of course, this
value also falls below the posted speed limit.

70
Figure 6.2 Off Peak Thematic Map

71
Figure 6.3 PM Peak Thematic Map

72
In the late afternoon period, i.e. (15:00 – 18:00 GMT), human activities generally move from
the centre of town towards the peripheries. This period represents the afternoon peak. As
such, much traffic congestion is observed as the buses move northwards towards Adenta from
Kimbu. According to Figure 6.3 above, two segments i.e. 15 and 18 representing eleven
percent of the total corridor, had average speeds limits below 10 km/hr. Again, it can be
observed that congestion is more severe at segment 18 than at segment15. On fifty-eight
percent of the highway, the buses could travel at a rate of only 10 and 20 km/ hr on the
average. As can be observed, notable variations, for instance at segments 11 and 13 as
compared with segment 12 prove that the severity of congestion changes geo-spatially.
Again, average speeds of between 20 and 30 km/hr were possible on only twenty-six percent
of the corridor. Expectedly, only segment 10 had an average travel speed of 34 km/hr.
6.4.2 Traffic Congestion by Day of Week
Traffic congestion, as a dynamic phenomenon, did not show variations only with the time of
the day but with the various days of the week as well.
Figure 6.4 Traffic
Congestion by
Day of the Week.
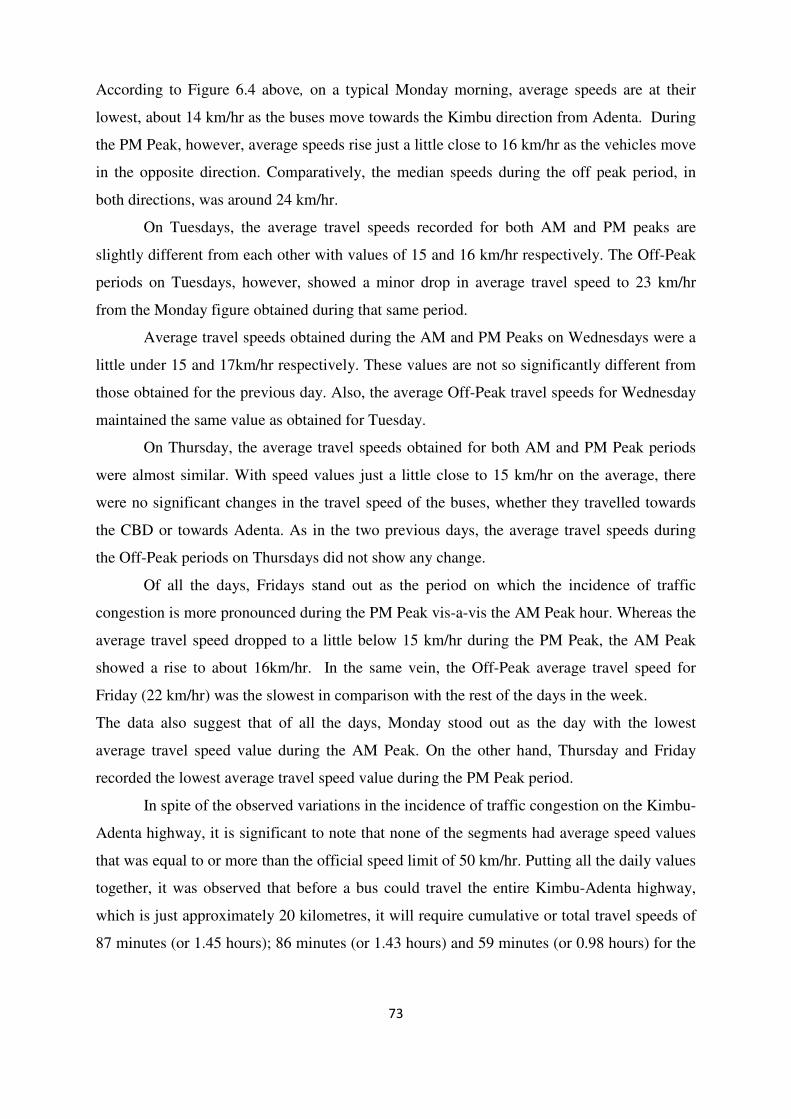
73
According to Figure 6.4 above, on a typical Monday morning, average speeds are at their
lowest, about 14 km/hr as the buses move towards the Kimbu direction from Adenta. During
the PM Peak, however, average speeds rise just a little close to 16 km/hr as the vehicles move
in the opposite direction. Comparatively, the median speeds during the off peak period, in
both directions, was around 24 km/hr.
On Tuesdays, the average travel speeds recorded for both AM and PM peaks are
slightly different from each other with values of 15 and 16 km/hr respectively. The Off-Peak
periods on Tuesdays, however, showed a minor drop in average travel speed to 23 km/hr
from the Monday figure obtained during that same period.
Average travel speeds obtained during the AM and PM Peaks on Wednesdays were a
little under 15 and 17km/hr respectively. These values are not so significantly different from
those obtained for the previous day. Also, the average Off-Peak travel speeds for Wednesday
maintained the same value as obtained for Tuesday.
On Thursday, the average travel speeds obtained for both AM and PM Peak periods
were almost similar. With speed values just a little close to 15 km/hr on the average, there
were no significant changes in the travel speed of the buses, whether they travelled towards
the CBD or towards Adenta. As in the two previous days, the average travel speeds during
the Off-Peak periods on Thursdays did not show any change.
Of all the days, Fridays stand out as the period on which the incidence of traffic
congestion is more pronounced during the PM Peak vis-a-vis the AM Peak hour. Whereas the
average travel speed dropped to a little below 15 km/hr during the PM Peak, the AM Peak
showed a rise to about 16km/hr. In the same vein, the Off-Peak average travel speed for
Friday (22 km/hr) was the slowest in comparison with the rest of the days in the week.
The data also suggest that of all the days, Monday stood out as the day with the lowest
average travel speed value during the AM Peak. On the other hand, Thursday and Friday
recorded the lowest average travel speed value during the PM Peak period.
In spite of the observed variations in the incidence of traffic congestion on the Kimbu-
Adenta highway, it is significant to note that none of the segments had average speed values
that was equal to or more than the official speed limit of 50 km/hr. Putting all the daily values
together, it was observed that before a bus could travel the entire Kimbu-Adenta highway,
which is just approximately 20 kilometres, it will require cumulative or total travel speeds of
87 minutes (or 1.45 hours); 86 minutes (or 1.43 hours) and 59 minutes (or 0.98 hours) for the
74
AM, PM and Off Peak periods respectively. For further studies, refer to Appendix 5
Congestion Scorecard on the Kimbu-Adenta Corridor.
6.4.3. Reasons for the Observed Traffic Congestion Pattern
The point has been made that the factors that cause traffic congestion at the study area are
just microcosm of the general situation that affect Accra in general. It is also important, at
this point, to note the multi-facet nature of the phenomenon. Hence, there is the need to
employ the General Systems and Structuration theories respectively to help illuminate the
issues (See Figure 2.3).
From the analysis of the traffic congestion data obtained from the Kimbu-Adenta
highway, it is reasonable to say that in most cases, the congestion phenomenon is one that
recurs almost during every time of the day and also during the weekdays. The congestion
situation might change for the better during weekends, notably Sundays, but certainly not for
Saturdays, even though this study could not obtain empirical data in support of this assertion.
The question then is: why has this highway gained such notoriety for serious traffic
congestion, especially during the weekdays, and on Saturdays? The obvious answer might be
that traffic is indeed a function of human activity. Human activities determine land use. As
said previously, land use –one of the three sub systems identified for the purpose of this study
– may be seen as the legal use of land, the type of structures and socioeconomic activities that
people engage in.
In Accra, as in most cities of the developing economies, it is not uncommon to
identify a situation where various land use types such as residential, commercial, industrial,
recreational and educational structures are localized in a particular region, especially at the
Central Business District, with the hope that the positive effects of such regionalization of
facilities will trickle down to the periphery. Sadly, the failure of such ‘trickle down’ policies
is obvious to all. Major formal and public institutions, such as the ministries of the state, the
Castle which acts as the seat of government, the parliament house, the supreme and high
court buildings, and other excellent banking facilities are all centralized at the hub of Accra.
Again, with the adoption of liberalization policies in recent years, the urban economy
has become primarily trading-oriented. It is therefore a common occurrence to see a
justaposition of both the informal and the formal economies in the centre of Accra. For
instance, the renowned Makola Market which has been the hotbed for commerce over the
years by women traders who sell fresh produce, manufactured and imported foods, clothes

75
etc. and which recently has been upgraded into a shopping mall, is located right in the middle
of town. Within some few distance away, one comes across the Kantamanto Market, also
located in central Accra, where traders deal mostly in imported second hand clothing, shoes
and household items. The Agbogbloshie Market, which is located near the Timber Market on
the Fadama Road, and the Kaneshie Market Complex are all cases in point to illustrate the
land use pattern in Accra that combines both elements of the formal and informal sector.
Most of these traders use the trotros, passenger mini-buses or taxis to fetch their goods to
these markets. Again, by reason of their central location, residents in Accra have few options
available other than to go to these places for their basic needs. Owing to their low occupancy,
the implication is that more of such transport means are needed to service the market women
and shoppers, therefore creating traffic congestion.
In contrast with the advanced countries where one could obtain all that one craves for
in his or her small town without having to travel to the capital city, the situation in Accra, and
perhaps in most cities of the developing countries, is different. The market complexes
mentioned above do not serve only residents of Accra but attract shoppers from other regions
in the country as well, especially during the Christmas holidays. These regions are usually the
Volta, Eastern and Central due to their proximity to Accra. Though empirical data as to the
exact number of holiday shoppers in Accra are difficult to obtain, it does not negate the
reality that many people do make such trips to the city. This could be the main reason for the
unusually heavy traffic congestion that is observed at the festive periods, especially at the
CBD and on most major roads of Accra.
It must be pointed out that along the Kimbu-Adenta highway, one can find the
Madina Market which is located next to the Zongo Junction pilot BRTS bus stop but its
relevance cannot be compared to the other market centers already mentioned since it is
mostly vibrant only on Wednesdays and Saturdays. Added to this, a new shopping mall has
been put up some few meters away from the HIPC Junction pilot BRTS bus stop (on segment
10) but its ability to attract the majority of shoppers and prevent them from travelling all the
way to the bigger shopping centers in Accra is unknown. As a direct consequences of these
factors, traffic congestion is most severe in the AM Peak hours when people have to frequent
the central business district of Kimbu and its environs in order to access these socio-
economic facilities.
The movement of people to Accra from the other regions does not only suggest the
primacy of the city to the Ghanaian regional economy but also, this could account for the

76
observed heavy traffic situation during Monday mornings and Friday evenings, especially. It
is possible that people migrate to Accra to work at the beginning of the week and commute
back to their hometowns either before or during the weekends.
Another prominent center of attraction along the Kimbu-Adenta corridor is Ghana’s
premier and largest public university –the University of Ghana –which is located to the west
of the Legon pilot BRTS bus stop, (between segments 13 and 14). With vehicles belonging to
both staff and students of the university all joining or leaving the main corridor at various
times of the day, usually for academic purposes, in addition to commercial drivers who use
the university road to connect to Achimota and its environs, it was observed that traffic
congestion was most severe, especially during the AM Peak when thousands of students
come for lectures in the morning, as represented by an average travel speed of less than 10
km/hr for that portion of the road.
The situation is a bit different during the PM Peak, as seen in average travel speed in
the range of 10 and 20 km/hr. This could be accounted for by two main reasons. First, while
most lectures are scheduled to begin about the same time in the morning, thereby attracting
many students to the university campus, the times for finishing lectures are not the same.
Again, most students remain on campus after lectures in order to access library and internet
facilities or to do other academic exercises and may leave very late in the evening when the
‘rush hours’ are over. Other students may ‘perch’ or spend the night with their colleagues
who have on-campus accommodation, especially on days when lectures are scheduled late in
the evenings. Therefore, the number of students who enter the campus in the mornings might
not be the same as those who leave in the evenings.
The second important reason is the attitude of commercial drivers who avoid the
traffic congestion at segment 13 of the Kimbu-Adenta highway during the PM Peak hours.
Upon reaching Tetteh Quarshie (Shiashie) at segment 12, most commercial drivers depart
from the main corridor for local roads which goes through residential areas such as East
Legon, La Bawaleshie, and the Trinity Theological Seminary. They then join the main
Kimbu-Adenta Highway at IPS Junction, which is located some few meters away from the
Atomic Junction BRTS bus stop (i.e. on segment 15).
The poor development, location and management of passenger terminals and transit
points along the Kimbu-Adenta corridor constitute another land use practice that has either
created or perpetuated traffic congestion. These terminals defy planning and architectural
principles. They spring up spontaneously due to lack of discipline and strict compliance with

77
laid down planning principles as contained in the master development plan of Accra. Most
often, residential areas are developed without any consideration of public transport terminals.
It is not uncommon to identify terminals that are built either near streets or on privately
owned land, which inhibits the development of permanent structures (Addo, 2002). Usually,
it takes only one or two drivers to initiate such illegal acts. Within an overnight, others take
advantage of the situation and join. With the setting up of such ‘terminals’ and the attraction
of passengers, economic activities, usually informal trading such as food joints, mobile phone
business transactions locally referred to as space-to-space as well as other traders who hawk
all kinds of goods and services mushroom up. The situation then becomes the norm and the
law enforcement agencies find it too late to intervene. In addition to other undesirable
consequences of these illegal acts, severe but highly avoidable traffic congestion occurs. A
classical case in point is at the Zongo Junction on the Kimbu-Adenta highway (between
segments 15 and 16). The author’s personal observations are captured in plate 6.2 below.
Plate 6.2 Land Use practises at the Zongo Junction. Source: Field Survey, 2008.
Vehicles marked ‘A’ and ‘B’ are driving on the main corridor while ‘C’ is entering a lorry
terminal (out of view) which is located close to the main corridor. The area marked ‘D’
represents pedestrian walkway that had been invaded on by traders (with umbrellas for shade
A
B
C
D
E
F

78
against the sun) and advertisements and sign posts. This invasion of the walkway
consequently forces pedestrians into the main corridor which usually results in traffic
accidents or causes traffic congestion as drivers have to slow down to avoid knocking down
pedestrians. The vehicle marked ‘E’ is a trotro that has been parked on the shoulders of the
road for passengers to disembark and also to allow other passengers to embark until it is full
to capacity. As soon as that is achieved, and without warning, the driver of the trotro will
quickly force its way into the main corridor again, as represented by the taxi marked ‘F’. The
vehicles marked ‘A’ and ‘B’ which are on the main highway could either crush into vehicle
‘F’ , which is usually the case, or slow down and cope, thereby prolonging the travel times on
this segment of the road. A similar situation is observed at segment 5 i.e. from the License
Office to the 37 Military Hospital areas.
Closely linked the point expressed above on the spontaneous development of
terminals is the extent to which institutions, seen by the structuration theory as ‘the rules of
the game in society’ (North, 1993, p.3) undertake certain policies that may enable or
constrain human interactions and enforce the laws to ensure that sanity prevails.
In the early 1980’s, Ghana underwent series of structural adjustments aimed at
‘improving the competitiveness and efficiency of the economy’ (Ellis, 2000, p. 164). Among
other effects of these austere neoliberalistic policies, Anyemedu (2000, p.5) contends that an
estimated 73,000 workers were retrenched from 1987 onwards under the Civil Service
Reform Programme. Another 100,000 workers are estimated to have been retrenched from
the Ghana Cocoa Board from the mid-1980s to the early 1990s. The situation has led to the
creation of an urban economy that is largely informal. The significance of the informal sector
–employing up to 60 % of the workforce and producing nearly 40 % of GDP in the
developing world–cannot be overemphasised (Schneider & Enste, 2000). It is argued that the
first law of the informal economy states that ‘opportunities to make money must be exploited
when and where they occur, regardless of whether officialdom approves’ (Stock 2004,
p.263).
From the author’s observation, hawking24 along the Kimbu-Adenta highway is such a
thriving business. These hawkers will quickly rush to any vehicle that stops or slows down in
order to sell their wares ranging from food, medicines, clothing, household items, just to
mention but a few. Beggars seeking alms were not an unusual sight on this corridor.
Moreover, some young men were observed washing the windows of vehicles that has stopped
24 The act of selling goods for a living. http://www.thefreedictionary.com/Hawking. Accessed on 03.05.09

79
briefly in the middle of the road due to traffic light signage. Owing to the short time duration
at such joints, these roaming vehicle washers must hastily do whatever it takes in order to
serve as many customers as possible.
In an interview with the managing director of the MMT, he was of the view that these
hawkers only take advantage of the traffic congestion but they are not necessarily the root
cause. While acknowledging that there might be an iota of truth in this assertion, it was also
observed that moving vehicles had to slow down, stop abruptly, or swerve to avoid hitting
hawkers whose only focus was to eke out their daily bread.
The informal economy is ubiquitous along the highway but it is more pronounced as
one travels towards the central business district on segments 5 and 6 along the License Office
and 37 Military Hospital areas, and also along segments 1 and 2, i.e. the Ridge and Kimbu
environs. It therefore comes as no surprise when the average travel speeds recorded for these
areas were around 10 and 20 km/hr. From the foregoing discussions, one can safely conclude
that the informal economy impedes traffic flow in order to benefit from the traffic congestion.
Unfortunately, successive governments have learnt the hard lesson not to intervene or
regulate the informal economy or risk losing their votes and power. It is said that ‘African
governments are [often] more interested in survival rather than development’ (Kuada &
Chachah 1999, p. 30). A classical example is the decongestion exercise undertaken by the
Accra Metropolitan Assembly to rid the city of hawkers and to relocate them to a new
shopping mall. Weeks after successfully implementing the measures and receiving
widespread public approval, the authorities had to relax the laws and allow the hawkers back
on to the streets due to the political costs the government was likely to incur.
As illustrated by Plate 6.3 below, a hawker is busily selling food items to a customer
(under umbrella) at the HIPC Junction pilot BRTS bus terminal (between segment 10 and 11)
which incidentally is located some few meters away from the private residence of ex-
President Kufuor. This picture was taken while he was still the president and daily commuted
from his house to the Castle with armed police escorts! It is only a matter of time that a full
blown informal market springs up, if no official disapproval is registered.

80
Plate 6.3 An informal economy along the Kimbu-Adenta Highway. Source: Field Survey, 2008.
Transport supply, i.e. the available infrastructures (such as road network, terminals, signage
and traffic management systems) has been identified as the second of the three sub-systems
that might account for the severe traffic congestion on the Kimbu-Adenta highway. Even
though the Ministry of Transportation and the Ghana Statistical Service maintain that the
Greater Accra Region has the highest road network, one may argue that the road
infrastructure capacity is woefully inadequate given the quantum of vehicular traffic that use
the existing space.
The three colour-coded thematic maps used in this study (Figures 6.1 –6.3) are
graphical representations of how average travel speeds on the various segments on the
Kimbu-Adenta corridor correspond with the nature of the road network. In most instances, it
was observed that average travel speeds were comparatively higher for those portions of the
network that had four lanes. For instance, during the AM Peak, average travel speeds ranging
from 30 to 50 km/hr were registered along segments 4 (from Flagstaff to the 37 Military
Hospital area); 7 and 8 (all the way from Opeibea to Airport II) and also at segment 11 (from
the HIPC Junction to Tetteh Quarshie). These segments have four lanes, thus facilitating free
vehicular flow. During the same period, however, average travels speeds around 10 and 20
km/hr are observed all the way from Tetteh Quarshie to Adenta. These segments have double
lanes. At segment 13 (between Okponglo and Legon), however, speeds are even below 10

81
km/hr. This is due to the ongoing road expansion project that had begun from that particular
segment. During the PM Peak also, two segments i.e. 15 (from Atomic Junction to Zongo
Junction) and at 18 (from SDA to Barrier) recorded speed values that were less than 10 km/hr
on the average. At these segments, motorists could only drive in a single file manner.
Therefore, should any minor incident occur, traffic congestion easily builds up.
One would have thought that on portions of the road that had the four lanes, especially
from segment 2 to 11 (i.e. from Ridge all the way to Tetteh Quarshie), average speeds will be
comparatively higher but as the PM Peak thematic map in Figure 6.3 shows, they are mostly
up to 20 km/hr. This is due to the fact that the multiple lanes from Accra suddenly give way
to a double lane beyond this point so all the vehicles have to slow down and join the queue.
Not only is the width of the road network very narrow beyond this point but the roads are also
not maintained frequently resulting in pot-holes and eroded sand that usually pile up in the
road especially after torrential downpour.
As illustrated in Plate 6.4. below, vehicles moving from segments 16 to 17 (Zongo
Junction towards Riss Junction) have to slowly descend into the potholes in the middle of the
road or to bypass them. It was observed that some young men in the area occasionally filled
the pot holes with earth after which they collected monies from motorists. Although some
may argue that these good Samaritans are somehow ameliorating the situation for motorists
since the Ghana Highway Authority and the Department of Urban Roads are not doing their
job as they should. However, the activities of these men could cause or worsen traffic
congestion. Besides, it will take just another heavy downpour, which is usually the case, and
they are in business again. It must be pointed out that with the completion of the road
expansion projects, the situation might improve for the better and that again underscores the
importance of the institutional framework, as identified by the structuration theory, in
providing infrastructure that could either enable or constrain the free flow of vehicles on the
corridor in question.

82
Plate 6.4 Road Infrastructure on the Kimbu-Adenta Highway. Source: Field Survey, 2008.
Signage and traffic management systems along the Kimbu-Adenta highway greatly impact on
the occurrence of traffic congestion. The calibration of the signage systems seem not to
commensurate with the flow and intensity of vehicular traffic. The traffic lights could stay
red for the road network with many vehicles while indicating green for other networks that
might not even have vehicles moving on them. This phenomenon most often than not compel
some motorists to jump the red lights, with its associated consequences. Other than that,
traffic congestion ensues. On other times, the signage systems break down due to frequent
power disruptions. It was observed that in instances where the law enforcement agencies,
such as the MTTU police and the specially-trained Community Protection personnel were
present at any of these faulty signage systems, motorists behaved well and there was free
flow of traffic, albeit at a slow pace. At intersections where the law enforcement agencies
were absent, which was usually the case for most parts of the corridor, the youth (some with
reflective vests and wielding tree leaves or branches) were observed directing traffic for
voluntary fee contributions from motorists. Not only is this risk-taking behaviour of these
otherwise good Samaritans the cause of many avoidable traffic accidents, which often
involve them and recalcitrant drivers who flout their orders, but the lawless situation could
degenerate into chaotic traffic congestion.
The summary of the foregoing discussion on the reasons for the observed traffic
congestion on the Kimbu-Adenta highway perfectly confirms the existing literature that
83
whereas demand varies over time, supply is relatively fixed over long time periods and output
is not storable, therefore the occurrence of congestion in all transportation facilities is
inevitable (Palma & Lindsey, 2002).
6.5. Factors that collapsed the Pilot BRTS in Accra
6.5.1. Traffic Congestion
As suggested by the data and from personal observation, the Kimbu-Adenta highway, like
most major corridors spread all over the capital city, is heavily congested. So endemic and
recurring is the phenomenon that motorists are not able to travel at speed levels which are
even close to the posted speed limit of 50 km/hr, regardless of the time of the day or the day
of the week.
Against this backdrop, it is reasonable to agree, to a large extent with the management
and drivers of the bus company whom I interviewed that traffic congestion was the bane of
the pilot BTRS. Management was of the view that in spite of the huge fleet of buses that was
designated for the project, even though the precise figure could not be obtained, traffic
congestion made it impossible to adhere to the policy of putting a VDL Bus on the corridor in
every 15 minute time interval.
Laying the blame squarely on traffic congestion, Managing Director of the MMT
explained that even though he was yet to make a serious financial analysis on the effect of
congestion on the operational costs of the Company, he could reasonably conclude that
congestion really had adverse effects on the operations of the pilot BRTS, leading to its
eventual collapse. Giving reasons to back him claim, he further argued:
‘when the buses are locked up on the corridor due to traffic congestion, they
waste a lot of time; burn fuel inefficiently without making revenue to keep
operations going. This affects both the operational and total costs involved in
keeping the buses functional while taking into consideration the effects of
depreciation on the finances of the Company. Besides, the Yaxing buses that
were primarily used for the pilot BRTS frequently developed technical faults
especially with the clutches due to the delays associated with traffic
congestion. Of course, this also exposes the weakness of the buses that were
used for the project but it would not have occurred in the first place if there
was no incidence of traffic congestion on that corridor’ (Field work, 2008).

84
Though the company did not officially revert from the express service to the current service
where drivers are now allowed to hawk for passengers along the highway and to wait at bus
stops until their buses were full before starting the journey, the managing director noted that
circumstances beyond their control i.e. traffic congestion forced them to gradually phase out
the express services. “Initially, a decision was taken to take some of the bus stops or ticket
booths out and place conductors in the buses instead. As some point in time, it was realised
that there was so much congestion that it became natural that there was no pilot BRTS”, he
concluded.
His views were corroborated upon by Mr. Emmanuel Opoku, who had actually driven
some of the pilot BRTS buses. He recounted that due to traffic congestion, there were
uncountable number of times when buses were held up in traffic while prospective
passengers queued at the transit points. His view was however challenged by another driver,
Mr. George Ahiati who saw the traffic congestion as a blessing in disguise for the project.
During congested periods of the day, he argued, most prospective passengers are stranded
due to the fact that most of the trotro and mini bus drivers used what he described as
‘shortcuts’ (i.e. local roads in residential areas) other than the main corridor. Owing to their
limited carrying capacity, the few trotros and minibuses that opt to remain on the main
corridor cannot accommodate extra passengers besides their maximum carrying capacity. As
such, these passengers will clamour for any available space in the express buses even if that
will demand that they stand in the buses for whole duration of the journey. On the contrary,
when there is no congestion, these same passengers prefer to board the trotros because of
their small sizes and the ability of their drivers to involve in all illegalities to beat the traffic
jam.
His opinion, however, cannot go uncontested. Two out of the three passengers who
took part in the focus group discussion noted how exciting the express service was initially
when everything was moving on smoothly but when later on it became difficult to get a
connecting bus on time and even when they finally did, there were instances when they had
had to stand in the vehicle all throughout the journey, it became unpleasant to use the pilot
BRTS buses anymore for their journeys.
6.5.2. Unhealthy Competition from Other Commercial Drivers
The introduction of the metro mass transit system in general, and specifically the concept of a
pilot BRTS came onto the Ghanaian public transport scene at a time when the transport

85
market has seen decades of dominance by the private sector. As mentioned previously, these
privately-owned transport operations came to fill in the vacuum left by the collapse of the
erstwhile state transport system. Following their successful organisation in powerful unions
and effectively controlling the quantity and quality of service, it is not unusual to expect the
private interest to view the new transport system as a threat to their survival. According to a
news item carried by the Ghana News Agency in its 29th October 2002 edition, the GPRTU,
which is by far the largest transport union in the country, is reported to have seen the
introduction of the metro mass transit system in Accra as a major challenge and had
accordingly advised vehicle operators, especially trotro and taxi drivers to exercise the
greatest restraint during their rounds.25
Beyond such verbal pleas, Addo (2002) and Oppong (2000) have identified gross
indiscipline among some commercial drivers who perceive themselves as being above the
law. The gross indiscipline on the roads of Accra and the sheer lack of respect for public
assets like the MMT vehicles which are perceived to belong to the ‘government’ and also as a
threat to the revenue base of the private commercial drivers, a lot of illegalities are resorted to
in order to outcompete the MMT buses for passengers. There is absolutely nothing wrong
with a healthy competition among these public transport providers. However, when it borders
on illegalities and animosities towards perceived rivals, it calls for concern.
Using the time geographic framework to conceptualise the above acrimony between
the commercial drivers vis-a-vis the pilot BRTS buses, as the express buses plied their time-
space prism from Kimbu to Adenta and vice versa, they encountered what Hägerstrand
(1970) refers to as coupling constraints in the sense that they needed to interact with, and
compete for potential path space with other commercial and private vehicles. As the
competition becomes unhealthier due to the rough tactics employed by the commercial
vehicles, for instance, the express buses became efficient in trading time for space, thereby
requiring more time per unit space in their movement, indicating a steeper slope or less
efficiency until such time that the path of the pilot BRTS buses became vertical or stationary
in space.
Recounting how such animosities contributed to the demise of the pilot BRTS, Mr.
Henk Visschers argued that by focusing all their attention on pedestrians with the hope of
getting passengers out of them, some of the commercial vehicle drivers deliberately slow
down in the middle of moving traffic, while their aides shout to attract the attention of
25
http://www.ghanaweb.com/GhanaHomePage/NewsArchive/printnews.... Accessed on 12.01.2009
86
passengers who are then allowed to board the vehicles before speeding off. In the same vein,
these drivers adopt the same practice for passengers who wish to alight at any point on the
corridor instead of only at the approved bus stops. Added to the above, once they approach
traffic jams, they usually drive on the shoulders of the road for a while and then without
warning or regard for vehicles, they forcefully and quickly join the mainstream traffic flow.
Finally, when they get to the approved bus stops, they deliberately park in a manner that
leaves lots of space in front of them so that they can quickly set off again.
From observation, it appears that most commercial drivers are either totally ignorant
or wilfully disregard the Road Traffic Act of 2004 which has been replaced with the Road
Traffic (Amendment) Act 2008, Act 761 which states inter alia that ‘no vehicle may obstruct
the free movement of traffic on a road by parking, standing, loitering or in any other manner.
No person shall park a motor vehicle on a road abreast of another motor vehicle’. If
effectively enforced, as in for instance, the payment of huge fines for illegal driving, these
regulations would have allowed for free flow of vehicular traffic in Accra, in general, and
specifically on the Kimbu-Adenta corridor.
On the other hand, with the kinds of restrictions imposed on drivers of the pilot BRTS
buses, not only did some passengers perceive the bigger buses as not being innovative
enough as the minibuses are, but there were several instances when their vehicles were
crushed due to the recklessness attitude of the commercial vehicle drivers to enter the
mainstream traffic. When many of the buses are sent to the workshop for repairs due to
accidents, pressure is exerted on the few remaining vehicles which quickly developed wear
and tear. These regular maintenance of the buses involved in traffic accidents, and the
financial pressures put on the resources of the company served as capability constraints
which made the operation of the pilot BRTS uneconomical.
My personal observation on the Kimbu-Adenta highway also confirms the
above description of how commercial drivers could misbehave with impunity towards the
metro mass buses. During one morning rush hour, I saw some prospective passengers who
were waiting some few metres away from the MMT bus I was using to capture the traffic
situation on the corridor. A commercial driver who also might have seen the waiting
passengers ahead of us, quickly accelerated while approaching our vehicle from behind. He
sped around the bus, swerved back into the travel lane and screeched to a sudden halt. But for
the timely intervention of the elderly and skilful bus driver, something terrible might have
happened. To the chagrin of the commercial driver, the waiting passengers who saw all what

87
happened, refused to board his vehicle but opted for the bigger bus instead. Such is the level
of acrimony between the trotros and the metro mass transport system in Accra.
In the focus group discussion, a man narrated how some of the commercial drivers
and their aides waged what may be described as psychological warfare against passengers
who used the pilot BRTS buses. According to him, verbal insults such as ‘One-One
Thousand’ (in apparent reference to the highly subsidised fare of one thousand cedis per ride)
‘misers’, ‘cheap side’ etc were heaped on patrons of the service without provocation from
some notorious trotro and taxi drivers whenever they walk past their vehicles to board the
express buses. In a country where subsidised items are perceived as inferior and of low
quality, one can only imagine the extent to which these unguarded statements might have
contributed to the dwindling ridership, and the subsequent collapse of the pilot BRTS in
Accra.
6.5.3. Lack of Supporting Legislative Instruments
In a study of urban public transport conditions in Accra, Ghana conducted by the IBIS
Transport Consultants Ltd (2005), it came to light that a number of legislative instruments
have been enacted for the operations of public transportation in the country. For instance,
under the Local Government Act (No.462 of 1993), urban passenger transport is under the
authority of the relevant Metropolitan, Municipal or District Assembly under which a
particular transport service is operated. For the greater Accra conurbation, these relevant
authorities include the Accra Metropolitan Assembly, the Tema Municipal Assembly, and the
Ga District Assembly. Each has jurisdiction within its own boundaries, but there is no formal
co-ordination between them or a higher-level authority to which they could defer.
Besides the above described governing regulatory framework, the operation of all
road vehicles in Ghana is governed by Omnibus Services Authority Decree (NLCD 337 of
1969) which was repealed and replaced by The Omnibus Services Decree (NRCD 71 of
1972); The Omnibus Services (Amendment) Decree (NRCD 181 of 1973); The Road Traffic
Regulations (LI 953 of 1974) and The Road Traffic Offences Regulations (LI 952 of 1974). In
more recent times, The Road Traffic Act of 2004 has been replaced with The Road Traffic
(Amendment) Act 2008, Act 761, which happens to be the most current. All these legislative
instruments respectively deal with the registration, licensing, use and construction of vehicles
in general (and of commercial vehicles in particular) and codify offences in these regards.

88
However, none of these legislative instruments give a legal basis for the operation of
an exclusive right-of-way pilot BRTS. According Dr. Darku of the Department of Urban
Roads, in contrast with BRTS-implementing cities like Lagos, Curitiba, Bogota and Sao
Paolo where the existing roads were redesigned to accommodate buses with dedicated
infrastructure, adequate and spacious bus terminals as well as permitting minibuses to serve
as feeders for the main express service, his department was only tasked to mark some
segments of the Kimbu-Adenta highways as ‘Bus Only’. However, without recourse to any
legislative instrument, it meant that the traffic police cannot intervene to ensure strict
compliance of the ROW directive by other motorists. Therefore, it was only a matter of time
that the pilot BRTS collapsed.
Thus, without any authority constraints, as argued by the time-geographic framework,
to provide general rules or laws that will limit other potential motorists from having access to
the ‘Bus Only’ lanes, coupled with the lack of institutional framework, as argued by the
structuration theory, that will ensure that ‘the rules of the game in society’ (North, 1993, p.3)
are adhered to, the operation of a pilot BRTS by a quasi-private transport provider in Accra
surely suffered serious setbacks, leading to its demise.
6.5.4. Bad Attitudes of Driving Crew and Maladministration of the Service
The poor attitudinal behaviour of some staff of the MMT towards their work also contributed
to the collapse of the pilot BRTS. In an interview with the management of the company, they
lamented on how some of the drivers did not drive fuel-efficient enough, caused too many
avoidable accidents and were generally apathetic towards the success or otherwise of the
express service. These ill-practises affected the finances of the service. Coupled with the
above, revenue thefts was not uncommon even though these malpractices are not exclusive
only to the former pilot BRTS but to all other services being currently operated by the bus
company. According to the newsletter Metro Mass Weekly,26 in just a week of assuming
office, the managing director reportedly signed the summary dismissal letters of more than 75
workers due to theft of funds.
Perhaps, realising how this illegal act contributed to the collapse of the pilot BRTS
and how it might collapse other current services being operated, the MD and his management
team have mapped out a number of measures to curb the menace of stealing in the company.
26
http://www.metromass.com/newsletter2.pdf Downloaded on 24 March, 2009.

89
Of particular interest is the creation of an Inspection Unit of the Internal Audit Department to
check not only bus drivers and conductors but to also check commuters who attempt to cheat
the company. On several occasions, such random checks were observed in the buses.
However, the effectiveness of this mechanism is yet to be known as some of the bus drivers
and their conductors were also seen signalling to their colleagues coming from the opposite
direction as to the location of the few inspection team, perhaps to cover up their illegalities
before the inspectors got on-board.
Again, some of the drivers were generally discourteous towards the passengers.
Others were also not willing to assist passengers, mostly market women to offload their
goods from the buses on the excuse that they are only paid to drive and such ‘extra’ duties
were to be done solely by the conductors. However, most of the conductors were young
women.
In the same vein, one of my informants, a driver of the bus company who took part in
the pilot project also noticed that administrative lapses could be blame for the demise of the
express service. He was of the view that avoidable delays at the company’s Head Office with
regards to the issuance of tickets occasionally stifled the smooth conduct of business. He
further argued that the monitoring and supervision of the service were inadequate. There were
few or no on-the-spot monitoring of the operations of the BRTS by the field supervisors.
Once that occurs, it was only a matter of time that employees acted in a way that was
detrimental to the success of the pilot BRTS, specifically and to other general services
provided by the company. He was quick to add also that some of the drivers and conductors
too habitually reported late for their duties.
6.5.5 Inadequate Publicity about the Service
According to Mr. Martin Afram, the deputy managing director of the bus company, a public
launch was done to outdoor and also advertise the pilot BRTS to the people of Accra. Besides
this, no major advertisements were done in the print and electronic media. It is therefore
reasonable to expect that most passengers were oblivious as to what that particular service
was all about, their rights and responsibilities as passengers as well as other operational
characteristics such as the arrival and departure times of the pilot BRTS buses and the
approved bus terminals. The people who bore the brunt of the passengers’ frustration at the
system were usually the driving crew comprising the drivers and the conductors.

90
All the three drivers who took part in the interview unanimously recounted their horrible tales
and those of their counterparts who had been verbally and occasionally physically abused and
had unprintable profanities hurled at them when they had enforced the strict policy of not
allowing passengers to disembark at any other point on the corridor but the few selected pilot
BRTS terminals. They further argued that there were several instances where they had had to
by-pass my waiting passengers due to the fact that they stood at the ‘wrong’ place. Some of
the drivers even opted to allow passengers to board so that they could pay later to the
conductors when the buses reached the ticket booths but this practise was disallowed due to
allegations of theft of funds by some their colleague drivers. These unfortunate incidents,
according to them, adversely affected the revenue that could have been made.
Even though the conflict of interest discussed above borders on the lack of relevant
knowledge among the travelling public, some people may hold the opinion that the average
Ghanaian traveller is so used to the trotro culture of boarding and disembarking at his or her
doorstep regardless of the inconvenience it causes other road users, to the extent that no
amount of education could ensure a successful implementation of a BRTS. However, a
professor and expert in transportation geography at the University of Ghana, Samuel Tetteh
Addo holds a contrary opinion. Just like the opinions expressed above, he believes that
inadequate publicity and education could also account for the failure of the pilot BRTS.

91
CHAPTER SEVEN: SUMMARY, CONCLUSION AND RECOMMENDATIONS
7.1. Introduction
This chapter wraps up the study by summarising the various findings and conclusions drawn
for the purpose of this research. Again, recommendations regarding how to forestall the
reoccurrence of the factors that collapsed the pilot BRTS specifically, and by extension, how
to improve upon the overall performance of public transport provision in Accra, are
presented. Some general reflections and suggestions for further research follow.
7.2. Summary and Conclusion
With the use of the former pilot Bus Rapid Transit System (BRTS) on the Kimbu-Adenta
Highway as a case study, this research sought to identify the causes of traffic congestion on
the said corridor; to explore the extent to which traffic congestion was the nemesis of the
pilot project, as well as identifying other possible factors that might have jointly contributed
to collapse the express service. Information obtained from a review of current literature on
the subject, the Time-Geographic framework as well as the Structuration and General
Systems theories respectively were used as keys to unlock and interpret the study.
Concerning the methodology, both primary and secondary sources of generating data
were used. In relation to the primary data, the triangulation approach (i.e. quantitative and
qualitative methods) was adopted even though maximum weight was given to former over
the latter. GIS-based techniques such as the GPS, the stopwatch and a computer readable
traffic congestion registration form were the main tools used in deriving the quantitative data.
The research tools used in generating the qualitative data were: in-depth interviews with five
key informants; semi-structured interviews with three MMT drivers; a focus group discussion
with three MMT passengers and personal observation. Secondary sources of data were
obtained from books and journals, in the libraries and on the internet, census data and
newsletters of the MMT. The study also explored some characteristics of the study area and
the general nature of traffic congestion and public transport delivery in the city of Accra.
With regards to the initial research questions formulated for the study, the following
questions and observations were made:

92
7.2.1. What are the factors that culminate in the occurrence of traffic congestion on the
BRTS corridor?
The study revealed that the Kimbu-Adenta highway on which the pilot BRTS operated is
heavily congested from vehicular traffic albeit with variations with regards to the particular
time of the day, the day of the week, as well as the segments of the road. These variations
correspond with human activities that vary spatio-temporally.
The first factor that culminates in the occurrence of traffic congestion on the said
corridor is the haphazard manner with which various land use types such as residential,
commercial, industrial, recreational and educational are developed and managed. The study
revealed that the CBD is the main hub of all socio-economic activities in Accra ranging from
business and commerce, public administration to education. It therefore comes as no surprise
to realize that traffic congestion is most severe towards Kimbu in the CBD of Accra during
the morning rush hours and towards Adenta during the evening rush hours.
Beside the above mentioned point, land use practices such as siting terminals and
transit points without due regard for planning principles could be blamed for the incidence of
traffic congestion at the study area. It came to light that terminals are built close to the main
corridor. Examples were found at the Zongo Junction and the License Office terminals on the
Kimbu-Adenta highway.
Coupled with the above, the informal economy as represented by the drove of
hawkers and other physically challenged individuals who beg for alms impede vehicular
traffic flow with their commercial activities thereby causing and benefiting as well from the
ensuing traffic congestion on the highway.
Moreover, the existing transport infrastructures (e.g. road network, terminals, signage
and traffic management systems) have been identified as a factor that causes traffic
congestion on the Kimbu-Adenta highway. Not only is the road infrastructure capacity, as it
exists now, woefully inadequate given the quantum of vehicular traffic that uses the road
capacity but they are seldom maintained leading to the development of pot-holes and rain-
eroded earth in the road. Closely tied to this point is the calibration of the signage systems
which was observed as not being proportional to the flow and intensity of vehicular traffic.
They frequently become dysfunctional due to frequent power disruptions. Again, the youth
who sometimes direct traffic flow when the signage systems break down and there are no law
enforcement agencies around, could degenerate into chaotic traffic congestion.

93
7.2.2. To what extent did traffic congestion affect the operations of the pilot BRTS?
The study did indeed reveal that the recurring nature of the traffic congestion on the Kimbu-
Adenta highway was the bane of the pilot BRTS. It is almost next to impossible to expect
motorists to travel at average speed levels which are even close to the posted speed limit of
50 km/hr regardless of the time in the day or the day in the week except on Sundays for the
obvious reason that most Ghanaians are off the road for church and other social activities
which do not necessarily require excessive driving. Traffic congestion made it impossible to
adhere to the policy of putting a VDL Bus on the corridor in every 15 minute time interval. It
was also observed that when the buses are help up in traffic, they waste a lot of productive
man hours; burn fuel inefficiently and causes the buses to develop wear and tear easily.
7.2.3. Are there other factors that jointly contributed to the collapse of the pilot BRTS
project in Accra?
Besides traffic congestion, the study identified other factors which adversely worked against
the pilot project on the said corridor. The first of such factors is the unhealthy competition
that existed between the operators of the express service and private commercial drivers in
Accra. Rather than seeing each other as playing complementary roles in ensuring efficiency
in the provision of transportation services to the public, there was a severe conflict of interest
between the quasi-public and the private operators. The study identified acts of gross
indiscipline, psychological warfare and illegalities embarked upon by the latter to out-
compete the former.
Coupled with the above, the lack of any legislative instrument to give a legal basis for
the operation of an exclusive right-of-way express bus service means that the operation of the
pilot BRTS by the MMT existed only in name but not in reality.
Moreover, internal human factors such as apathy on the part of drivers towards driving fuel-
efficiently, reckless driving and the consequent involvement in accidents, lateness to report
for duty, poor interpersonal skills towards passengers, theft of revenue by the driving crew as
well as administrative lapses could be blamed for contributing to the demise of the pilot
BRTS in Accra.
Finally, it came to light that apart from the public launch of the project, the operators
of the service did not undertake any major publicity or advertisements in the media to

94
adequately inform and educate the travelling public about the existence and the operational
characteristics of the pilot BRTS.
The theoretical frameworks employed in the study have proven quite effective in helping
throw much light on the factors that, in addition to traffic congestion, led to the collapse of
the pilot BRTS in Accra.
With the help of the General Systems theory, for instance, it was identified that two
basic sub-systems within the wider urban environment i.e. land use and transport supply were
largely to blame for the recurring nature of traffic congestion and its subsequent adverse
effects on the pilot BRTS in Accra. As a clear symptom of planning failure in the city, there
is overconcentration of various land use types and socioeconomic activities at the central hub
of the city. Again, bus terminals are constructed without due recognition of the laid down
urban planning and architectural blueprint for the city. Major lapses were also identified in
the supply of transport infrastructures (such as road network, terminals, signage, and traffic
management systems). The failure of the two sub-systems directly affected the third i.e.
traffic flow in the city of Accra.
The Structuration theory also shed light on the extent to which the existing
institutional framework did enable or constrained the functioning of the express bus project in
Accra. The provision and maintenance of road infrastructure is the preserve of the central
government. However, until quite recently, budgetary constraints had limited the amount of
investment government could make into the roads sector. With limited infrastructure vis-a-vis
a growing vehicle population, traffic congestion is inevitable. Therefore, operating an express
bus service like a BRTS on the existing network was such an uphill task. The lack of political
will to deal with the informal economy in a way that could ensure free flow of vehicular
traffic was also identified as a major weakness of the institutional framework of the country.
Traffic law enforcement by the relevant state institutions such as the MTTU and the
Community Protection is also constrained by limited personnel and inadequate logistical
support to deal with motorists’ misconducts.
The Time Geographic framework also conceptualised the level conflict of interest that
existed between some commercial drivers and the pilot BRTS bus drivers and the extent to
which this unfortunate situation served as coupling and capability constraints that eventually
led to the collapse of the express bus pilot project in Accra. However, two of the factors that
conspired to collapse the former pilot BRTS i.e. misconducts of MMT driving crew,
95
maladministration of the express service and the inadequate publicity are all extra
information which is unaccounted for by the theories employed in the study.
7.3. Recommendations
On the basis of the findings that came out of this study, the recommendations below are
aimed at policy makers and future researchers not only to address the challenges that usually
beset public transport provision in cities of the developing world in general but also to create
a congenial environment for a successful implementation of a BRTS in Accra.
7.3.1 Traffic Congestion
The findings from this study suggest that of all the factors that worked against the pilot BRTS
project, traffic congestion is most outstanding. It is therefore imperative to address the several
bottlenecks that culminate in the occurrence of traffic congestion, especially the recurring
type, in order to ensure that public transport service provision is enhanced.
First and foremost, there is the urgent need to improve upon the road infrastructure so
as to increase the capacity of the network to accommodate the soaring fleet of vehicles in the
city. I say so in view of the reality that the existing network capacity is woefully inadequate.
On this note, the recent upgrading of some major highways in Accra, and especially from the
Tetteh Quarshie area through Adenta and beyond, is most commendable. A major weakness
on the highways was usually observed at the junctions, due to the break down or absence of
traffic signage to ensure smooth transition by vehicles that need to join or depart from the
main corridors onto the arterial roads. It is expected that the reconstruction of the highways
will address some of these bottlenecks. Flyovers, for instance, can be constructed at points of
road intersections on major arteries to avoid traffic interference. Priority attention must be
given to Legon (segment 13); Atomic Junction, Zongo Junction, Riss Junction (segments 15-
16) and Barrier (segment 18) for the construction of flyovers to mitigate traffic interference
from drivers who are either departing from, or joining the main Kimbu-Adenta Highway.
Proper traffic management must be put in place to ensure that the traffic light system, for
example, is calibrated to suite the corridor with the heaviest traffic flow (Addo, 2008, field
interview).
However, the expansion of the road capacity should be seen only as a short term solution.
This is because, academic research and practical experience have demonstrated that increases

96
in highway capacity usually lead to increases in vehicle travel – reducing, or in some cases
negating, the congestion-fighting benefits of the projects – a phenomenon known as
‘generated traffic’. It is therefore reasonable to expect that with the completion of the road
expansion on the Tetteh Quarshie –Adenta highway, motorists from Adenta, Madina and the
rest who hitherto were driving through the University of Ghana campus to connect to
Achimota, Abeka, La-Paz, Mallam etc would now find it more convenient to use the highway
instead, resulting in the occurrence of traffic congestion in the long run.
Similar instances of ‘generated traffic’ occurred in the U.S. Evidence from Portland-
Vancouver, which saw the greatest expansion of highway capacity and vehicle travel in the
state, also experienced the greatest degree of congestion growth. Again, a 2000 review of 26
years of transportation data determined that one-third of all new road capacity in the
Baltimore/Washington, D.C. area has been used up by new travel that would not have
occurred without highway expansion. Other studies from across the country (U.S.) show even
greater effects from ‘induced travel’ (Dutzik & Pregulman, 2003).
In the long run, policy makers are advised to visit the issue of congestion pricing. The
idea of congestion pricing usually involves the use of an electronically-collected toll system
to charge drivers more to use the most congested roads at the most congested times but prices
can be cheaper at off-peak times. For busy highway corridors, congestion pricing can be used
to maintain the free flow of traffic. Cities around the world are beginning to use congestion
pricing systems to cut traffic in their urban centers and along heavily-used corridors and as a
means to financially support public transportation.27
Singapore was one of the first large cities to adopt congestion pricing, starting in 1975
with a flat-rate S$3 charge to enter the central business district during morning rush hours.
Other charges and a second cordon area were added later. In 2003, London began charging a
premium to drive into the city's congested business district, where traffic gridlock threatened
the city's economic competitiveness and quality of life. A remarkable thing happened.
Congestion quickly dropped, and average traffic speed increased. Emissions of the most
dangerous air pollutants and greenhouse gases have dropped. London raised hundreds of
millions of dollars in new revenue, which it invested in better transit such as new buses,
delivering immediate benefits to affected commuters. Bus ridership rose dramatically, and
use of bicycles also increased. Initial public skepticism has turned into support, and London's
Mayor Ken Livingston enjoyed popular re-election after adopting the charge.
27
http://www.edf.org/page.cfm?tagID=6241 Accessed on 05.04.2009

97
Norway has put charging systems into practice in several cities, including Oslo, Bergen and
Trondheim. Their systems yielded traffic reductions of about six to ten percent. Initial
revenues tended to be invested in new roads, but Trondheim also used the money raised for
projects such as bicycle paths and a fleet of free bicycles for public use. All three cities use
electronic transponders with manual payment mechanisms as an alternative. Oslo is
considering a plan for a major expansion of their system (ibid).
Stockholm initiated a trial period of cordon pricing for its central city for the first half
of 2006. According to Luciani (2006), traffic passing over the city’s cordon dropped 22 %,
traffic accidents causing injuries fell 5 % to 10 %, and carbon dioxide levels fell 14 % in the
inner city. Since Stockholm is a city made up of many small islands and bridges, it was prone
to traffic snarls and gridlock. Despite this, by the end of the trial period, which went from
January to July, the time it took to drive home during peak hours decreased by a third. In the
process, all forms of public transit rose 6 %, even bike ridership increased.
One could argue that in the economically advanced societies where the
implementation of congestion pricing has been successful, majority of the people are not only
rich but they are enlightened well enough to appreciate the positive benefits of such
initiatives. Even so, some people could see this practise as a human right issue and
discriminatory against the poor who might not be able to pay to enter the cordoned areas in
their private vehicles, especially in countries where the public transit system is also virtually
non-existent. It could also have political implications and politicians would not readily accept
proposals that might cause them to lose votes. The fact that New York City came very close
to getting a congestion pricing plan in spring 2008 but was given cold feet by the state
legislature despite City Council approval (Environmental Defense Fund, 2009) may provide
ample evidence as to the controversy that congestion pricing initiative could generate.
From the foregoing discussion, is it imperative that cities in the economically less
advanced countries like Ghana to adopt congestion pricing to mitigate traffic congestion? The
answer is: yes but it should be adopted in the long run. Yes, because research and practise
have shown that if current trends are not changed, these cities will be overcrowded with cars
and they will be affected the most from the negative externalities associated with congestion.
Owing to differences in economic status between and among the developed and less
developed societies, policy makers in the latter should not adopt completely the congestion
pricing mechanisms in the former. Such initiatives must be tailored to suit local conditions.

98
In Accra, for instance, long term measures must be taken to streamline public transport
operations by strengthening the operational capacity of the MMT with more fleet of vehicles
that are big, comfortable and safe. Besides this, members of the Ghana Road Transport Co-
ordinating Council, which comprises the twenty three privately owned public transport
operators, must be assisted with soft loans to invest in large buses for intra-city operations by
the government. With this mechanism put in place, and followed with massive public
awareness campaigns as to the negative implications of congestion, a pilot congestion pricing
project could be initiated on selected corridors within the CBD and other heavily congested
highways in the city. As observed from the cities that were successful in this project, the
revenues that accrued from pricing were used to benefit travellers directly, by helping to pay
for innovative transit choices and faster travel options. Transparency and accountability must
guard the managers of such projects in cities of the developing countries and with time, the
public will see the tangible benefits and will come to accept the congestion pricing initiative.
It is high time our policy makers eschewed the ‘it-cannot-be-done’ syndrome.
Again, no one can rule out non-recurring traffic congestion, due for instance, to motor
accidents. However, mechanisms must be put in place to quickly identify such incidents with
for example passersby being able to phone and inform the relevant authorities. What usually
happens in Accra presently is that members of the public call into local radio stations to
inform them about such incidents who them relay such information to the police. The
relevant authorities can capitalise on that goodwill of the public to educate them on
emergency telephone numbers they could call to ensure rapid response and management so as
to mitigate traffic congestion from developing. Travellers should be informed with real time
information on roadway conditions so that they would not compound the problem.
Accra’s recurrent traffic congestion can be dealt with in the long run if the city
planners and policy makers make deliberate efforts to break the monopoly of the market
centers in the CBD by encouraging the setting up of other competitive markets in the
peripheries that could attend to the basic needs of shoppers. In the short run, however, the
concept of periodic market outside of the city core could be initiated and strengthened to
redirect the flow of traffic away from the city centre.
Lastly, state licensing authorities, especially the Drivers and Vehicle Licensing
Authority, must be stricter in their licensing policies concerning the number of private cars
that could ply the roads in order that they do not exceed the carrying or infrastructure

99
capacity, which often leads to traffic congestion. This must be done in tandem with improved
public transport system.
7.3.2 “A Successful BRTS in Ghana? Of course! And why not?”
The above heading is a quote from Professor Samuel Tetteh Addo, a renowned transport
geographer with the University of Ghana when asked about the prospects of a future BRTS in
Ghana, given the several decades of the existence of the ‘trotro culture’, and the failure of the
pilot BRTS in Accra.
Quite recently, the government of Ghana, through the Ministry of Road
Transportation and its agencies, especially the Department of Urban Roads, has adopted a
new transportation policy known as the Urban Transport Project (UTP) with the financial
support of the World Bank (US$45.0 million); the Global Environmental Facility (US$ 7.0
million); the Agence Francaise de Development (US$ 27.0 million) and the government of
Ghana (US$16.0 million). The UTP’s policy direction will, among other things, see to the
introduction of a fourty-six million dollar, high capacity, scheduled BRTS.
The project has five main components. According to the UTP’s Brochure for Public
Forum (2008), the first is institutional development, which involves developing capacity (in
the areas of policy formulation, planning, regulation and management of urban passenger
transportation) of Ministries, Departments and Agencies (MDAs) concerned with urban
transport as well as transport operators to provide higher standard urban passenger transport
services. The second is traffic engineering, management and safety which aim at the
introduction of an area wide traffic signal control system for Accra and Kumasi (the second
largest city) where all traffic signals will be linked to a central control centre. Other measures
will include road signs and marking, transport terminal improvement, provision of pedestrian
facilities; bus bays, pedestrian walkways, signalization of selected intersections, covering of
open drains, banning on-street parking and rehabilitation of existing bicycle routes. The third
is the proper development of a Bus Rapid Transit System which will begin with
infrastructure design and implementation, operationalization of the system and a
communications strategy, all through the provision of goods, works and technical advisory
services. The fourth component will see the integration of urban development planning and
transport planning for better environmental management by focusing on some ‘Quick Win
Projects’ drawn out of the recommendations of the 1991 (Greater Accra Metropolitan Area)
GAMA plan. Finally, proper monitoring and evaluation to collect annually traffic and
100
transport data to regularly monitor the performance of the transport system in the Accra
metropolitan area and Kumasi will be done.
A Pilot BRTS Corridor from the CBD to Mallam is fully developed and will become
operational in Accra soon. Basic operational characteristics of the BRTS include: no on-
board fare collection system; closed system; entry/ exit turn stiles; magnetic smart cards and
off site ticket sales.28 It is estimated that the pilot BRTS will reduce travel time from 60
minutes to 25 minutes during the peak hour, attract 10,000 passengers during the peak hour,
increase productivity of bus service (passenger share of large buses) and lead to a reduction
in CO2 emissions along the BRT pilot corridor in Accra (Hesse, 2008).
In order to ensure a successful implementation of another BRTS in Accra, useful
lessons are to be drawn from the failure of the first pilot BRTS on the Kimbu-Adenta
highway. First of all, the decision to use the CBD-Mallam corridor is most ideal since that
corridor has recently been upgraded into multiple lanes. Again, the decision to undertake
major infrastructural works on the Obetsebi Lamptey Circle and the Railway Bridge over the
Odaw River will remove all major bottlenecks from the road network. With a solid
infrastructure, the CBD-Mallam pilot BRTS project will not suffer some of the setbacks that
were identified in the Kimbu-Adenta pilot BRTS.
Coupled with the above, the active participation of the regulatory authority i.e. the
local governments acting through the district and metropolitan assemblies must be
encouraged in order to provide the requisite legislative instruments to ensure the successful
implementation of the project. To achieve this objective, Hesse (2008) who is the UTP Team
Leader notes that institutional reforms are underway to empower the Assemblies to
modernize, plan and regulate urban passenger transport delivery. The Assembly will, among
other things, plan, register, license, and ensure protection for exclusive use of ROWs by
licensed operators. They will also facilitate contact with financial institution for appropriate
credit facilities. This is also a major step in the right direction and it is expected that with
such active involvement of the regulatory framework, the BRTS project will succeed. Closely
tied to this point is the need to adequately resource the MTTU to enforce strict compliance of
the ROWs by the licensed operators so that recalcitrant drivers will be dissuaded from
competing for space with the BRTS buses especially when the other lanes are clogged due to
traffic congestion.
28
See Appendix 6 Design of the BRTS Terminals.

101
Moreover, it is believed that in societies that have ssuccessfully implemented BRTS, ‘they
were only successful when the implementation was integrated with all the stakeholders
participating in the implementation in a sort of systemised approach. Definitely this calls for
a holistic approach’ (Mr. Visschers, MD of MMT, field interview 2008). Against this
backdrop, other identified players in the transport industry should be seen as co-partners.
Once the private transport providers see the new pilot BRTS as a threat to their survival, it is
natural to expect the same kind of unhealthy competition that led to the demise of the Kimbu-
Adenta pilot BRTS project. It is heart-warming to note that in the CBD-Mallam pilot BRTS,
members of the GRTCC are to be assisted to source for bank loans to invest in bigger, high
capacity buses to be used only for the trunk route and CBD circulations. This sense of
ownership of the project must be encouraged by all stakeholders as it holds the key to a
successful implementation of a BRTS in the city of Accra. On the other hand, other private
commercial drivers who will still opt to operate the trotros must only be permitted to operate
as on the adjoining arteries as feeders for the BRTS buses that ply the main corridor.
It is suggested that planners of the BRTS must conduct a feasibility studies to identify
the number of prospective passengers that will use the service so as to adequately prepare for
them. Such feasibility studies must also take on-board potential stops where most passengers
usually disembark so as not to create any inconveniences for the driving crew in the future
when they try to implement the policy to stop only at designated terminals.
Coupled with the above, the management team of the BRTS must also be selected on
the basis of merit to avoid putting square pegs in round holes. Again, monitoring and
effective supervision must be done to ensure that the driving crew do not steal funds or
misbehave towards passengers. As such it will be prudent to employ more field, but not arm
chair, supervisors to do systematic unannounced checks, sometimes on motor bikes so that
they are not constrained in the event of traffic congestion. Stakeholders could look into the
prospects of investing in intelligent transportation system (ITS) so that by the use of modern
technology, the operation of the transport services such as vehicles location, routing systems,
safety issues, travelling times, automation of traffic signage to give priority to advancing
BRTS buses and fuel consumption can be monitored and improved to ensure service quality
and quantity. With such enhanced system, the driving habits of drivers can also be monitored
to ensure efficiency in the system. A unit where driver misconduct can be reported must be
created and the public must be given adequate assurances that such complaints are dealt with.

102
Finally, massive publicity must be made to inform the public before the buses are put on the
road. Major radio stations that have wider coverage as well as the print media must be used to
disseminate information about the service. With education and cultural change, the new
BRTS is bound to overcome some of the bottlenecks that collapse the first one.
7.4. Areas for Further Research
Even though one could argue that the sample size of 120 trips is enough given the time and
financial constraints imposed on this study. However, in order to make conclusions that could
be made more generalisable, it is recommended that the scope of any future research work on
the theme on traffic congestion and its effects on public transport provision must be more
comprehensive. Given adequate resources, future researchers could borrow a leaf from
Quiroga and Bullock’s (1998) one year intensive segment travel time and speed records data
generation in three metropolitan areas of the United States. Rather than concentrating on just
one corridor as was done in this study, the prospects for research on several corridors –and
there are many of such congested corridors – in Accra, could be explored.
Besides the above, this study focused on only one out of the many public transport
providers in Accra. It is recommended for future researches to study the other providers and
to ask how traffic congestion has been affecting their delivery of quality service to the
travelling public. Again, research-worthy questions which answers could be sought for may
include: what are the traffic congestion coping mechanisms employed by these commercial
drivers? What are the policy implications of such coping mechanisms on public transport
provision in general?
Finally, this study gave much attention on the adverse effects of traffic congestion on
the provision of public transport services, using the former BRTS as a case study. The other
adverse effects of traffic congestion, such as air pollution, traffic accidents, etc could be the
focus of future researches.

103
REFERENCES
Abane, M.A. (1993). Tackling Traffic Congestion in Accra, Ghana: A Road User’s
Perspective. In Journal of Advanced Transportation, Volume 27, pp. 193-206
Addo, S.T. (2002) Provision of Urban Transport Services in Accra. SSATP Annual
Conference and Stakeholders' Meeting http://www4.worldbank.org/afr/ssatp/Resources/Presentations/UrbanTransportServices-Accra.pdf
Accessed on 31.01.2009
Affum, J.K., & Taylor, M.A.P. (1999). Integration of Geographic Information Systems and
Models for Transport Planning and Analysis. In Meersman, H., Van Der Voorde, E.,
Winkelsman, W., (Eds.), World Transport Research. Selected Proceedings from the
Eighth World Conference on Transport Research, Vol.3, Transport
Modelling/Assessment. Elsevier-Pergamon, Oxford, pp, 295-308.
Agnew, J. (1987). Place and Politics: The Geographical Mediation of State and Society.
Boston. In Johnston, R.J., Gregory, D., Pratt, G., & Watts, M., (Eds.). (2000).
The Dictionary of Human Geography (4th ed.), Blackwell.
Anyemedu, K., (2000). Trade Union Responses to Globalization: Case Study on Ghana. Discussion Papers. Labour and Society Programme. http://www.ilo.org/inst. Accessed on 02.01.2009
Archer, M. (2004). The Interval Conversation: Mediating Between Structure and Agency.
Cambridge: Cambridge University Press.
Armstrong-Wright, A. (1989). Accra Urban Transport Options Study (AUTOS).
The Ministry of Transport and Communications. Atash, F. (2007). The Deterioration of Urban Environments in Developing Countries:
Mitigating the Air Pollution Crisis in Tehran, Iran. In Cities, Volume 24, Issue 6, pp.
399-409
Auty, R.M (1993). Sustaining Development in Mineral Economies: The Resource Curse
Thesis. London: Routledge.
Baker, T.L. (1990). Doing Social Research. 3rd Edition. McGrawhill, New York.
Baulch, B. (1996). Editiorial. The New Poverty Agenda: A Disputed Consensus.
In IDS Bulletin. Volume. 27, No. 1
Bertallanfy, V.L. (1968), General Systems Theory: Foundations, Development, Applications.
George Brazillier, New York.
Bhaskar, R. (1979). The Possibility of Naturalism, Harvester Press, Hassocks Brewer, J. (2000). Ethnography. Buckingham: Open University Press.
Blach, D.W., Kunze, D., & Pickles, J. (1989). Common Places: Essays on the Nature of
Place. New York: University Press of America. In Johnston, R.J., Gregory, D., Pratt,
G. & Watts, M. (Eds.). (2000). The Dictionary of Human Geography (4th ed.),
Blackwell.
Bordieu, P. (1977). Outline for a Theory of Practise. Cambridge University Press,
Cambridge.

104
Button, K.J., & Hensher, D.A. (Eds.) (2001) Handbook of Transport Systems and Traffic,
Volume 3. Amsterdam : Pergamon Carisma, B & Lowder, S. (Undated) ‘Economic Costs of Traffic Congestion: A Literature
Review for Multiple Locations http://greenconsumerism.net/wp-content/uploads/2008/08/the-
cost-of-traffic-congestion3.pdf Accessed on 22.02.2009
Carlstein, T. (1982). Time Resources, Society and Ecology. London: George Allen and Unwin.
Chevallier, E., Can, A., Nadji, M., & Leclercq, L. (2009) Improving noise assessment at Intersections by Modeling Traffic Dynamics. In Transportation Research Part D,
Volume 14, pp.100–110 www.elsevier.com/locate/trd Accessed 13.03.2009 Chisholm, M (1967). General Systems Theory and Geography.
In Transactions of the Institute of British Geographers, pp. 45-52. http://links.jstor.org/.
Accessed on 28.02.2008
Chuanjiao, S., Wei,Z., & Yuanqing, W., (2008) Scheduling Combination and Headway Optimization of Bus Rapid Transit. In Journal of Transportation
Systems Engineering and Information Technology, Volume 8, Issue 5.
Cho, S.Y., Quek, C., Seah,S.X., & Chong, C.H., (2009). HebbR2-Taffic: A Novel Application of Neuro-fuzzy Network for Visual based Traffic Monitoring System. In Expert Systems with Applications, Volume36, pp. 6343–6356.
www.elsevier.com/locate/eswa Accessed on 15.02.2009
Chorley, R.J (1962). Geomorphology and General Systems Theory. Geological
Survey Professional Paper 500-B. Washington, D.C.: US Government Printing Office
Christopherson, R. W. (2005). Geosystems: An Introduction to Physical Geography.
5th Edition. Prentice Hall, Upper Saddle River, New Jersey.
Cloke, P., Philo, C., and Sadler, D. (1992). Approaching Human Geography: An Introduction
to Contemporary Theoretical Debates. Paul Chapman, London.
Daganzo, C.F., & Cassidy, M.J.,(2008). Effects of High Occupancy Vehicle Lanes on
Freeway Congestion. In Transportation Research Part B: Methodological, Volume
42, Issue 10.
Dargay, J., Gately, D., & Sommer, M. (2007).Vehicle Ownership and Income Growth,
Worldwide: 1960-2030. In Energy Journal, Volume 28, No. 4
Derekenaris, G., Garofalakis, J., Makris, C., Prentzas, J., Sioutas, S., & Tsakalidis, A. (2001).
Integrating GIS, GPS and GSM Technologies for the effective Management of
Ambulances. Elsevier Science Ltd.
Del Casino, V. (2006). Theory in Warf, B. (Ed.) Encyclopaedia of Human Geography.
SAGE Publications, Inc.
Dissanayake, D., & Morikawa, T. (2008). Impact Assessment of Satellite Centre-based
Telecommuting on Travel and Air Quality in Developing Countries by exploring the
link between Travel Behaviour and Urban Form. In Transportation Research Part A:
Policy and Practice.Volume 42, Issue 6, pp. 883-894
Dimitriou, H.T., (1991) (Ed.) Transport Planning for Third World Cities. Routelege, Chapman and Hall, Inc.,
Dowling, R. (2000). Power, Subjectivity and Ethics in Qualitative Research.
In Hay, I. (Ed.), Qualitative Research Methods in Human Geography. Oxford:
Oxford University Press, pp. 23-36.

105
Duncan, A.J. (1986). Quality Control and Industrial Statistics. 5th Edition, Irwind,
Homewood, IL.
Dutzik T., & Pregulman, R. (2003) More Roads, More Traffic: Why Highway
Construction Won’t Solve Traffic Congestion in Washington. WashPIRG Foundation.
http://washpirg.org/WA.asp?id2=10304&id3=WA& Accessed on 23.03.2009
Ellis, F. (2000). Rural Livelihoods and Diversity in Developing Countries.
Oxford University Press.
Ellison, K. (2002). “I Am A Nation Proud”. In Africa News 7 January 2002. <http://www.somaliawatch.org/archivedec01/020107201.htm>. Accessed on 23.03.2009
Ellegård, K. (1999). A Time-geographical Approach to the Study of Everyday Life of Individuals – A Challenge of Complexity. GeoJournal, Volume 48, pp. 167–175. Environmental Defense Fund (2009). Congestion Pricing: A Smart Solution for Reducing Traffic in Urban Centers and Busy Corridors http://www.edf.org/page.cfm?tagID=6241
Accessed on 23.03.2009 Fjellstrom, K. (2003a). Transit reform in Bangkok. In SMART Urban Transport,
Volume 2, Number 3: pp 6-9. --- (2003b). Mass Transit Options: Recent Development in Asia. Paper presented
at meeting, the Better Air Quality 2003, 18 December, at EDSA Shangri-La hotel, Manila, Philippines
Forer, P. (1978). A Place for Plastic Space? Progress in Human Geography. Cited in
Fotheringham, A.S., Brunsdon, C., & Charlton, M. (2000). Quantitative Geography:
Perspectives on Spatial Data Analysis. SAGE Publications
Fouracre, P.R., Kwakye, E.A., Okyere, J.N., & Silcock, D.T (1994). ‘Public transport in
Ghanaian cities - a case of union power’. In Transport Reviews, Volume14,No 1,pp.
45 - 61.
Francois, M.I., & Willis, A., (1995). Developing Effective Congestion Management Systems.
Federal Highway Administration, Technical Report No.8, p.22.
Franklin, C. (1992). An Introduction to Geographic Information Systems: Linking Maps to
Databases. In Database Vol. 15, No. 2. Cited in Derekenaris, G., Garofalakis, J.,
Makris, C., Prentzas, J., Sioutas, S., & Tsakalidis, A. (2001).
Gatrell, J. (2006) Time Geography. In Warf, B. (Ed.) Encyclopaedia of Human Geography.
SAGE Publications, Inc.
Ghana Statistical Service (2002). Population and Housing Census: Special Report of Urban
Localities. GSS, Accra. Gibbs, W.W. (1997) Transportation's perennial problems. In Scientific American , Volume
277 pp. 54–57.
Giddens, A. (1979). Central Problems in Social Theory. Macmillan, London.
--(1984). The Constitution of Society: Outline of the Theory of Structuration.
Polity Press. Cambridge.
Grant, R. & Yankson, P. (2003). City Profile: Accra. In Cities, Volume 20, pp. 65-74.

106
Golledge, R. and R. Stimson. (1997). Spatial Behavior: A Geographic Perspective. New York: The Guilford Press Gregory, D. (1986). Positivism. In Johnston, R.J., Gregory, D., and Smith, D.M. (Eds.),
The Dictionary of Human Geography. Blackwell, Oxford.
--(1994). Geographical Imaginations, Oxford & Cambridge, MA: Blackwell
Guohua, Z., Ming, LI., & Jingxia W. (2007) Journal of Transportation Systems Engineering
& Information Technology Volume 7, Issue 5, October 2007
Hagget, P. (1965). Locational Analysis in Human Geography. London: Edward Arnold.
In Johnston, R.J., Gregory, D., Pratt, G. & Watts, M. (Eds.). (2000). The Dictionary of
Human Geography (4th ed.), Blackwell.
Hagestrand, T. (1973). The Domain of Human Geography. In Chorley, R.J. (Ed.), Directions
in Geography. London: Methuen.
Hägerstrand, T. (1970) What About People in Regional Science? In Papers of the Regional
Science Association, Volume 24, pp. 7-21.
Hartshorne, R. (1939). The Nature of Geography: A Critical Survey of Current in the Light of
the Past. Lancaster, PA: Association of American Geographers. In Johnston, R.J.,
Gregory, D., Pratt, G. & Watts, M. (Eds.). (2000). The Dictionary of Human
Geography (4th ed.), Blackwell.
Hammond, D. (2002). Exploring the Genealogy of Systems Thinking. A Research Paper in Systems Research and Behavioral Science, Volume.19, pp. 429-439.
Hammond, D. (2005). Philosophical and Ethical Foundations of Systems Thinking. In tripleC, 3(2): ISSN 1726-670X. http://tripleC.uti.at. Accessed on 12.02.2009
Harvey, D. (1969) Explanation in Geography. London: Arnold.
--(1973) Social Justice and the City, Arnold, London
-- (1990). The Condition of Postmodernity. Oxford: Blackwell. Cited in Taylor, P.J.
--(2003) Time: From Hegemonic Change to Everyday Life. In Holloway, S. L., Rice,
S.P., &Valentine, G. (eds.) Key Concepts in Geography. SAGE Publications
Hesse, L. A ., (2008). ‘Specific Recommendations for Accra The Urban Transport Project’
Ghana Institution of Engineers (GhIE). Mini-Conference on Traffic Congestion in
Major Cities in Ghana. 21st February 2008 at The Engineer’s Centre, Accra
Holt-Jensen, A. (1999). Geography: History and Concepts: A Student’s Guide.
3rd Edition. SAGE Publications.
IBIS Transport Consultants Ltd (2005). Study of Urban Public Transport Conditions in
Accra, Ghana. Public Private Infrastructure Advisory Facility. www.ppiaf.org/documents/toolkits/UrbanBusToolkit/assets/CaseStudies/full_case/Accra.doc -
Accessed on 14.02.2009
Intikhab Q.A., Huapu Lu., & Shi Ye (2008). Urban Transportation and Equity: A Case Study
of Beijing and Karachi. In Transportation Research Part A: Policy and
Practice, Volume. 42, Issue 1.
107
International Energy Agency (IEA), (2002). Bus systems for the future: Achieving sustainable transport worldwide. Paris: IEA Publications.
Institute for Transportation and Development Policy (ITDP), (2003). Bus Rapid Transit spreads to Africa and Asia. Sustainable Transport Fall 2003: pp 4-11. James, P.E., & Martin, G. (1981) All Possible Worlds: A History of Geographical Ideas.
John Wiley & Sons. New York.
Janelle, D. (1969). Spatial Reorganisation: A Model and a Concept. In Annals of the
Association of American Geographers. Taylor, P.J. (2003) Time: From Hegemonic
Change to Everyday Life. In Holloway, S. L., Rice, S.P., and Valentine, G. (eds.) Key
Concepts in Geography. SAGE Publications.
Janelle, D. G., Goodchild, M. F. & Klinkenberg, B. (1998) The Temporal Ordering of
Urban Space and Daily Activity Patterns for Population role groups. In
Geographical Systems, Volume 5, pp. 117-137.
Jean-Paul R., Claude, C., & and Brian, S. (2006). The Geography of Transport Systems
London : Routledge
Jefferson, C. (1996). Improving Access by Public Transport. In Landscape and Urban
Planning, Volume 35, pp. 173- 179. Elsevier. Johnston, R.J., Gregory, D., Pratt, G. & Watts, M. (Eds.). (2000). The Dictionary of Human
Geography (4th ed.), Blackwell.
Johnston, R.J. (1991). A Question of Place: Exploring the Practise of Human Geography.
Oxford. Blackwell. In Johnston, R.J., Gregory, D., Pratt, G. & Watts, M. (Eds.).
(2000). The Dictionary of Human Geography (4th ed.), Blackwell.
Jørgensen, S.H. & Abane, A.M., (1999). A Comparative Study of Urban Traffic Accidents in
Developing and Developed Countries: Empirical Observations and Problems from
Trondheim (Norway) and Accra (Ghana). In Bulletin of the Ghana Geographical
Association, Volume 21, pp.113-128.
Judicial Service of Ghana (2009). Road Traffic (Amendment) Act 2008, Act 761.
Kent, M. (2003). Space: Making Room for Space in Physical Geography. In Holloway, S. L.,
Rice, S.P., and Valentine, G. (Eds.) Key Concepts in Geography. SAGE Publications
Kitchin, R., & Tate N.J (2000), Conducting research into Human Geography. Prentice Hall.
Kuada, J., & Chachah Y.(1999). Ghana: Understanding the People and Their Culture. Woeli Publishing Services. Accra, Ghana:
Kumar, R. (1996). Research Methodology: A step-by-step guide for beginners.
Sage Publications, London.
Kvale, S.,(1996) Interviews: An introduction to Qualitative Research Interviewing. Thousand
Oaks, Calif. : Sage

108
Kwablah, A. (2008). ‘Infrastructure and Road Use’. Ghana Institution of Engineers (GhIE).
Mini-Conference on Traffic Congestion in Major Cities in Ghana. 21st February 2008
at The Engineer’s Centre, Accra
Kwakye, E.A & Fouracre, P.R (1998) ‘Urban transport policy reform in Ghana’. CODATU VIII Conference, Cape Town.
Kwan, M.-P. (1998) Space-time and Integral Measures of Accessibility: A Comparative
Analysis using a Point-based Framework. In Geographical Analysis, Volume 30,
191-216.
Lomax,T., Turner, S., Shunk, G., Levinson, H.S., Pratt, R.H., Bay, P.N., & Douglas, G.B.
(1997). Quantifying Congestion. Final Report. National Cooperative Highway
Research Program, Transportation Research Board, p.184.
Luciani, P. (2006) Traffic Congestion: The Stockholm Solution, Atlantic Institute for Market Studies http://www.aims.ca/library/Stockholm.pdf Accessed on 31.03.2009
May, T. (1998). Reflexivity in the Age of Reconstructive Social Science. International
Journal of Social Research Methodology, Theory and Practice, Volume 1, No. 1
January & March. Cited in Ryan, T. (2005). Reflexivity and the Reader: An
Illumination in The Ontario Action Researcher. http://www.nipissingu.ca/oar/PDFS/V712.pdf Accessed on 01.01.2009
Metro Mass Weekly Volume1 Edition: 002 Monday, Sept 24-Sunday, Oct 7, 2007
Mikkelsen, B. (2005). Methods for Development Work and Research: A New Guide for
Practitioners. 2nd Edition. Sage Publications, New Delhi.
Miller, H. J. (1999) Measuring Space-time Accessibility benefits within Transportation
Networks: Basic Theory and Computational Methods. In Geographical Analysis,
Volume 31, 187-212
-- (2003) What about People in Geographic Information Science? In D. Unwin (Ed.)
Re-Presenting Geographic Information Systems, John Wiley.
-- (in press). Activities in Space and Time. In P. Stopher, K., Button, K. H., &
Hensher, D. (Eds.) Handbook of Transport Volume 5: Transport Geography and
Spatial Systems, Pergamon/Elsevier Science.
Ministry of Transportation& Ghana Statistical Service (2000-2006). Statistical and Analytical
Report. Transport Sector Programme Support, Phase II (TSPS II). Transportation
Indicators Database Sub-Component.
Mobility 2030: Meeting the challenges to sustainability. The Sustainable Mobility Project Full Report 2004 http://www.wbcsd.org/DocRoot/avxtSPeWT9juCCm4PKkS/mobility-full.pdf.
Accessed on 01.02.2009
Mock, C.N., Forjuoh, S.N., & Rivara, F.P., (1999). Epidemiology of Transport-related
Injuries in Ghana. In Accident Analysis & Prevention, Volume 31, Issue 4, pp. 359-
370
Muller, J.C. (1993). Latest Developments in GIS/LIS. In International Journal of
Geographic Information Systems Vol. 7, No. 4. Cited in Derekenaris, G., Garofalakis,
J., Makris, C., Prentzas, J., Sioutas, S., & Tsakalidis, A. (2001).
Neuman, W.L. (2003). Social Research Methods-Qualitative and Quantitative Approaches.
Allyn and Bacon.

109
Nightingale, D., & Cromby, J. (eds.) (1999). Social Constructionist Psychology,
Buchkingham, Open University Press. Cited in Ryan, T. (2005). Reflexivity and the
Reader: An Illumination in The Ontario Action Researcher.
http://www.nipissingu.ca/oar/PDFS/V712.pdf Accessed on 31.03.2009.
North, D.C. (1993). Institutions, Institutional Change and Economic Performance.
Cambridge: Cambridge University Press.
Ogunjumo, A. & Agbemi, A. (1991) Towards Modal Choice Decision-Making Models: A Case Study of Lagos State Transport Corporation Bus Riders. Transportation
Research A, Volume 25A (6)pp. 391-397. Pergamon Press Ofosu-Dorte, D. (1992). Options for using Mass Transportation Facilities to Reduce
Vehicular Fuel Consumption and Traffic Congestion in Urban areas. Report for the
Ministry of Energy.
Olszewski, P., & Turner, D.J. (1993). New Methods of Controlling Vehicle Ownership and Usage in Singapore. In Transportation. Volume 20, No.4.
Optimum Population Trust. http://www.optimumpopulation.org/opt.more.traffic.html
Accessed on 03.03.2009
Oppong, P.A., Problems of Urban Mobility and Accessibility: the Case of Accra, Ghana. Department of Geography and Resource Development, University of Ghana, Legon. Unpublished M.Phil. Theses, July, 2000.
Palma A. D., & Lindsey, R., (2002). Transportation: Supply and Congestion International Encyclopedia of the Social & Behavioral Sciences , pp.15882-15888. Elsevier Ltd Paniati, J. (2004). Operational Solutions to Traffic Congestion. U.S Department of
Transportation. Federal Highway Administration. http://www.tfhrc.gov/pubrds/04nov/01.htm
Accessed on 01.01.2009
Parker, J. (2000). Structuration Theory. Buckingham. Open University Press.
Parkes, D. & Thrift, N. (1980). Times, Spaces, and Places: A Chronogeographic Perspective New York: John Wiley
Peuquet, D. (2006). Representations of Time. In Warf, B. (Ed.) Encyclopaedia of Human
Geography. SAGE Publications, Inc.
Pidwirny, M. (2006). "Humans and Their Models". Fundamentals of Physical Geography,
2nd Edition. Date Viewed. http://www.physicalgeography.net/fundamentals/4a.html Accessed
on 11.01.2009
Pratt, G. (1989). Quantitative Techniques and Humanistic-Historical Materialist Perspectives.
In Kobayashi, A. & MacKenzie, S. (Eds.), Remaking Human Geography. Boston:
Unwin Hyman.
Pred, A. (1984). Place as Historically Contingent Process: Structuration and the Time
Geography of Becoming Places. In Annals of American Geographers. Vol. 74. In
Johnston, R.J., Gregory, D., Pratt, G. & Watts, M. (Eds.). (2000). The Dictionary of
Human Geography (4th ed.), Blackwell.
Prud'homme, R. (1997) On Transport-related Externalities. In Jornadas de Finanzas
Publicas, Volume 30, pp. 139–156.
Polkinghorne, D.E. (1991. Two Conflicting Calls for Methodological Reform. In Counselling
Psychologist. Volume 19
Pryke, M., Rose, G., &Whatmore, S. (2003) (Eds.) Using Social Theory, London, Sage

110
Quiroga, C.A., & Bullock, D., (1998). Travel Time Studies With Global Positioning and
Geographic Information Systems: An Integrated Methodology. In Transportation
Research Part C6, pp. 101-127. Pergamon.
Quiroga, C.A. (2000), Performance measures and data requirements for congestion
management systems. In Thill J.C. (Ed.), Geographic Information Systems in
Transportation Research (1st ed.). Elsevier Science Limited, Amsterdam, The
Netherlands.
Ragurman, K. (1994). Philosophical debates in Human Geography and their Impacts on
Graduate Students. In Professional Geographer, Volume 46, pp 242-249
Relph, E. (1976). Place and Placelessness. London: Pion. In Johnston, R.J., Gregory, D.,
Pratt, G. & Watts, M. (Eds.). (2000). The Dictionary of Human Geography (4th ed.),
Blackwell.
Rudestam, K.E., & Newton, R.R. (1992). Surviving Your Dissertation: A Comprehensive
Guide to Content & Process. SAGE Publications Inc.
Sayer, A. (1992). Method in Social Science: A Realist Approach. 2nd Edition. Routledge,
London.
Schrank D, & Lomax T. (1999) The 1999 Annual Mobility Report Information For Urban
America, Texas Transportation Institute, Texas A&M University System, College
Station, TX http://mobility.tamu.edu Accessed 13.02.2009
Schaefer, F.K. (1953). Exceptionalism in Geography: A Methodological Examination.
In Annals of the Association of American Geographers, Volume 43. In Johnston, R.J.,
Gregory, D., Pratt, G. & Watts, M. (Eds.). (2000). The Dictionary of Human
Geography (4th ed.), Blackwell.
Schuurman, N. (2004). GIS: A Short Introduction. Blackwell Publishing Ltd.
Schwart, W.L., Suhrbier, J.H., Gardner, B.J.,(1995). Data Collection and Analysis Methods
to support Congestion Management Systems. ASCE Transportation Congress,
Proceedings V.2, San Diego, CA, pp. 2012-2023.
Schneider F., & Enste D.H. (2000) Shadow Economies: Size, Causes, and Consequences
In Journal of Economic Literature, Volume 38 (1), pp. 77-114
Silverman, D. (2006a). Interpreting Qualitative Data: Methods for Analyzing Talk, Text and
Interaction. SAGE London.
-- (1993b). Interpreting Qualitative Data: Methods for Analyzing Talk, Text and
Interaction, 3rd Edition, SAGE Publications
Smith, N. (1984). Uneven Development: Nature, Capital and the Production of Space. Oxford
and Cambridge, MA: Blackwell 2nd Edition. In Johnston, R.J., Gregory, D., Pratt, G.
& Watts, M. (Eds.). (2000). The Dictionary of Human Geography (4th ed.), Blackwell.
Sohail, M., Maunder, D.A.C. , & Miles, D.W.J. (2004). Managing Public Transport in
Developing Countries: Stakeholder Perspectives in Dar es Salaam and Faisalabad. In
International Journal of Transport Management, Volume 2, Issues 3-4, pp. 149-160
Strahler, A. H., & Strahler, A (2003). Physical Geography: Science and Systems of the
Human Environment. 2nd Edition John Wiley and Sons, New York.
111
Stock R.F. (2004) Africa South of the Sahara: A Geographical Interpretation 2nd Edition.
Guilford Press
Stones, R. (2005). Structuration Theory. Palgrave Macmillan.
Stopher P. R. & Meyburg A. H. (1975) Urban Transportation Planning and Modeling. Lexington Books, Lexington, MA. Tamakloe, E.K.A., .Transport. The Future of Our Cities, Proceedings of the Ghana Academy of Arts and Sciences, Volume XXX, Accra, 1993, pp.31-37. Texas Transportation Institute (2004) ‘Urban traffic congestion costs the USA $63 billion per annum’ http://www.citymayors.com/transport/congestion_usa.html Accessed on 14.03.2009
Taylor, M. A.P., Woolley, J.E. and Zito, R. (2000), Integration of the global positioning
system and geographical information systems for traffic congestion studies. In Thill
J.C. (ed.) Geographic Information Systems in Transportation Research (1st ed).
Elsevier Science Limited, Amsterdam, The Netherlands.
Taylor, M.A.P (1992). Exploring the Nature of Urban Traffic Congestion: concepts,
Parameters, Theories and Models. In Proceedings of the Australian Road Research
Board, Volume 16, Issue 5, pp. 83-106
-- (1999). An Extended Family of Traffic Network Equilibria and its Implications for
Land Use and Transport policies. In Meerman, H., Van Der Voode, E., Winkelmans,
W. (Eds.), World Transport Research. Selected Proceedings from the Eight World
Conference on Transport Research, Volume 4, Transport Policy, Elsevier-Pergamon,
Oxford, pp. 29-42.
Taylor, P.J. (2003) Time: From Hegemonic Change to Everyday Life. In Holloway, S. L.,
Rice, S.P., and Valentine, G. (eds.) Key Concepts in Geography. SAGE Publications.
Tackie, F. (2008). ‘The Traffic-Land Use Interdependency’. Ghana Institution of Engineers
(GhIE). Mini-Conference on Traffic Congestion in Major Cities in Ghana. 21st
February 2008 at The Engineer’s Centre, Accra
Texas Transportation Institute (2004) ‘Urban traffic congestion costs the USA $63 billion per
annum’ http://www.citymayors.com/transport/congestion_usa.html Accessed on 18.03.2009
The Ghana Urban Transport Project (2008). ‘Brochure for Public Forum’. Ministry of
Transportation.
Thill, J.C. (2000). Geographic Information Systems for Transportation in Perspective. In
Transport Research Part C, Vol. 8. Elsevier Science Ltd
Thill, J.-C. & Horowitz, J. L. (1997a) Modelling Non-work Destination Choices with choice sets Defined by Travel-time Constraints. In Fischer, M. M. & Getis, A. (Eds.) Recent
Developments in Spatial Analysis: Spatial Statistics, Behavioual Modelling and
Computational Intelligence, Springer-Verlag, 186-208. --(1997b) Travel Time Constraints on Destination-choice Sets. In Geographical
Analysis, Volume 29, pp. 108-123.
Thompson, J.B. (1989). The Theory of Structuration. In Social Theory of Modern Societies:
Anthony Giddens and His Critics. Held, D. & Thompson, J.B. (eds.). Cambridge:
Cambridge University Press.
112
Tuan, Y.-F. (1977). Space and Place: The Perspective of Experience. Minneapolis: University
of Minnesota. In Johnston, R.J., Gregory, D., Pratt, G. & Watts, M. (Eds.). (2000).
The Dictionary of Human Geography (4th ed.), Blackwell.
Unwin, T. (1992). The Place of Geography. Longman, Harlow.
Walsh, M. (1990) Global Trends in Motor Vehicle use and Emissions. In Annual Review of Energy, Volume 15, pp. 217-243
Wallerstein, I. (1998). The Interventions of TimeSpace Realities. In Geography, Volume73.
Cited in Taylor, P.J. (2003) Time: From Hegemonic Change to Everyday Life. In
Holloway, S. L., Rice, S.P., and Valentine, G. (eds.) Key Concepts in Geography.
SAGE Publications
Warf B., (2006) Encyclopedia of human geography Thousand Oaks, Calif. : Sage
Wane, H.R. (2001). Urban Mobility and Emissions : Towards Accurate Standards for Sub-
Saharan Africa. A Research Program and Results on a Sahelian Case: The District of
Bamako.” At the Session on Air Pollution, Accra, Ghana, April 18-20, 2001
http://www.worldbank.org/transport/utsr/accra/wane.pdf Accessed on 11.03.2008 Wang, R., & Ruskin, H.J. (2002) Modeling Traffic Flow at a Single-lane Urban Roundabout.
In Computer Physics Communications, Volume 147, pp. 570–576 www.elsevier.com/locate/cpc Accessed on 04.12.2008
Webb, A., (1993). Curitiba’s Surface Metro. In The Urban Transport Industries Report.
Campden, Hong Kong. Cited in Jefferson, C. (1996) Improving Access by Public
Transport. In Landscape and Urban Planning, Vol. 35. Issues 2-3.
Werlen, B. (1993). Society, Action and Space. An Alternative Human geography.
Routledge, London and New York
White, H. (2002). Combining Quantitative and Qualitative Approaches in Poverty Analysis.
In World Development, Vol. 30, No. 3
Willoughby, C. (2001). Singapore's Motorization Policies 1960–2000. In Transport
Policy, Volume 8, Issue 2, pp. 125-139
Wright, L. (2002). Bus Rapid Transit, Sustainable transport: A Sourcebook for Policy- Makers in Developing Cities. Eschborn: DeutscheGesellschaft fur Technische Zusammenarbeit (GTZ) GmbH.
Wohrnschimmel,W., Zuk, M., Martınez-Villa, G., Ceron, J., Cardenas, B., Rojas-Bracho, L., & Ferna´ndez-Bremauntz, A. (2008) The impact of a Bus Rapid Transit system on commuters’ exposure to Benzene, CO, PM2.5 and PM10 in Mexico City. In Atmospheric Environment, Volume 42, pp. 8194–8203 : www.elsevier.com/locate/atmosenv
Accessed on 23.12.2008
Wu, Y.-H. and Miller, H. J. (2002), Computational Tools for Measuring Space-time
Accessibility within Transportation Networks with Dynamic Flow. In Journal of
Transportation and Statistics, Volume 4 Issues 2&3, pp.1-14.
Yu, H. & Shaw, S-L. (2007). Revisiting Hägerstrand’s time-geographic framework for individual activities in the age of instant access. In Miller, H.J (ed) Societies and
Cities in the Age of Instant Access, The GeoJournal Library, Volume 88, Springer

113
URL’s Visited
http://www.visitandlearn.co.uk http://www.meteo.gov.gh http://www.bbc.co.uk
http://www.ghanadistricts.com
http://nrsc.gov.gh
https://www.cia.gov/
http://www.mrt.gov.gh/
www.sciencedirect.com
http://metromass.com/
www.interscience.wiley.com
www.esri.com

114
APPENDIX 1 TRAFFIC CONGESTION REGISTRATION FORM

115
APPENDIX 2. INTERVIEW GUIDE FOR KEY INFORMANTS
(MANAGEMENT OF THE MMT)
Background
1.Can you please start by telling me a little bit about yourself and what you do in the Metro
Mass Transit Limited?
Operations of Bus Rapid Transit System in Accra
2. Can you describe to me the kinds/types of bus services rendered by MMTL to the travelling public?
3. Can you describe to me what a Bus Rapid Transit System is?
4. May I know when you started implementing the BRTS?
5. Can you discuss with me how the BRTS was supposed to operate?
6. May I know why the MMTL decided to offer this particular kind of service?
7. Can you show me where or which corridor(s) were selected for the BRTS?
8. What was the average number of BRTS buses that plied the selected corridor on a daily basis?
9. May I know to whom the BRTS was targeted at?
10. Would you say that the initial pilot BRTS project was a success? If so, how in terms of ...
Economic gains/profits
Social benefits
Environmental benefits etc.
11.When did the MMTL officially revert from the ‘express’ BRTS to a ‘regular’ bus service?
12. Can you describe to me how the ‘regular’ bus service operates now vis-a-vis the former BRTS?
13. Why did the Company take the decision to opt for a ‘regular’ bus service?
Congestion on the corridors of Accra
14. Can you share with me your thoughts about what traffic congestion is?
15. Concerning the former BRTS corridor(s), can you discuss with me which segments of the corridor
were the hot spots for traffic congestion?
16. Would you say that the nature or type of traffic congestion on this corridor was either recurrent
(frequently occurring), occasional or both? Explain.
17. When does this corridor usually experience traffic congestion?
18. May I know from you what you think might be the reasons for the occurrence of traffic congestion
on this particular corridor?

116
Congestion versus the operations of a BRTS in Accra
19. To what extent did traffic congestion affect the smooth operations of the former BRTS, in terms
of:
-operational costs to the Company
- service quantity
- service quality e.g. meeting time schedules, peak hour overcrowding etc.
- Others
20. Would you say that the incidence of traffic congestion on this corridor is the main primary cause
for the ‘failure’ of the BRTS?
21. Can you share with me if there are other possible factors that might have conspired to collapse the
operations of the BRTS? E.g. complaints from passengers about the attitude of the driving crew, loss
of revenue due to theft, stiff intermodal competition especially from the single operator services like
taxis, trotros etc.
Useful lessons to be learnt for future BRTS in Accra
22. Do you think the operations of a BRTS in the future can be made possible, even on the congested
streets of Accra? If yes, how?
23. How do you think the involvement of all major stakeholders, e.g. highway authorities,
representatives of single operator services, the police department (who will enforce traffic laws and
ensure safety and security of BRTS workers and customers) and indeed the general public, during the
initial planning and development of a BRTS project contribute to making it a success?
24. Do you think the packaging of the system elements, e.g. provisions of exclusive, traffic-free-bus-
only lanes and safe pedestrian access to bus stations enable the running of a BRTS? How?
25. Do you think the development of a unique image and identity, such as the use of special graphics
to convey information (e.g. where to catch a BRTS service) and opportunities for advertisement on
BRTS buses make their operations successful? How?
26. Will the introduction and adoption of Information Technology Systems (ITS) that could for
instance monitor/control bus operations; provide priority at signalised intersections; enhance safety
and security on board vehicles and at bus stations etc make future BRTS operations successful? How?
27. What do you think about the desirability of off-board fare collection for the BRTS services?
28. What are you views on how to improve upon service quality when it comes to operating a BRTS?
29. What are you views on how to improve upon service quantity when it comes to operating a
BRTS?
30. If there were other factors, such as theft of revenues; poor driver-passenger relations etc that
contributed to the ‘failure’ of the BRTS, what must operators of a future BRTS do to check some of
these things?
31. Are there other useful lessons that are worthy to note for a successful future BRTS operations in
Accra? Thank you.
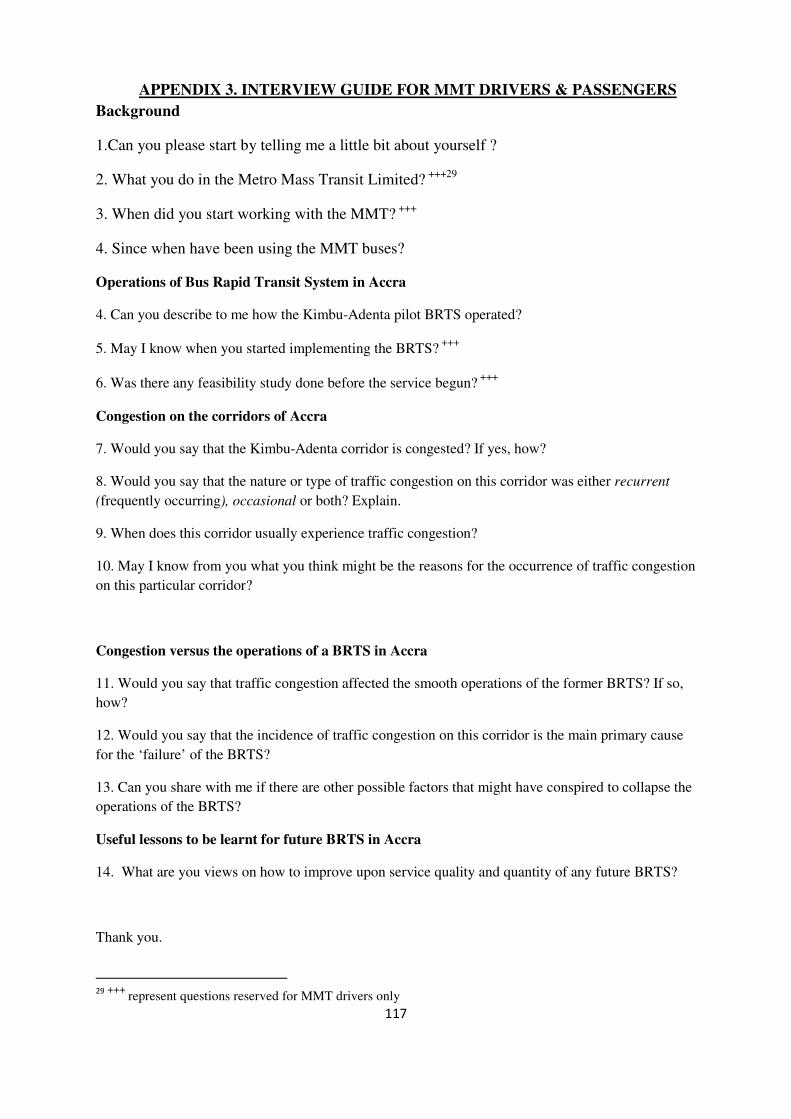
117
APPENDIX 3. INTERVIEW GUIDE FOR MMT DRIVERS & PASSENGERS
Background
1.Can you please start by telling me a little bit about yourself ?
2. What you do in the Metro Mass Transit Limited? +++29
3. When did you start working with the MMT? +++
4. Since when have been using the MMT buses?
Operations of Bus Rapid Transit System in Accra
4. Can you describe to me how the Kimbu-Adenta pilot BRTS operated?
5. May I know when you started implementing the BRTS? +++
6. Was there any feasibility study done before the service begun? +++
Congestion on the corridors of Accra
7. Would you say that the Kimbu-Adenta corridor is congested? If yes, how?
8. Would you say that the nature or type of traffic congestion on this corridor was either recurrent
(frequently occurring), occasional or both? Explain.
9. When does this corridor usually experience traffic congestion?
10. May I know from you what you think might be the reasons for the occurrence of traffic congestion
on this particular corridor?
Congestion versus the operations of a BRTS in Accra
11. Would you say that traffic congestion affected the smooth operations of the former BRTS? If so,
how?
12. Would you say that the incidence of traffic congestion on this corridor is the main primary cause
for the ‘failure’ of the BRTS?
13. Can you share with me if there are other possible factors that might have conspired to collapse the
operations of the BRTS?
Useful lessons to be learnt for future BRTS in Accra
14. What are you views on how to improve upon service quality and quantity of any future BRTS?
Thank you.
29
+++
represent questions reserved for MMT drivers only

118
APPENDIX 4. INTERVIEW GUIDE FOR KEY INFORMANTS
(PUBLIC TRANSPORT POLICY MAKERS AND EXPERTS)
Operations of Bus Rapid Transit System in Accra
1. Can you describe to me the nature and purpose of the MMT?
2. Can you describe to me what a Bus Rapid Transit System is?
3. Did the MMT implement a BRTS, although on a pilot basis?
4. What was the official involvement of the state institutions in the pilot BRTS?*** 30
5. What are some of the key challenges the pilot BRTS was likely to encounter?
6. Has the state any plans of its own to operate a BRTS?***
7. Can you share with me how the BRTS of the state will be different from the MMT BRTS?***
Useful lessons to be learnt for future BRTS in Accra
7. Do you think the operations of a BRTS in the future can be made possible, even on the congested
streets of Accra?
8. If yes, which measures can be put in place to avoid the challenges that led to the collapse of the
MMT BRTS?
Thank you.
30
*** represents questions reserved for the government officials only

119
APPENDIX 5. CONGESTION SCOREBOARD on the KIMBU-ADENTA CORRIDOR
Segment ID 1 2 3 4 5 6 7 8 9 10
Segment Length (in Metres) 1786.94 1343.05 853.85 1251.33 391.31 799.3 725.58 434.8 494.93 568.43
Posted Speed Limit (Km/h) 50 50 50 50 50 50 50 50 50 50
AM Peak
Average Travel Speed (Km/h) 24.92 27.02 26.47 47.05 15.1 22.08 33.56 22.61 20.29 21.09
Median Travel Speed (Km/h) 12.66 13.43 25.62 37.54 11.74 15.99 43.53 26.09 14.85 17.05
Cumulative Travel Speed (Mins.) 8.95 15.2 17.8 20.1 22.2 26.3 28.04 29.59 31.54 33.99
Off Peak
Average Travel Speed (Km/h) 27.06 39.49 34.26 41.22 13.41 29.96 30.71 20.7 21.89 32.19
Median Travel Speed (Km/h) 21.44 40.29 25.62 37.54 11.74 23.98 21.77 26.09 22.27 34.11
Cumulative Travel Speed (Mins) 5.73 8.31 10.73 13.32 15.61 18.26 20.07 21.62 23.37 24.57
PM Peak
Average Travel Speed (Km/h) 23.15 20.45 21.29 23.56 12.82 31.77 28.66 20.82 17.73 28.28
Median Travel Speed (Km/h) 26.8 18.13 14.94 15.02 11.74 23.98 21.77 26.09 14.85 34.11
Cumulative Travel Speed (Mins) 5 9.75 13.79 18.28 20.33 22.25 24.09 26.05 28.8 30.24
Segment ID 11 12 13 14 15 16 17 18 19
Segment Length (in Metres) 1094.2 1894.75 745.1 2299.2 727.64 1408.87 1137.36 899.21 540.38
Posted Speed Limit (Km/h) 50 50 50 50 50 50 50 50 50
AM Peak
Average Travel Speed (Km/h) 34.5 30.77 26.86 31.91 16.48 26.71 20.19 22.35 15.59
Median Travel Speed (Km/h) 24.62 9.47 22.35 12.54 14.55 16.91 11.37 13.49 13.51
Cumulative Travel Speed (Mins) 37.93 49.38 52.16 63.16 68.01 73.56 80.41 84.41 87.16
Off Peak
Average Travel Speed (Km/h) 40.09 44.89 30.61 33.15 15.62 20.82 20.65 19.02 15.77
Median Travel Speed (Km/h) 32.83 37.9 22.35 27.59 14.55 14.09 17.06 17.98 16.21
Cumulative Travel Speed (Mins) 26.66 30.05 32.05 38.13 42.37 48.55 52.87 56.89 59.33
PM Peak
Average Travel Speed (Km/h) 16.9 19.9 14.05 30.89 8.68 22.02 14.55 5.08 9.87
Median Travel Speed (Km/h) 12.04 18.95 14.9 27.59 7.28 14.09 11.37 4.15 10.81
Cumulative Travel Speed (Mins) 35.59 41.59 45.54 50.89 57.14 63.63 70.48 82.33 86.28

120
APPENDIX 6. DESIGN OF THE BRTS TERMINALS.
Source: Urban Transport Project, 2008