aha dallas caruth ami advisory symposium june 3 – 4, 2011 oral anticoagulation: what’s new?...
TRANSCRIPT
AHA Dallas Caruth AMI Advisory Symposium June 3 – 4, 2011
Oral Anticoagulation: What’s New?
Henry I. Bussey, Pharm.D., FCCP
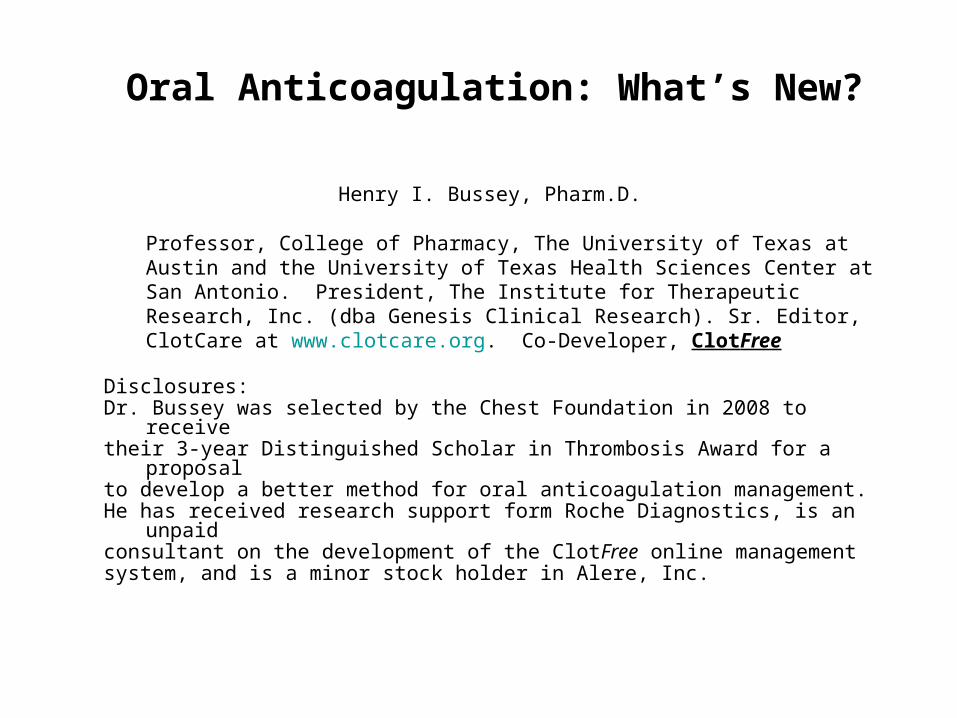
Oral Anticoagulation: What’s New?
Henry I. Bussey, Pharm.D.
Professor, College of Pharmacy, The University of Texas at Austin and the University of Texas Health Sciences Center at San Antonio. President, The Institute for Therapeutic Research, Inc. (dba Genesis Clinical Research). Sr. Editor, ClotCare at www.clotcare.org. Co-Developer, ClotFree
Disclosures: Dr. Bussey was selected by the Chest Foundation in 2008 to receivetheir 3-year Distinguished Scholar in Thrombosis Award for a proposal to develop a better method for oral anticoagulation management.He has received research support form Roche Diagnostics, is an unpaid consultant on the development of the ClotFree online management system, and is a minor stock holder in Alere, Inc.
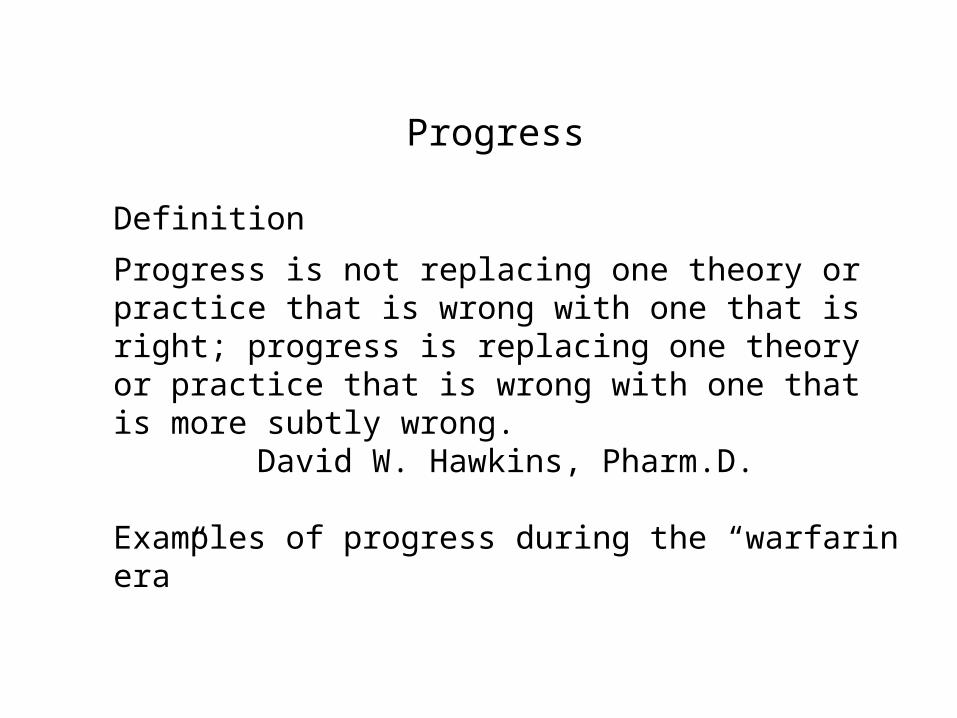
Progress
Definition
Progress is not replacing one theory or practice that is wrong with one that is right; progress is replacing one theory or practice that is wrong with one that is more subtly wrong.
David W. Hawkins, Pharm.D.
Examples of progress during the “warfarin era”
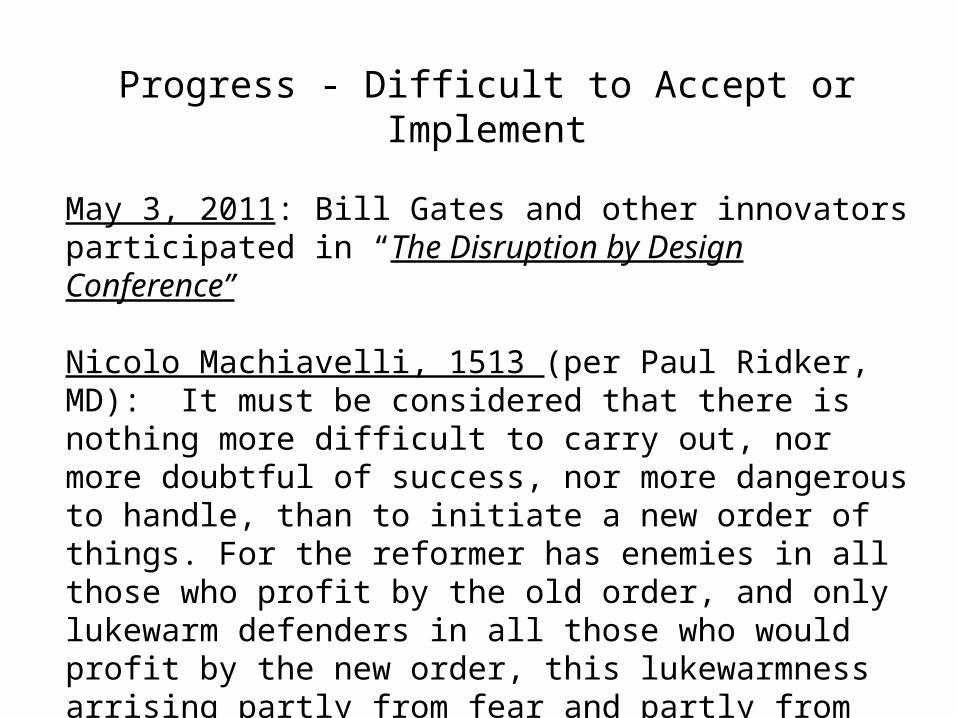
Progress - Difficult to Accept or Implement
May 3, 2011: Bill Gates and other innovators participated in “The Disruption by Design Conference”
Nicolo Machiavelli, 1513 (per Paul Ridker, MD): It must be considered that there is nothing more difficult to carry out, nor more doubtful of success, nor more dangerous to handle, than to initiate a new order of things. For the reformer has enemies in all those who profit by the old order, and only lukewarm defenders in all those who would profit by the new order, this lukewarmness arrising partly from fear and partly from the incredulity of mankind, who do not believe in anything new until they have had an actual experience of it.
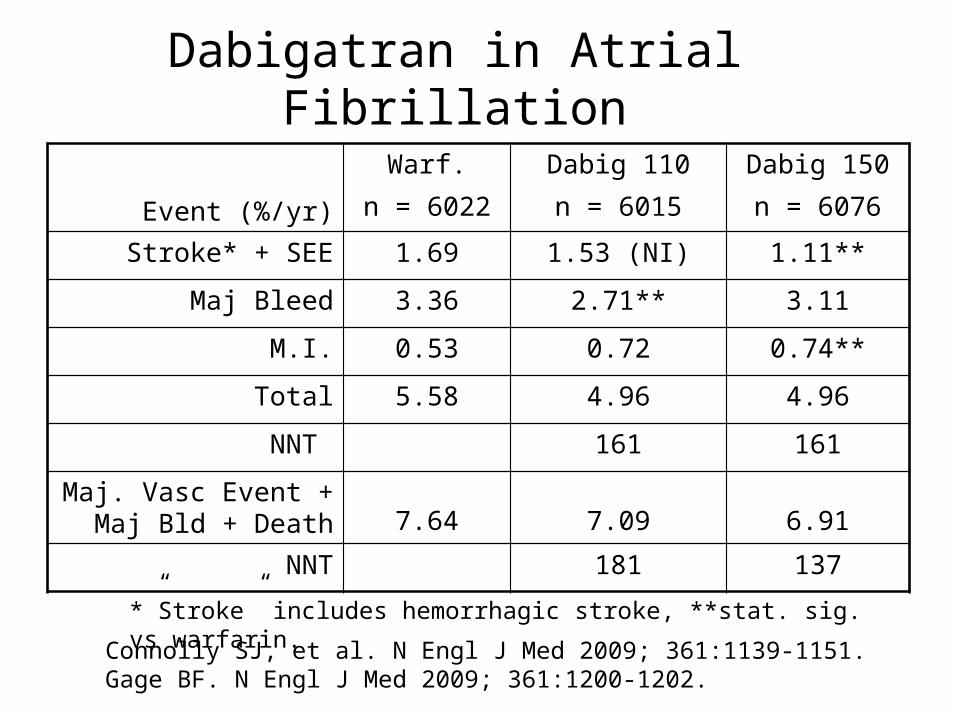
Dabigatran in Atrial Fibrillation
Event (%/yr)
Warf.n = 6022
Dabig 110n = 6015
Dabig 150n = 6076
Stroke* + SEE 1.69 1.53 (NI) 1.11**
Maj Bleed 3.36 2.71** 3.11
M.I. 0.53 0.72 0.74**
Total 5.58 4.96 4.96
NNT 161 161
Maj. Vasc Event + Maj Bld + Death 7.64 7.09 6.91
NNT 181 137
Connolly SJ, et al. N Engl J Med 2009; 361:1139-1151.Gage BF. N Engl J Med 2009; 361:1200-1202.
*”Stroke” includes hemorrhagic stroke, **stat. sig. vs warfarin.
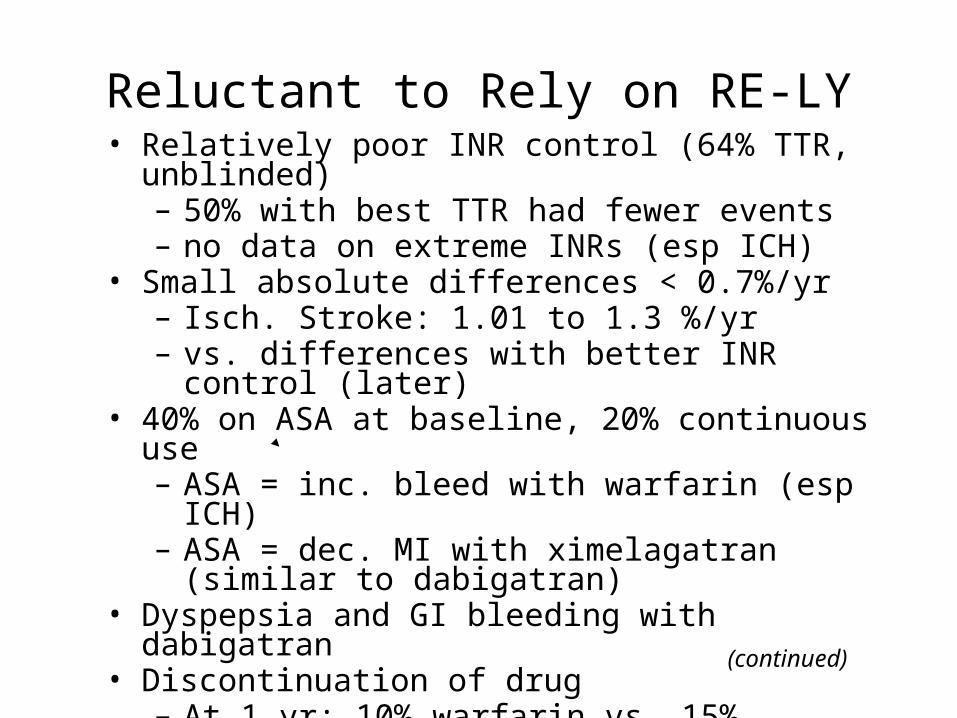
Reluctant to Rely on RE-LY• Relatively poor INR control (64% TTR, unblinded)
– 50% with best TTR had fewer events– no data on extreme INRs (esp ICH)
• Small absolute differences < 0.7%/yr– Isch. Stroke: 1.01 to 1.3 %/yr – vs. differences with better INR control (later)
• 40% on ASA at baseline, 20% continuous use – ASA = inc. bleed with warfarin (esp ICH)– ASA = dec. MI with ximelagatran (similar to dabigatran)
• Dyspepsia and GI bleeding with dabigatran• Discontinuation of drug
– At 1 yr: 10% warfarin vs. 15% dabigatran– At 2 yr: 17% warfarin vs. 21% dabigatran
(continued)
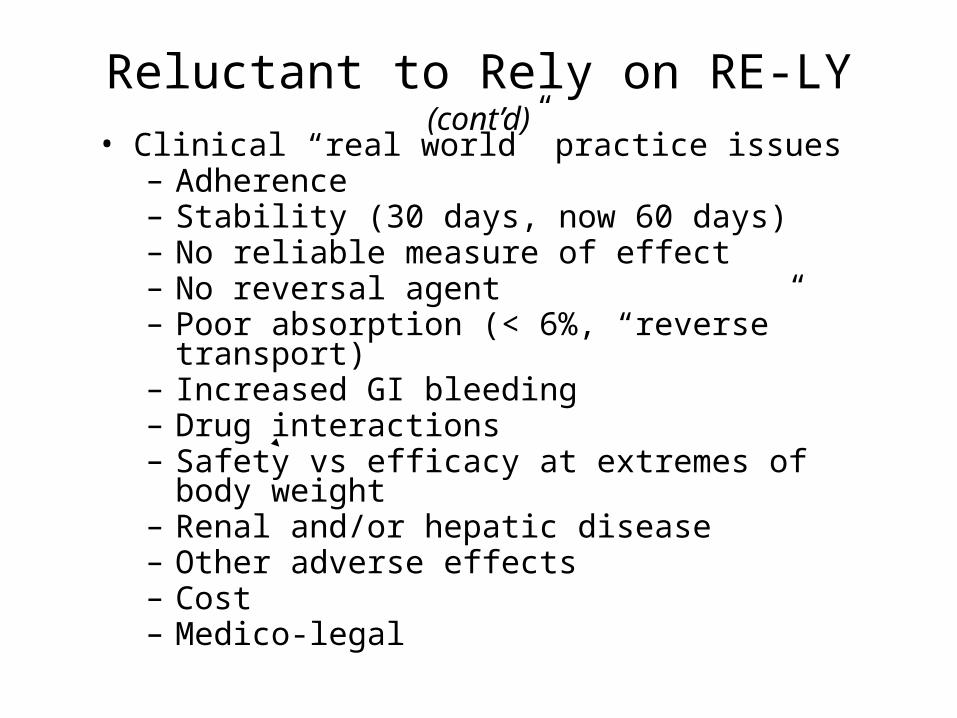
Reluctant to Rely on RE-LY (cont’d)• Clinical “real world” practice issues
– Adherence– Stability (30 days, now 60 days)– No reliable measure of effect– No reversal agent– Poor absorption (< 6%, “reverse” transport)– Increased GI bleeding– Drug interactions– Safety vs efficacy at extremes of body weight– Renal and/or hepatic disease– Other adverse effects– Cost– Medico-legal
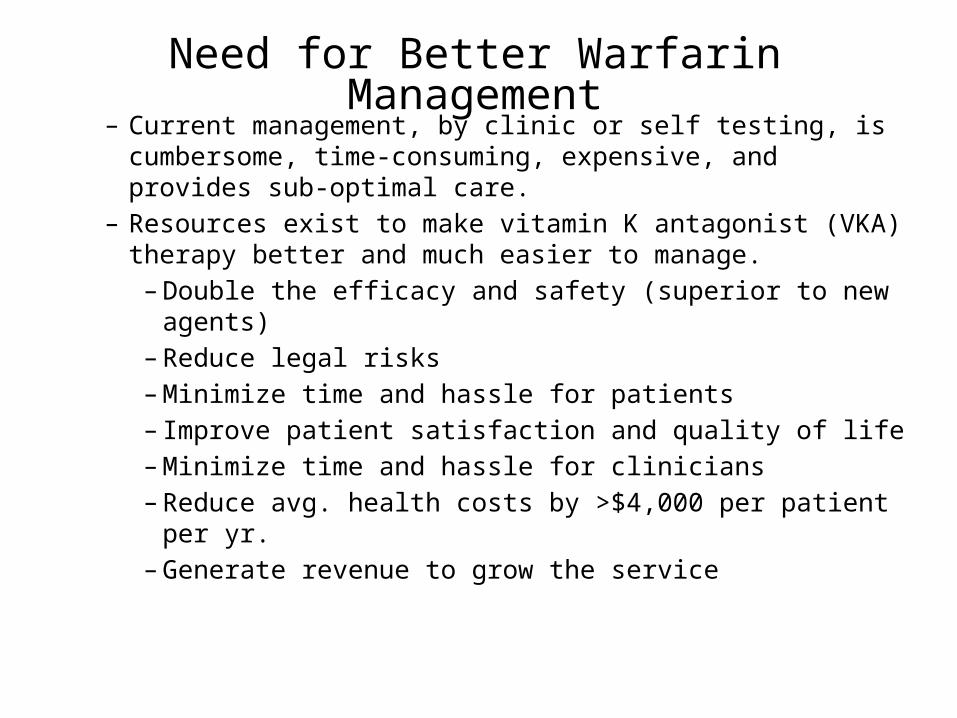
Need for Better Warfarin Management– Current management, by clinic or self testing, is
cumbersome, time-consuming, expensive, and provides sub-optimal care.
– Resources exist to make vitamin K antagonist (VKA) therapy better and much easier to manage.
– Double the efficacy and safety (superior to new agents)– Reduce legal risks– Minimize time and hassle for patients– Improve patient satisfaction and quality of life– Minimize time and hassle for clinicians– Reduce avg. health costs by >$4,000 per patient per yr.– Generate revenue to grow the service
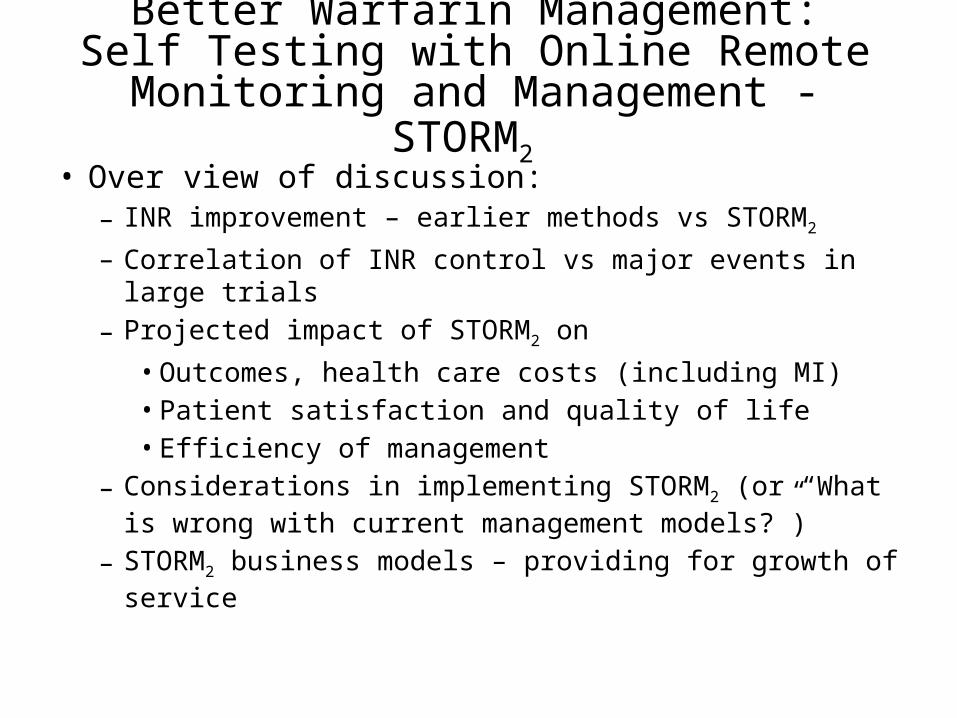
Better Warfarin Management:Self Testing with Online Remote Monitoring
and Management - STORM2
• Over view of discussion:– INR improvement – earlier methods vs STORM2
– Correlation of INR control vs major events in large trials
– Projected impact of STORM2 on
• Outcomes, health care costs (including MI)• Patient satisfaction and quality of life• Efficiency of management
– Considerations in implementing STORM2 (or “What is wrong with current management models?”)
– STORM2 business models – providing for growth of service
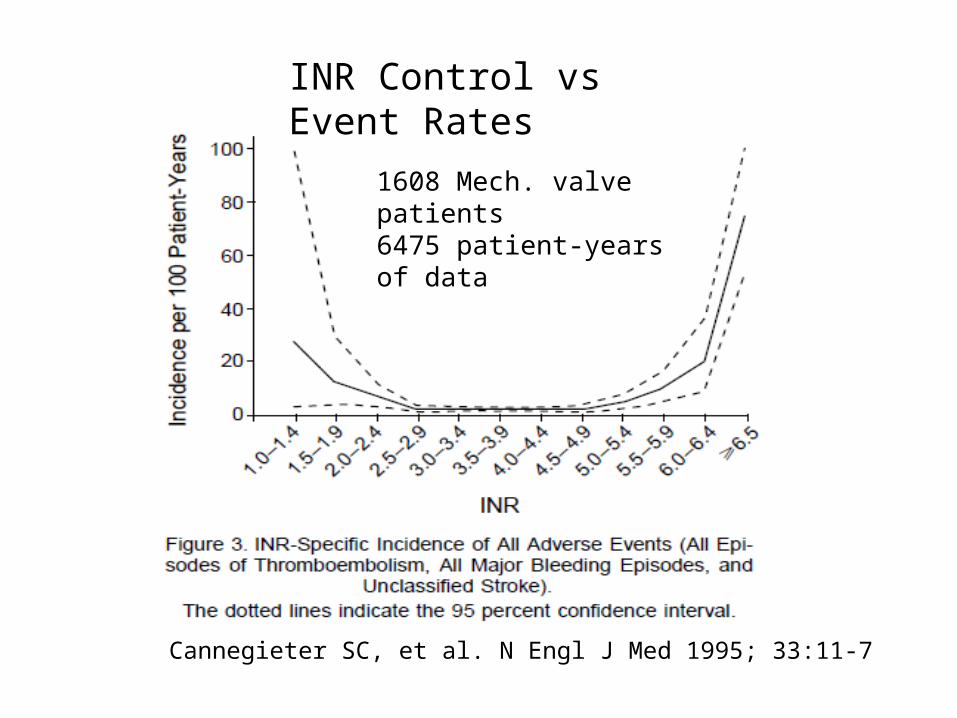
1608 Mech. valve patients6475 patient-years of data
INR Control vs Event Rates
Cannegieter SC, et al. N Engl J Med 1995; 33:11-7
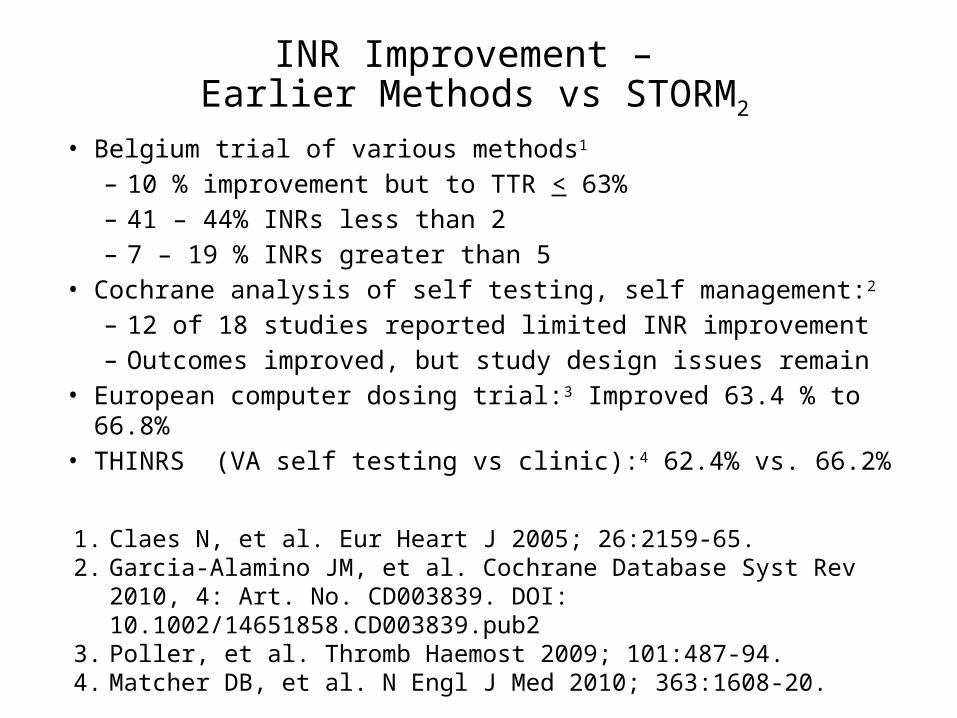
INR Improvement – Earlier Methods vs STORM2
• Belgium trial of various methods1
– 10 % improvement but to TTR < 63%– 41 – 44% INRs less than 2– 7 – 19 % INRs greater than 5
• Cochrane analysis of self testing, self management:2 – 12 of 18 studies reported limited INR improvement– Outcomes improved, but study design issues remain
• European computer dosing trial:3 Improved 63.4 % to 66.8%• THINRS (VA self testing vs clinic):4 62.4% vs. 66.2%1. Claes N, et al. Eur Heart J 2005; 26:2159-65.2. Garcia-Alamino JM, et al. Cochrane Database Syst Rev 2010, 4: Art. No.
CD003839. DOI: 10.1002/14651858.CD003839.pub23. Poller, et al. Thromb Haemost 2009; 101:487-94.4. Matcher DB, et al. N Engl J Med 2010; 363:1608-20.
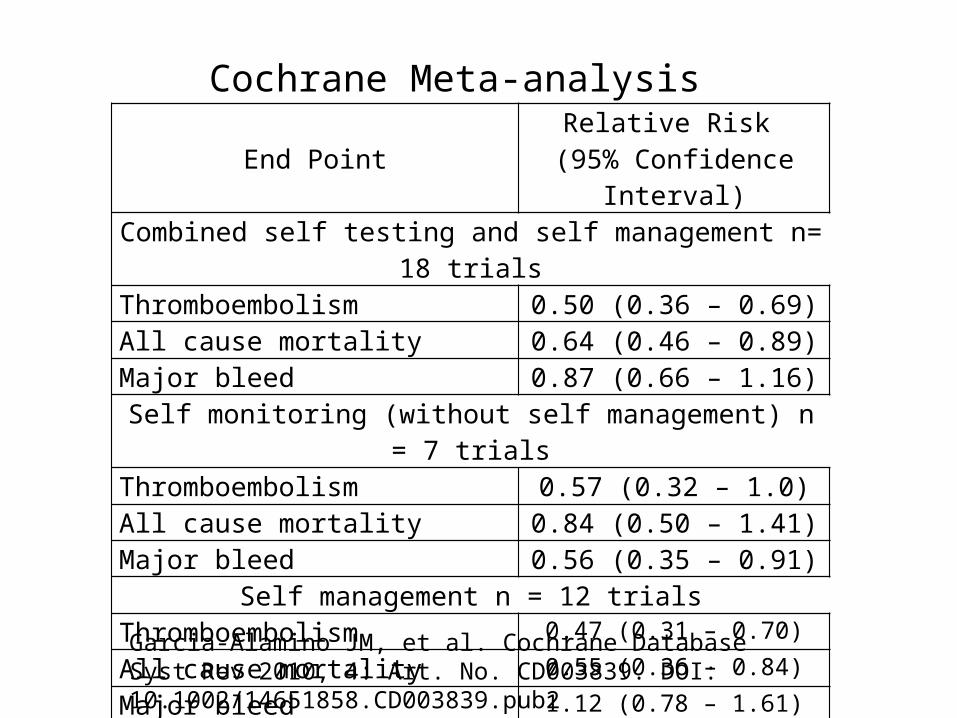
Cochrane Meta-analysis
End PointRelative Risk
(95% Confidence Interval)Combined self testing and self management n= 18 trials
Thromboembolism 0.50 (0.36 – 0.69)All cause mortality 0.64 (0.46 – 0.89)Major bleed 0.87 (0.66 – 1.16)
Self monitoring (without self management) n = 7 trialsThromboembolism 0.57 (0.32 – 1.0)All cause mortality 0.84 (0.50 – 1.41)Major bleed 0.56 (0.35 – 0.91)
Self management n = 12 trialsThromboembolism 0.47 (0.31 – 0.70)
All cause mortality 0.55 (0.36 – 0.84)
Major bleed 1.12 (0.78 – 1.61)
Garcia-Alamino JM, et al. Cochrane Database Syst Rev 2010, 4: Art. No. CD003839. DOI: 10.1002/14651858.CD003839.pub2
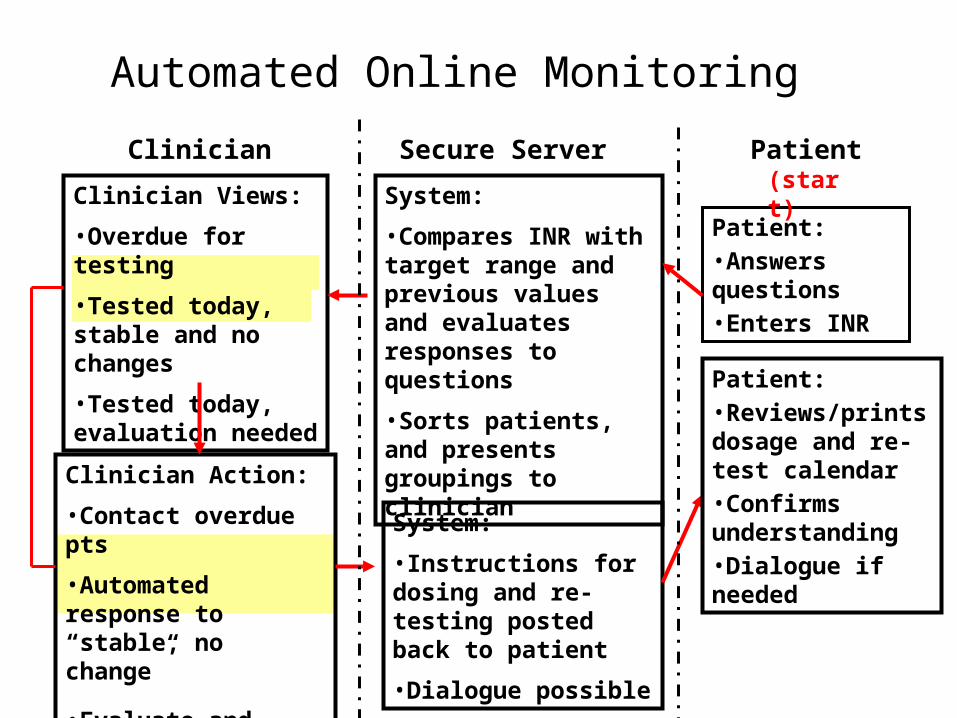
Automated Online Monitoring
Patient: •Answers questions •Enters INR
System:
•Compares INR with target range and previous values and evaluates responses to questions
•Sorts patients, and presents groupings to clinician
Clinician Views:
•Overdue for testing
•Tested today, stable and no changes
•Tested today, evaluation needed
Clinician Action:
•Contact overdue pts
•Automated response to “stable, no change”
•Evaluate and instruct pts needing evaluation
PatientSecure ServerClinician
System:
•Instructions for dosing and re-testing posted back to patient
•Dialogue possible
(start)
Patient:•Reviews/prints dosage and re-test calendar•Confirms understanding•Dialogue if needed
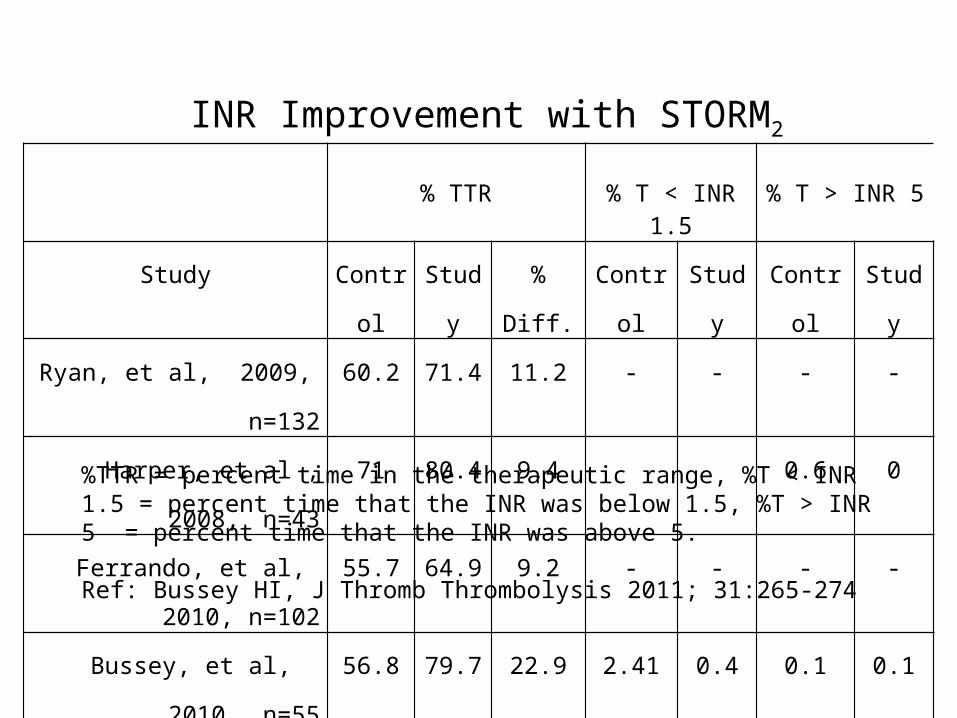
INR Improvement with STORM2
% TTR % T < INR 1.5 % T > INR 5
Study Control Study % Diff. Control Study Control Study
Ryan, et al, 2009, n=132 60.2 71.4 11.2 - - - -
Harper, et al , 2008, n=43 71 80.4 9.4 0.6 0
Ferrando, et al, 2010, n=102 55.7 64.9 9.2 - - - -
Bussey, et al, 2010, n=55 56.8 79.7 22.9 2.41 0.4 0.1 0.1
%TTR = percent time in the therapeutic range, %T < INR 1.5 = percent time that the INR was below 1.5, %T > INR 5 = percent time that the INR was above 5.
Ref: Bussey HI, J Thromb Thrombolysis 2011; 31:265-274
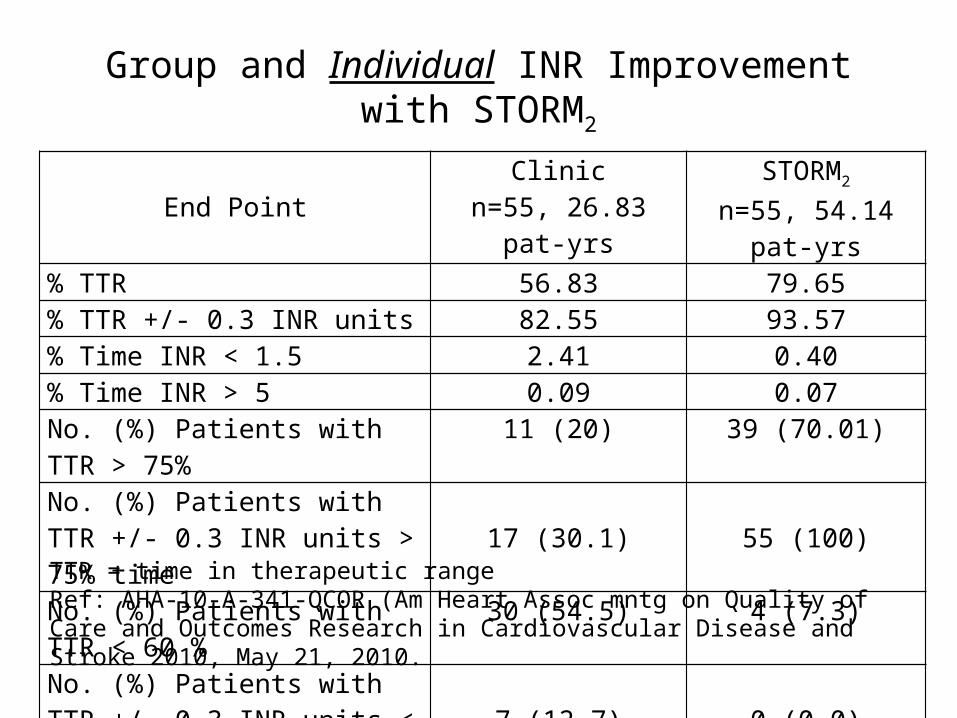
Group and Individual INR Improvement with STORM2
End PointClinic
n=55, 26.83 pat-yrsSTORM2
n=55, 54.14 pat-yrs% TTR 56.83 79.65% TTR +/- 0.3 INR units 82.55 93.57% Time INR < 1.5 2.41 0.40% Time INR > 5 0.09 0.07No. (%) Patients with TTR > 75% 11 (20) 39 (70.01)No. (%) Patients with TTR +/- 0.3 INR units > 75% time 17 (30.1) 55 (100)No. (%) Patients with TTR < 60 % 30 (54.5) 4 (7.3)No. (%) Patients with TTR +/- 0.3 INR units < 60% time 7 (12.7) 0 (0.0)
TTR = time in therapeutic rangeRef: AHA-10-A-341-QCOR (Am Heart Assoc mntg on Quality of Care and Outcomes Research in Cardiovascular Disease and Stroke 2010, May 21, 2010.
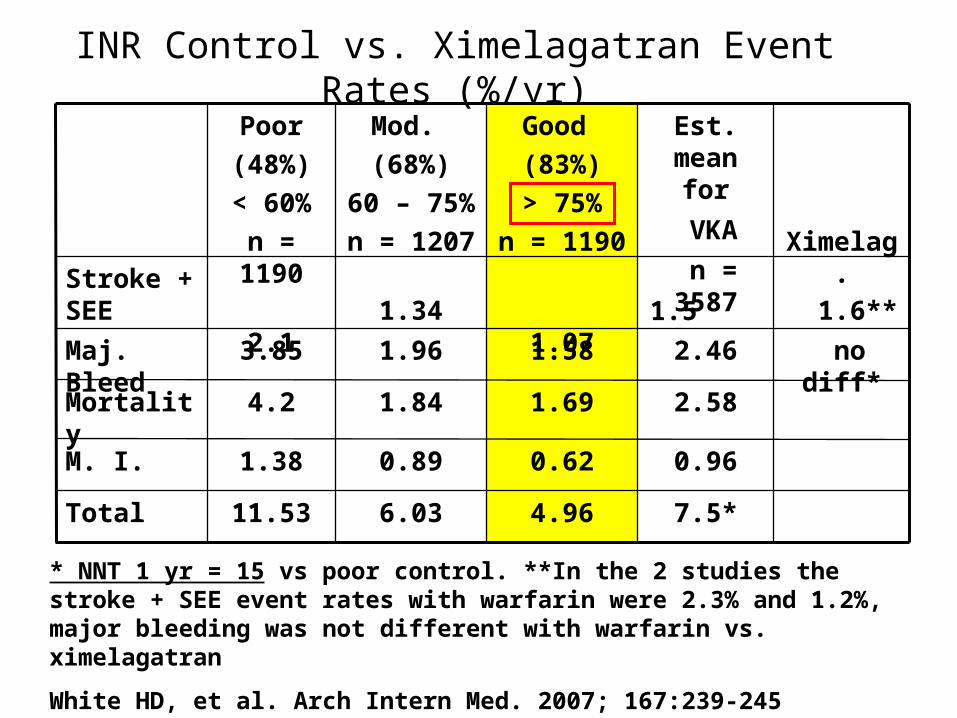
INR Control vs. Ximelagatran Event Rates (%/yr)
7.5*
0.96
2.58
2.46
1.5
Est. mean for
VKA
n = 3587
4.966.0311.53Total
0.620.891.38M. I.
1.691.844.2Mortality
no diff*1.581.963.85Maj. Bleed
1.6**
1.07
1.34
2.1
Stroke + SEE
Ximelag.
Good
(83%)
> 75%
n = 1190
Mod.
(68%)
60 – 75%
n = 1207
Poor
(48%)
< 60%
n = 1190
* NNT 1 yr = 15 vs poor control. **In the 2 studies the stroke + SEE event rates with warfarin were 2.3% and 1.2%, major bleeding was not different with warfarin vs. ximelagatran
White HD, et al. Arch Intern Med. 2007; 167:239-245
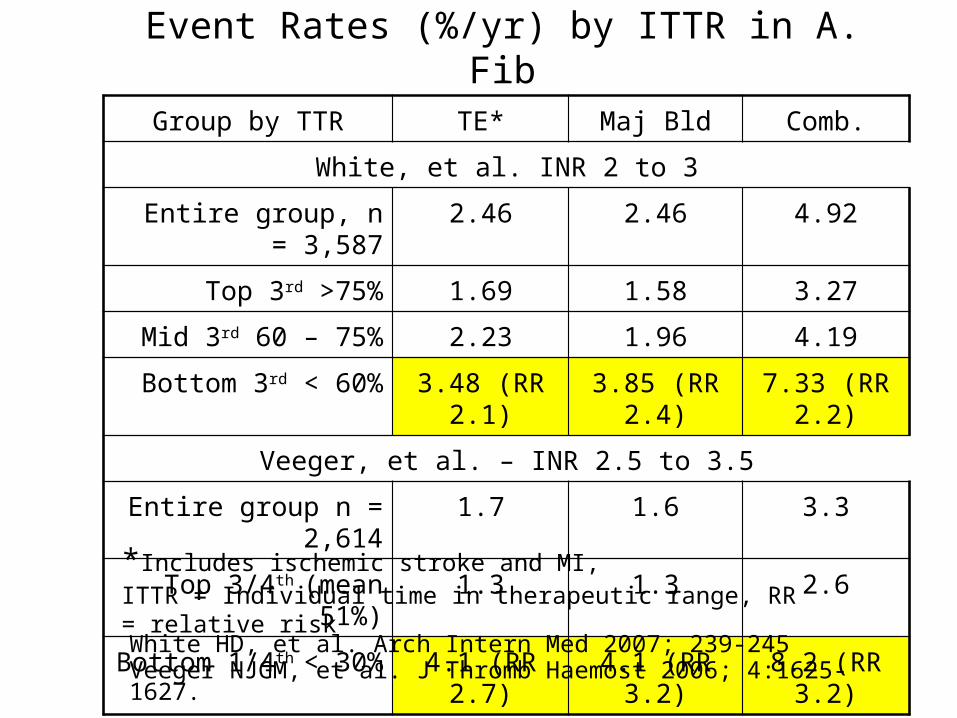
Event Rates (%/yr) by ITTR in A. Fib
Group by TTR TE* Maj Bld Comb.
White, et al. INR 2 to 3
Entire group, n = 3,587 2.46 2.46 4.92
Top 3rd >75% 1.69 1.58 3.27
Mid 3rd 60 – 75% 2.23 1.96 4.19
Bottom 3rd < 60% 3.48 (RR 2.1) 3.85 (RR 2.4) 7.33 (RR 2.2)
Veeger, et al. – INR 2.5 to 3.5
Entire group n = 2,614 1.7 1.6 3.3
Top 3/4th (mean 51%) 1.3 1.3 2.6
Bottom 1/4th < 30% 4.1 (RR 2.7) 4.1 (RR 3.2) 8.2 (RR 3.2)
White HD, et al. Arch Intern Med 2007; 239-245Veeger NJGM, et al. J Thromb Haemost 2006; 4:1625-1627.
*Includes ischemic stroke and MI, ITTR = Individual time in therapeutic range, RR = relative risk
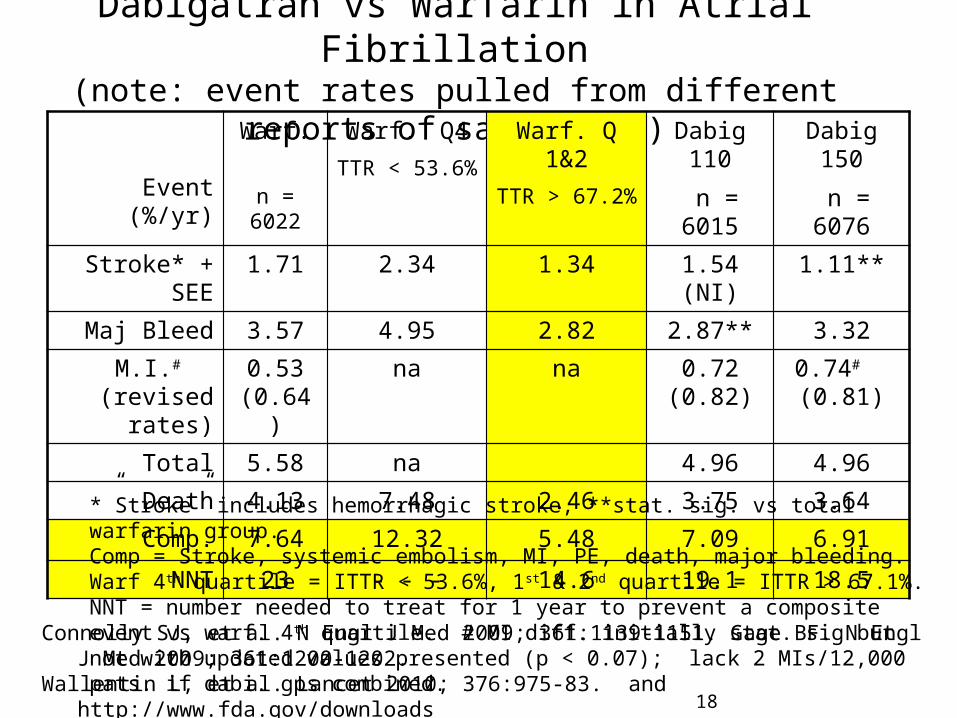
Dabigatran vs Warfarin in Atrial Fibrillation(note: event rates pulled from different reports of same study)
Event (%/yr)
Warf. n = 6022
Warf. Q4TTR < 53.6%
Warf. Q 1&2TTR > 67.2%
Dabig 110
n = 6015
Dabig 150
n = 6076Stroke* + SEE 1.71 2.34 1.34 1.54 (NI) 1.11**
Maj Bleed 3.57 4.95 2.82 2.87** 3.32M.I.#
(revised rates)0.53
(0.64)na na 0.72
(0.82)0.74# (0.81)
Total 5.58 na 4.96 4.96
Death 4.13 7.48 2.46 3.75 3.64Comp. 7.64 12.32 5.48 7.09 6.91
NNT 23 - - - 14.6 19.1 18.5
Connolly SJ, et al. N Engl J Med 2009; 361:1139-1151. Gage BF. N Engl J Med 2009; 361:1200-1202.Wallentin L, et al. Lancet 2010; 376:975-83. and http://www.fda.gov/downloads
18
*”Stroke” includes hemorrhagic stroke, **stat. sig. vs total warfarin group. Comp = Stroke, systemic embolism, MI, PE, death, major bleeding. Warf 4 th quartile = ITTR < 53.6%, 1st & 2nd quartile = ITTR > 67.1%. NNT = number needed to treat for 1 year to prevent a composite event vs warf. 4th quartile. # MI diff. initially stat. sig but not with updated values presented (p < 0.07); lack 2 MIs/12,000 pats. if dabi. gps combined.
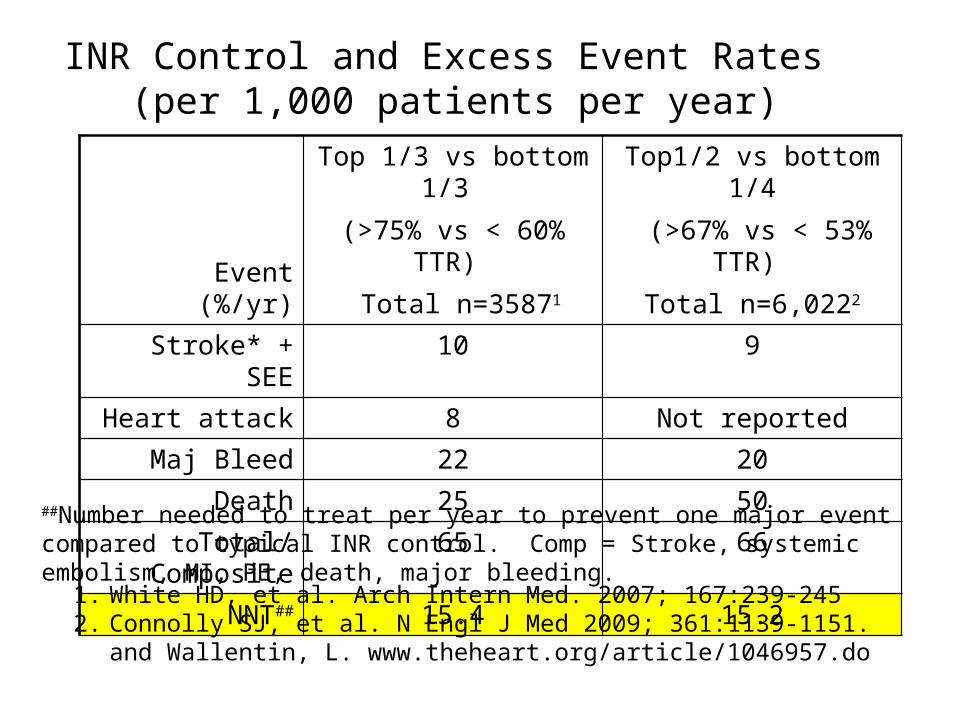
INR Control and Excess Event Rates (per 1,000 patients per year)
Event (%/yr)
Top 1/3 vs bottom 1/3 (>75% vs < 60% TTR)
Total n=35871
Top1/2 vs bottom 1/4 (>67% vs < 53% TTR)
Total n=6,0222
Stroke* + SEE 10 9
Heart attack 8 Not reportedMaj Bleed 22 20
Death 25 50Total/Composite 65 66
NNT## 15.4 15.2
1. White HD, et al. Arch Intern Med. 2007; 167:239-2452. Connolly SJ, et al. N Engl J Med 2009; 361:1139-1151. and Wallentin, L.
www.theheart.org/article/1046957.do
##Number needed to treat per year to prevent one major event compared to typical INR control. Comp = Stroke, systemic embolism, MI, PE, death, major bleeding.
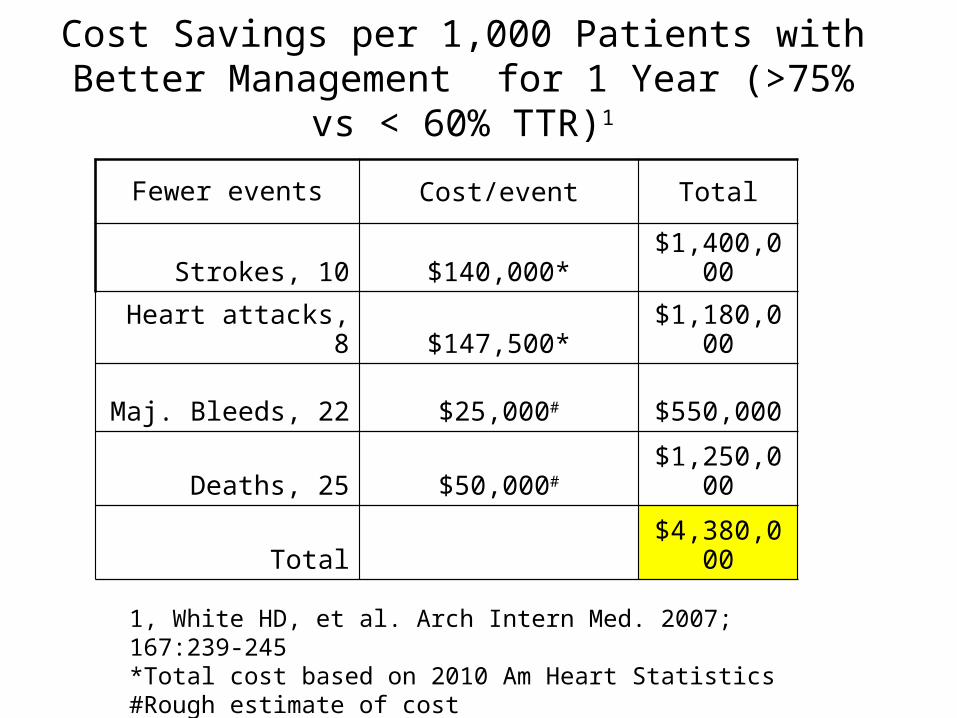
Cost Savings per 1,000 Patients with Better Management for 1 Year (>75% vs < 60% TTR)1
Fewer events Cost/event Total
Strokes, 10 $140,000* $1,400,000
Heart attacks, 8 $147,500* $1,180,000
Maj. Bleeds, 22 $25,000# $550,000
Deaths, 25 $50,000# $1,250,000
Total $4,380,000
1, White HD, et al. Arch Intern Med. 2007; 167:239-245*Total cost based on 2010 Am Heart Statistics#Rough estimate of cost
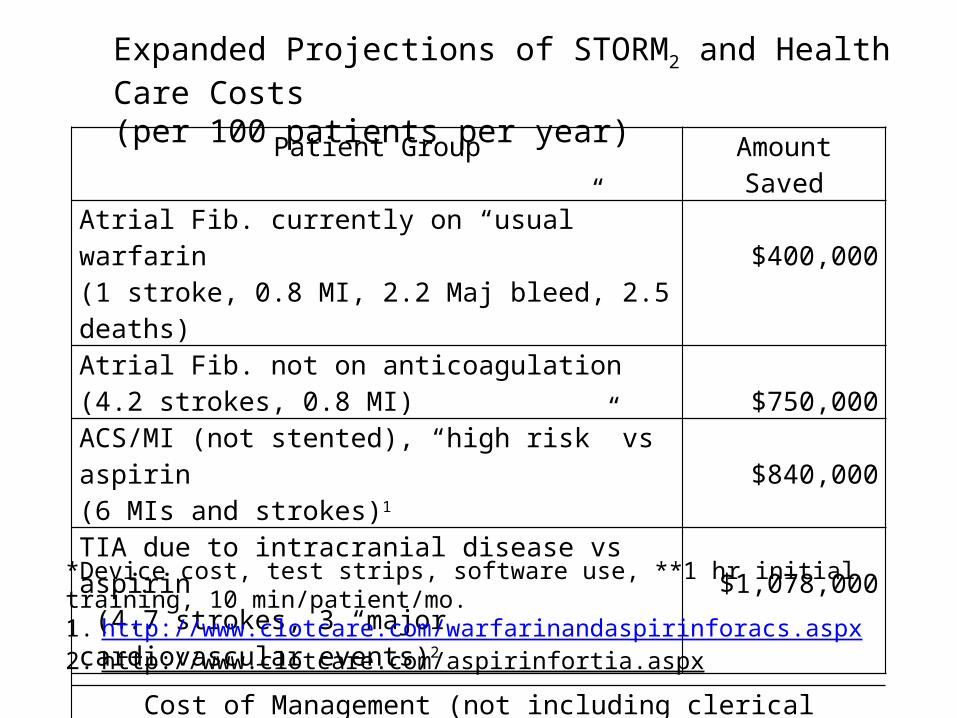
Patient Group Amount SavedAtrial Fib. currently on “usual” warfarin (1 stroke, 0.8 MI, 2.2 Maj bleed, 2.5 deaths) $400,000Atrial Fib. not on anticoagulation (4.2 strokes, 0.8 MI) $750,000ACS/MI (not stented), “high risk” vs aspirin (6 MIs and strokes)1 $840,000TIA due to intracranial disease vs aspirin (4.7 strokes, 3 “major cardiovascular events)2 $1,078,000
Cost of Management (not including clerical services)First year: $120,000* + 304 clinician hrs** vs CMS revenue of $163,0002nd year +: $50,000* + 204 clinician hrs** vs CMS revenue of $150,000
Expanded Projections of STORM2 and Health Care Costs (per 100 patients per year)
*Device cost, test strips, software use, **1 hr initial training, 10 min/patient/mo.1. http://www.clotcare.com/warfarinandaspirinforacs.aspx2. http://www.clotcare.com/aspirinfortia.aspx
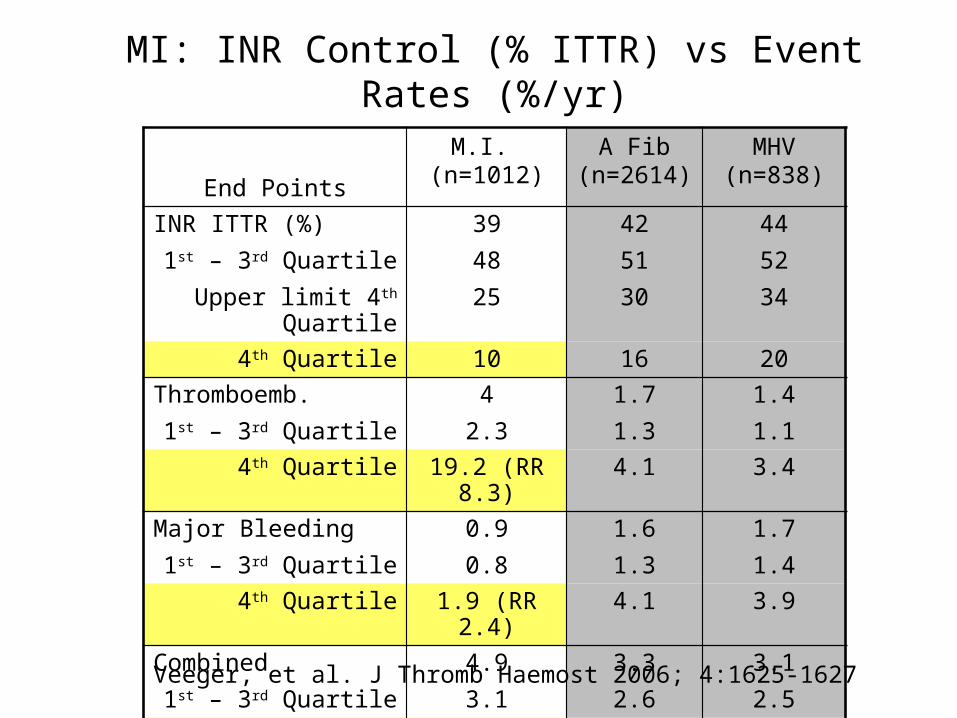
MI: INR Control (% ITTR) vs Event Rates (%/yr)
End Points
M.I. (n=1012)
A Fib (n=2614)
MHV (n=838)
INR ITTR (%)1st – 3rd Quartile
Upper limit 4th Quartile
394825
425130
445234
4th Quartile 10 16 20Thromboemb.
1st – 3rd Quartile4
2.31.71.3
1.41.1
4th Quartile 19.2 (RR 8.3) 4.1 3.4Major Bleeding
1st – 3rd Quartile0.90.8
1.61.3
1.71.4
4th Quartile 1.9 (RR 2.4) 4.1 3.9Combined
1st – 3rd Quartile4.93.1
3.32.6
3.12.5
4th Quartile 21.1 (RR 6.8) 8.2 7.3
Veeger, et al. J Thromb Haemost 2006; 4:1625-1627
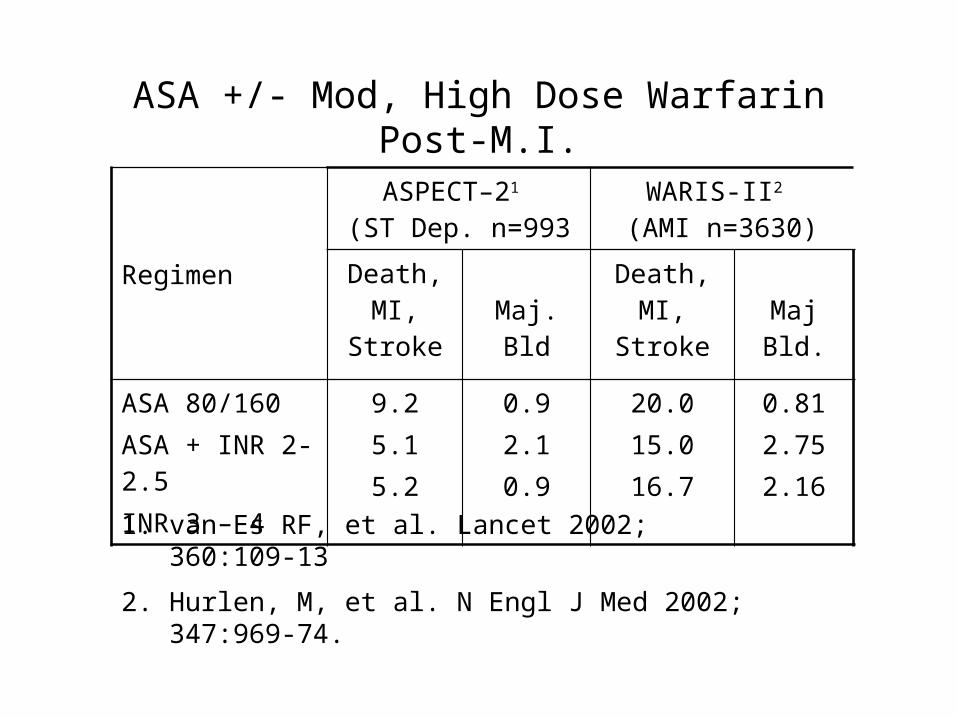
ASA +/- Mod, High Dose Warfarin Post-M.I.
Regimen
ASPECT–21 (ST Dep. n=993
WARIS-II2 (AMI n=3630)
Death, MI, Stroke Maj. Bld
Death, MI, Stroke Maj Bld.
ASA 80/160ASA + INR 2-2.5INR 3 – 4
9.25.15.2
0.92.10.9
20.015.016.7
0.812.752.16
1. van Es RF, et al. Lancet 2002; 360:109-13
2. Hurlen, M, et al. N Engl J Med 2002; 347:969-74.
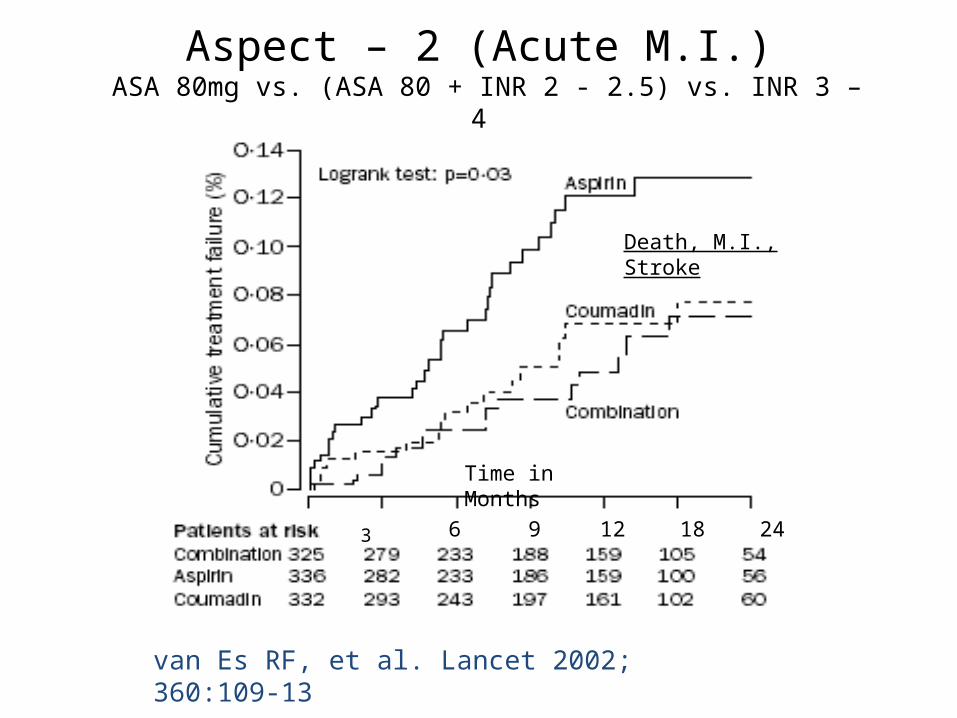
Aspect – 2 (Acute M.I.) ASA 80mg vs. (ASA 80 + INR 2 - 2.5) vs. INR 3 – 4
Time in Months
3
van Es RF, et al. Lancet 2002; 360:109-13
6 9 12 18 24
Death, M.I., Stroke
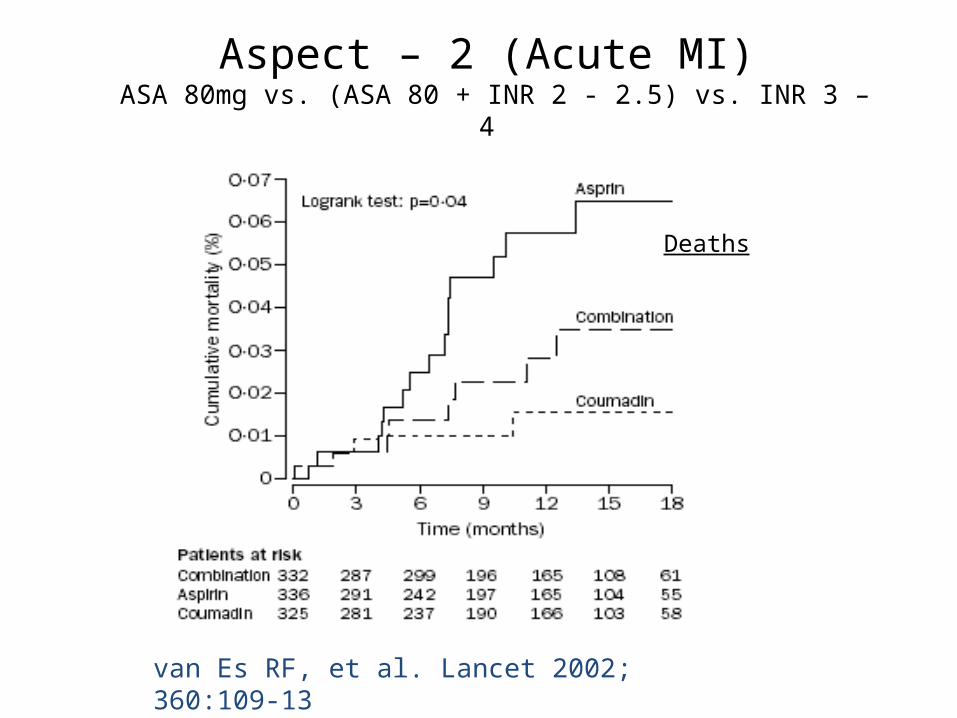
Aspect – 2 (Acute MI) ASA 80mg vs. (ASA 80 + INR 2 - 2.5) vs. INR 3 – 4
van Es RF, et al. Lancet 2002; 360:109-13
Deaths
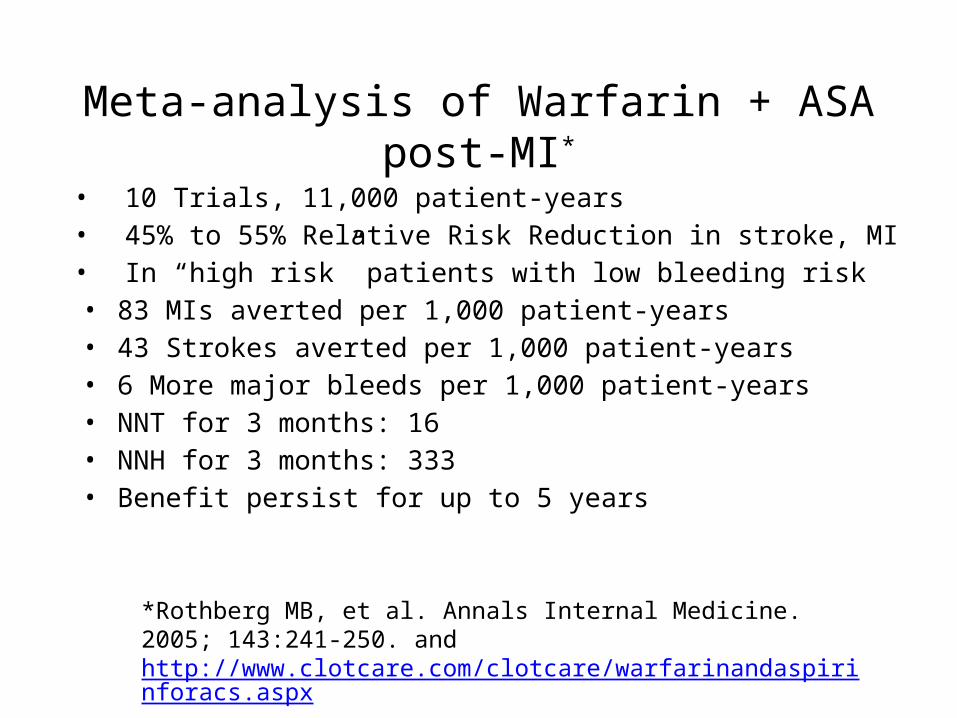
Meta-analysis of Warfarin + ASA post-MI*
• 10 Trials, 11,000 patient-years• 45% to 55% Relative Risk Reduction in stroke, MI• In “high risk” patients with low bleeding risk
• 83 MIs averted per 1,000 patient-years• 43 Strokes averted per 1,000 patient-years• 6 More major bleeds per 1,000 patient-years• NNT for 3 months: 16• NNH for 3 months: 333• Benefit persist for up to 5 years
*Rothberg MB, et al. Annals Internal Medicine. 2005; 143:241-250. and http://www.clotcare.com/clotcare/warfarinandaspirinforacs.aspx
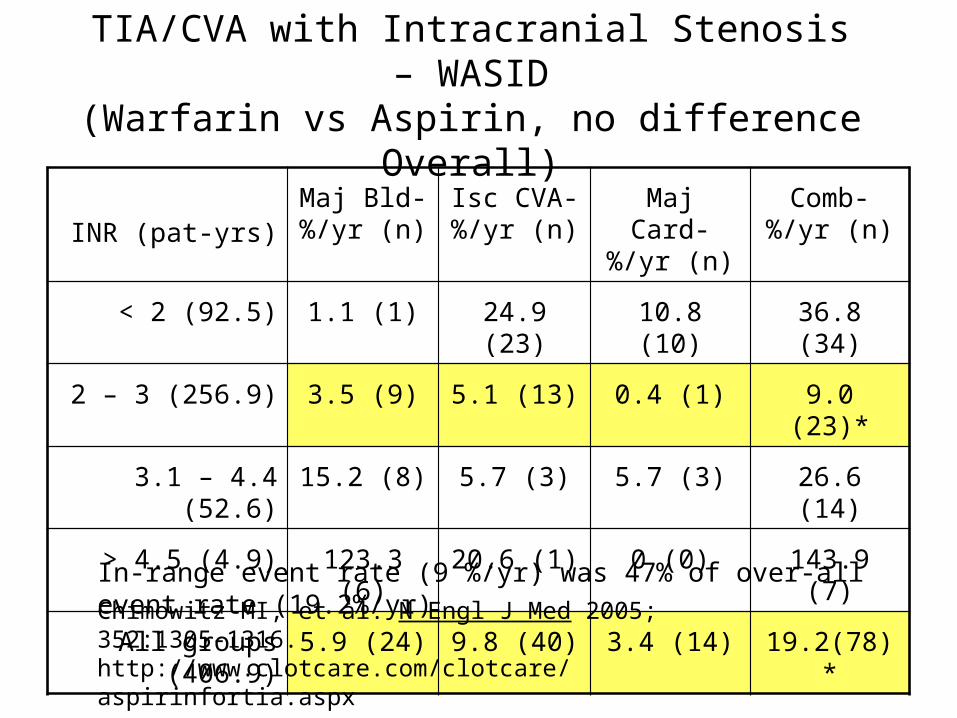
TIA/CVA with Intracranial Stenosis – WASID(Warfarin vs Aspirin, no difference Overall)
INR (pat-yrs)Maj Bld-%/yr (n)
Isc CVA- %/yr (n)
Maj Card- %/yr (n)
Comb- %/yr (n)
< 2 (92.5) 1.1 (1) 24.9 (23) 10.8 (10) 36.8 (34)
2 – 3 (256.9) 3.5 (9) 5.1 (13) 0.4 (1) 9.0 (23)*
3.1 – 4.4 (52.6) 15.2 (8) 5.7 (3) 5.7 (3) 26.6 (14)
> 4.5 (4.9) 123.3 (6) 20.6 (1) 0 (0) 143.9 (7)
All groups (406.9) 5.9 (24) 9.8 (40) 3.4 (14) 19.2(78)*
Chimowitz MI, et al. N Engl J Med 2005; 352:1305-1316. http://www.clotcare.com/clotcare/aspirinfortia.aspx
In-range event rate (9 %/yr) was 47% of over-all event rate (19.2%/yr)

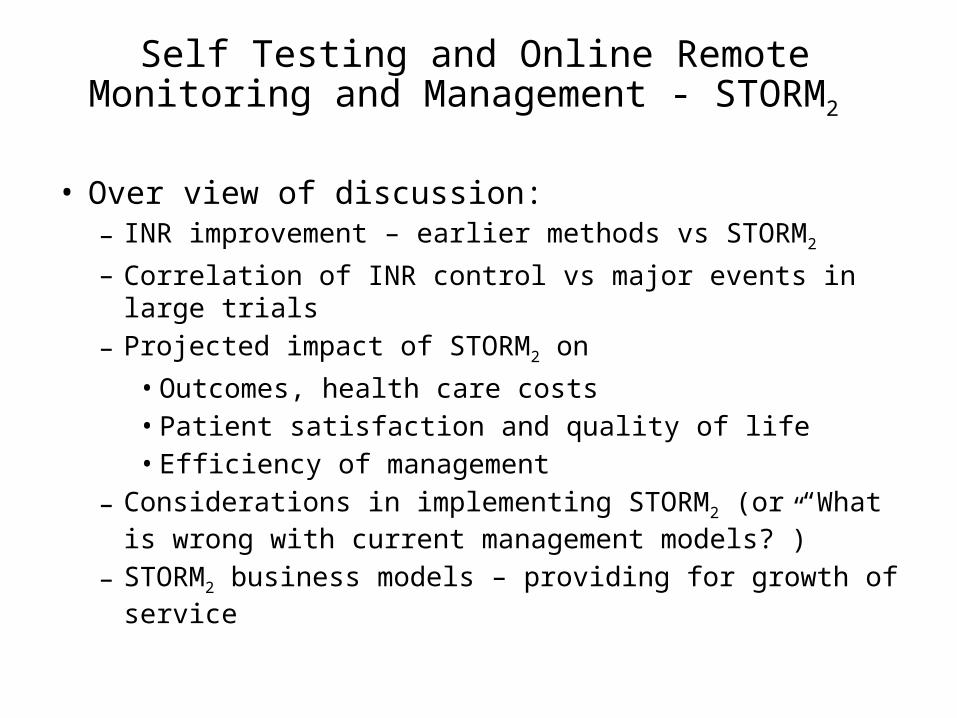
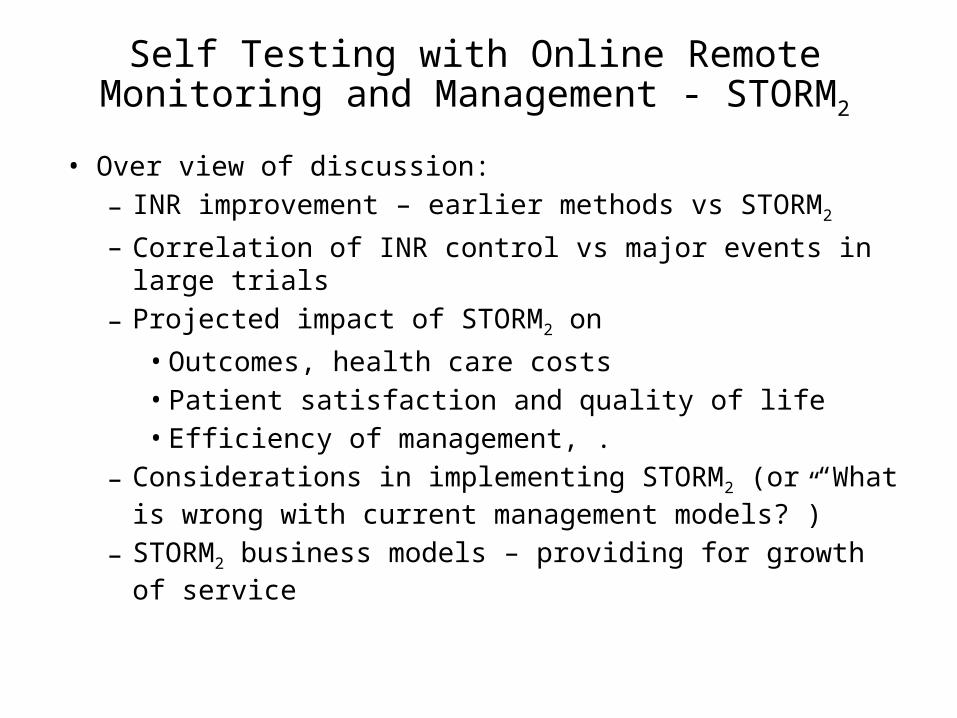
Self Testing with Online Remote Monitoring and Management - STORM2
• Over view of discussion:– INR improvement – earlier methods vs STORM2
– Correlation of INR control vs major events in large trials
– Projected impact of STORM2 on
• Outcomes, health care costs• Patient satisfaction and quality of life• Efficiency of management
– Considerations in implementing STORM2 (or “What is wrong with current management models?”)
– STORM2 business models – providing for growth of service
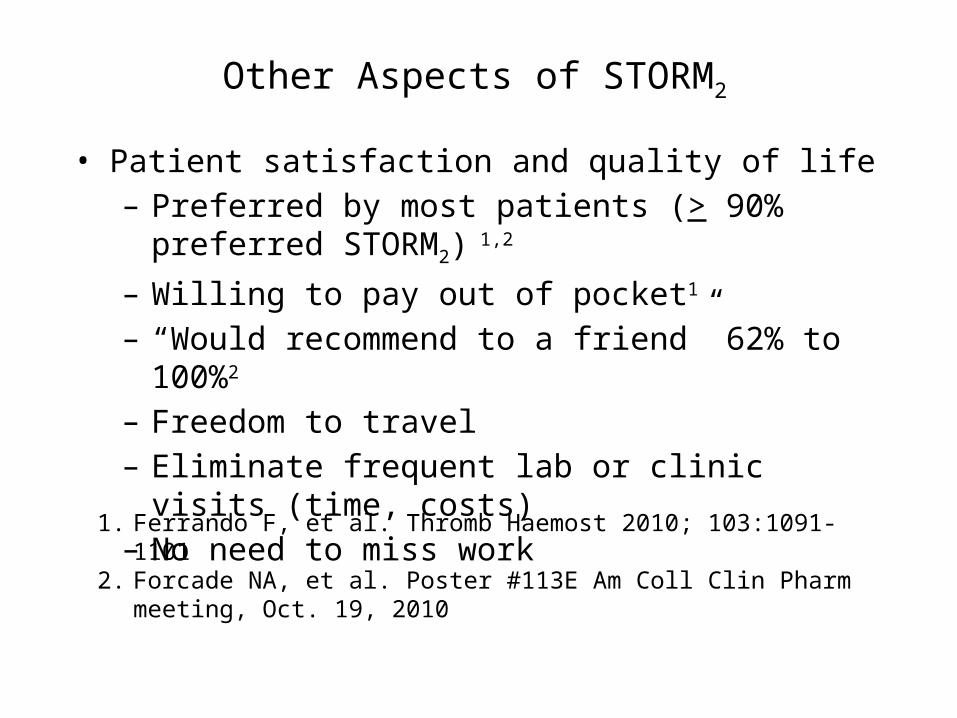
Other Aspects of STORM2
• Patient satisfaction and quality of life
– Preferred by most patients (> 90% preferred STORM2) 1,2
– Willing to pay out of pocket1
– “Would recommend to a friend” 62% to 100%2
– Freedom to travel– Eliminate frequent lab or clinic visits (time, costs)– No need to miss work
1. Ferrando F, et al. Thromb Haemost 2010; 103:1091-11012. Forcade NA, et al. Poster #113E Am Coll Clin Pharm meeting, Oct. 19, 2010
Other Aspects of STORM2
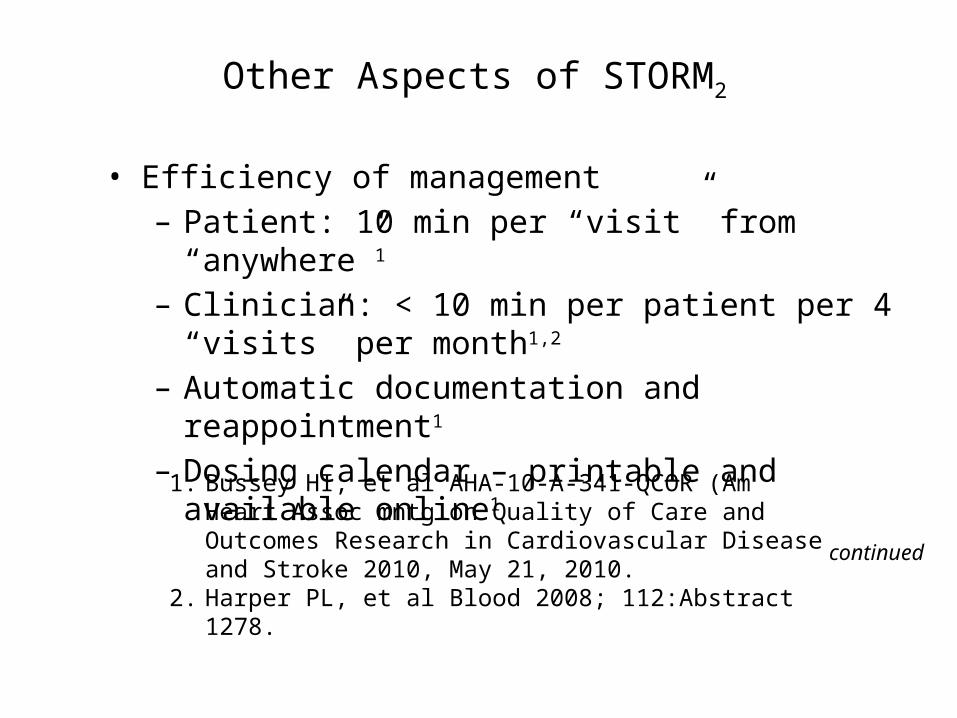
• Efficiency of management– Patient: 10 min per “visit” from “anywhere”1
– Clinician: < 10 min per patient per 4 “visits” per month1,2
– Automatic documentation and reappointment1
– Dosing calendar – printable and available online1
continued
1. Bussey HI, et al AHA-10-A-341-QCOR (Am Heart Assoc mntg on Quality of Care and Outcomes Research in Cardiovascular Disease and Stroke 2010, May 21, 2010.
2. Harper PL, et al Blood 2008; 112:Abstract 1278.
Self Testing and Online Remote Monitoring and Management - STORM2
• Over view of discussion:– INR improvement – earlier methods vs STORM2
– Correlation of INR control vs major events in large trials
– Projected impact of STORM2 on
• Outcomes, health care costs• Patient satisfaction and quality of life• Efficiency of management
– Considerations in implementing STORM2 (or “What is wrong with current management models?”)
– STORM2 business models – providing for growth of service
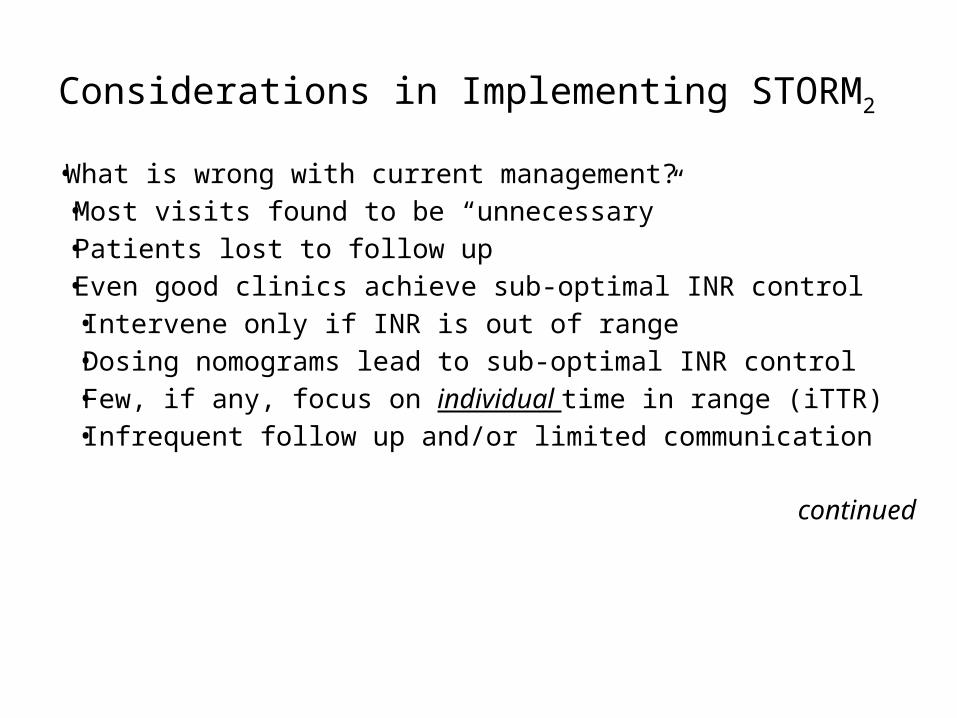
Considerations in Implementing STORM2
• What is wrong with current management?• Most visits found to be “unnecessary”• Patients lost to follow up• Even good clinics achieve sub-optimal INR control
• Intervene only if INR is out of range • Dosing nomograms lead to sub-optimal INR control• Few, if any, focus on individual time in range (iTTR)• Infrequent follow up and/or limited communication
continued
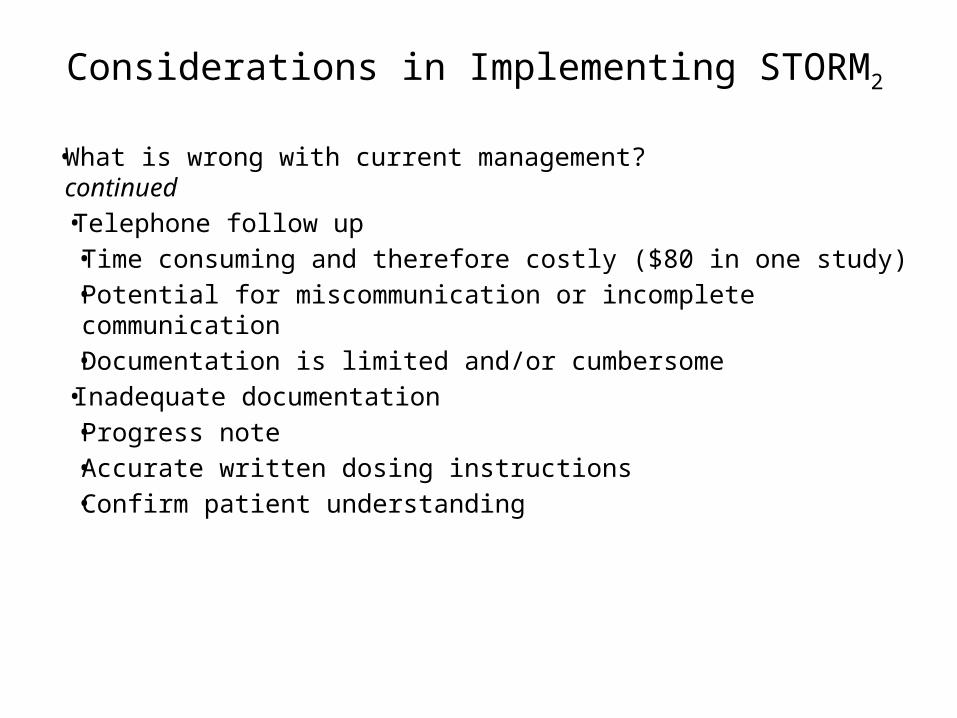
Considerations in Implementing STORM2
• What is wrong with current management? continued• Telephone follow up
• Time consuming and therefore costly ($80 in one study)• Potential for miscommunication or incomplete
communication• Documentation is limited and/or cumbersome
• Inadequate documentation • Progress note• Accurate written dosing instructions• Confirm patient understanding
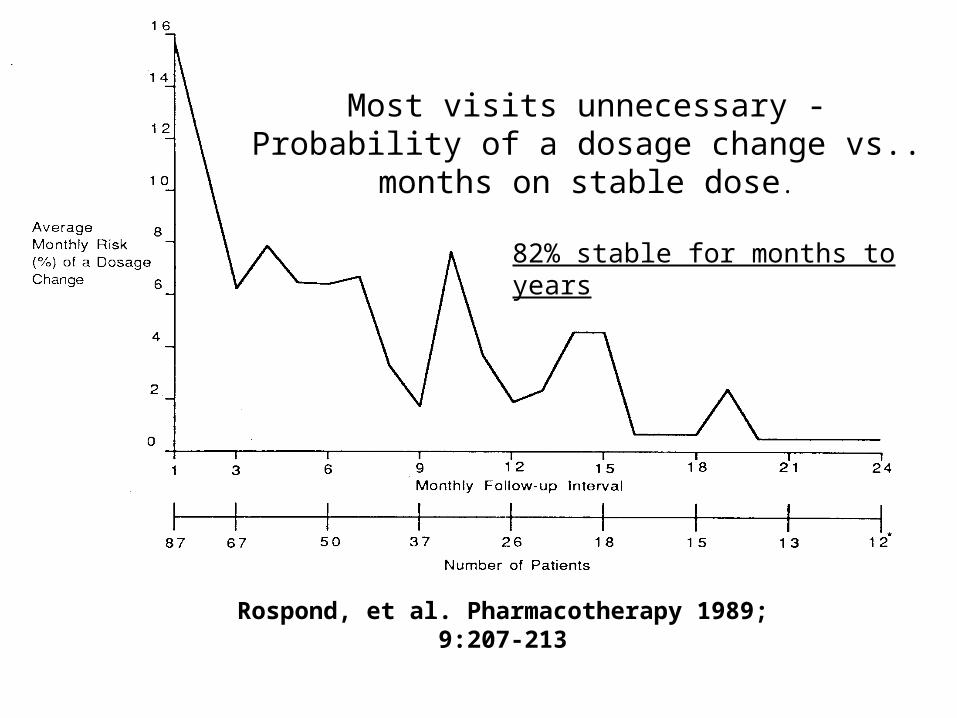
Most visits unnecessary -Probability of a dosage change vs..
months on stable dose.
Rospond, et al. Pharmacotherapy 1989; 9:207-213
82% stable for months to years
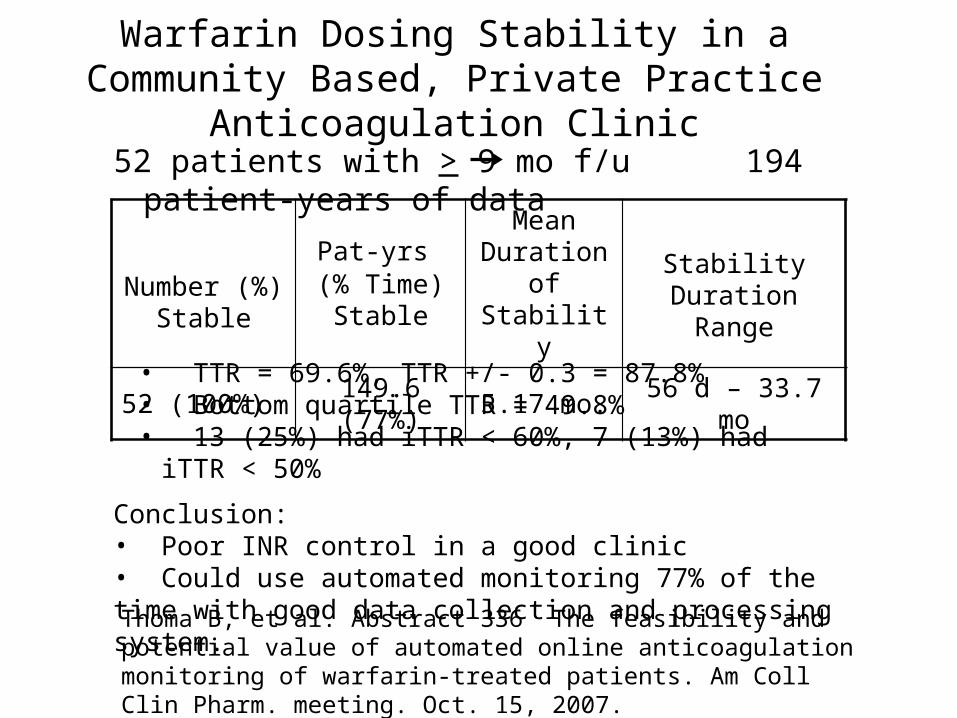
Warfarin Dosing Stability in a Community Based, Private Practice Anticoagulation Clinic
52 patients with > 9 mo f/u 194 patient-years of data
Number (%) Stable
Pat-yrs (% Time)
Stable
Mean Duration of
StabilityStability Duration
Range
52 (100%) 149.6 (77%) 5.17 mo. 56 d – 33.7 mo
• TTR = 69.6%, TTR +/- 0.3 = 87.8%• Bottom quartile TTR = 49.8%• 13 (25%) had iTTR < 60%, 7 (13%) had iTTR < 50%
Conclusion: • Poor INR control in a good clinic• Could use automated monitoring 77% of the time with good data collection and processing system.Thoma B, et al. Abstract 336 The feasibility and potential value of automated online anticoagulation monitoring of warfarin-treated patients. Am Coll Clin Pharm. meeting. Oct. 15, 2007.
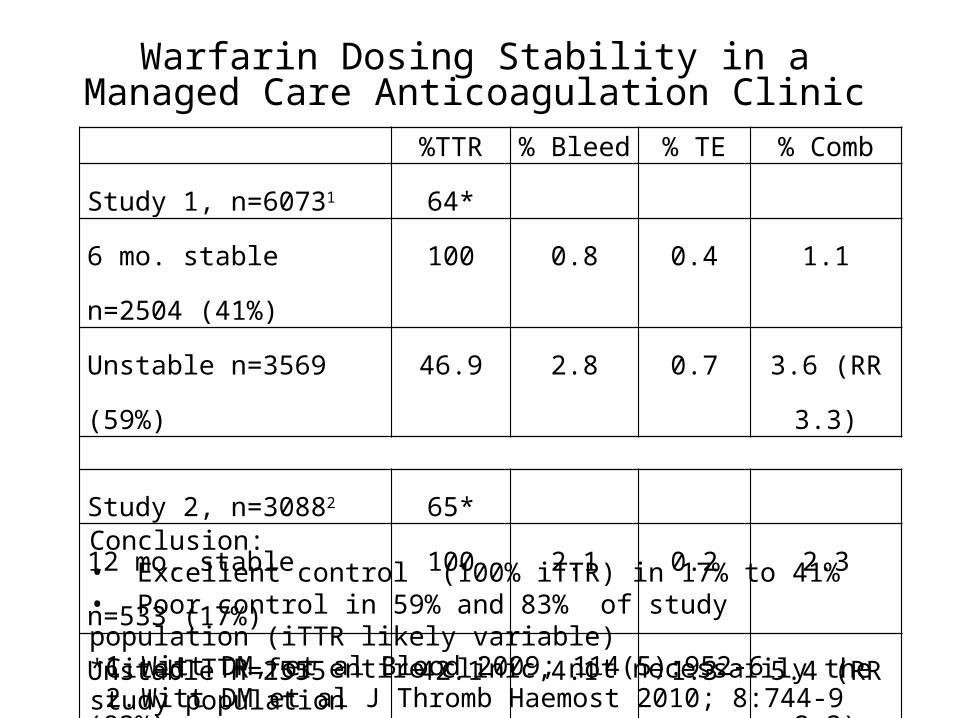
Warfarin Dosing Stability in a Managed Care Anticoagulation Clinic
%TTR % Bleed % TE % Comb
Study 1, n=60731 64*
6 mo. stable n=2504 (41%) 100 0.8 0.4 1.1
Unstable n=3569 (59%) 46.9 2.8 0.7 3.6 (RR 3.3)
Study 2, n=30882 65*
12 mo. stable n=533 (17%) 100 2.1 0.2 2.3
Unstable n=2555 (83%) 42.1 4.1 1.3 5.4 (RR 2.3)
1. Witt DM, et al Blood 2009; 114(5):952-62. Witt DM et al J Thromb Haemost 2010; 8:744-9
Conclusion:• Excellent control (100% iTTR) in 17% to 41%• Poor control in 59% and 83% of study population (iTTR likely variable)*Cited TTR for entire clinic, not necessarily the study population
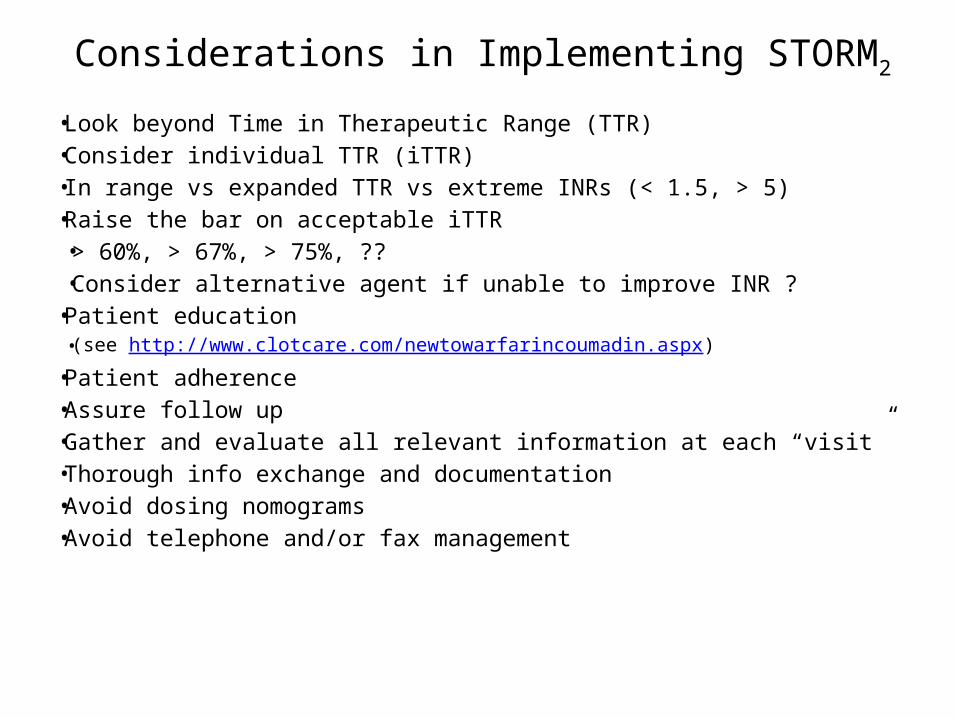
Considerations in Implementing STORM2
• Look beyond Time in Therapeutic Range (TTR)• Consider individual TTR (iTTR)• In range vs expanded TTR vs extreme INRs (< 1.5, > 5)• Raise the bar on acceptable iTTR
• > 60%, > 67%, > 75%, ??• Consider alternative agent if unable to improve INR ?
• Patient education • (see http://www.clotcare.com/newtowarfarincoumadin.aspx)
• Patient adherence• Assure follow up• Gather and evaluate all relevant information at each “visit”• Thorough info exchange and documentation• Avoid dosing nomograms• Avoid telephone and/or fax management
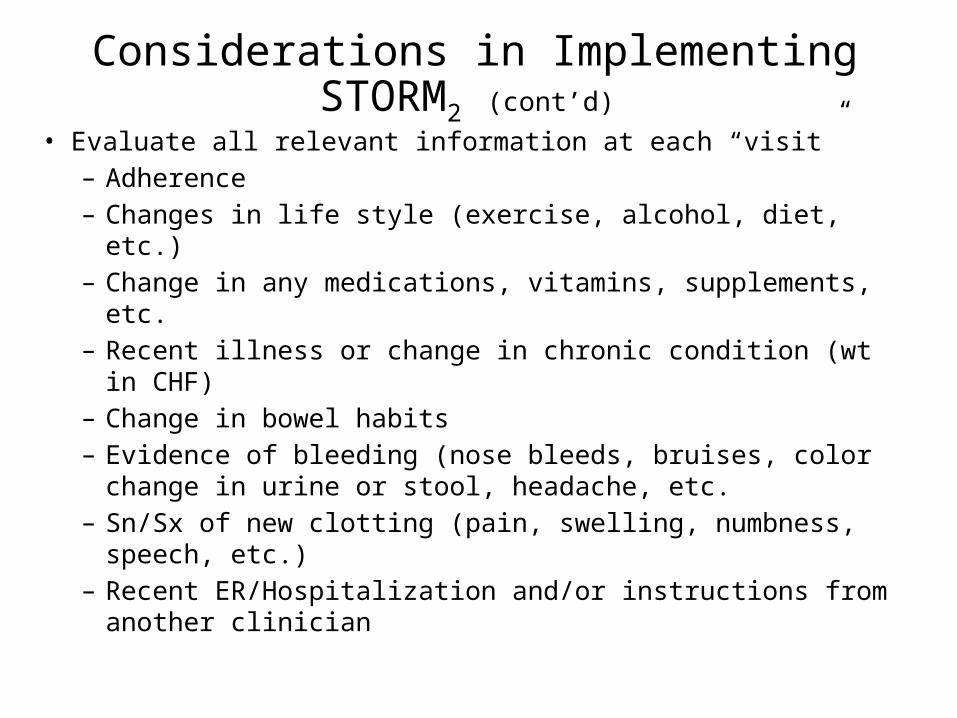
Considerations in Implementing STORM2 (cont’d)
• Evaluate all relevant information at each “visit”– Adherence– Changes in life style (exercise, alcohol, diet, etc.)– Change in any medications, vitamins, supplements, etc.– Recent illness or change in chronic condition (wt in CHF)– Change in bowel habits– Evidence of bleeding (nose bleeds, bruises, color change in
urine or stool, headache, etc.– Sn/Sx of new clotting (pain, swelling, numbness, speech,
etc.)– Recent ER/Hospitalization and/or instructions from another
clinician
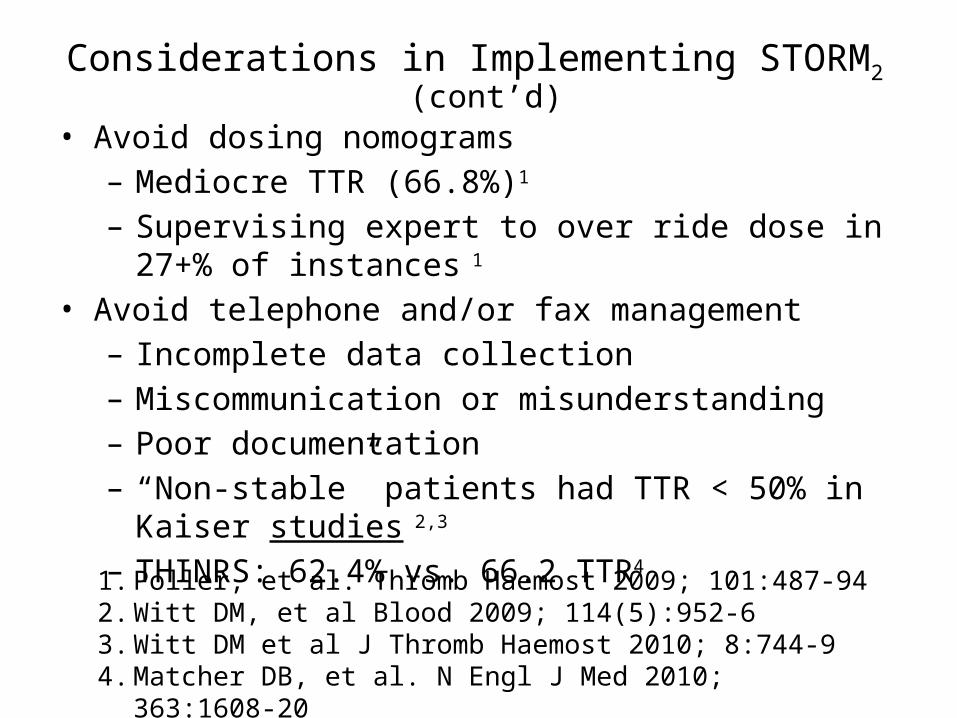
Considerations in Implementing STORM2 (cont’d)
• Avoid dosing nomograms– Mediocre TTR (66.8%)1
– Supervising expert to over ride dose in 27+% of instances 1
• Avoid telephone and/or fax management– Incomplete data collection– Miscommunication or misunderstanding – Poor documentation– “Non-stable” patients had TTR < 50% in Kaiser studies 2,3
– THINRS: 62.4% vs. 66.2 TTR4
1. Poller, et al. Thromb Haemost 2009; 101:487-942. Witt DM, et al Blood 2009; 114(5):952-63. Witt DM et al J Thromb Haemost 2010; 8:744-94. Matcher DB, et al. N Engl J Med 2010; 363:1608-20
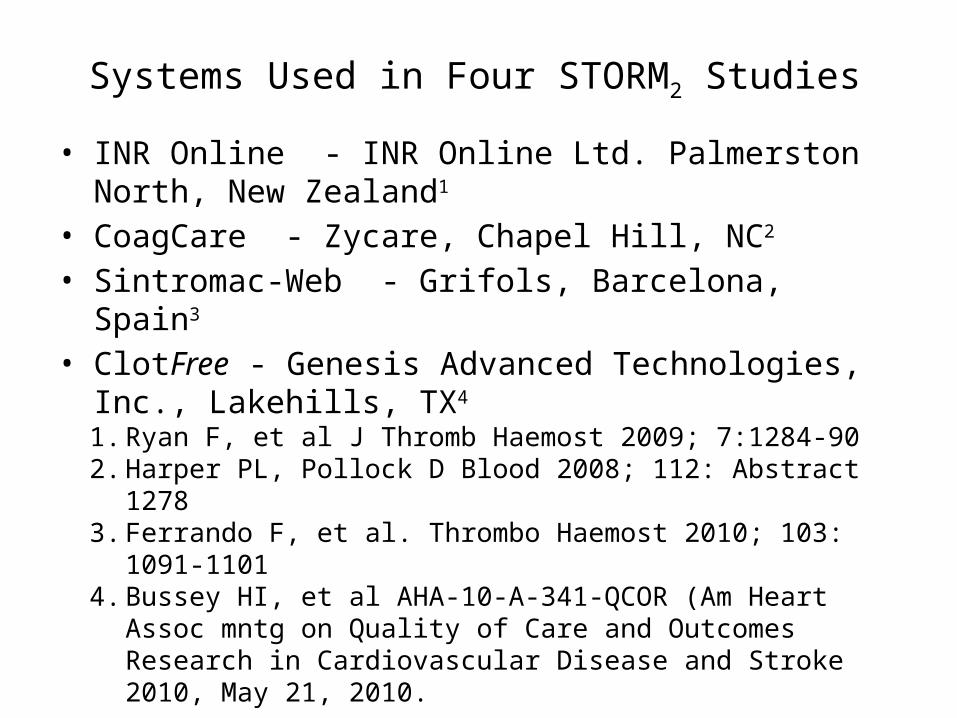
Systems Used in Four STORM2 Studies
• INR Online - INR Online Ltd. Palmerston North, New Zealand1
• CoagCare - Zycare, Chapel Hill, NC2
• Sintromac-Web - Grifols, Barcelona, Spain3
• ClotFree - Genesis Advanced Technologies, Inc., Lakehills, TX4
1. Ryan F, et al J Thromb Haemost 2009; 7:1284-902. Harper PL, Pollock D Blood 2008; 112: Abstract 12783. Ferrando F, et al. Thrombo Haemost 2010; 103: 1091-11014. Bussey HI, et al AHA-10-A-341-QCOR (Am Heart Assoc mntg on
Quality of Care and Outcomes Research in Cardiovascular Disease and Stroke 2010, May 21, 2010.
Self Testing with Online Remote Monitoring and Management - STORM2
• Over view of discussion:
– INR improvement – earlier methods vs STORM2
– Correlation of INR control vs major events in large trials
– Projected impact of STORM2 on
• Outcomes, health care costs• Patient satisfaction and quality of life• Efficiency of management, .
– Considerations in implementing STORM2 (or “What is wrong with current management models?”)
– STORM2 business models – providing for growth of service
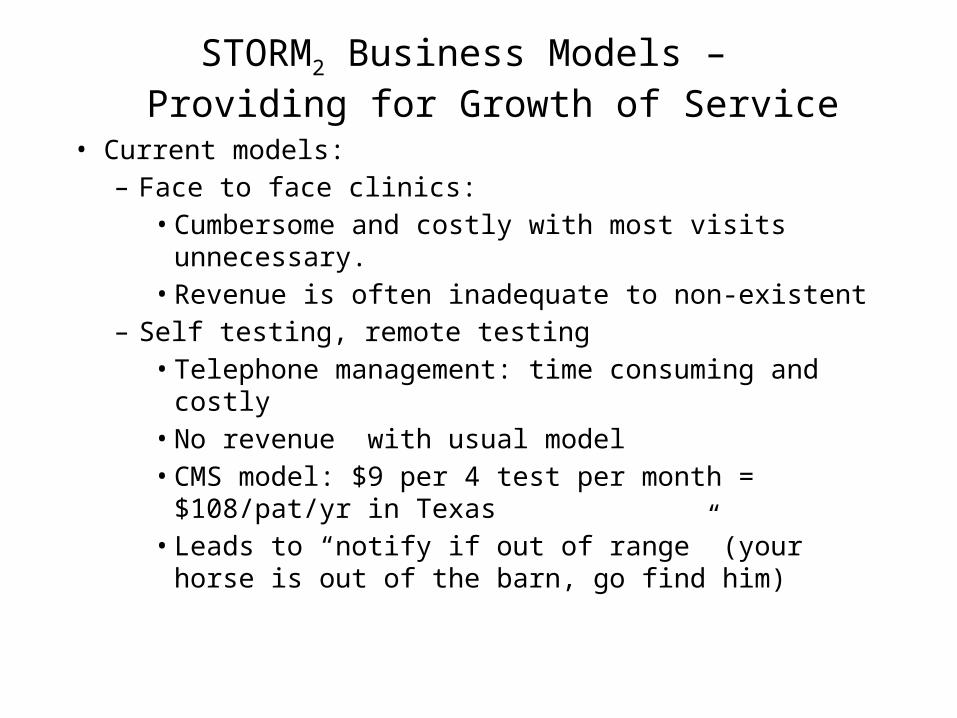
STORM2 Business Models – Providing for Growth of Service
• Current models:– Face to face clinics:
• Cumbersome and costly with most visits unnecessary.• Revenue is often inadequate to non-existent
– Self testing, remote testing• Telephone management: time consuming and costly• No revenue with usual model• CMS model: $9 per 4 test per month = $108/pat/yr in
Texas• Leads to “notify if out of range” (your horse is out of
the barn, go find him)
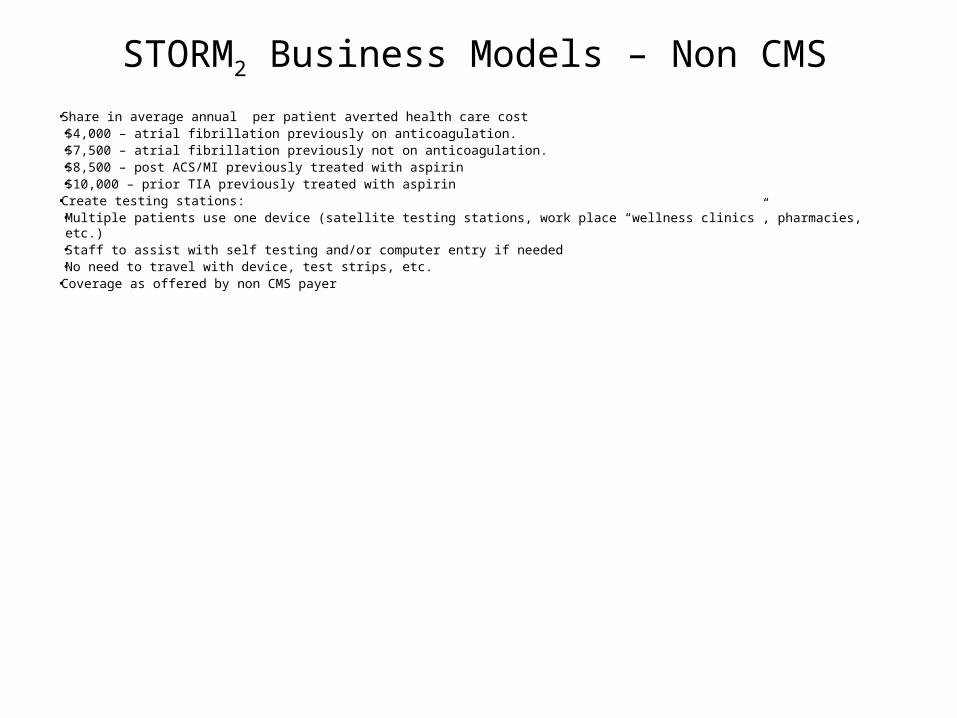
STORM2 Business Models – Non CMS
• Share in average annual per patient averted health care cost • $4,000 – atrial fibrillation previously on anticoagulation.• $7,500 – atrial fibrillation previously not on anticoagulation.• $8,500 – post ACS/MI previously treated with aspirin• $10,000 – prior TIA previously treated with aspirin
• Create testing stations:• Multiple patients use one device (satellite testing stations, work place “wellness clinics”, pharmacies, etc.)• Staff to assist with self testing and/or computer entry if needed• No need to travel with device, test strips, etc.
• Coverage as offered by non CMS payer
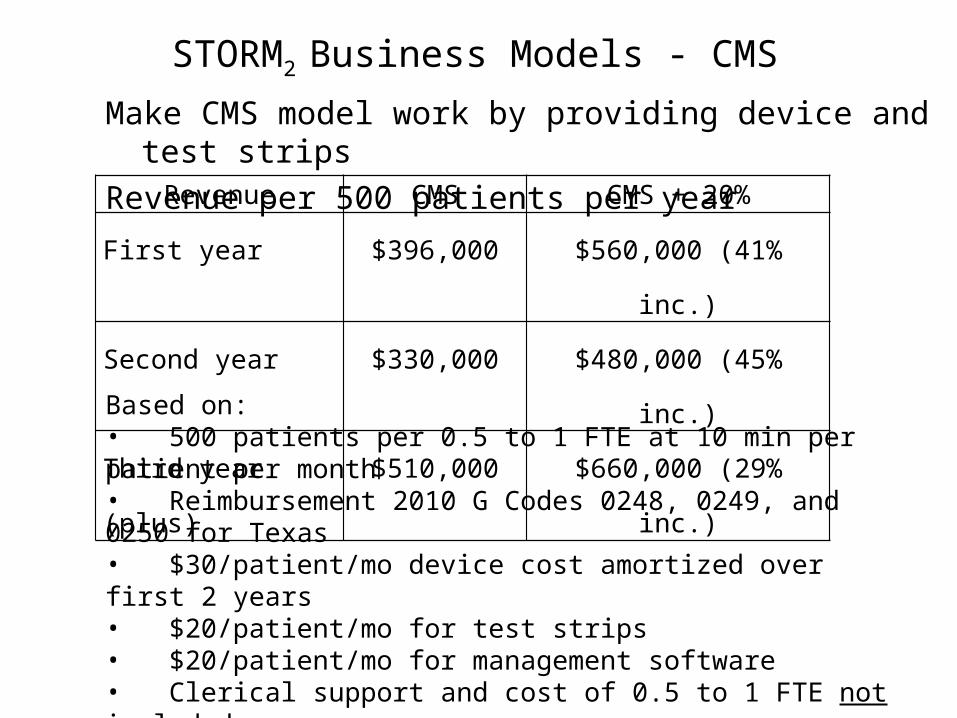
STORM2 Business Models - CMS
Make CMS model work by providing device and test strips
Revenue per 500 patients per yearRevenue CMS CMS + 20%
First year $396,000 $560,000 (41% inc.)
Second year $330,000 $480,000 (45% inc.)
Third year (plus) $510,000 $660,000 (29% inc.)
Based on:• 500 patients per 0.5 to 1 FTE at 10 min per patient per month• Reimbursement 2010 G Codes 0248, 0249, and 0250 for Texas• $30/patient/mo device cost amortized over first 2 years• $20/patient/mo for test strips• $20/patient/mo for management software• Clerical support and cost of 0.5 to 1 FTE not included
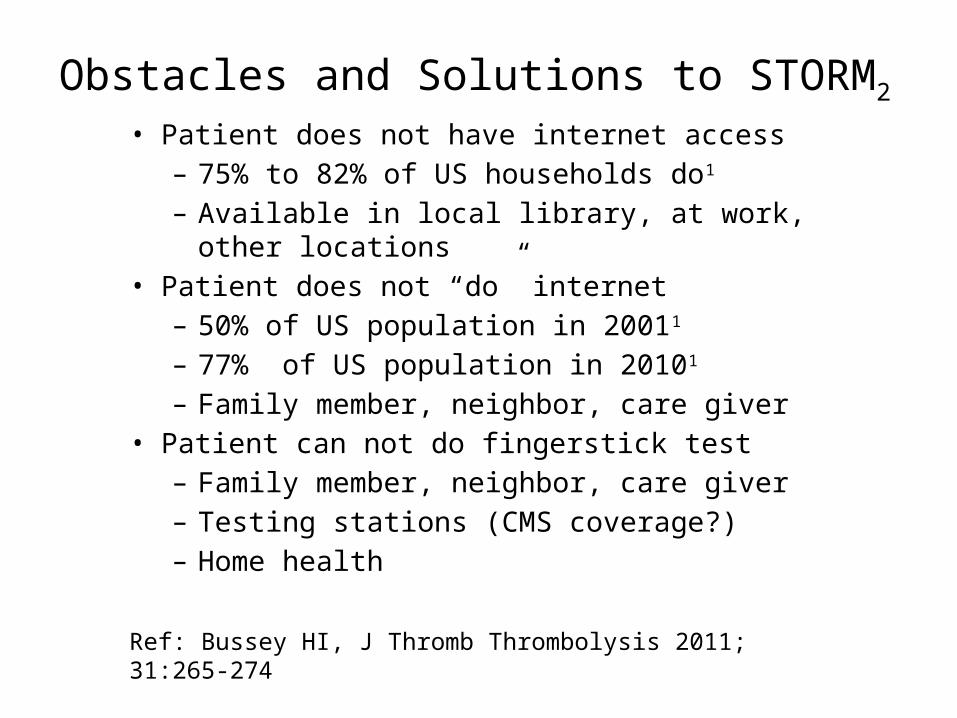
Obstacles and Solutions to STORM2
• Patient does not have internet access– 75% to 82% of US households do1
– Available in local library, at work, other locations• Patient does not “do” internet
– 50% of US population in 20011
– 77% of US population in 20101
– Family member, neighbor, care giver• Patient can not do fingerstick test
– Family member, neighbor, care giver– Testing stations (CMS coverage?)– Home health
Ref: Bussey HI, J Thromb Thrombolysis 2011; 31:265-274
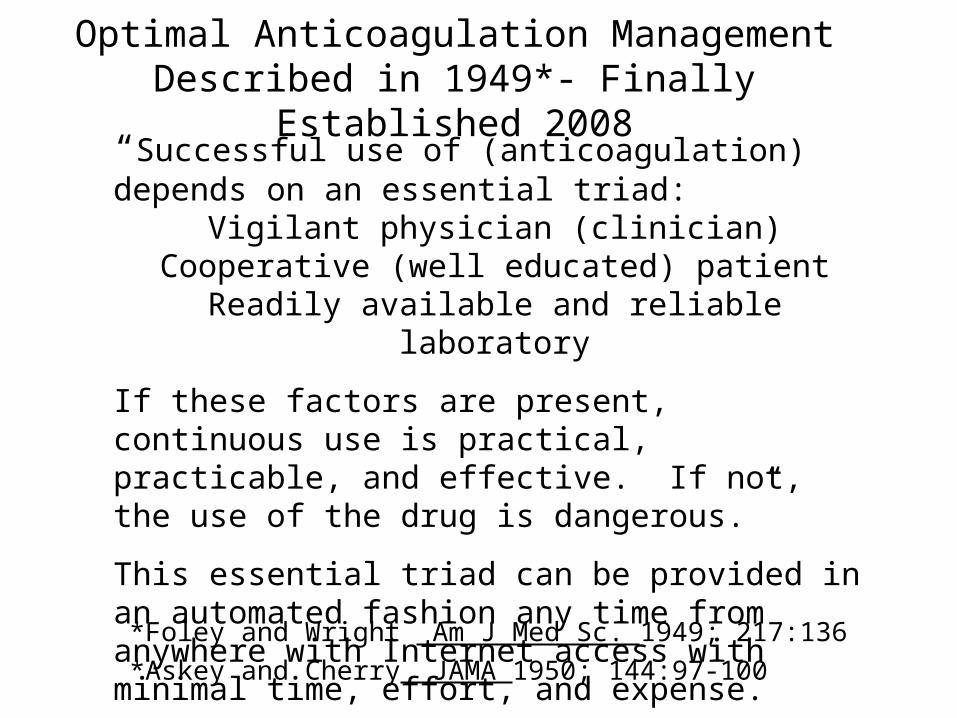
Optimal Anticoagulation ManagementDescribed in 1949*- Finally Established 2008“Successful use of (anticoagulation) depends on an essential triad:
Vigilant physician (clinician)Cooperative (well educated) patient
Readily available and reliable laboratory
If these factors are present, continuous use is practical, practicable, and effective. If not, the use of the drug is dangerous.”
This essential triad can be provided in an automated fashion any time from anywhere with Internet access with minimal time, effort, and expense.
*Foley and Wright Am J Med Sc. 1949; 217:136
*Askey and Cherry JAMA 1950; 144:97-100