ahrq comparative effectiveness review surveillance program › sites › default › ... · the...
TRANSCRIPT

CER # 36:
Nonsurgical Treatments for Urinary Incontinence in Adult Women: Diagnosis and Comparative Effectiveness
Original release date: April, 2012
Surveillance Report: Febuary, 2013
Key Findings: • KQ1 is up to date • 6 of 19 conclusions for KQ2 are possibly out of date • 5 of 11 conclusions for KQ3 are possibly out of date • Expert opinion: KQ’s1-3 are still valid. • There are no safety concerns
Summary Decision:
This CER’s priority for updating is Low
AHRQ Comparative Effectiveness Review
Surveillance Program

i
Authors: Investigators: Nadera Ahmadzai, Becky Skidmore Technical support: Raymond Daniel Advisory panel: David Moher, Mohammed Ansari Oversight/supervision: David Moher, Chantelle Garritty
None of the investigators has any affiliation or financial involvement that conflicts with material presented in this report

ii
Acknowledgments The authors gratefully acknowledge the following individuals for their contributions to this report: Drs. Sandra Engberg, Mary Forciea and Tatyana Shamliyan.
Subject Matter Experts
Sandra Engberg, Ph.D., R.N. Professor and Associate Dean for Clinical Education School of Nursing University of Pittsburgh Pittsburgh, PA Mary Forciea, M.D., F.A.C.P. University of Pennsylvania Philadelphia, PA Tatyana A Shamliyan, M.D., M.S. Research Associate Minnesota Evidence Based Practice Center Minneapolis, MN

iii
Contents
1. Introduction ........................................................................................................................... 1 2. Methods .................................................................................................................................. 3 3. Results ..................................................................................................................................... 6 4. Conclusion ............................................................................................................................ 16 5. References ............................................................................................................................. 38
Tables
Table 1: Summary Table……………………………………………………………………….. 17
Appendices Appendix A: Search Methodology Appendix B: Updating signals Appendix C: Evidence Table Appendix D: Questionnaire Matrix

1
1. Introduction The purpose of this mini-report is to apply the methodologies developed by the Ottawa and RAND Evidence-based Practice Centers and to determine whether the Comparative Effectiveness Review (CER) No. 36 (Nonsurgical Treatments for Urinary Incontinence in Adult Women: Diagnosis and Comparative Effectiveness)1, is in need of updating. This CER was originally released in April, 2012 and thus was due for a surveillance assessment in October 2012. This CER included 905 studies identified by using searches through December 30, 2011 and addressed three key questions to evaluate the Diagnosis and Comparative Effectiveness of Nonsurgical Treatments for Urinary Incontinence in Adult Women. The key questions of the original CER are as follows: Key Question 1. What constitutes an adequate diagnostic evaluation for women in the ambulatory care setting on which to base treatment of urinary incontinence?
1. What are the diagnostic values of different methods—questionnaires, checklists, scales, self reports of UI during a clinical examination, pad tests, and ultrasound when compared with multichannel urodynamics?
2. What are the diagnostic values of different methods questionnaires, checklists, scales, self reports of UI during a clinical examination, pad tests, and ultrasound when compared with a bladder diary?
3. What are the diagnostic values of the methods listed above for different types of UI, including stress, urgency, and mixed incontinence?
4. What is the association between patient outcomes (continence, severity and frequency of UI, quality of life) and UI diagnostic methods?
Key Question 2. How effective is the pharmacological treatment of UI in women? 1. How do pharmacologic treatments affect continence, severity and frequency of UI, and
quality of life when compared with no active treatment or with combined treatment modalities?
2. What is the comparative effectiveness of pharmacological treatments when compared with each other or with nonpharmacological treatments of UI?
3. What are the harms from pharmacological treatments when compared with no active treatment?
4. What are the harms from pharmacological treatments when compared with each other or with nonpharmacological treatments of UI?
5. Which patient characteristics, including age, type of UI, severity of UI, baseline disease that affects UI, adherence to treatment recommendations, and comorbidities, can modify the effects of the pharmacological treatments on patient outcomes, including continence, quality of life, and harms?
Key Question 3. How effective is the nonpharmacological treatment of UI in women?
1. How do nonpharmacological treatments affect incontinence, UI severity and frequency, and quality of life when compared with no active treatment?

2
2. How do combined modalities of nonpharmacological treatments with drugs affect incontinence, UI severity and frequency, and quality of life when compared with no active treatment or with monotherapy?
3. What is the comparative effectiveness of nonpharmacological treatments when compared with each other?
4. What are the harms from nonpharmacological treatments when compared with no active treatment?
5. What are the harms from nonpharmacological treatments when compared with each other?
6. Which patient characteristics, including age, type of UI, severity of UI, baseline disease that affects UI, adherence to treatment recommendations, and comorbidities, can modify the effects of the nonpharmacological treatments on patient outcomes, including continence, quality of life, and harms?
The conclusion(s) for each key question are found in the executive summary of the CER report.1

3
2. Methods
We followed a priori formulated protocol to search and screen literature, extract relevant data, and assess signals for updating. The identification of an updating signal (qualitative or quantitative) would be an indication that the CER might need to be updated. The Food and Drug Administration (FDA), Health Canada, and Medicines and Healthcare products Regulatory Agency (MHRA) surveillance alerts received from the Emergency Care Research Institute (ECRI) were examined for any relevant material for the present CER. The clinical expert opinion was also sought. All of this evidence was taken into consideration leading to a consensus-based decision on whether any given conclusion warrants updating (up to date, possibly out of date, or out of date). Based on this assessment, the CER was categorized into one of the three updating priority groups: high priority, medium priority, or low priority. Further details on the Ottawa EPC and RAND methods used for this project are found elsewhere.2-4
2.1 Literature Searches
The CER search strategies were reconstructed in: Ovid MEDLINE(R) In-Process & Other Non-Indexed Citations and Ovid MEDLINE(R) <1946 to October 29 2012>, limited to the dates June 1 2011 to October 29 2012; The Cochrane Library (searched October 24 2012), limited to 2011 to 2012; and PubMed (searched October 25 2012), limited to the dates June 1 2011 to Oct 25 2012. The syntax and vocabulary included both controlled MeSH subject headings and keywords. The search was limited to five general medical journals (Annals of Internal Medicine, BMJ, JAMA, Lancet, and New England Journal of Medicine) and six specialty journals (Journal of Urology, International Urogynecology Journal, Urology, Neurourol Urodyn, Obstetrics & Gynecology, BJU International). Further details on the search strategies are provided in the Appendix A of this mini-report.
2.2 Study Selection
All identified bibliographic records were screened using the same inclusion/exclusion criteria as described in the original CER.1
2.3 Expert Opinion
In total, 9 CER-specific experts (e.g., lead author, clinical content experts, and technical expert panel members) were requested to provide their opinion/feedback in a pre-specified matrix table on whether or not the conclusions as outlined in the Executive Summary of the original CER were still valid.
2.4 Check for Qualitative and Quantitative Signals

4
All relevant reports eligible for inclusion in the CER were examined for the presence of qualitative and quantitative signals using the Ottawa EPC method (see more details in Appendix B). CERs with no meta-analysis were examined for qualitative signals only. For any CER that contains meta-analysis (es), we first assess for the qualitative signal(s), and if no qualitative signal(s) are found, we then assess for quantitative signal(s). The identification of an updating signal (qualitative or quantitative) would be an indication that the CER might be in need of updating. The definition and categories of updating signals are presented in Appendix B and publications.3,4
2.5 Compilation of Findings and Conclusions
All the information obtained during the updating process (i.e., data on qualitative/quantitative signals, the expert opinions, and safety surveillance alerts) was collated, summarized and presented into a table. We determined whether the conclusions of the CER warranted updating using a four category scheme:
• Original conclusion is still up to date and this portion of CER does not need updating • Original conclusion is possibly out of date and this portion of CER may need updating • Original conclusion is probably out of date and this portion of CER may need updating • Original conclusion is out of date and this portion of CER is in need of updating
We used the following factors when making our assessments to categorize the CER conclusions:
• If we found no new evidence or only confirmatory evidence and all responding experts assessed the CER conclusion as still valid, we classified the CER conclusion as still up to date.
• If we found some new evidence that might change the CER conclusion, and /or a minority of responding experts assessed the CER conclusion as having new evidence that might change the conclusion, then we classified the CER conclusion as possibly out of date.
• If we found substantial new evidence that might change the CER conclusion, and/or a majority of responding experts assessed the CER conclusion as having new evidence that might change the conclusion, then we classified the CER conclusion as probably out of date.
• If we found new evidence that rendered the CER conclusion out of date or no longer applicable, we classified the CER conclusion as out of date. Recognizing that our literature searches were limited, we reserved this category only for situations where a limited search would produce prima facie evidence that a conclusion was out of date, such as the withdrawal of a drug or surgical device from the market, a black box warning from FDA, etc.
2.6 Determining Priority for Updating

5
Determining the priority groups (i.e., Low, Medium, and High) for updating any given CER is based on the following two criteria:
• How many conclusions of the CER are up to date, possibly out of date, or certainly out of date?
• How out of date are conclusions? (e.g., consideration of magnitude/direction of changes in estimates, potential changes in practice or therapy preference, safety issue including withdrawn from the market drugs/black box warning, availability of a new treatment)

6
3. Results
3.1 Update Literature Searches and Study Selection A total of 176 bibliographic records were identified (MEDLINE=62, Cochrane Library=53, and PubMed=61). After de-duping, 157 records remained (MEDLINE=57, combined Cochrane Library and PubMed=100) of which 30 potentially eligible records were selected for full text screening. Of these, five were included in this update. 5-9A total of 31 articles were suggested by the experts of which 11 10-20 included in this report and the rest were excluded because they either did not meet the eligibility criteria of the original CER, were already included in the original CER, or were irrelevant to the topic of interest. A total of 16 studies are included in this assessment. 5-20
3.2 Signals for Updating in Newly Identified Studies
3.2.1 Study overview
The study population demographics, treatment characteristics, and results for the 16 included studies are presented in Appendix C (Evidence Table). 5-20 In brief, 15 studies were RCTs 5-18,20, and one was systematic review of RCTs 19. Of these 9 5,6,8,10-12,18-20 were on pharmacological treatment, and 7 7,9,13-17 on non pharmacological treatments of urinary incontinence (UI). The sample size of the studies ranged from 45 15 to 2739 7. The follow up ranged from 4 weeks 6 to 1 year 7.
Of the nine studies on pharmacological treatments, three were on onabotulinumtoxinA 50-300 U versus (placebo in two studies 8,11, and oral anticholinergic medication such as solifenacin 5-10mg, and trospium XR 60mg in one study 20, one study on darifenacin (7.5 and 15mg) versus placebo 5 , one study on elocalcitol ( 75 and 150µg/d) versus placebo 6, one study on vaginal estrogen (0.5-1.25 mg vaginal cream, and 1-2mg vaginal ovulus) versus placebo 19, one study on solifenacin (5mg/daily) versus placebo 10, one study on fesoterodine (4-8 mg daily) versus placebo 18, and one study on oxybutynin chloride topical gel (1g/day) versus placebo 12. Of the seven studies on non pharmacological treatments, five were on pelvic floor muscle training (PFMT) versus [ bladder training (BT) in one study 9; Assisted PFMT in one study 17; group PFMT versus no intervention in one study 16; Paula Method (Circular Muscle Exercises) in one study 14; and vaginal cone in one study 15]. There was one study on intensive lifestyle intervention (ILI) versus diabetes support and education (DSE) 7, and one study on static magnetic stimulation (SMS) versus placebo 13.
3.2.2 Qualitative signals

7
See also Table 1 (Summary Table), Appendix B, and Evidence Table (Appendix C)
Key question #1 No new evidence was identified to answer Key Question # 1. No Signal Key question #2 Darifenacin Incontinence and Urgency: Consistent to the findings from the original CER, darifenacin improved incontinence and urgency episodes compared to placebo5:
• Darifenacin 7.5mg vs. Placebo: o The median difference of incontinence episodes per day, n(%) was significantly
lower in darifenacin group versus placebo at week 2 with further improvement at weeks 6 and 12: -0.3 (-7.7); p≤0.001
o The median difference of urgency episodes per day, n (%) was significantly lower in darifenacin arm compared to placebo arm at week 2 with further improvement at weeks 6 and 12: -0.6 (-8.3); p≤0.001
• Darifenacin 15mg vs. Placebo o The median difference of incontinence episodes per day, n(%) was significantly
lower in darifenacin group versus placebo at week 2 with further improvement at weeks 6 and 12: -0.6 (-12.2); p≤0.001
o The median difference of urgency episodes per day, n (%) was significantly lower in darifenacin arm compared to placebo arm at week 2 with further improvement at weeks 6 and 12:-1.0 (-13.1); p≤0.0015
No Signals Elocalcitol Incontinence and Urgency: The original CER did not have any data on elocalcitol; but we identified an RCT with the following findings6:
• Modified intention to treat analysis: frequency of incontinence episodes was significantly reduced in the elocalcitol 150 µg/day group compared with the placebo group: the mean difference = -0.58; p= 0.0296. 1 Signal
• Full set analysis:

8
o A non-significant difference was observed for incontinence episodes in patients received elocalcitol 150 µg/day versus the ones on placebo group: mean difference = 0.33;p= 0.1
o A non-significant difference was observed for urgency episodes in patients received elocalcitol 150 µg/day versus the ones on placebo group: mean difference = -0.33;p= 0.46. No Signals
Patient perception of bladder condition: The original CER did not have any data on elocalcitol; however, the updates search identified an RCT which demonstrated that the patient perception of bladder condition score was significantly improved in patients receiving elocalcitol 150 µg/day compared to patients in placebo group: OR= 0.46; 95% CI= 0.24, 0.87; p=0.02. However, a significant difference was not observed for the patients receiving elocalcitol 75 µg/day versus the ones in placebo group: OR= 0.60; 95% CI= 0.31, 1.14; p=0.126. 1 Signal
OnabotulinumtoxinA
Role of Patient Characteristics on Outcomes of Pharmacological Treatments (Prior Treatment Response): The original CER did not have any data on onabotulinumtoxinA as the prior treatment response. We identified an RCT via the update literature search which demonstrated that patients with DO at baseline experienced similar reductions in the number of urinary urgency incontinence compared to patients without DO at baseline, and they did not significantly differ from the patients in placebo group: number of urinary urgency incontinence in placebo and OnabotulinumtoxinA (50, 100, 150, 200, 300) Units were 8:
Change at 12 weeks from baseline
Patients with detrusor overactivity: -17.7, -21.1*, -18.6, -24.0**, -20.0*, -19.7***
Patients without detrusor overactivity: -16.3, -19.2, -17.6, -20.9, -18.2, -18.1 respectively 8.
* p<0.05; **p<0.001; ***p<0.01
No Signal
Anticholinergic drugs vs. onabotulinumtoxinA
The original CER did not have any data on comparison of anticholinergic drugs versus onabotulinumtoxinA. We identified one pivotal RCT that demonstrated data on the following outcomes20:

9
Urinary urgency episodes per day at 6 months: The two drugs did not differ significantly in reduction of urinary urgency incidence in patients from baseline to 6 months: 3.4 vs. 3.3; p=0.81 20No Signal
Adverse events:
Dry mouth: More patients on anticholenrgic drugs had dry mouth compared to patients on onabotulinumtoxinA: The [(n/N (%)] was 58/127 (46) versus 37/120 (31); p=0.0220 1 Signal Urinary tract infection: Fewer patients on anticholenrgic drugs had urinary tract infections compared to patients on onabotulinumtoxinA: The [(n/N (%)] was 16/127 (13) vs. 40/120 (33); p= <0.00120. 1 Signal
However there was no significant difference among the groups (anticholenrgic drugs versus onabotulinumtoxinA) for the following adverse events:
1 serious adverse events: The [(n/N (%)] was 6/127 (5) versus 4/120 (3); p= 0.70
Any adverse events: The [(n/N (%)] was 88/127 (69) versus 88/120 (73); p=0.79
Dry eyes: The [(n/N (%)] was 21/127 (17) versus 29/120 (24); p= 0.12
Constipation: The [(n/N (%)] was 36/127 (28) versus 25/120 (21); p=0.0620
No Signals
Estrogen
Consistent to the original CER findings, one identified systematic review that contained four studies demonstrated that vaginal estrogen (creams and pssaries) improved continence compare to no treatment or placebo: RR= 0.74; 95% CI= 0.64, 0.8619. No Signal
Solifenacin vs. Placebo
Consistent to the original CER findings, one RCT demonstrated that solifenacin increased continence rate, but higher number of patients in the group discontinued treatment due adverse effect than placebo 10.There was insufficient data on quality of life in the original CER, but this study showed that quality of life was significantly improved in patients receiving solifenacin compared to placebo:
• Mean number urgency episodes per 24 hours after 4 weeks: 5.77± 1.33 vs. 6.54±0.50, p<0.001

10
• Mean number severe urgency episodes per 24 hours after 4 weeks: 5.83±1.16 vs.
6.48±0.50, p<0.001 • Number of incontinence episodes after 4 weeks: 0.96±0.57 vs. 2.75±0.43, p<0.001 • The discontinuation rate owing to adverse effects: 4.5%–6.7% vs. 3.8%–6.1% 10
No Signals
• Quality of Life:
o Urinary Distress Inventory score: 22.26± 5.91 vs. 29.61±8.45, p<0.001 o Incontinence Impact Questionnaire score: 36.25±10.34 vs. 46.86±6.81, p<0.00110
1 Signal
OnabotulinumtoxinA vs. Placebo Consistent to the original CER findings, one identified RCT demonstrated significant improvement in urinary urgency incontinence (UUI) for patients on 150 U versus placebo, and significant complete continence for more patients on OnabotulinumtoxinA than on placebo11.
• >50% improvement versus baseline in urgency in 65% patients on 100 U; p=0.086 • >50% improvement versus baseline in urgency in 56% patients on 150 U; p=0.261 • >75% improvement versus baseline in UUI in 40% patients on 150 U; p=0.022 • >75% improvement versus baseline in UUI in 40% patients on 100 U; p=0.05811
No Signal • Complete continence rate at 3 months (50 U; 100 U; 150 U; Placebo):15.8%; 55%; 50%
;10.7% respectively; p<0.001 • Complete continence rate at 5 months (50 U; 100 U; 150 U; Placebo): 15.8%; 45.0%;
45.8%; 7.1% respectively; p < 0.00911 No Signal
Fesoterodine vs. Placebo Consistent to the original CER, findings from one identified RCT demonstrated that continence was significantly improved in patients who received fesoterodine, but they had more adverse events compared to placebo18.
• Change in urgency incontinence per day over 12 weeks [Mean difference: Mean± SD; (95% CI)]: -2.5 ±2.5 versus -1.8±2.7; -0.9 (-1.2 , -0.5); p<0.001
• Total incontinence per day over 12 weeks [Mean difference: Mean± SD; (95% CI)]: -
2.9± 2.7 versus -2.1± 2.9; -1.0 (-1.3, -0.6); p<0.00118

11
No Signal • At least one adverse event [n (%)]: 187 (61.7) versus 149 (49.5); p=0.00318
No Signal Oxybutynin chloride topical gel (OTG) vs. Placebo Consistent to the original CER, the findings from one RCT showed that patients in Oxybuynin group had significantly improved UI, but had more dry mouth compared to patients in placebo group. 12The original CER had insufficient data on quality of life but this RCT demonstrated a significant improvement for patients receiving OTG compared to placebo:
• Mean change from baseline at 12 week in daily UI episodes (Mean± SD): -3.0 ±2.8 versus -2.5 ± 3.0; p< 0.000112
No Signal • Adverse events (dry mouth): (7.4%) vs. (2.8%); p<006212
No Signal • Quality of life (health related domains): improvement in treatment group versus placebo;
p<0.01612 1 Signal Key question # 3 Weight loss: Consistent to the findings of the original CER, one RCT demonstrated that weight loss reduced UI incidence in overweight/obese women with type 2 diabetes7. Particularly, moderate weight loss reduced the incidence of UI at one year. The weekly UI by weight loss was:
• Per 1 kg [OR (95%CI)]: 0.97 (0.96, 0.99); p=0.001 • 5%- 10% vs. <5% [OR (95%CI)]: 0.58 (0.44, 0.77); p=0.0001 • >10% vs. <5%: 0.66 (0.50, 0.87); p= 0.004
The stress predominant incontinence by weight loss was • Per 1 kg [OR (95%CI)]: 0.97 (0.95, 0.99); p=0.008 • 5%- 10% vs. <5% [OR (95%CI)]: 0.67 (0.47, 0.95); p=0.031 • >10% vs. <5%: 0.59 (0.40, 0.87); p= 0.008
No Signal
12
Pelvic Floor Muscle Training (PFMT) vs. Bladder Training (BT): Urine loss at stress-cough test: The original CER did not have any data on comparison of PFMT versus BT. We identified one RCT demonstrating PFMT group having significantly greater improvement than BT group on cough stress test. The urine loss during stress cough test (median (IQR), 95% CI) at baseline was 0.8(4.9), 0.4, 2.3 versus 1(3.5), 0.1, 2; p=0.98, and at 5th month of follow up was 0.1 (1.5), 0.3, 3.1 versus 0.5(2.3), 1.0, 3.4; p=0.039. 1 Signal Assessment of Quality of Life (AQoL) The identified RCT did not show any significant difference for the quality of life between the two groups (PFMT versus BT). The AQoL total score [mean (SD); 95% CI] at the baseline was 10.02 (4.6) 8.6, 11.4 versus 9.65 (5.8) 7.8, 11.5; p=0.746, and at 5th months was 8.7 (4.8) 7.2, 10.1 vs. 8.9 (5.2) 7.3, 10.6; p=0.8369. No Signal Assisted Pelvic Floor Muscle Training (APFMT) versus PFMT:
Assessment of Quality of Life
The original CER did not have data on APFMT versus PFMT for quality of life. We identified one RCT that demonstrated no significant between group differences. The incontinence quality of life (IQoL) score mean difference (Mean ±SD) was 23.28 ± 1.79 versus 21.80 ± 1.50; with non significant p-value, and OR= 1.3; with 95% CI=0.8, 3.6 17. No Signal
PFMT versus no active treatment
Urinary loss
Consistent to the original CER findings PFMT improved continence in: 1) group treatment (GT), and, 2) individual treatment (IT) groups compared to no active treatment 16:
• PFMT GT vs. CG: Effect size= 0.91; 95% CI= 0.56, 5.80; p<0.0001 • PFMT IT vs. CG: Effect size= 0.90; 95% CI= 0.54, 5.84; p<0.000116
No Signal
Quality of life based on King’s Health Questionnaire domains:
The original CER did not have data on quality of life for PFMT versus no active treatment. We identified one RCT that demonstrated significant differences in three domains of quality of life measure favoring PFMT16:

13
• PFMT GT versus no treatment o Incontinence impact: Effect size (95% confidence interval) = -0.97 (6.55, 51.45) o Limitations of daily activity: Effect size (95% confidence interval) = -0.66 (-2.41
to 40.15) o Gravity: Effect size (95% confidence interval) = -0.86 (2.47,35.85)
• PFMT IT versus no treatment o Incontinence impact: Effect size (95% confidence interval) = - 1.47 (19.73, 60.43) o Limitations of daily activity: Effect size (95% confidence interval) = - 0.87 (3.37,
45.43) o Gravity: Effect size (95% confidence interval) = - 1.33 (13.45, 47.93)
For all variables, there were no differences between GT and IT groups16. 1 Signal Vaginal cone vs. Control; and PFTM vs. Control
Urinary leakage
Consistent to the original CER findings there was statistically significant difference between PFMT and control groups favoring PFMT, and between vaginal cone and control group favoring vaginal cones 15:
• Vaginal cone vs. Control (no treatment) [Mean (SD)]: 0.27 (0.36) vs. 3.65 (4.94) ; p<0.001
• PFTM vs. Control (no treatment) [Mean (SD)]: 0.29 (0.31) vs. 3.65 (4.94); p<0.00115
No Signals
Quality of life based on King’s Health Questionnaire domains:
The original CER did not have data on quality of life for PFMT versus no active treatment, and on vaginal cone versus no active treatment. We identified one RCT that demonstrated significant differences in two domains of quality of life measure favoring PFMT, and vaginal cone versus no treatment15:
• Vaginal cone vs. Control (no treatment) o Incontinence impact: Mean (SD) = 22.24 (20.6) vs. 57.84 (29.48); p=0.001 o Gravity: Mean (SD) = 17.35 (22.5) vs. 45.80 (23.09); p=0.01
• PFMT vs. Control (no treatment) o Incontinence impact: Mean (SD) = 17.76 (24.7) vs. 57.84 (29.48); p=0.001 o Gravity: Mean (SD) = 15.11 (23.0) vs. 45.80 (23.09); p=0.01

14
There were no differences between the vaginal cone and PFMT groups in any of the evaluations15. 1 Signal Static Magnetic Stimulation versus Placebo
In contrast to the original CER, the finding from one RCT demonstrated that magnetic stimulation did not improve UI and quality of life in women with UI compared to placebo. There was no statistically significant difference between the groups for UI episodes, UI symptoms, UI severity, and quality of life variables 13:
• Change in frequency of incontinent episodes (Baseline -12 Weeks): The median (IQR) was 0.75 (2.63) vs. 0.5 (2.0); p= 0.68
• Change in Severity Index of UI (Baseline -12 Weeks): The median (IQR) was 1.0 (3.0) vs. 0 (2.0); p= 0.59
• Change in Bristol Female Lower Urinary Tract Symptoms (BFLUTS) - UI symptoms (Baseline -12 Weeks): The median (IQR) was 1.5 (3.0) vs. 1.5 (3.0); p= 0.80
• Change in BFLUTS- quality of life (Baseline -12 Weeks): The median (IQR) was1.0 (5.0) vs. 0 (5.0); p= 0.28 13
2 Signals
Paula Method (circular muscle exercises) vs. PFMT The original CER had inconsistent findings on quality of life for comparison of circular muscle exercise versus PFMT. We identified one RCT that demonstrated non-significant differences between the groups: The quality of life (Mean± SD) was 83.49 (15.07) vs. 78.20 (18.39); p=NS.14 No Signal
3.2.3 Quantitative signals See also Table 1 (Summary Table), Appendix B, and Evidence Table (Appendix C) The presence of quantitative signals (B1 and B2) was checked only if the CER1 included a meta-analysis and none of the studies identified through the update search indicated a qualitative signal.

15
3.3 Safety surveillance alerts
No safety alerts were identified.
3.4 Expert opinion
Three of the 9 contacted clinical experts provided their responses/feedback in the matrix table (Appendix D).
All three experts agreed that the conclusions for the key questions were up-to-date and they were not informed of any evidence sufficient to invalidate the findings or the original CER. A total of 31 articles were suggested by the experts of which 11 10-20 included in this report and the rest were excluded because they either did not meet the eligibility criteria of the original CER, were already include in the original CER, or were irrelevant to the topic of interest.

16
4. Conclusion
Summary results and conclusions according to the information collated from different sources (updating signals from studies identified through the update search, safety surveillance alerts, and expert opinion) are provided in Table 1 (Summary Table). Based on the assessments, this CER is categorized in Low priority group for updating.
Key Question # 1
Signals from studies identified through the update search: No new evidence. No Signal
Experts: The experts stated that the conclusions for key question #1 are still valid.
Safety surveillance alerts: None
Conclusion: Up to date
Key Questions # 2
Signals from studies identified through the update search: Six qualitative signals met. 6 Signals
Experts: The experts stated that the conclusions for key question #2 are still valid.
Safety surveillance alerts: None
Conclusion: 6/19 conclusions are possibly out of date
Key Question # 3
Signals from studies identified through the update search: Five qualitative signals met.
5 Signals
Experts: The experts stated that the conclusions for key question #3 are still valid.
Safety surveillance alerts: None
Conclusion: 5/11 conclusions are possibly out of date

17
Table 1. Summary Table
Conclusions from CER’s Executive
Summary
Update literature
search results
Signals for updating FDA surveilla
nce alerts
Expert opinion
Conclusion on validity of CER conclusion (s)
Qualitative Quantitative
Key Question 1. What constitutes an adequate diagnostic evaluation for women in the ambulatory care setting on which to base treatment of urinary incontinence? What are the diagnostic values of different methods—questionnaires, checklists, scales, selfreports of UI during a clinical examination, pad tests, and ultrasound—when compared with multichannel urodynamics? What are the diagnostic values of different methods—questionnaires, checklists, scales, selfreports of UI during a clinical examination, pad tests, and ultrasound—when compared with a bladder diary? What are the diagnostic values of the methods listed above for different types of UI, including stress, urgency, and mixed incontinence? What is the association between patient outcomes (continence, severity and frequency of UI, quality of life) and UI diagnostic methods? Diagnosis of UI For Key Question 1, 99 studies of 81,043 women provided information on different methods for diagnosing UI. Described use of urodynamic testing as a reference standard test was very similar across the studies. Diagnostic methods to establish a clinical diagnosis of UI were described with different levels of detail and included patient history, physical and pelvic examination, urine culture, and other instrumental measures. The majority of studies demonstrated that the tests had only small diagnostic value in distinguishing women with urodynamic stress or urgency UI (Table
No new evidence
NA NA None All three experts stated the conclusions for key question was still valid. One of the experts referenced two studies but they both were already included in the original CER. One expert suggested one new reference 19.
Up to date

18
A). The diagnostic values were similar after random effects versus bivariate pooling methods. The quality of the studies did not explain statistical heterogeneity in pooled estimates. Measuring Treatment Success Urodynamic evaluation, which was used as a reference method in many diagnostic studies, detects the presence of UI but not the frequency and severity of UI episodes. Validated tools to measure UI treatment success based on meaningful changes in symptoms and quality of life for women include the Incontinence Severity Index; Patient Global Impression of Improvement and of Severity; Patient Perception of Bladder Condition; Urogenital Distress Inventory; Bladder Self-Assessment Questionnaire; International Consultation on Incontinence Modular Questionnaire-SF; Incontinence Impact Questionnaire; Urinary Incontinence-Specific Quality of Life Instrument; King’s Health Questionnaire; and Protection, Amount, Frequency, Adjustment, Body Image assessment tool. A reduction in UI episode frequency assessed with a 3- to 7-day diary was the most common primary outcome in the included RCTs. Importantly, women with daily stress UI perceived important

19
clinical benefit at reductions of approximately 50 percent and important incremental clinical value at reductions of 75 percent and 90 to 100 percent. Women reported improved quality of life and clinical success only when they experienced a greater than 70 percent reduction in urinary episode frequency assessed by a voiding diary. Smaller decreases (20 to 40 percent) in UI episode frequency were not clinically important when the results from a voiding diary were analyzed in association with the validated Incontinence Quality of Life questionnaire. The quality-of-life impact was similar for stress UI episode reductions of >40 percent to <70 percent. In the case of women with persistent urge, stress, or mixed UI, more than 60 percent reported complete treatment satisfaction on the Global Perception of Improvement and Incontinence Impact Questionnaire when they experienced more than 70 percent reduction in UI episodes according to voiding diaries. The few RCTs that analyzed differences in outcomes depending on baseline urodynamic diagnosis versus self-reported symptoms of stress, urgency, or mixed UI suggested no advantage with

20
urodynamic diagnosis. However, baseline urodynamic evaluation resulted in better prediction of harms from surgery for stress UI refractory to conservative treatments. Evidence was insufficient for the superiority of urodynamic evaluation’s prediction of nonsurgical treatment outcomes compared to diagnosis based on self-reported symptoms. Women’s perceptions of treatment success depend upon clinically important differences in their voiding diaries, scales, questionnaires, and impressions of global improvement. Key Question 2. How effective is the pharmacological treatment of UI in women? 1. How do pharmacologic treatments affect continence, severity and frequency of UI, and quality of life when compared with no active treatment or with combined treatment modalities? 2. What is the comparative effectiveness of pharmacological treatments when compared with each other or with nonpharmacological treatments of UI? 3. What are the harms from pharmacological treatments when compared with no active treatment? 4. What are the harms from pharmacological treatments when compared with each other or with nonpharmacological treatments of UI? 5. Which patient characteristics, including age, type of UI, severity of UI, baseline disease that affects UI, adherence to treatment recommendations, and comorbidities, can modify the effects of the pharmacological treatments on patient outcomes, including continence, quality of life, and harms? Efficacy of Pharmacological Treatments We synthesized the evidence of efficacy and comparative effectiveness of the drugs for predominant stress UI (including topical estrogen and serotonin-noradrenalin uptake inhibitors) and drugs for overactive bladder. Table
1 RCT 5
No Signal Darifenacin 7.5mg vs. Placebo Median difference of Incontinence episodes per day, n(%): -0.3 (-7.7); p≤0.001
NA None The experts stated that the conclusions for this key question were still valid. One expert referenced three new studies of which two were not
Possibly out of date

21
B demonstrates how many studies were examined for each outcome, how many subjects participated in the studies, and what percentage of subjects experienced the outcomes. The last column indicates our level of confidence that the evidence reflects the true effect of the treatment and that future research is unlikely to change the estimate of effect (Appendix Table F1 in the full report). Drugs were more effective than placebo in achieving continence and improving UI, but the magnitude of effect was low. The absolute risk difference in continence was less than 20 percent for all drugs. Pharmacological treatments resulted in fewer than 200 cases of continence attributable to the drugs per 1,000 treated. The studies had good quality with low risk of bias. Individual quality criteria and disclosure of conflict of interest were not associated with differences in the results. Stress UI Estrogen Individual RCTs indicated greater continence and improvement in UI with vaginal estrogen formulations and worsening of UI with transdermal patches. Duloxetine Duloxetine did not resolve stress UI when compared to placebo (Table B).
1 RCT 6
Median difference of Urgency episodes per day, n (%): -0.6 (-8.3); p≤0.001 Darifenacin 15mg vs. Placebo Median difference of Incontinence episodes per day, n(%): -0.6 (-12.2); p≤0.001 Median difference of Urgency episodes per day, n (%): -1.0 (-13.1); p≤0.001
2 Signals
Elocalcitol 150 µg/d; Elocalcitol 75 µg/d ; Placebo
Full analysis set: Urgency episodes: Mean±SD: -1.2 ± 2.9 ; -1.5±3; -0.8±2.4 Difference vs. placebo: -0.33;p= 0.4 (only for Elocalcitol 150 µg/d) Incontinence episodes:
include in this report because they did not meet the eligibility criteria of the original CER, and one was included 19. Another expert referenced five new study 10-12,18,20,21 The other expert referenced one study but was not included in this report because it was the journal publication of the same CER.

22
The risk of adverse effects was significantly higher with duloxetine than with placebo. Duloxetine resulted in improved UI in 75-140 women per 1,000 treated, while 129 women per 1,000 treated stopped taking duloxetine because of adverse effects. Urgency UI Oxybutynin Oxybutynin increased continence rates and improved UI more often than placebo but also resulted in treatment discontinuation due to adverse effects. Oxybutynin resolved UI in 114 women per 1,000 treated (95% CI, 64 to 163), while 63 women per 1,000 treated (95% CI, 12 to 127) discontinued oxybutynin because of adverse effects. This part is taken from page 46 of the body of CER:“Dry mouth was the most common adverse effect. Evidence was insufficient to conclude improved quality of life with oxybutynin.” Tolterodine Tolterodine increased continence rates and significantly improved UI more often than placebo. Tolterodine resolved UI in 85 women per 1,000 treated (95% CI, 40 to 129), while 83 women per 1,000 treated (95% CI, 47 to 120) experienced adverse effects. Discontinuation of treatment due to
Mean±SD: -0.5 ± 1.9 ; -0.7±1.7; -0.1±1.7 Difference vs. placebo: -0.33;p= 0.1 (only for Elocalcitol 150 µg/d) Modified intent-to-treat anaysis: Incontinence episodes: Mean±SD: -0.6 ± 1.8 ; -0.5±1.5; 0±1.7 Difference vs. placebo: -0.58;p= 0.029 (only for Elocalcitol 150 µg/d) Full analysis set: Patient perception of bladder condition: Elocalcitol 150 µg vs. placebo: OR= 0.46; 95% CI= 0.24, 0.87; p=0.02 Elocalcitol 75 µg vs. placebo: OR= 0.60; 95% CI= 0.31, 1.14; p=0.12

23
adverse effects did not differ between tolterodine and placebo. Darifenacin Darifenacin significantly improved urgency UI and several domains of quality of life more often than placebo. Darifenacin improved UI in 117 women per 1,000 treated (95% CI 57 to 177), while 190 women per 1,000 treated (95% CI, 118 to 260) experienced adverse effects. Treatment discontinuation rates due to adverse effects did not differ between darifenacin and placebo. The following is taken from the body of CER , page 50: “Continence Urinary continence outcomes were not examined with darifenacin treatment. One pooled analysis demonstrated that women did not experience continence for more than 7 consecutive days more often with 15 mg of darifenacin than with placebo486 (Appendix Table F55). The rates of more than 3 dry days/week were greater than placebo with 7.5 mg of darifenacin (RR 1.47, 95 percent CI, 1.02 to 2.13) and with 15 mg of darifenacin (RR 1.48, 95 percent CI, 1.04 to 2.09).486 The drug had to be given to 17 women to achieve 3 dry days/week in one woman.486 Improvement in UI
1 RCT 8 1 RCT 20
No Signal Placebo and OnabotulinumtoxinA (50, 100, 150, 200, 300)Units Number of urinary urgency incontinence: Change at 12 weeks from baseline Patients with DO: -17.7, -21.1*, -18.6, -24.0**, -20.0*, -19.7*** Patients without DO: -16.3, -19.2, -17.6, -20.9, -18.2, -18.1 * p<0.05 **p<0.001 ***p<0.01 1 Signal Anticholinergic drugs vs. onabotulinumtoxinA Reduction from baseline in the number of UUI episodes per day at 6 months: 3.4 vs. 3.3; p=0.81 Change from baseline in score on Quality of life scale: 37.05 vs. 37.05; p= 0.98

24
Darifenacin improved UI more often than placebo479,481,482 (Appendix Table F47). Darifenacin needed to be given to nine women in order to improve UI in one woman (Table 7). Pooled individual patient data from three RCTs also indicated a significant reduction of more than 90 percent in UI episodes more often with 7.5 mg and 15 mg of darifenacin than with placebo486 (Appendix Table F55). Women experienced reductions of more than 50 percent479,481,482 or more than 70 percent479,482 in UI episodes more often with darifenacin than with placebo.” Solifenacin Solifenacin increased continence rates; higher doses resulted in greater benefits. Treatment discontinuation due to adverse effects was more common with solifenacin than with placebo. Solifenacin resolved UI in 107 women per 1,000 treated (95% CI, 58 to 156), while 13 women per 1,000 (95% CI, 1 to 26) discontinued treatment because of adverse effects. Fesoterodine Fesoterodine increased continence rates. Significant improvement in UI with fesoterodine compared to placebo was
1 Systematic Review 19 1 RCT 10
Adverse events [(n/N (%)] 1 serious adverse events: 6/127 (5) vs. 4/120 (3); p= 0.70 Any adverse events: 88/127 (69) vs. 88/120 (73); p=0.79 Dry mouth: 58/127 (46) vs. 37/120 (31); p=0.02 Dry eyes: 21/127 (17)vs. 29/120 (24); p= 0.12 Constipation: 36/127 (28)vs. 25/120 (21); p=0.06 Urinary tract infection: 16/127 (13) vs. 40/120 (33); p= <0.001 No Signal Vaginal Estrogen (creams or pessaries) vs. no treatment or placebo Any incontinence: RR= 0.74; 955 CI= 0.64, 0.86) 1 Signal Solifenacin vs. Placebo

25
dose responsive. Fesoterodine resulted in higher rates of adverse effects and discontinuation of treatment due to adverse effects than placebo. Fesoterodine resolved UI in 130 women per 1,000 treated (95 percent CI, 58 to 202), while 31 women per 1,000 (95 percent CI, 10 to 56) stopped treatment due to adverse effects. Trospium Trospium increased continence rates more often than placebo. Risk of adverse effects was greater with trospium than with placebo. Trospium resolved UI in 114 women per 1,000 treated (95% CI, 83 to 144), while 18 women per 1,000 (95% CI, 4 to 33) stopped treatment because of harmful adverse effects. The following is taken from page 54 of the body of CER: “Clinical Effectiveness of Botulinum Toxin A high level of evidence suggested a reduction in UI episodes due to treatment with botulinum toxin, with an increased risk of elevated post-void residual in patients with severe urgency UI refractory to antimuscarinic drugs. Four RCTs of 185 subjects reported clinical outcomes after intravesicular injection of botulinum toxin315,519-521 (Appendix Table F27).
Mean number urgency episodes per 24 hours after 4 weeks: 5.77± 1.33 vs. 6.54±0.50, p<0.001 Mean number severe urgency episodes per 24 hours after 4 weeks: 5.83±1.16 vs. 6.48±0.50, p<0.001 Number of incontinence episodes after 4 weeks: 0.96±0.57 vs. 2.75±0.43, p<0.001 The discontinuation rate owing to adverse effects: 4.5%–6.7% vs. 3.8%–6.1% Quality of Life: UDI score: 22.26± 5.91 vs. 29.61±8.45, p<0.001 IIQ score: 36.25±10.34 vs. 46.86±6.81, p<0.001 Note: Higher UDI and IIQ scale scores reflect increasing symptom bother and greater impact on daily activities.

26
We found one systematic review of the literature about the efficacy and safety of botulinum toxin in the management of OAB.522 Continence Two RCTs demonstrated that botulinum injections resolved urgency UI. A single published RCT randomized 313 adults with idiopathic OAB and daily urgency UI to placebo or different doses of botulinum toxin.523 The outcomes were compared after intradetrusor injections of 50, 100, 150, 200, or 300 U of botulinum toxin or placebo.523 Continence rates were greater with the active drug (29.8 to 57.1 percent) than with placebo (15.9 percent, P <0.5) in a dose responsive fashion.523 One unpublished RCT315 demonstrated a significant increase in continence after a single injection of 100U to 300U of botulinum toxin. Improvement in UI One RCT reported greater rates of significant improvement in UI (>75 percent decrease in daily UI episodes) with botulinum toxin than with placebo520 (Appendix Table F65). Recently published RCTs examined different doses of the drug and demonstrated minimal additional or clinically relevant improvement in symptoms with doses higher than 150
1 RCT 11
No Signal OnabotulinumtoxinA vs. Placebo >50% improvement versus baseline in urgency in 65% patients on 100 U; p=0.086 >50% improvement versus baseline in urgency in 56% patients on 150 U; p=0.261 >75% improvement versus baseline in UUI in 40% patients on 150 U; p=0.022 >75% improvement versus baseline in UUI in 40% patients on 100 U; p=0.058 Complete continence at 3 months: 50 U; 100 U; 150 U; Placebo 15.8%; 55%; 50% ;10.7%; p<0.001 Complete continence at 5 months: 50 U; 100 U; 150 U; Placebo 15.8%; 45.0%;45.8%; 7.1%; p < 0.009

27
U.523 One RCT reported improvement in several domains in King’s Health Questionnaire on quality of life after botulinum toxin compared to placebo519 (Appendix Table F66). The differences were small but statistically significant for UI impact, severity measure, and sleep-energy disturbances.519 A systematic review demonstrated a significant reduction in daily UI episodes by 3.88 episodes per day (95 percent CI, -6.15 to -1.62) after botulinum.522 Botulinum toxin, however, increased the risk of elevated post-void residual (pooled RR 8.55, 95 percent CI, 3.2 to 22.71).522 Published RCTs found that the drug caused treatment-related adverse effects in 40 percent, and post-void residual (PVR) related catheterization in 20 percent of patients.523 The rates of urinary tract infection increased in a dose responsive manner from 37 percent with 100 U to 47.2 percent with 300 U.523 The rates of urinary retention also increased in a dose responsive manner from 19 percent with 100 U to 25 percent with 300 U.523 Treatment failure with unchanged or increased UI was less common with botulinum than with placebo (RR 0.29, 95 percent CI, 0.14 to 0.63).520”
1 RCT 18 1 RCT 12
No Singal Fesoterodine vs. Placebo Change in urgency incontinence per day over 12 weeks [Mean±SD; Mean difference (95% CI)]: -2.5 ±2.5 vs. -1.8±2.7; -0.9 (-1.2 , -0.5); p<0.001 Total incontinence per day over 12 weeks [Mean±SD; Mean difference (95% CI)]: -2.9±2.7 vs. -2.1± 2.9; -1.0 (-1.3, -0.6); p<0.001 At least one adverse event [n (%)]: 187 (61.7) vs. 149 (49.5); p=0.003 1 Signal OTG vs. Placebo Mean change from baseline at

28
Comparative Effectiveness of Pharmacological Treatments Evidence of the comparative effectiveness of different drugs was insufficient for the majority of comparisons. Oxybutynin and tolterodine had the same benefits, but tolterodine was safer. The numbers needed to treat (NNT) to achieve continence in one woman were similar across drugs. Treatment discontinuation due to adverse effects was greater than with placebo for all drugs, excluding darifenacin and tolterodine; NNT to achieve discontinuation due to adverse effects was highest with solifenacin (NNT=78) and lowest with oxybutynin (NNT=16). Several retrospective observational studies analyzed the long-term comparative effectiveness and safety of pharmacological treatments for UI. The evidence-based cost utility analysis reported that more than half of patients stop taking drugs for UI after 1 year of treatment. The lowest rates of treatment discontinuation were with 5 mg of solifenacin.16 Role of Patient Characteristics on Outcomes of Pharmacological Treatments Age Treatment response was similar across
12 week in daily UI episodes (Mean± SD): -3.0 ±2.8 vs. -2.5 ± 3.0; p< 0.0001 Adverse events (dry mouth) (7.4%) vs. (2.8%); p<0062) Quality of life (health related domains): improved in treatment group versus placebo ( p<0.016).

29
age groups. Solifenacin increased continence rates more often than placebo, regardless of age. Oxybutynin, trospium, and darifenacin improved UI in older women. Oxybutynin reduced UI frequency and produced subjective benefits compared to placebo in frail community-dwelling older people. Darifenacin improved UI when compared to placebo in older women. The drug needed to be given to eight older patients to achieve more than a 50 percent reduction in UI episodes in one person. Cognitive function changes did not differ between darifenacin and placebo in short-term (2-week) treatment. Trospium improved UI and quality of life in older subjects with overactive bladder. Solifenacin caused serious adverse effects less often than oxybutynin in older patients, with no differences between the drugs in younger patients. Race We found limited evidence about treatment responses in race subgroups. Only one study, of duloxetine, examined clinical outcomes in different race groups. Evidence was inconclusive about racial differences in the treatment effects of duloxetine in women with stress UI. Comorbidities

30
One RCT examined the role of comorbidities. Duloxetine was no better than placebo in women with depression, diabetes, and chronic lung diseases. Trospium was effective in resolving UI regardless of body mass index in obese and normal weight women. Baseline UI Evidence was limited from which to conclude any differences in benefits by baseline frequency and severity of UI. Studies found no differences in outcomes between tolterodine and solifenacin in subjects with baseline mixed or pure urgency UI. Subjects with mixed UI may require a larger dose and longer treatment than women with urgency UI to achieve clinical benefits from solifenacin. Inclusion of women with mixed UI did not significantly modify the treatment benefits from oxybutynin and solifenacin across the studies in meta-regression and subgroup analyses. The baseline frequency of UI did not dramatically modify the effects of the drugs on clinical outcomes. Subjects with more frequent UI had slightly greater benefits with solifenacin or fesoterodine than with placebo. In contrast, trospium was better than placebo at resolving UI only in subjects with fewer than five UI episodes per day.

31
Trospium did not resolve UI in subgroups with more than five episodes of UI per day (relative risk [RR] 1.2, 95% CI, 0.93 to 1.56). Prior Treatment Response Solifenacin was effective regardless of the response to previous treatments; however, poor responders did not benefit from increasing the dose of the drug. We could not examine differences in the treatment response to other drugs among those who failed prior treatments because the studies provided neither subgroup analyses within trials nor consistent reporting of the percentage of nonresponders for subgroup analyses across the trials. Concomitant Treatments Trospium reduced the number of urgency UI episodes irrespective of concomitant medications. Adverse effects were more common in those taking seven or more concomitant
medications.
Key Question 3. How effective is the nonpharmacological treatment of UI in women? 1. How do nonpharmacological treatments affect incontinence, UI severity and frequency, and quality of life when compared with no active treatment? 2. How do combined modalities of nonpharmacological treatments with drugs affect incontinence, UI severity and frequency, and quality of life when compared with no active treatment or with monotherapy? 3. What is the comparative effectiveness of nonpharmacological treatments when compared with each other? 4. What are the harms from nonpharmacological treatments when compared with no active treatment?

32
5. What are the harms from nonpharmacological treatments when compared with each other? 6. Which patient characteristics, including age, type of UI, severity of UI, baseline disease that affects UI, adherence to treatment recommendations, and comorbidities, can modify the effects of the nonpharmacological treatments on patient outcomes, including continence, quality of life, and harms? Efficacy of Nonpharmacological Treatments Nonpharmacological treatments were better than no active treatment in achieving continence and improving UI, according to RCTs (Table B). The magnitude of effect was large. The majority of the studies included women with mixed UI. Inclusion of women with mixed UI did not dramatically modify the treatment effects in meta-regression and subgroup analyses. We examined the effects of the interventions on predominant stress or urgency UI when the authors reported that information. A summary of the evidence of effectiveness of all treatments, including strength of evidence, is found in Table B. Stress UI Pelvic Floor Muscle Training Pelvic floor muscle training (PFMT) increased continence rates and improved UI more often than usual care. PFMT combined with bladder training increased continence rates and improved mixed UI. PFMT with biofeedback improved UI. Vaginal Cones Evidence was insufficient from which to
1 RCT 7 1 RCT
No Signal ILI +DSE UI by amount of weight lost at 1 year in women Weekly incontinence by weight loss: Per 1 kg [OR (95%CI)]: 0.97 (0.96, 0.99); p=0.001 5%- 10% vs. <5% [OR (95%CI)]: 0.58 (0.44, 0.77); p=0.0001 >10% vs. <5%: 0.66 (0.50, 0.87); p= 0.004 Stress predominant incontinence by weight loss: Per 1 kg [OR (95%CI)]: 0.97 (0.95, 0.99); p=0.008 5%- 10% vs. <5% [OR (95%CI)]: 0.67 (0.47, 0.95); p=0.031 >10% vs. <5%: 0.59 (0.40, 0.87); p= 0.008 1 Signal
NA None The experts stated that the conclusions for this key question were valid. One expert referenced five new studies that are included in this report 13-17. Another expert suggested one study that was included in this report13
Possibly out of date

33
draw valid conclusions. Uncontrolled high risk of bias studies of other intravaginal and intraurethral devices demonstrated that they improved UI but also resulted in high discontinuation rates and adverse effects. Intravaginal Electrical Stimulation Intravaginal electrical stimulation increased continence rates and improved UI more often than sham stimulation. Magnetic Stimulation Magnetic stimulation improved UI but did not increase continence more than sham stimulation. Urgency UI Bladder Training Bladder training improved UI when compared to usual care. Percutaneous Tibial Nerve Stimulation Percutaneous tibial nerve stimulation improved UI. Individual RCTs indicated no difference in adverse effects and treatment discontinuation with active or sham stimulation. Mixed UI Specialized Continence Services Studies indicated no consistently greater benefits for continence or improvement of UI with continence services implemented by specialized providers compared to usual care. Comparison across studies was difficult because of
9 1 RCT 17
PFMT vs. BT Urine loss during stress test- cough: median (IQR), 95% CI Baseline: 0.8(4.9), 0.4, 2.3 vs. 1(3.5), 0.1, 2 ; p=0.98 At 5 months: 0.1 (1.5), 0.3, 3.1 vs. 0.5(2.3), 1.0, 3.4; p=0.03 AQoL total score: mean (SD) 95% CI Baseline: 10.02 (4.6) 8.6, 11.4 vs. 9.65 (5.8) 7.8, 11.5 ; p=0.746 5 months: 8.7 (4.8) 7.2, 10.1 vs. 8.9 (5.2) 7.3, 10.6 ; p=0.836 No Signal APFMT vs. PFMT at 3 months IQOL Score Mean difference (Mean ±SD): 23.28 ± 1.79 vs. 21.80 ± 1.50; p=NS OR= 1.3;,95% CI=0.8, 3.6

34
the variety of interventions that constituted complex continence services. Weight Loss Weight loss and exercise improved UI in obese women without evident harms. Comparative Effectiveness of Nonpharmacological Treatments Clinical outcomes of one nonpharmacological treatment versus another were reported in 54 RCTs, but these trials rarely compared the same treatment effects, which decreased the strength of evidence to low. We found no differences in UI between supervised PFMT combined with bladder training and self-administered PFMT. Continence did not differ between bladder training combined with PFMT and bladder training alone. Indirect comparison indicated the comparable effectiveness of nonpharmacological treatments on continence. Cases of continence achieved per 1,000 treated were 299 for PFMT,162 for electrical stimulation, and 166 for PFMT combined with bladder training. Rates of continence were comparable with different treatments: 38 percent of women became continent with PFMT, 23 percent became continent with electrical stimulation, and 21 percent became continent with PFMT combined with bladder training.
1 RCT 16
1 Signal Urinary loss PFMT GT vs. CG: Effect size= 0.91; 95% CI= 0.56, 5.80; p<0.0001 PFMT IT vs. CG: Effect size= 0.90; 95% CI= 0.54, 5.84; p<0.0001 Quality of life based on King’s Health Questionnaire domains: PFMT GT PFMT IT versus no treatment: Incontinence impact: Effect size (95% confidence interval)= -0.97 (6.55, 51.45) Limitations of daily activity: Effect size (95% confidence interval)= -0.66 (-2.41 to 40.15) Gravity: Effect size (95% confidence interval)= -0.86 (2.47,35.85) PFMT IT PFMT IT versus no treatment: Incontinence impact: Effect size (95% confidence interval)= - 1.47 (19.73, 60.43)

35
This is taken from page # 108 of the original CER: “Comparative Effectiveness of Behavioral Weight Loss and Education Evidence was insufficient to conclude comparative effectiveness between behavioral weight loss intervention and education. Women reported more frequent improvement in mixed UI(defined as more than 70 percent reduction in weekly UI episodes) at 12 months with a behavioral weight loss intervention than with education699 (Appendix Table F131). The differences remained significant only for urgency UI at 18 months posttreatment.699” The following is taken from body of CER page: 99 “Clinical Effects of Magnetic Stimulation A moderate level of evidence indicated that magnetic stimulation improved UI but did not increase urinary continence more than sham stimulation. Evidence of improved quality of life was low. Five RCTs examined magnetic stimulation.587-591 The studies of magnetic stimulation included women with UI,588 stress UI,587,590 mixed,590 or predominant urgency UI589 (Appendix Table F81). Magnetic stimulation was
1 RCT 15
Limitations of daily activity: Effect size (95% confidence interval)= - 0.87 (3.37, 45.43) Gravity: Effect size (95% confidence interval)= - 1.33 (13.45, 47.93) 1 Signal Urinary leakage (after treatment): Vaginal cone vs. Control [Mean (SD)]: 0.27 (0.36) vs. 3.65 (4.94) ; p<0.001 PFTM vs. Control [Mean (SD)]: 0.29 (0.31) vs. 3.65 (4.94); p<0.001 Quality of life based on King’s Health Questionnaire (KHQ) domains: Vaginal cone vs. Control Incontinence impact: Mean (SD) = 22.24 (20.6) vs. 57.84 (29.48); p=0.001 Gravity: Mean (SD) = 17.35 (22.5) vs. 45.80 (23.09);

36
described with different levels of detail using 10 Hz,588,591 15Hz,587,590 or 18.5Hz589 for 1,587 2,590 6,591 or 8 weeks.588,589 The studies compared active with sham stimulation using double blind,587,589,590 single blind,588 or open label591 designs.”
1 RCT 13
p=0.01 PFMT vs. Control Incontinence impact: Mean (SD) = 17.76 (24.7) vs. 57.84 (29.48); p=0.001 Gravity: Mean (SD) = 15.11 (23.0) vs. 45.80 (23.09); p=0.01 KHQ Scoring: The total score ranges from 0 to 100 and a score of 100 represents the worst possible quality of life, and 0 represents the best possible quality of life 2 Signal SMS vs. Placebo Change in frequency of incontinent episodes (Baseline -12 Weeks) Median (IQR): 0.75 (2.63) vs. 0.5 (2.0); p= 0.68 Change in Severity Index of UI (Baseline -12 Weeks) Median (IQR): 1.0 (3.0) vs. 0 (2.0); p= 0.59

37
1 RCT 14
Change in BFLUTS - UI symptoms (Baseline -12 Weeks) Median (IQR): 1.5 (3.0) vs. 1.5 (3.0); p= 0.80 Change in BFLUTS- Quality of life (Baseline -12 Weeks) Median (IQR): 1.0 (5.0) vs. 0 (5.0); p= 0.28 No Signal Paula Method (Circular Muscle Exercises) vs. PFMT Quality of life (Mean± SD): 83.49 (15.07) vs. 78.20 (18.39); p=NS
Abbreviations: CER:comparative effectiveness review; SMBP: Self-measured blood pressure monitoring; BP: blood pressure; SBP: Systolic blood pressure; DBP: diastolic blood pressure; versus; UUI; urinary urgency incontinence ;DO: detrusor overactivity; IDC: involuntary detrusor contraction; PFMT: pelvic floor muscle training ; BT: bladder training; AQoL: Assessment of Quality of Life; OAB: overactive bladder; APFMT: assisted pelvic floor muscle training; PFMT: pelvic floor muscle training; IQOL: incontinence Quality Of Life); GT: group treatment; IT: individual treatment; CG: control group; NR: not reported; NS: Not significant; NA: Not applicable; RR: Relative Risk; OR= Odds Ratio; SMS: Static Magnetic Stimulation; OAB: Overactive Bladder Syndrome; UDI: Urinary Distress Inventory; IIQ: Incontinence Impact Questionnaire; SUI: Stress Urinary Incontinence; OTG: oxybutynin chloride topical gel

38
References
1. Shamliyan T, Wyman J, Kane RL. Nonsurgical Treatments for Urinary Incontinence in Adult Women: Diagnosis and Comparative Effectiveness. 2012 Apr.
2. Shekelle PG, Newberry SJ, Wu H et al. Identifying signals for updating systematic reviews: A comparison of two methods [Internet]. 2011 Jun.
3. Shekelle P, Newberry S, Maglione M et al. Assessment of the need to update comparative effectiveness reviews: Report of an initial rapid program assessment (2005-‐2009) [Internet]. 2009 Sep 10.
4. Shojania KG, Sampson M, Ansari MT, et al. How quickly do systematic reviews go out of date? A survival analysis. Ann Intern Med 2007 Aug 21;147(4):224-‐33. [PMID: PM:17638714].
5. Khullar V, Foote J, Seifu Y, et al. Time-‐to-‐effect with darifenacin in overactive bladder: a pooled analysis. Int Urogynecol J 2011 Dec;22(12):1573-‐80.
6. Digesu GA, Verdi E, Cardozo L, et al. Phase IIb, multicenter, double-‐blind, randomized, placebo-‐controlled, parallel-‐group study to determine effects of elocalcitol in women with overactive bladder and idiopathic detrusor overactivity. Urology 2012 Jul;80(1):48-‐54.
7. Phelan S, Kanaya AM, Subak LL, et al. Weight loss prevents urinary incontinence in women with type 2 diabetes: results from the Look AHEAD trial. J Urol 2012;187(3):939-‐44.
8. Rovner E, Kennelly M, Schulte-‐Baukloh H, et al. Urodynamic results and clinical outcomes with intradetrusor injections of onabotulinumtoxinA in a randomized, placebo-‐controlled dose-‐finding study in idiopathic overactive bladder. Neurourol Urodyn 2011;30(4):556-‐62.
9. Sherburn M, Bird M, Carey M, et al. Incontinence improves in older women after intensive pelvic floor muscle training: an assessor-‐blinded randomized controlled trial. Neurourol Urodyn 2011;30(3):317-‐24.
10. Oreskovic S, But I, Banovic M, et al. The efficacy and safety of solifenacin in patients with overactive bladder syndrome. Coll Antropol 2012 Mar;36(1):243-‐8. [PMID: PM:22816227].
11. Denys P, Le NL, Ghout I, et al. Efficacy and safety of low doses of onabotulinumtoxinA for the treatment of refractory idiopathic overactive bladder: a multicentre, double-‐blind, randomised, placebo-‐controlled dose-‐ranging study. Eur Urol 2012 Mar;61(3):520-‐9. [PMID: PM:22036776].

39
12. Sand PK, Davila GW, Lucente VR, et al. Efficacy and safety of oxybutynin chloride topical gel for women with overactive bladder syndrome. Am J Obstet Gynecol 2012 Feb;206(2):168-‐6. [PMID: PM:21963104].
13. Wallis MC, Davies EA, Thalib L, et al. Pelvic static magnetic stimulation to control urinary incontinence in older women: a randomized controlled trial. Clin Med Res 2012 Feb;10(1):7-‐14. [PMID: PM:21817123].
14. Liebergall-‐Wischnitzer M, Paltiel O, Hochner CD, et al. Sexual function and quality of life of women with stress urinary incontinence: a randomized controlled trial comparing the Paula method (circular muscle exercises) to pelvic floor muscle training (PFMT) exercises. J Sex Med 2012 Jun;9(6):1613-‐23. [PMID: PM:22510279].
15. Pereira VS, de Melo MV, Correia GN, et al. Vaginal cone for postmenopausal women with stress urinary incontinence: randomized, controlled trial. Climacteric 2012 Feb;15(1):45-‐51. [PMID: PM:22066898].
16. Pereira VS, Correia GN, Driusso P. Individual and group pelvic floor muscle training versus no treatment in female stress urinary incontinence: a randomized controlled pilot study. Eur J Obstet Gynecol Reprod Biol 2011
Dec;159(2):465-‐71. [PMID: PM:21962461].
17. Kashanian M, Ali SS, Nazemi M, et al. Evaluation of the effect of pelvic floor muscle training (PFMT or Kegel exercise) and assisted pelvic floor muscle training (APFMT) by a resistance device (Kegelmaster device) on the urinary incontinence in women: a randomized trial. Eur J Obstet Gynecol Reprod Biol 2011 Nov;159(1):218-‐23. [PMID: PM:21741151].
18. Huang AJ, Hess R, Arya LA, et al. Pharmacologic treatment for urgency-‐predominant urinary incontinence in women diagnosed using a simplified algorithm: a randomized trial. Am J Obstet Gynecol 2012 May;206(5):444-‐11. [PMID: PM:22542122].
19. Cody JD, Jacobs ML, Richardson K, et al. Oestrogen therapy for urinary incontinence in post-‐menopausal women. Cochrane Database Syst Rev 2012;10:CD001405 . [PMID: PM:23076892].
20. Visco AG, Brubaker L, Richter HE, et al. Anticholinergic versus botulinum toxin A comparison trial for the treatment of bothersome urge urinary incontinence: ABC trial. Contemp Clin Trials 2012 Jan;33(1):184-‐96. [PMID: PM:22008247].
21. Shojania, K. G., Sampson, M., Ansari, M. T., Ji, J., Garritty, C., Rader, T., and Moher, D. Updating Systematic Reviews. [Internet]. http://www.ncbi.nlm.nih.gov/books

40
/NBK44099/. 20734512Last Accessed: 13-‐11-‐2012

41
Appendix A: Search Methodology
The searches were limited to the following journals:
General biomedical – Annals of Internal Medicine, BMJ, JAMA, Lancet, and New England Journal of Medicine
Specialty journals – Journal of Urology, International Urogynecology Journal, Urology, Neurourol Urodyn, Obstetrics & Gynecology, BJU International
Database: Ovid MEDLINE(R) In-Process & Other Non-Indexed Citations and Ovid MEDLINE(R) <1946 to Present> Search Strategy: -------------------------------------------------------------------------------- 1 exp Urinary Incontinence/di (2969) 2 limit 1 to (english language and humans and (guideline or practice guideline)) (23) 3 exp Clinical Protocols/ (114264) 4 1 and 3 (18) 5 exp Decision Trees/ (8184) 6 1 and 5 (19) 7 6 or 4 (34) 8 limit 7 to (english language and humans) (25) 9 2 or 8 (47) 10 exp urinary incontinence/dh, th, su, rt (10872) 11 exp urinary incontinence/dt (1780) 12 10 not 11 (10631) 13 (non pharmacologic or nonpharmacologic).mp. (3309) 14 10 and 13 (11) 15 exp treatment outcome/ (570920) 16 exp epidemiologic studies/ (1473821) 17 12 or 14 (10634) 18 15 and 16 and 17 (1265) 19 exp quality of life/ (103645) 20 16 and 17 and 19 (360) 21 18 or 20 (1404) 22 limit 21 to (english language and humans) (1246) 23 limit 22 to journal article (1223) 24 exp urinary incontinence/dt (1780) 25 exp treatment outcome/ (570920) 26 exp quality of life/ (103645) 27 25 or 26 (655374) 28 24 and 27 (473) 29 exp epidemiologic studies/ (1473821) 30 28 and 29 (128) 31 limit 30 to (english language and humans) (113) 32 limit 31 to journal article (111) 33 exp Urinary Incontinence/dh, nu, th, su, rt, dt, rh (14539) 34 exp Office Visits/ or exp Medical Office Buildings/ (5363) 35 exp Hospitals/ (188698)

42
36 exp Nursing Homes/ (30393) 37 34 or 35 or 36 (222444) 38 33 and 37 (367) 39 exp epidemiologic studies/ (1473821) 40 38 and 39 (63) 41 limit 40 to (english language and humans) (57) 42 exp urinary incontinence/ (24527) 43 exp primary health care/ (71404) 44 42 and 43 (148) 45 exp epidemiologic studies/ (1473821) 46 44 and 45 (21) 47 exp physician-patient relations/ (56906) 48 42 and 45 and 47 (13) 49 46 or 48 (32) 50 limit 49 to english language (28) 51 limit 50 to journal article (27) 52 exp Urinary Incontinence/di (2969) 53 exp Diagnosis, Differential/ (359607) 54 52 and 53 (207) 55 limit 54 to (english language and humans) (125) 56 exp Urinary Incontinence/th, su, dt, rh (13330) 57 exp Treatment Outcome/ (570920) 58 56 and 57 (2874) 59 exp Evidence-Based Practice/ or exp Evidence-Based Medicine/ or evidence.mp. (1044915) 60 58 and 59 (235) 61 limit 58 to "therapy (optimized)" (579) 62 60 or 61 (735) 63 limit 62 to (english language and humans) (683) 64 exp epidemiological studies/ (1473821) 65 63 and 64 (260) 66 limit 65 to journal article (257) 67 9 or 23 or 32 or 41 or 51 or 55 or 66 (1584) 68 jama.jn. (62947) 69 "annals of internal medicine".jn. (27628) 70 bmj.jn. (74710) 71 "new england journal of medicine".jn. (66154) 72 lancet.jn. (123061) 73 urology.jn. (19331) 74 "journal of urology".jn. (42417) 75 neurourology & urodynamics.jn. (1814) 76 bju international.jn. (8427) 77 obstetrics & gynecology.jn. (23106) 78 International urogynecology journal.jn. (2544) 79 or/68-78 (452139) 80 67 and 79 (678) 81 (201106* or 201107* or 201108* or 201109* or 201110* or 201112* or 2012*).ed. (1447340) 82 80 and 81 (62) *************************** Cochrane Library 2012 Oct 26

43
Search #1
#1 Urinary incontinence 2544 #2 surgery 96391 #3 #1 not #2 117 (from 2011 to 2012) DSR – 40 DARE - 9 CENTRAL – 58 Methods – 3 HTA - 5 NHS EED – 5 Cochrane Groups – 0 Search #2
#1 Urinary incontinence AND women 157 (from 2011 to 2012)
DSR – 83 DARE - 7 CENTRAL – 61 Methods – 0 HTA - 0 NHS EED – 1 Cochrane Groups – 5 53 citations in select journals after de-duping across Cochrane
PubMed searches:
Search #1 2012 Oct 25
Search Query Items found
#6 Search #1 AND #2 Filters: Humans; Randomized Controlled Trial; English 54
#5 Search #1 AND #2 Filters: Humans; Randomized Controlled Trial 57
#4 Search #1 AND #2 Filters: Randomized Controlled Trial 57
#3 Search #1 AND #2 550
#2 Search ("2011/06/01"[Date - Entrez] : "3000"[Date - Entrez]) 1272372
#1 Search ("Urinary Incontinence/radiotherapy"[Mesh] OR "Urinary Incontinence/rehabilitation"[Mesh] OR "Urinary Incontinence/surgery"[Mesh] OR "Urinary Incontinence/therapy"[Mesh])
15422
18 records after limiting to selected journals and de-duping with Cochrane records
Search #2
Search Query Items found

44
Search Query Items found
#6 Search #1 AND #2 Filters: Humans; Randomized Controlled Trial; English 95
#5 Search #1 AND #2 Filters: Humans; Randomized Controlled Trial 101
#4 Search #1 AND #2 Filters: Humans 1168
#3 Search #1 AND #2 2114
#2 Search ("2011/06/01"[Date - Entrez] : "3000"[Date - Entrez]) 1272372
#1 Search "Urinary incontinence" OR "overactive bladder" OR fesoterodine OR oxybutynin OR trospium OR solifenacin OR tolterodine
31083
11 records after limiting to selected journals and de-duping with previous PubMed and Cochrane records
Search #3
Search Query Items found
#13 Search #12 NOT #8 0
#12 Search #3 Filters: Randomized Controlled Trial; English; Female; Adult: 19+ years 68
#8 Search #1 AND #2 Filters: Humans; Randomized Controlled Trial; English 95
#5 Search #1 AND #2 Filters: Humans; Randomized Controlled Trial 101
#4 Search #1 AND #2 Filters: Humans 1168
#3 Search #1 AND #2 2114
#2 Search ("2011/06/01"[Date - Entrez] : "3000"[Date - Entrez]) 1272372
#1 Search "Urinary incontinence" OR "overactive bladder" OR fesoterodine OR oxybutynin OR trospium OR solifenacin OR tolterodine
31083
0 records after de-duping with previous PubMed searches Search #3 – Peer Review Suggested Search – RCTs & Multicenter Studies
Search Query Items found
#23 Search #22 NOT (#8 OR #12) Filters: English 31
#22 Search #21 AND #2 Filters: English 103
#21 Search #16 OR #19 Filters: English 1497
#20 Search #16 OR #19 1613
#19 Search #15 Filters: Humans; Randomized Controlled Trial 1143
#18 Search #15 Filters: Humans 25976
#17 Search #15 25976
#16 Search "urinary incontinence" Filters: Humans; Multicenter Study 792
#15 Search "urinary incontinence" Filters: Humans 25976
#14 Search "urinary incontinence" 28631
#13 Search #12 NOT #8 0
#12 Search #3 Filters: Randomized Controlled Trial; English; Female; Adult: 19+ years 68
#8 Search #1 AND #2 Filters: Humans; Randomized Controlled Trial; English 95

45
Search Query Items found
#5 Search #1 AND #2 Filters: Humans; Randomized Controlled Trial 101
#4 Search #1 AND #2 Filters: Humans 1168
#3 Search #1 AND #2 2114
#2 Search ("2011/06/01"[Date - Entrez] : "3000"[Date - Entrez]) 1272372
#1 Search "Urinary incontinence" OR "overactive bladder" OR fesoterodine OR oxybutynin OR trospium OR solifenacin OR tolterodine
31083
31 records after de-duping with previous PubMed searches Search #4 Peer Review Suggested Search "transcutaneous tibial nerve stimulation”
Search Query Items found
#7 Search #5 AND #6 Filters: Humans; English 0
#6 Search ("2011/06/01"[Date - Entrez] : "3000"[Date - Entrez]) Filters: Humans; English
464347
#5 Search #1 NOT #2 Filters: Humans; English 1
#4 Search #1 NOT #2 Filters: Humans 1
#3 Search #1 NOT #2 2
#2 Search review[Publication Type] 1717049
#1 Search "transcutaneous tibial nerve stimulation" AND "urinary incontinence" 2
0 records after de-duping with previous PubMed searches Search #5 Peer Review Suggested Search "tibial nerve stimulation"
Search Query Items found
#7 Search #5 AND #6 Filters: Humans; English 3
#6 Search ("2011/06/01"[Date - Entrez] : "3000"[Date - Entrez]) Filters: Humans; English
464347
#5 Search #1 NOT #2 Filters: Humans; English 22
#4 Search #1 NOT #2 Filters: Humans 23
#3 Search #1 NOT #2 25
#2 Search review[Publication Type] 1717049
#1 Search "tibial nerve stimulation" AND "urinary incontinence" 30
1 record after limiting to select journals and de-duping with previous results

46
Appendix B: Updating Signals
Qualitative signals*
Potentially invalidating change in evidence
This category of signals (A1-A3) specifies findings from a pivotal trial**, meta-analysis (with at least one new trial), practice guideline (from major specialty organization or published in peer-reviewed journal), or recent textbook (e.g., Up-To-Date):
• Opposing findings (e.g., effective vs. ineffective) – A1 • Substantial harm (e.g., the risk of harm outweighs the benefits) – A2 • A superior new treatment (e.g., new treatment that is significantly superior to the one
assessed in the original CER) – A3
Major change in evidence
This category of signals (A4-A7) refers to situations in which there is a clear potential for the new evidence to affect the clinical decision making. These signals, except for one (A7), specify findings from a pivotal trial, meta-analysis (with at least one new trial), practice guideline (from major specialty organization or published in peer-reviewed journal), or recent textbook (e.g., Up-To-Date):
• Important changes in effectiveness short of “opposing findings” – A4 • Clinically important expansion of treatment (e.g., to new subgroups of subjects) – A5 • Clinically important caveat – A6 • Opposing findings from meta-analysis (in relation to a meta-analysis in the original CER)
or non-pivotal trial – A7
* Please, see Shojania et al. 200721 for further definitions and details **A pivotal trial is defined as: 1) a trial published in top 5 general medical journals such as: Lancet, JAMA, Annals of Intern Med, BMJ, and NEJM. Or 2) a trial not published in the above top 5 journals but have a sample size of at least triple the size of the previous largest trial in the original CER.

47
Appendix B: Updating Signals (Continued)
Quantitative signals (B1-B2)* Change in statistical significance (B1)
Refers to a situation in which a statistically significant result in the original CER is now NOT statistically significant or vice versa- that is a previously non-significant result become statistically significant. For the ‘borderline’ changes in statistical significance, at least one of the reports (the original CER or new updated meta-analysis) must have a p-value outside the range of border line (0.04 to 0.06) to be considered as a quantitative signal for updating.
Change in effect size of at least 50% (B2) Refers to a situation in which the new result indicates a relative change in effect size of at least 50%. For example, if relative risk reduction (RRR) new / RRR old <=0.5 or RRR new / RRR old >=1.5. Thus, if the original review has found RR=0.70 for mortality, this implies RRR of 0.3. If the updated meta-analytic result for mortality were 0.90, then the updated RRR would be 0.10, which is less than 50% of the previous RRR. In other words the reduction in the risk of death has moved from 30% to 10%. The same criterion applied for odds ratios (e.g., if previous OR=0.70 and updated result were OR=0.90, then the new reduction in odds of death (0.10) would be less 50% of the magnitude of the previous reduction in odds (0.30). For risk differences and weighted mean differences, we applied the criterion directly to the previous and updated results (e.g., RD new / RD old <=0.5 or RD new / RD old >=1.5).
* Please, see Shojania et al. 20074,21 for further definitions and details

48
Appendix C: Evidence Table
Author year Study name
(if applicable)
Study design
Subjects
Treatment groups (n; dose)
Treatment /
Follow up
duration
Outcomes and findings
Key Question 1. What constitutes an adequate diagnostic evaluation for women in the ambulatory care setting on which to base treatment of urinary incontinence? 1. What are the diagnostic values of different methods—questionnaires, checklists, scales, selfreports of UI during a clinical examination, pad tests, and ultrasound when compared with multichannel urodynamics? 2. What are the diagnostic values of different methods—questionnaires, checklists, scales, selfreports of UI during a clinical examination, pad tests, and ultrasound—when compared with a bladder diary? 3. What are the diagnostic values of the methods listed above for different types of UI, including stress, urgency, and mixed incontinence? 4. What is the association between patient outcomes (continence, severity and frequency of UI, quality of life) and UI diagnostic methods? No new evidence was identified for this key question.
NA NA NA NA NA
Key Question 2. How effective is the pharmacological treatment of UI in women? 1. How do pharmacologic treatments affect continence, severity and frequency of UI, and quality of life when compared with no active treatment or with combined treatment modalities? 2. What is the comparative effectiveness of pharmacological treatments when compared with each other or with nonpharmacological treatments of UI? 3. What are the harms from pharmacological treatments when compared with no active treatment? 4. What are the harms from pharmacological treatments when compared with each other or with nonpharmacological treatments of UI? 5. Which patient characteristics, including age, type of UI, severity of UI, baseline disease that affects UI, adherence to treatment recommendations, and comorbidities, can modify the effects of the pharmacological treatments on patient outcomes, including continence, quality of life, and harms? Vik Khullar, 2011 5 RCT 1059 pts with
overactive bladder; Mean age:56.5 yrs;
Darifenacin (n=318; 7.5mg) versus Darifenacin (n= 291; 15mg) versus placebo
12 Weeks Darifenacin 7.5mg vs. Placebo
Median difference of Incontinence episodes per day, n(%): -0.3 (-7.7); p≤0.001 Median difference of Urgency episodes per day, n (%):

49
Author year Study name
(if applicable)
Study design
Subjects
Treatment groups (n; dose)
Treatment /
Follow up
duration
Outcomes and findings
Male: 15% (n=357; NA) -0.6 (-8.3); p≤0.001
Darifenacin 15mg vs. Placebo
Median difference of Incontinence episodes per day, n(%): -0.6 (-12.2); p≤0.001 Median difference of Urgency episodes per day, n (%): -1.0 (-13.1); p≤0.001
G. Alessandro Digesu, 2012 6
RCT 308 women with overactive bladder and idiopathic detrusor overactivity; Mean age:55.4 yrs; Male: 0%
Elocalcitol (n=87; 75 µg/d) versus Elocalcitol (n= 84; 150 µg/d) versus placebo (n=86; NA)
4 Weeks Elocalcitol 150 µg/d; Elocalcitol 75 µg/d ; Placebo
Full analysis set: Urgency episodes: Mean±SD: -1.2 ± 2.9 ; -1.5±3; -0.8±2.4 Difference vs. placebo:
-0.33;p= 0.4 (only for Elocalcitol 150 µg/d) Incontinence episodes: Mean±SD: -0.5 ± 1.9 ; -0.7±1.7; -0.1±1.7 Difference vs. placebo:
-0.33;p= 0.1 (only for Elocalcitol 150 µg/d)
Modified intent-to-treat anaysis:

50
Author year Study name
(if applicable)
Study design
Subjects
Treatment groups (n; dose)
Treatment /
Follow up
duration
Outcomes and findings
Incontinence episodes: Mean±SD: -0.6 ± 1.8 ; -0.5±1.5; 0±1.7 Difference vs. placebo:
-0.58;p= 0.029 (only for Elocalcitol 150 µg/d)
Full analysis set:
Patient perception of bladder condition:
Elocalcitol 150 µg vs. placebo: OR= 0.46; 95% CI= 0.24, 0.87; p=0.02
Elocalcitol 75 µg vs. placebo: OR= 0.60; 95% CI= 0.31, 1.14; p=0.12
Eric Rovner, 20118 RCT 313 pts with idiopathic overactive bladder (OAB); Mean age: 58.8 yrs Male: 8%
OnabotulinumtoxinA (n= 269; dose: 50-300 U) vs. placebo (n=44; dose: NA)
36 Weeks Placebo and OnabotulinumtoxinA (50, 100, 150, 200, 300)Units
Number of urinary urgency incontinence:
Change at 12 weeks from baseline
Patients with detrusor overactivity: -17.7, -21.1*, -18.6, -24.0**, -20.0*, -19.7***
Patients without detrusor overactivity: -16.3, -19.2, -17.6, -

51
Author year Study name
(if applicable)
Study design
Subjects
Treatment groups (n; dose)
Treatment /
Follow up
duration
Outcomes and findings
20.9, -18.2, -18.1
* p<0.05
**p<0.001
***p<0.01
Anthony G. Visco,2012 20
1 RCT (pivotal)
249 pts with idiopathic urgency urinary incontinence; Mean age: 58 yrs; Male: 0%
Oral anticholinergic medication (solifenacin, 5 mg initially, with possible escalation to 10 mg and, if necessary, subsequent switch to trospium XR, 60 mg) plus one intradetrusor injection of saline (n=126) vs. one intradetrusor injection of 100 U of onabotulinumtoxinA plus daily oral placebo (n=121)
Six months
Anticholinergic drugs vs. onabotulinumtoxinA
Reduction from baseline in the number of UUI episodes per day at 6 months: 3.4 vs. 3.3; p=0.81
Change from baseline in score on Quality of life scale: 37.05 vs. 37.05; p= 0.98
Adverse events [(n/N (%)]
1 serious adverse events: 6/127 (5) vs. 4/120 (3); p= 0.70
Any adverse events: 88/127 (69) vs. 88/120 (73); p=0.79
Dry mouth: 58/127 (46) vs. 37/120 (31); p=0.02
Dry eyes: 21/127 (17)vs. 29/120 (24); p= 0.12
Constipation: 36/127 (28)vs. 25/120 (21); p=0.06
Urinary tract infection: 16/127 (13) vs. 40/120 (33); p=

52
Author year Study name
(if applicable)
Study design
Subjects
Treatment groups (n; dose)
Treatment /
Follow up
duration
Outcomes and findings
<0.001
Cody JD, 2012 19 Systematic Review of RCTs
4 studies containing 213 pts with UI; Mean age: NR; Male: 0%
Vaginal Estrogen (n=106; dose: 0.5-1.25 mg vaginal cream, and 1-2mg vaginal ovulus) vs. no treatment or placebo (n=107; dose: NA)
NR Vaginal Estrogen (creams or pessaries) vs. no treatment or placebo
Any incontinence:
RR= 0.74; 955 CI= 0.64, 0.86)
Slavko Oreskovic, 2012 10
RCT 171 pts with OAB; Mean age: 56.9 yrs; Male: 0%
Solifenacin (n=NR; dose:5mg/daily) vs. Placebo (n=NR; dose:NA)
4 weeks Solifenacin vs. Placebo
Mean number urgency episodes per 24 hours after 4 weeks: 5.77± 1.33 vs. 6.54±0.50, p<0.001 Mean number severe urgency episodes per 24 hours after 4 weeks: 5.83±1.16 vs. 6.48±0.50, p<0.001 Number of incontinence episodes after 4 weeks: 0.96±0.57 vs. 2.75±0.43, p<0.001 The discontinuation rate owing to adverse effects: 4.5%–6.7% vs. 3.8%–6.1% Quality of Life: Urinary Distress Inventory score: 22.26± 5.91 vs. 29.61±8.45, p<0.001
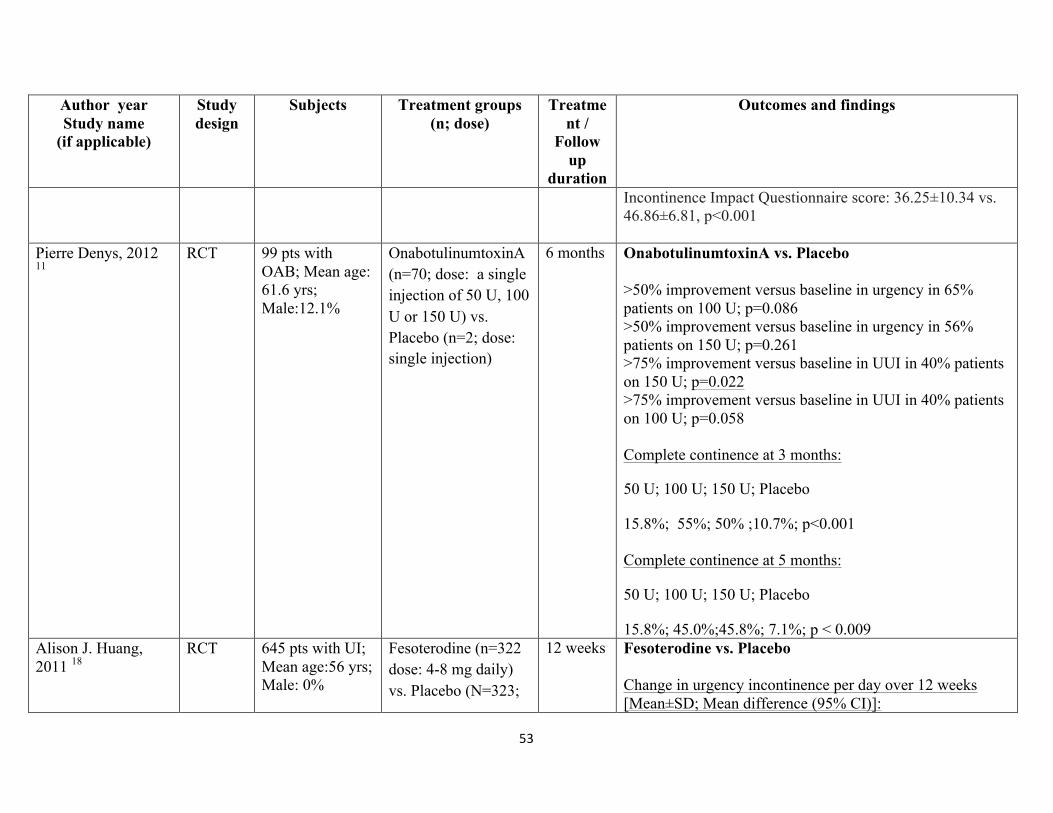
53
Author year Study name
(if applicable)
Study design
Subjects
Treatment groups (n; dose)
Treatment /
Follow up
duration
Outcomes and findings
Incontinence Impact Questionnaire score: 36.25±10.34 vs. 46.86±6.81, p<0.001
Pierre Denys, 2012 11
RCT 99 pts with OAB; Mean age: 61.6 yrs; Male:12.1%
OnabotulinumtoxinA (n=70; dose: a single injection of 50 U, 100 U or 150 U) vs. Placebo (n=2; dose: single injection)
6 months OnabotulinumtoxinA vs. Placebo >50% improvement versus baseline in urgency in 65% patients on 100 U; p=0.086 >50% improvement versus baseline in urgency in 56% patients on 150 U; p=0.261 >75% improvement versus baseline in UUI in 40% patients on 150 U; p=0.022 >75% improvement versus baseline in UUI in 40% patients on 100 U; p=0.058 Complete continence at 3 months:
50 U; 100 U; 150 U; Placebo
15.8%; 55%; 50% ;10.7%; p<0.001 Complete continence at 5 months:
50 U; 100 U; 150 U; Placebo
15.8%; 45.0%;45.8%; 7.1%; p < 0.009 Alison J. Huang, 2011 18
RCT 645 pts with UI; Mean age:56 yrs; Male: 0%
Fesoterodine (n=322 dose: 4-8 mg daily) vs. Placebo (N=323;
12 weeks Fesoterodine vs. Placebo Change in urgency incontinence per day over 12 weeks [Mean±SD; Mean difference (95% CI)]:
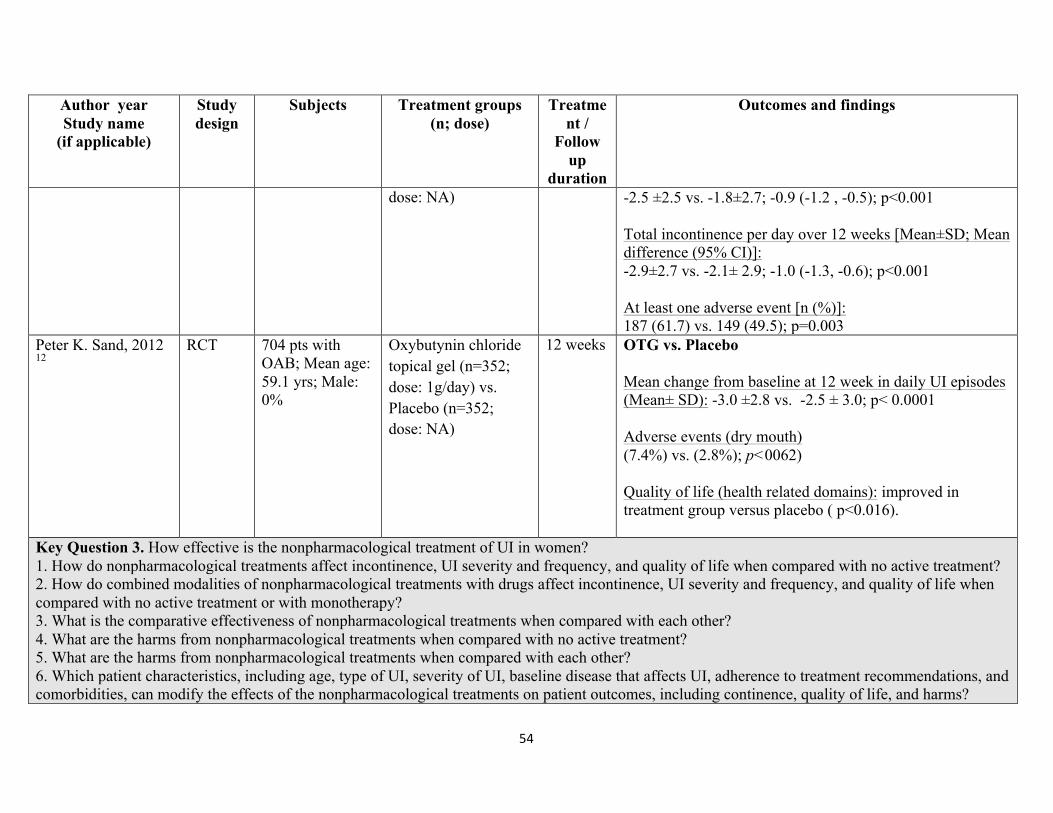
54
Author year Study name
(if applicable)
Study design
Subjects
Treatment groups (n; dose)
Treatment /
Follow up
duration
Outcomes and findings
dose: NA) -2.5 ±2.5 vs. -1.8±2.7; -0.9 (-1.2 , -0.5); p<0.001 Total incontinence per day over 12 weeks [Mean±SD; Mean difference (95% CI)]: -2.9±2.7 vs. -2.1± 2.9; -1.0 (-1.3, -0.6); p<0.001 At least one adverse event [n (%)]: 187 (61.7) vs. 149 (49.5); p=0.003
Peter K. Sand, 2012 12
RCT 704 pts with OAB; Mean age: 59.1 yrs; Male: 0%
Oxybutynin chloride topical gel (n=352; dose: 1g/day) vs. Placebo (n=352; dose: NA)
12 weeks OTG vs. Placebo Mean change from baseline at 12 week in daily UI episodes (Mean± SD): -3.0 ±2.8 vs. -2.5 ± 3.0; p< 0.0001 Adverse events (dry mouth) (7.4%) vs. (2.8%); p<0062) Quality of life (health related domains): improved in treatment group versus placebo ( p<0.016).
Key Question 3. How effective is the nonpharmacological treatment of UI in women? 1. How do nonpharmacological treatments affect incontinence, UI severity and frequency, and quality of life when compared with no active treatment? 2. How do combined modalities of nonpharmacological treatments with drugs affect incontinence, UI severity and frequency, and quality of life when compared with no active treatment or with monotherapy? 3. What is the comparative effectiveness of nonpharmacological treatments when compared with each other? 4. What are the harms from nonpharmacological treatments when compared with no active treatment? 5. What are the harms from nonpharmacological treatments when compared with each other? 6. Which patient characteristics, including age, type of UI, severity of UI, baseline disease that affects UI, adherence to treatment recommendations, and comorbidities, can modify the effects of the nonpharmacological treatments on patient outcomes, including continence, quality of life, and harms?

55
Author year Study name
(if applicable)
Study design
Subjects
Treatment groups (n; dose)
Treatment /
Follow up
duration
Outcomes and findings
Suzanne Phelan, 2012 7
RCT 2739 overweight/obese women with type 2 diabetes; Mean age: 57.9 yrs; Male: 0%
Intensive lifestyle Intervention (ILI) (n=1389; dose: NA) vs. Diabetes Support and Education (DSE) (n= 1354;dose:NA)
1 year ILI + DSE
UI by amount of weight lost at 1 year in women overall
Weekly incontinence by weight loss:
Per 1 kg [OR (95%CI)]: 0.97 (0.96, 0.99); p=0.001
5%- 10% vs. <5% [OR (95%CI)]: 0.58 (0.44, 0.77); p=0.0001
>10% vs. <5%: 0.66 (0.50, 0.87); p= 0.004
Stress predominant incontinence by weight loss:
Per 1 kg [OR (95%CI)]: 0.97 (0.95, 0.99); p=0.008
5%- 10% vs. <5% [OR (95%CI)]: 0.67 (0.47, 0.95); p=0.031
>10% vs. <5%: 0.59 (0.40, 0.87); p= 0.008
Margaret Sherburn, 2011 9
RCT 84 community dwelling older women with stress urinary Incontinence; mean age: 71.5
PFMT (n=43; dose:NA) vs. BT (n= 41; dose:NA)
20 Week PFMT vs. BT
Urine loss during stress test- cough: median (IQR), 95% CI
Baseline: 0.8(4.9), 0.4, 2.3 vs. 1(3.5), 0.1, 2 ; p=0.98
At 5 months: 0.1 (1.5), 0.3, 3.1 vs. 0.5(2.3), 1.0, 3.4; p=0.03

56
Author year Study name
(if applicable)
Study design
Subjects
Treatment groups (n; dose)
Treatment /
Follow up
duration
Outcomes and findings
yrs; Male: 0% AQoL total score: mean (SD) 95% CI
Baseline: 10.02 (4.6) 8.6, 11.4 vs. 9.65 (5.8) 7.8, 11.5 ; p=0.746
5 months: 8.7 (4.8) 7.2, 10.1 vs. 8.9 (5.2) 7.3, 10.6 ; p=0.836
Maryam Kashanian, 2011 17
RCT 91 pts with UI; Mean age: 39.8 yrs; Male: 0%
APFMT (N= 41; twice/day for 15 minutes each, for 12 weeks) vs. PFMT (n= 50; twice/day for 15 minutes each, for 12 weeks)
12 weeks APFMT vs. PFMT
IQOL Score (Mean ±SD):
PFMT (Before vs. 3 months after intervention): 53.15 ± 23.77 vs. 76.44±15.34; p=0.000
APFMT (Before vs. 3 months after intervention): 50.01 ± 10.36 vs. 71.82 ± 8.63; p=0.000
IQOL Score Mean difference (Mean ±SD):
PFMT vs. APFMT at 3 months: 23.28 ± 1.79 vs. 21.80 ± 1.50; p=NS
OR= 1.3;,95% CI=0.8, 3.6
Vanessa S. Pereira16 RCT 49 pts with stress urinary leakage;
PFMT CG (n=17;two, 1hour sessions per
6 weeks Urinary loss

57
Author year Study name
(if applicable)
Study design
Subjects
Treatment groups (n; dose)
Treatment /
Follow up
duration
Outcomes and findings
Mean age:60.7 yrs; Male: 0%
week) vs. PFMT IG (n=17; two, 1hour sessions per week) vs. CG (n=15; no sessions)
GT vs. CG:
Effect size= 0.91; 95% CI= 0.56, 5.80; p<0.0001
IT vs. CG:
Effect size= 0.90; 95% CI= 0.54, 5.84; p<0.0001
Quality of life based on King’s Health Questionnaire domains:
PFMT GT versus no treatment:
Incontinence impact: Effect size (95% confidence interval)= -0.97 (6.55, 51.45)
Limitations of daily activity: Effect size (95% confidence interval)= -0.66 (-2.41 to 40.15)
Gravity: Effect size (95% confidence interval)= -0.86 (2.47,35.85)
PFMT IT versus no treatment:
Incontinence impact: Effect size (95% confidence interval)= - 1.47 (19.73, 60.43)

58
Author year Study name
(if applicable)
Study design
Subjects
Treatment groups (n; dose)
Treatment /
Follow up
duration
Outcomes and findings
Limitations of daily activity: Effect size (95% confidence interval)= - 0.87 (3.37, 45.43)
Gravity: Effect size (95% confidence interval)= - 1.33 (13.45, 47.93)
V. S. Pereira, 2012 15 RCT 45 pts with stress UI; Mean age: 64 yrs; Male: 0%
Vaginal cones (n=15; twice-weekly sessions of 40 min for 6 weeks) vs. PFTM (n=15; twice-weekly sessions of 40 min for 6 weeks); control (n=15; dose: NA)
6 weeks Urinary leakage (after treatment):
Vaginal cone vs. Control [Mean (SD)]:
0.27 (0.36) vs. 3.65 (4.94) ; p<0.001
PFTM vs. Control [Mean (SD)]:
0.29 (0.31) vs. 3.65 (4.94); p<0.001
Quality of life based on King’s Health Questionnaire (KHQ) domains:
Vaginal cone vs. Control
Incontinence impact: Mean (SD) = 22.24 (20.6) vs. 57.84 (29.48); p=0.001
Gravity: Mean (SD) = 17.35 (22.5) vs. 45.80 (23.09); p=0.01
PFMT vs. Control

59
Author year Study name
(if applicable)
Study design
Subjects
Treatment groups (n; dose)
Treatment /
Follow up
duration
Outcomes and findings
Incontinence impact: Mean (SD) = 17.76 (24.7) vs. 57.84 (29.48); p=0.001
Gravity: Mean (SD) = 15.11 (23.0) vs. 45.80 (23.09); p=0.01
KHQ Scoring: The total score ranges from 0 to 100 and a score of 100 represents the worst possible quality of life, and 0 represents the best possible quality of life
Marianne C. Wallis,201113
RCT 101 pts with UI; Mean age:70.1 yrs; Male: 0%
Static Magnetic Stimulation (SMS) (n=50; 15 static magnets of 800-1200 Gauss anterior, posterior, and inferior to the pelvis for at least 12 hours a day for 3 months) vs. Placebo (n=51; inert metal disks replacing the magnets with same protocol as the intervention)
3 months SMS vs. Placebo
Change in frequency of incontinent episodes (Baseline -12 Weeks)
Median (IQR): 0.75 (2.63) vs. 0.5 (2.0); p= 0.68
Change in Severity Index (Baseline -12 Weeks)
Median (IQR): 1.0 (3.0) vs. 0 (2.0); p= 0.59
Change in BFLUTS - (UI symptoms) (Baseline -12 Weeks)
Median (IQR): 1.5 (3.0) vs. 1.5 (3.0); p= 0.80
Change in BFLUTS- (Quality of life) (Baseline -12 Weeks)
Median (IQR): 1.0 (5.0) vs. 0 (5.0); p= 0.28

60
Author year Study name
(if applicable)
Study design
Subjects
Treatment groups (n; dose)
Treatment /
Follow up
duration
Outcomes and findings
Michal Liebergall-Wischnitzer, 2012 14
RCT 120 pts with SUI; Mean age:46.6 yrs; Male: 0%
Paula Method (Circular Muscle Exercises) (n=60; 12 weeks of private 45 minutes sessions) vs. PFMT (n=60; 12 weeks of group (up to 10 participants) sessions of 30 minutes in length once a week, for 4 weeks plus two additional sessions, 3 weeks apart)
12 weeks Paula Method (Circular Muscle Exercises) vs. PFMT Quality of life (Mean± SD): 83.49 (15.07) vs. 78.20 (18.39); p=NS
Abbreviations: vs.: versus; UUI; urinary urgency incontinence ;DO: detrusor overactivity; IDC: involuntary detrusor contraction; PFMT: pelvic floor muscle training ; BT: bladder training; AQoL: Assessment of Quality of Life; OAB: overactive bladder; APFMT: assisted pelvic floor muscle training; PFMT: pelvic floor muscle training; IQOL: incontinence Quality Of Life; GT: group treatment; IT: individual treatment; CG: control group; NR: not reported; NS: Not significant; NA: Not applicable; RR= Relative Risk; OR= Odds Ratio; SMS: Static Magnetic Stimulation; OAB=Overactive Bladder Syndrome; UDI: Urinary Distress Inventory; IIQ: Incontinence Impact Questionnaire; SUI: Stress Urinary Incontinence; OTG: oxybutynin chloride topical gel;

61
Appendix D: Questionnaire Matrix Nonsurgical Treatments for Urinary Incontinence in Adult Women: Diagnosis and Comparative Effectiveness AHRQ Publication No. 11(12)-EHC074-EF, April 2012 Access to full report: http://www.effectivehealthcare.ahrq.gov/ehc/products/169/834/CER36_UrinaryIncontinence_FinalReport_20120517.pdf
Clinical expert name:
Conclusions from CER (executive summary) Is the conclusion(s) in this CER still valid? (Yes/No/Don’t know)
Are you aware of any new evidence that is sufficient to invalidate the finding(s) in
CER? (Yes/No/Don’t know)
If yes, please provide references
Comments
Key Question 1. What constitutes an adequate diagnostic evaluation for women in the ambulatory care setting on which to base treatment of urinary incontinence? What are the diagnostic values of different methods—questionnaires, checklists, scales, selfreports of UI during a clinical examination, pad tests, and ultrasound—when compared with multichannel urodynamics? What are the diagnostic values of different methods—questionnaires, checklists, scales, selfreports of UI during a clinical examination, pad tests, and ultrasound—when compared with a bladder diary? What are the diagnostic values of the methods listed above for different types of UI, including stress, urgency, and mixed incontinence? What is the association between patient outcomes (continence, severity and frequency of UI, quality of life) and UI diagnostic methods? Diagnosis of UI For Key Question 1, 99 studies of 81,043 women provided information on different methods for diagnosing UI. Described use of urodynamic testing as a reference standard test was very similar across the studies. Diagnostic methods to establish a clinical diagnosis of UI were described with different levels of detail and included patient history, physical and pelvic examination, urine culture, and other instrumental measures. The majority of studies demonstrated that the tests had only small diagnostic value in distinguishing women with
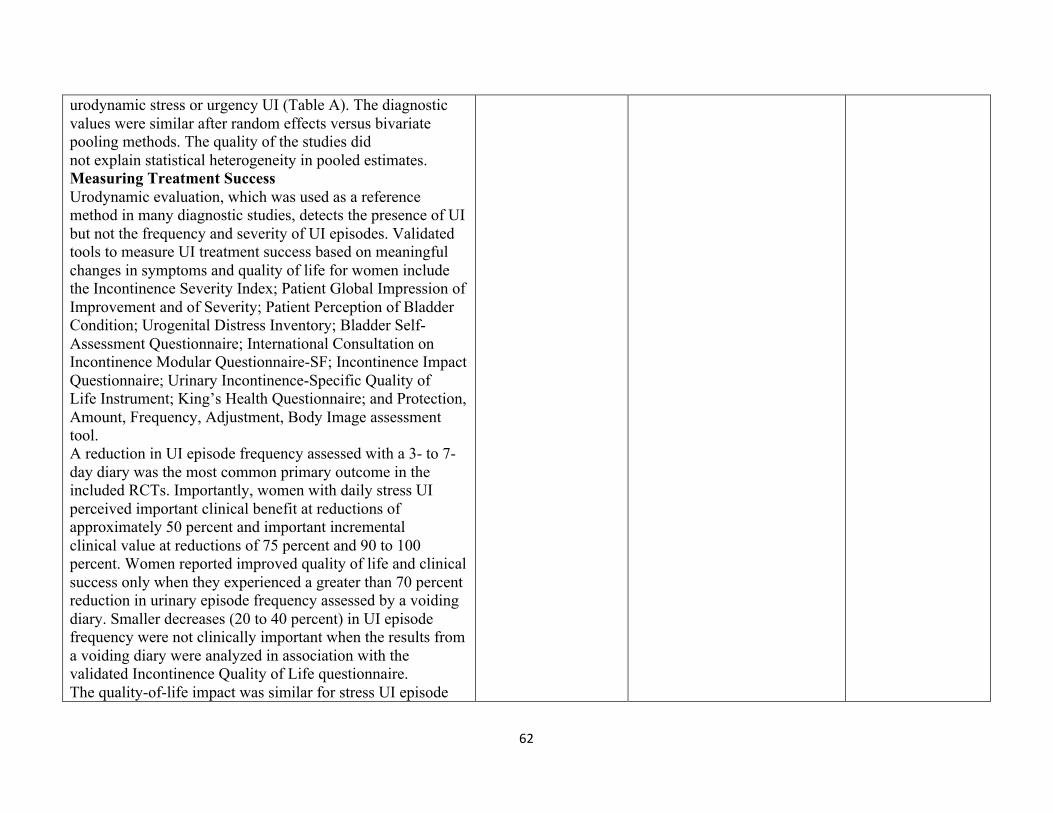
62
urodynamic stress or urgency UI (Table A). The diagnostic values were similar after random effects versus bivariate pooling methods. The quality of the studies did not explain statistical heterogeneity in pooled estimates. Measuring Treatment Success Urodynamic evaluation, which was used as a reference method in many diagnostic studies, detects the presence of UI but not the frequency and severity of UI episodes. Validated tools to measure UI treatment success based on meaningful changes in symptoms and quality of life for women include the Incontinence Severity Index; Patient Global Impression of Improvement and of Severity; Patient Perception of Bladder Condition; Urogenital Distress Inventory; Bladder Self-Assessment Questionnaire; International Consultation on Incontinence Modular Questionnaire-SF; Incontinence Impact Questionnaire; Urinary Incontinence-Specific Quality of Life Instrument; King’s Health Questionnaire; and Protection, Amount, Frequency, Adjustment, Body Image assessment tool. A reduction in UI episode frequency assessed with a 3- to 7-day diary was the most common primary outcome in the included RCTs. Importantly, women with daily stress UI perceived important clinical benefit at reductions of approximately 50 percent and important incremental clinical value at reductions of 75 percent and 90 to 100 percent. Women reported improved quality of life and clinical success only when they experienced a greater than 70 percent reduction in urinary episode frequency assessed by a voiding diary. Smaller decreases (20 to 40 percent) in UI episode frequency were not clinically important when the results from a voiding diary were analyzed in association with the validated Incontinence Quality of Life questionnaire. The quality-of-life impact was similar for stress UI episode

63
reductions of >40 percent to <70 percent. In the case of women with persistent urge, stress, or mixed UI, more than 60 percent reported complete treatment satisfaction on the Global Perception of Improvement and Incontinence Impact Questionnaire when they experienced more than 70 percent reduction in UI episodes according to voiding diaries. The few RCTs that analyzed differences in outcomes depending on baseline urodynamic diagnosis versus self-reported symptoms of stress, urgency, or mixed UI suggested no advantage with urodynamic diagnosis. However, baseline urodynamic evaluation resulted in better prediction of harms from surgery for stress UI refractory to conservative treatments. Evidence was insufficient for the superiority of urodynamic evaluation’s prediction of nonsurgical treatment outcomes compared to diagnosis based on self-reported symptoms. Women’s perceptions of treatment success depend upon clinically important differences in their voiding diaries, scales, questionnaires, and impressions of global improvement. Key Question 2. How effective is the pharmacological treatment of UI in women? 1. How do pharmacologic treatments affect continence, severity and frequency of UI, and quality of life when compared with no active treatment or with combined treatment modalities? 2. What is the comparative effectiveness of pharmacological treatments when compared with each other or with nonpharmacological treatments of UI? 3. What are the harms from pharmacological treatments when compared with no active treatment? 4. What are the harms from pharmacological treatments when compared with each other or with nonpharmacological treatments of UI? 5. Which patient characteristics, including age, type of UI, severity of UI, baseline disease that affects UI, adherence to treatment recommendations, and comorbidities, can modify the effects of the pharmacological treatments on patient outcomes, including continence, quality of life, and harms? Efficacy of Pharmacological Treatments We synthesized the evidence of efficacy and comparative effectiveness of the drugs for predominant stress UI

64
(including topical estrogen and serotonin-noradrenalin uptake inhibitors) and drugs for overactive bladder. Table B demonstrates how many studies were examined for each outcome, how many subjects participated in the studies, and what percentage of subjects experienced the outcomes. The last column indicates our level of confidence that the evidence reflects the true effect of the treatment and that future research is unlikely to change the estimate of effect (Appendix Table F1 in the full report). Drugs were more effective than placebo in achieving continence and improving UI, but the magnitude of effect was low. The absolute risk difference in continence was less than 20 percent for all drugs. Pharmacological treatments resulted in fewer than 200 cases of continence attributable to the drugs per 1,000 treated. The studies had good quality with low risk of bias. Individual quality criteria and disclosure of conflict of interest were not associated with differences in the results. Stress UI Estrogen Individual RCTs indicated greater continence and improvement in UI with vaginal estrogen formulations and worsening of UI with transdermal patches. Duloxetine Duloxetine did not resolve stress UI when compared to placebo (Table B). The risk of adverse effects was significantly higher with duloxetine than with placebo. Duloxetine resulted in improved UI in 75-140 women per 1,000 treated, while 129 women per 1,000 treated stopped taking duloxetine because of adverse effects. Urgency UI Oxybutynin Oxybutynin increased continence rates and improved UI more often than placebo but also resulted in treatment

65
discontinuation due to adverse effects. Oxybutynin resolved UI in 114 women per 1,000 treated (95% CI, 64 to 163), while 63 women per 1,000 treated (95% CI, 12 to 127) discontinued oxybutynin because of adverse effects. Tolterodine Tolterodine increased continence rates and significantly improved UI more often than placebo. Tolterodine resolved UI in 85 women per 1,000 treated (95% CI, 40 to 129), while 83 women per 1,000 treated (95% CI, 47 to 120) experienced adverse effects. Discontinuation of treatment due to adverse effects did not differ between tolterodine and placebo. Darifenacin Darifenacin significantly improved urgency UI and several domains of quality of life more often than placebo. Darifenacin improved UI in 117 women per 1,000 treated (95% CI 57 to 177), while 190 women per 1,000 treated (95% CI, 118 to 260) experienced adverse effects. Treatment discontinuation rates due to adverse effects did not differ between darifenacin and placebo. Solifenacin Solifenacin increased continence rates; higher doses resulted in greater benefits. Treatment discontinuation due to adverse effects was more common with solifenacin than with placebo. Solifenacin resolved UI in 107 women per 1,000 treated (95% CI, 58 to 156), while 13 women per 1,000 (95% CI, 1 to 26) discontinued treatment because of adverse effects. Fesoterodine Fesoterodine increased continence rates. Significant improvement in UI with fesoterodine compared to placebo was dose responsive. Fesoterodine resulted in higher rates of adverse effects and discontinuation of treatment due to adverse effects than placebo. Fesoterodine resolved UI in 130 women per 1,000 treated (95 percent CI, 58 to 202), while 31

66
women per 1,000 (95 percent CI, 10 to 56) stopped treatment due to adverse effects. Trospium Trospium increased continence rates more often than placebo. Risk of adverse effects was greater with trospium than with placebo. Trospium resolved UI in 114 women per 1,000 treated (95% CI, 83 to 144), while 18 women per 1,000 (95% CI, 4 to 33) stopped treatment because of harmful adverse effects. Comparative Effectiveness of Pharmacological Treatments Evidence of the comparative effectiveness of different drugs was insufficient for the majority of comparisons. Oxybutynin and tolterodine had the same benefits, but tolterodine was safer. The numbers needed to treat (NNT) to achieve continence in one woman were similar across drugs. Treatment discontinuation due to adverse effects was greater than with placebo for all drugs, excluding darifenacin and tolterodine; NNT to achieve discontinuation due to adverse effects was highest with solifenacin (NNT=78) and lowest with oxybutynin (NNT=16). Several retrospective observational studies analyzed the long-term comparative effectiveness and safety of pharmacological treatments for UI. The evidence-based cost utility analysis reported that more than half of patients stop taking drugs for UI after 1 year of treatment. The lowest rates of treatment discontinuation were with 5 mg of solifenacin.16 Role of Patient Characteristics on Outcomes of Pharmacological Treatments Age Treatment response was similar across age groups. Solifenacin increased continence rates more often than placebo, regardless of age. Oxybutynin, trospium, and

67
darifenacin improved UI in older women. Oxybutynin reduced UI frequency and produced subjective benefits compared to placebo in frail community-dwelling older people. Darifenacin improved UI when compared to placebo in older women. The drug needed to be given to eight older patients to achieve more than a 50 percent reduction in UI episodes in one person. Cognitive function changes did not differ between darifenacin and placebo in short-term (2-week) treatment. Trospium improved UI and quality of life in older subjects with overactive bladder. Solifenacin caused serious adverse effects less often than oxybutynin in older patients, with no differences between the drugs in younger patients. Race We found limited evidence about treatment responses in race subgroups. Only one study, of duloxetine, examined clinical outcomes in different race groups. Evidence was inconclusive about racial differences in the treatment effects of duloxetine in women with stress UI. Comorbidities One RCT examined the role of comorbidities. Duloxetine was no better than placebo in women with depression, diabetes, and chronic lung diseases. Trospium was effective in resolving UI regardless of body mass index in obese and normal weight women. Baseline UI Evidence was limited from which to conclude any differences in benefits by baseline frequency and severity of UI. Studies found no differences in outcomes between tolterodine and solifenacin in subjects with baseline mixed or pure urgency UI. Subjects with mixed UI may require a larger dose and longer treatment than women with urgency UI to achieve clinical benefits from solifenacin. Inclusion of women with mixed UI did not significantly modify the treatment benefits

68
from oxybutynin and solifenacin across the studies in meta-regression and subgroup analyses. The baseline frequency of UI did not dramatically modify the effects of the drugs on clinical outcomes. Subjects with more frequent UI had slightly greater benefits with solifenacin or fesoterodine than with placebo. In contrast, trospium was better than placebo at resolving UI only in subjects with fewer than five UI episodes per day. Trospium did not resolve UI in subgroups with more than five episodes of UI per day (relative risk [RR] 1.2, 95% CI, 0.93 to 1.56). Prior Treatment Response Solifenacin was effective regardless of the response to previous treatments; however, poor responders did not benefit from increasing the dose of the drug. We could not examine differences in the treatment response to other drugs among those who failed prior treatments because the studies provided neither subgroup analyses within trials nor consistent reporting of the percentage of nonresponders for subgroup analyses across the trials. Concomitant Treatments Trospium reduced the number of urgency UI episodes irrespective of concomitant medications. Adverse effects were more common in those taking seven or more concomitant medications. Key Question 3. How effective is the nonpharmacological treatment of UI in women? 1. How do nonpharmacological treatments affect incontinence, UI severity and frequency, and quality of life when compared with no active treatment? 2. How do combined modalities of nonpharmacological treatments with drugs affect incontinence, UI severity and frequency, and quality of life when compared with no active treatment or with monotherapy? 3. What is the comparative effectiveness of nonpharmacological treatments when compared with each other? 4. What are the harms from nonpharmacological treatments when compared with no active treatment? 5. What are the harms from nonpharmacological treatments when compared with each other? 6. Which patient characteristics, including age, type of UI, severity of UI, baseline disease that affects UI, adherence to treatment

69
recommendations, and comorbidities, can modify the effects of the nonpharmacological treatments on patient outcomes, including continence, quality of life, and harms? Efficacy of Nonpharmacological Treatments Nonpharmacological treatments were better than no active treatment in achieving continence and improving UI, according to RCTs (Table B). The magnitude of effect was large. The majority of the studies included women with mixed UI. Inclusion of women with mixed UI did not dramatically modify the treatment effects in meta-regression and subgroup analyses. We examined the effects of the interventions on predominant stress or urgency UI when the authors reported that information. A summary of the evidence of effectiveness of all treatments, including strength of evidence, is found in Table B. Stress UI Pelvic Floor Muscle Training Pelvic floor muscle training (PFMT) increased continence rates and improved UI more often than usual care. PFMT combined with bladder training increased continence rates and improved mixed UI. PFMT with biofeedback improved UI. Vaginal Cones Evidence was insufficient from which to draw valid conclusions. Uncontrolled high risk of bias studies of other intravaginal and intraurethral devices demonstrated that they improved UI but also resulted in high discontinuation rates and adverse effects. Intravaginal Electrical Stimulation Intravaginal electrical stimulation increased continence rates and improved UI more often than sham stimulation. Magnetic Stimulation Magnetic stimulation improved UI but did not increase continence more than sham stimulation. Urgency UI
70
Bladder Training Bladder training improved UI when compared to usual care. Percutaneous Tibial Nerve Stimulation Percutaneous tibial nerve stimulation improved UI. Individual RCTs indicated no difference in adverse effects and treatment discontinuation with active or sham stimulation. Mixed UI Specialized Continence Services Studies indicated no consistently greater benefits for continence or improvement of UI with continence services implemented by specialized providers compared to usual care. Comparison across studies was difficult because of the variety of interventions that constituted complex continence services. Weight Loss Weight loss and exercise improved UI in obese women without evident harms. Comparative Effectiveness of Nonpharmacological Treatments Clinical outcomes of one nonpharmacological treatment versus another were reported in 54 RCTs, but these trials rarely compared the same treatment effects, which decreased the strength of evidence to low. We found no differences in UI between supervised PFMT combined with bladder training and self-administered PFMT. Continence did not differ between bladder training combined with PFMT and bladder training alone. Indirect comparison indicated the comparable effectiveness of nonpharmacological treatments on continence. Cases of continence achieved per 1,000 treated were 299 for PFMT, 162 for electrical stimulation, and 166 for PFMT combined with bladder training. Rates of continence were comparable with different treatments: 38 percent of women became continent with PFMT, 23 percent became continent with
71
electrical stimulation, and 21 percent became continent with PFMT combined with bladder training. CER=comparative effectiveness review;