ai i t b t jaiming to become a top japanese pharmaceutical
TRANSCRIPT

Ai i t B T JAiming to Become a Top Japanese Pharmaceutical Company
Review of Half Year 2010
CHUGAI PHARMACEUTICAL CO., LTD.President and CEOOsamu Nagayama
July 22/23, 2010

Aiming to Become a Top Japanese Pharmaceutical CompanyReview of Half Year 2010
F d L ki St t tForward-Looking Statements
This presentation may include forward-looking statements pertaining to the business and prospects of Chugai Pharmaceutical Co., Ltd. (the “Company”). These statements
fl t th C ’ t l i f i ti i f tireflect the Company’s current analysis of existing information and trends. Actual results may differ from expectations based
i k d t i ti th t ff t th C ’on risks and uncertainties that may affect the Company’s businesses.
2

Aiming to Become a Top Japanese Pharmaceutical CompanyReview of Half Year 2010
2010 Half Year Results2010 Half Year ResultsStrong sales growth (ex.Tamiflu) overcoming NHI price revisiong g ( ) g pNet income negatively affected by Tamiflu and FX
JPY billion 2010 Y Y2009vs
F tJPY billion
Revenues 191.7 182.4 -4.9% -3.5%
2010 YoY2009 Forecast
Sales ex. Tamiflu 160.6 168.6 +5.0% -1.2%
Domestic sales ex Tamiflu 146 3 150 6 +2 9% -1 2%Domestic sales ex. Tamiflu 146.3 150.6 +2.9% 1.2%
Operating income 37.2 27.6 -25.8% +4.2%% revenues 19 4% 15 1%% revenues 19.4% 15.1%
Net income 26.3 16.4 -37.6% -1.8%% revenues 13.7% 9.0% 12.8%
3

Aiming to Become a Top Japanese Pharmaceutical CompanyReview of Half Year 2010
Domestic Sales in Strategic AreasDomestic Sales in Strategic Areas
Oncology70.0
Oncology
Avastin and Xeloda: >50% increase driving overall growth in oncology
Oncology
44.057.8 64.6
30 040.0 50.0 60.0 Oncology
30.0 Bone & Joint
g g gy
Bone & Joint
44.0 20.0 30.0
2008 2009 2010
22 726.9 28.622.5
25.0
27.5 Bone & Joint
Actemra: solid growth towards the 1st
choice among biologic agents
Bone & Joint
22.720.0
2008 2009 2010
30.0 R lRenal
29.5 28.8 27.2 22.5
25.0
27.5 Renal
Epogin: steady performance based on the established safety and efficacy profile
Renal
4
20.0
22.5
2008 2009 2010

Aiming to Become a Top Japanese Pharmaceutical CompanyReview of Half Year 2010
ActemraActemra
Launched in approx. 50 countries full-fledged rollout in three major markets
US: >50% rheumatologists prescribe ActemraGroup sales(million CHF)
100
US: >50% rheumatologists prescribe Actemraafter only 5 months on the market
60
80
Development activities P3 for sc formulation started in Japan (May) Approved in Europe for prevention of joint damage 40
60
(June) Ongoing Roche program
• Humira H2H trial - enrolling patients20
0Q1 08
Q2 08
Q3 08
Q4 08
Q1 09
Q2 09
Q3 09
Q4 09
Q1 10
Q2 10
5

Aiming to Become a Top Japanese Pharmaceutical CompanyReview of Half Year 2010
NHI Price Revision 2010 Business ImpactNHI Price Revision 2010 - Business Impact
Accelerated growth with new drugsAccelerated growth with new drugs
Premium for New Drug Development
• No ”patent cliff” • Limited reliance on long-listed
prod cts g p14 APIs*
>40% of revenues
Long listed productsActemra
products
Long-listed productsapprox. 20% of revenues
Special cut for market expansion
AvastinTarceva etc.
market expansion Herceptin • Among the richest pipeline in Japan
• Secure source of investment in new d d l t
6
drug development
*actual pharmaceutical ingredients, marketed by Chugai
Aiming to Become a Top Japanese Pharmaceutical CompanyReview of Half Year 2010
NHI Price Revision 2010 R&D ImpactNHI Price Revision 2010 - R&D Impact
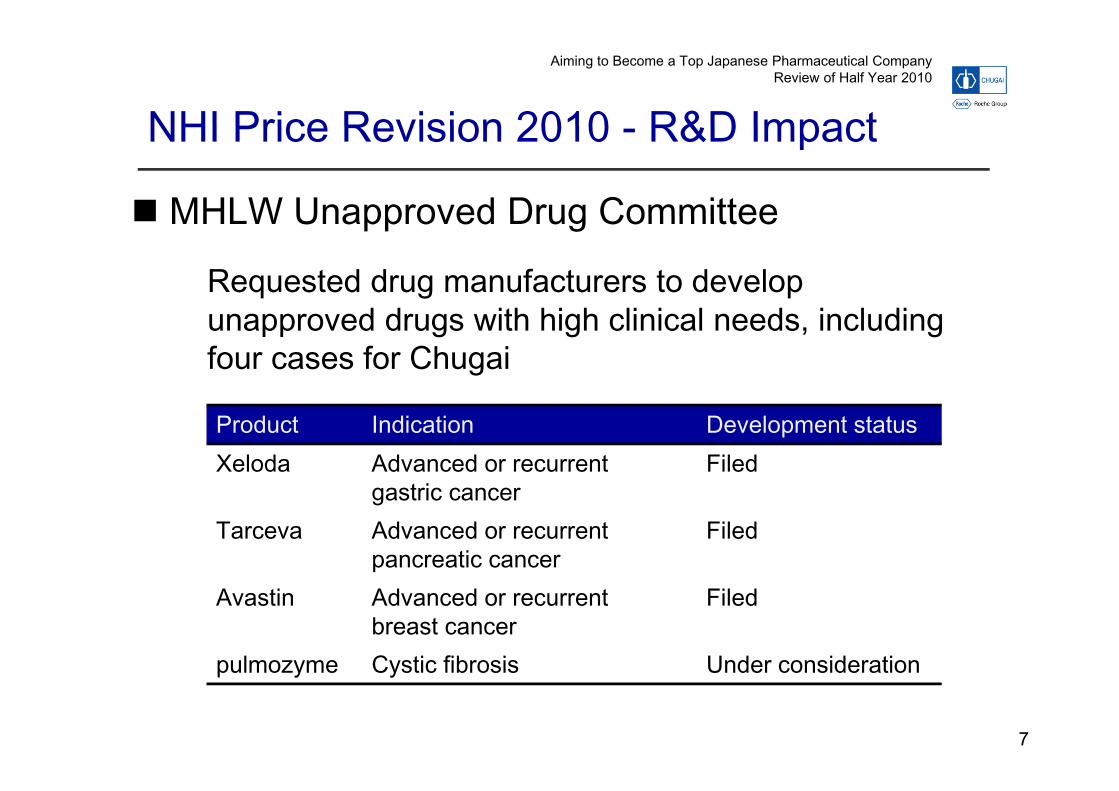
MHLW Unapproved Drug Committee MHLW Unapproved Drug Committee
Requested drug manufacturers to develop unapproved drugs with high clinical needs, including four cases for Chugai
Product Indication Development statusXeloda Advanced or recurrent
t iFiled
gastric cancerTarceva Advanced or recurrent
pancreatic cancerFiled
Avastin Advanced or recurrent breast cancer
Filed
pulmozyme Cystic fibrosis Under consideration
7
pulmozyme Cystic fibrosis Under consideration

FY2010 2Q Consolidated Financial OverviewFY2010 2Q Consolidated Financial Overview
CHUGAI PHARMACEUTICAL CO., LTD.Executive Vice President and CFORyuzo Kodama
J l 22/23 2010July 22/23, 2010

FY2010 2Q Consolidated Financial Overview
SummarySummary
R 182 4 billi JPY Revenues 182.4 billion JPY (YoY: -9.3 billion, -4.9%)
• Sales excl. Tamiflu: +8.0 billion JPY,+5.0%Domestic +2 9% Overseas +27 5%Domestic +2.9%, Overseas +27.5%
• Sales of Tamiflu: -13.4 billion JPY• Other Operating Revenues: -4 0 billion JPYOther Operating Revenues: 4.0 billion JPY
Operating Income 27.6 billion JPY (YoY: -9.6 billion, -25.8%)
• Growth from mainstay products continued, but negatively impacted by Tamiflu and Other Operating Revenues
Comparison to H1 Forecast• Revenues: -6.7 billion JPY, achievement 96.5%
9
• Operating Income: +1.1 billion JPY, achievement 104.2%
FY2010 2Q Consolidated Financial Overview
Financial Overview Jan JunYear on Year
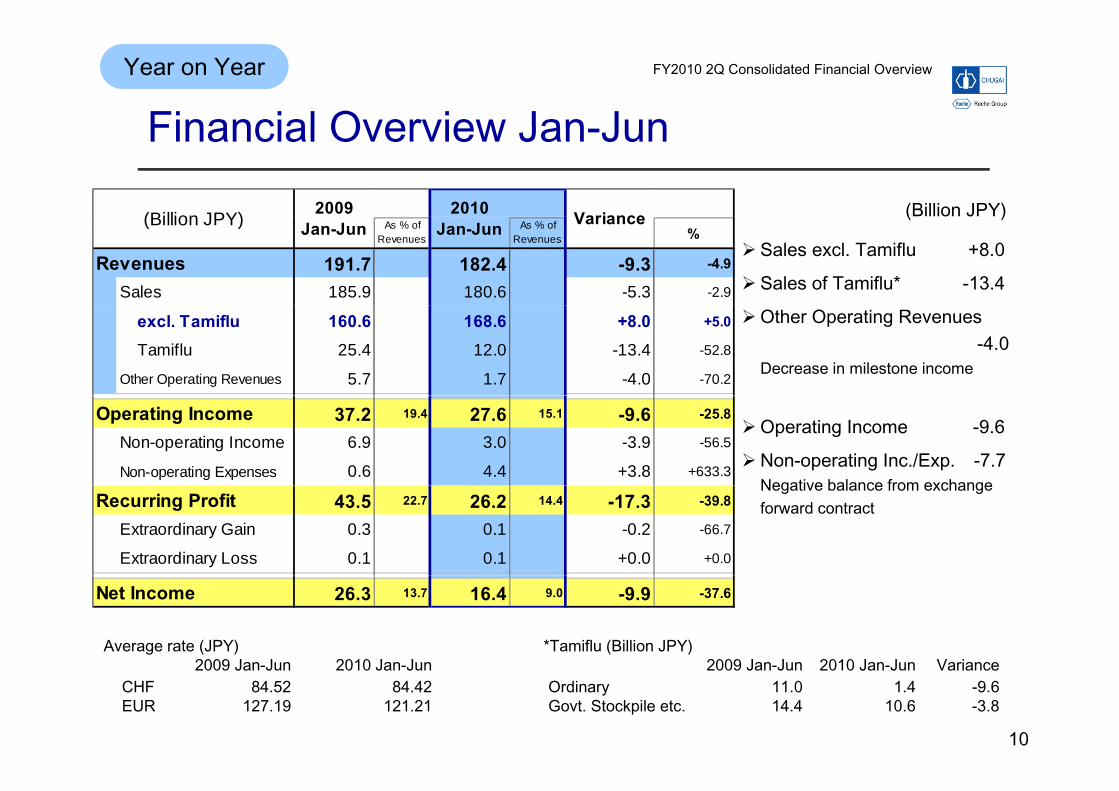
Financial Overview Jan-Jun(Billion JPY)2010 Variance(Billion JPY) 2009
Sales excl. Tamiflu +8.0
Sales of Tamiflu* -13.4
(Billion JPY)As % of
RevenuesAs % of
Revenues %
191.7 182.4 -9.3 -4.9
Sales 185.9 180.6 -5.3 -2.9
Jan-Jun Variance
Revenues
(Billion JPY) Jan-Jun
Other Operating Revenues-4.0
Decrease in milestone income
excl. Tamiflu 160.6 168.6 +8.0 +5.0
Tamiflu 25.4 12.0 -13.4 -52.8
Other Operating Revenues 5.7 1.7 -4.0 -70.2
Operating Income -9.6
Non-operating Inc./Exp. -7.7Negative balance from exchange
37.2 19.4 27.6 15.1 -9.6 -25.8
Non-operating Income 6.9 3.0 -3.9 -56.5
Non-operating Expenses 0.6 4.4 +3.8 +633.3
Operating Income
Negative balance from exchange forward contract43.5 22.7 26.2 14.4 -17.3 -39.8
Extraordinary Gain 0.3 0.1 -0.2 -66.7
Extraordinary Loss 0.1 0.1 +0.0 +0.0
Recurring Profit
Average rate (JPY)2009 Jan Jun 2010 Jan Jun
*Tamiflu (Billion JPY)2009 Jan Jun 2010 Jan Jun Variance
26.3 13.7 16.4 9.0 -9.9 -37.6Net Income
10
2009 Jan-Jun 2010 Jan-JunCHF 84.52 84.42EUR 127.19 121.21
2009 Jan-Jun 2010 Jan-Jun VarianceOrdinary 11.0 1.4 -9.6Govt. Stockpile etc. 14.4 10.6 -3.8

FY2010 2Q Consolidated Financial Overview
Sales excl Tamiflu Jan JunYear on Year
Sales excl. Tamiflu Jan-Jun
(Billion JPY)
▲ 100 0 0 100
Sales excl. Tamiflu168.6 (+8.0, +5.0%)
O
(Billion JPY)
-2.6
-1.8
+7.9
+5.620.018.3
14.218.1 Avastin
(23.3)Actemra(overseas)
(7 4)12.2%
Herceptin(12.1)
Epogin(19.0)
Others-1.7, -8.5%
Overseas+3.9,+27.5%
160.6
-1.5
-1.4
+2.3
+2.328.827.2
12.811.9
(7.4)Actemra
(domestic)(5.8)
Xeloda19 7%
8.7%
13.7%
18.1%
7.9%
( )
Kytril(3.0)
Neutrogin(overseas)
Renal diseases1 6 5 6%
Transplant, Immunologyand Infectious diseases
-0.9, -7.0%
-0.8 +0.826.9
28.6
(5.1)
Tarceva(3.5)
18.4%
19.7%
19.0%
(overseas)(8.8)
Sigmart(domestic)
(6.3)
Bone and Joint+1.7, +6.3%
-1.6, -5.6% DomesticSales150.6
+4.3, +2.9%
DomesticSales146.3
57.8 64.6
% of Domestic Sales
% of Domestic Sales
Oncology+6.8,+11.8%
Left : Sales by Disease FieldRi ht S l b P d t V i Y Y
2009年 2010年
11
39.5% 42.9% Right : Sales by Product, Variance Year on Year( ): FY2010 ActualJan-Jun
2009Jan-Jun
2010

FY2010 2Q Consolidated Financial Overview
Tamiflu Sales PerformanceTamiflu Sales Performance*Cases per
sentine l *FY2007.12 FY2008.12 SeasonalFY2009.12 FY2010.12FY2005.12 FY2006.12(Billion JPY)
Fiscal Term Sales
Jan-Jun Jul-Dec Jan-Jun Jul-Dec Jan-Jun Jul-Dec Jan-Jun Jul-Dec Jan-Jun Jul-Dec Jan-Jun Jul-Dec
2004-05 23.2 24.6 1.47
2005-06 11.9 9.9 21.8 0.92
2006-07 3.7 5.0 8.7 1.01
sentine l(m i l l ions)Sales
2006 07 3.7 5.0 8.7 1.01
2007-08 5.2 1.4 6.6 0.66
2008-09 5.7 11.0 16.7 1.27
2009-10 25.2 1.4 26.6 2.02
Ordinary
2010-11 19.1
Ordinary 35.1 (+26.5) 13.6 (-21.5) 10.2 (-3.4) 7.1 (-3.1) 36.2 (+29.1) 20.5 (-15.7)
2005-06 0.2 6.5 6.7
2006-07 17.9 18.9 36.8
2007-08 9.6 0.2 9.8
2008-09 1.1 14.4 15.5
2009-10 25 6 10.6 36 2
Govt. Stockpile
etc.
2009 10 25.6 10.6 36.2
2010-11 7.6
Govt. Stockpi le e tc. 0.2 (+0.2) 24.4 (+24.2) 28.5 (+4.1) 1.3 (-27.2) (+38.7) 18.2 (-21.8)
23.2 12.0 16.3 21.6 23.8 14.8 1.6 6.8 25.4 50.8 12.0 26.7T t l
40.0
12
35.2 (+26.6) 38.0 (+2.8) 38.7 (+0.7) 8.4 (-30.3) 76.2 (+67.8) 38.7 (-37.5)Total
*Total patients number of the controlled samples in the infectious Diseases Weekly Report, period between late October and mid-April (between early July 2009 and mid-March 2010 for 2009-10), published by Japan’s National Institute of Infectious Diseases.
Company forecast The forecast for July to December 2010 is the variance between H1 actual and the original full-year forecast.

FY2010 2Q Consolidated Financial Overview
Operating Income Jan JunYear on Year
Operating Income Jan-Jun
V i2010
(Billi JPY)2009
(%)
Revenues 191.7 182.4 -9.3 -4.9Cost of Sales 83.9 80.5 -3.4 -4.1
VarianceJan-Jun(Billion JPY) Jan-Jun(Billion JPY)
Other Operating
Gross Profit from Sales
-2.0
-4.0
Gross Profit 107.8 101.8 -6.0 -5.6 Sales 102.1 100.1 -2.0 -2.0 Other Operating Revenues 5.7 1.7 -4.0 -70.2
Increase in SG&A (excl. R&D) exp.
Other Operating Revenues
Increase in
37.2
-1.6-2.1
SG&A (excl. R&D) exp. 46.1 47.7 +1.6 +3.5
R&D exp. 24.5 26.6 +2.1 +8.6
Operating Income 37.2 27.6 -9.6 -25.8
Increase in R&D exp.
27.6-9.6 (-25.8%)
Decrease in Gross Profit -6.0Decrease in TamifluDecrease in Other Operating RevenuesDecrease in Other Operating Revenues
Increase in SG&A (excl. R&D) exp. -1.6Increase in personnel expensesCo-promotion of Actemra
Jan-Jun2009
Jan-Jun2010
13
Increase in R&D exp. -2.1Increase in expenses for early stage projects

FY2010 2Q Consolidated Financial Overview
Financial Overview Apr JunYear on Year
Financial Overview Apr-Jun
(Billion JPY)
Sales excl. Tamiflu +5.2Avastin +4 4
(Billion JPY)
As % ofRevenues
As % ofRevenues %
97 0 95 3 1 7
2009Apr-Jun
2010Apr-Jun Variance
R
(Billion JPY)
Avastin +4.4Actemra (Overseas) +4.0Xeloda +1.3Actemra (Domestic) +1.3H ti 1 7
97.0 95.3 -1.7 -1.8
Sales 93.0 94.5 +1.5 +1.6
excl. Tamiflu 88.1 93.3 +5.2 +5.9
Tamiflu 5.0 1.2 -3.8 -76.0
Revenues
Herceptin -1.7Epogin -1.2Neutrogin (Overseas) -1.0 Kytril -0.9
Tamiflu 5.0 1.2 3.8 76.0
Other Operating Revenues 4.0 0.8 -3.2 -80.0
Cost of sales 40.1 39.5 -0.6 -1.5
56.9 58.7 55.8 58.6 -1.1 -1.9Gross Profit Sales of Tamiflu* -3.8
Other Operating Revenues -3.2Decrease in milestone income
SG&A (excl. R&D) exp. 24.5 24.9 +0.4 +1.6
R&D exp. 12.7 14.4 +1.7 +13.4
19.6 20.2 16.5 17.3 -3.1 -15.8
20 7 21 3 14 1 14 8 6 6 31 9R i P fitOperating Income
Operating Income -3.1
* Tamiflu (Billion JPY) 2009 2010 Variance
20.7 21.3 14.1 14.8 -6.6 -31.9
12.5 12.9 8.5 8.9 -4.0 -32.0
Recurring ProfitNet Income
14
Tamiflu (Billion JPY) VarianceApr-Jun Apr-JunOrdinary 5.0 0.0 -5.0Govt. Stockpile etc. - 1.2 +1.2

FY2010 2Q Consolidated Financial Overview
Financial Overview Jan Junvs. Forecast
Financial Overview Jan-JunActual 2009Forecast (Feb. 3) 2008
+/- Achiev.(%)
Prog.(%)
182 4 189 1 6 7 96 5 418 5 43 6 44 6 44 7
Jan-Jun
Full-yearprog. (%)
2010Jan-Jun
2010Jan-Jun
2010Jan-Dec
R
(Billion JPY)Jan-Jun
Full-yearprog. (%)
182.4 189.1 -6.7 96.5 418.5 43.6 44.6 44.7
Sales 180.6 187.4 -6.8 96.4 414.0 43.6 45.0 44.4
excl. Tamiflu 168.6 170.6 -2.0 98.8 375.3 44.9 45.7 46.8
Revenues
Tamiflu 12.0 16.8 -4.8 71.4 38.7 31.0 19.0 33.3
Other Operating Revenues 1.7 1.7 +0.0 100.0 4.5 37.8 19.6 58.2
Cost of sales 80.5 - - - 184.5 43.6 44.3 43.5
101.8 - - - 234.0 43.5 44.8 45.7
SG&A (excl. R&D) exp. 47.7 - - - 105.0 45.4 44.4 46.9
R&D exp 26 6 59 0 45 1 45 5 44 3
Gross Profit
R&D exp. 26.6 - - - 59.0 45.1 45.5 44.3
27.6 26.5 +1.1 104.2 70.0 39.4 44.8 45.0
as % of Revenues 15.1 14.0 - - 16.7 - - -
Operating Income
15
26.2 27.0 -0.8 97.0 70.5 37.2 42.4 48.1
16.4 16.7 -0.3 98.2 44.0 37.3 48.1 46.5
Recurring ProfitNet Income

FY2010 2Q Consolidated Financial Overview
Sales excl Tamiflu Jan Junvs. Forecast
Sales excl. Tamiflu Jan-Jun
*
168.6 170.6 -2.0 98.8 206.7 375.3 44.9
+/- Achiev.ForecastJul-Dec
ForecastJan-Dec
Prog.
Sales excl. Tamiflu
Billion JPYActual
Jan-JunForecastJan-Jun
*
64.6 62.4 +2.2 103.5 75.6 140.2 46.1Avastin 23.3 20.3 +3.0 114.8 24.6 47.9 48.6Herceptin 12.1 12.2 -0.1 99.2 12.6 24.7 49.0Xeloda 5 1 4 4 +0 7 115 9 5 8 10 9 46 8
Oncology
Xeloda 5.1 4.4 +0.7 115.9 5.8 10.9 46.828.6 29.2 -0.6 97.9 35.6 64.2 44.5
Actemra 5.8 6.3 -0.5 92.1 9.3 15.1 38.427 2 28 2 1 0 96 5 32 1 59 3 45 9
Bone and Joint
Renal diseases 27.2 28.2 -1.0 96.5 32.1 59.3 45.9Epogin 19.0 20.3 -1.3 93.6 23.2 42.2 45.0
11.9 14.2 -2.3 83.8 20.0 31.9 37.3Pegasys 4 8 6 5 -1 7 73 8 10 0 14 8 32 4
Renal diseases
T rans plant , Im m unology and In f ec t ious d is eas es
Pegasys 4.8 6.5 1.7 73.8 10.0 14.8 32.4Copegus 2.0 3.1 -1.1 64.5 5.1 7.1 28.2
18.3 18.5 -0.2 98.9 20.6 38.9 47.0
18.1 18.2 -0.1 99.5 22.6 40.7 44.5OverseasOthers
18.1 18.2 0.1 22.6 40.7Actemra 7.4 7.3 +0.1 101.4 12.3 19.7 37.6
Overseas
16*Variance between Jan-Jun actual and the original full-year forecast

FY2010 2Q Consolidated Financial Overview
Impact from Foreign Exchangevs. Forecast
Impact from Foreign Exchange
Exchange rate assumption(Billion JPY) vs. Exchange rate
assumption
-0.9
Exchange rate assumptionCHF : 88.00JPY EUR : 130.00JPY
Recurring Profit
Revenues Neutrogin (Overseas) -0.6Actemra(Overseas) -0.3
CHF: -0.8 billion JPY EUR: -0.4 billion JPY
[Reference] CHF/JPY exchange rate (monthly average) and rates for exchange forward contracts
Cost of salesSG&A expenses
Cost of Roche products +1.2Other cost of sales +0.4SG&A of overseas affiliates +0.2
86
88
90(1)Forecast
(2) Forward contract
JPY
Operating Income +0.9
Gain/loss on foreign exchanges and 80
82
84
86
End of JuneAverage
Non-operating Inc./Exp.
Gain/loss on foreign exchanges and exchange forward contracts
-2.1
Recurring 1 276
78
80
10 11 12 1 2 3 4 5 6
17
gProfit -1.2
Approximate impact on profits (Jan-Jun)
10 11 12 1 2 3 4 5 62009 2010

FY2010 2Q Consolidated Financial Overview
Balance Sheet Items (Assets)Actual 2010
Balance Sheet Items (Assets)
(Billion JPY) Cash and deposits -25.7Marketable securities +9.5Accounts receivable
Inventories
+19.1 -22.4 Inventories +19.1
Seasonal effects and stockpiling for Cash and depositsMarketable securities
540 5
-16.1
10 0
p gmanufacturing site change
Accounts receivable -22.4T ibl fi d
Others
540.5-3.9
-10.0Seasonal effects
Tangible fixed assets
-33.3 (-6.2%) 507.2
18
Dec2009
Jun2010

FY2010 2Q Consolidated Financial Overview
Balance Sheet Items (Liabilities)Actual 2010
Balance Sheet Items (Liabilities)
(Billion JPY)
Accounts payable -2.1Accounts payable
-14 1
-2.1 Accrued income taxes -14.1
p y
Accrued income taxes
14.1
-16.4
Others -16.4Decrease in accrued expenses
Others
105.9Equity Ratio
-32.6 (-30.8%) 73.3 Dec. 2009 Jun. 2010 Variance
80.0% 85.1% +5.1%pts
19
Dec2009
Jun2010

FY2010 2Q Consolidated Financial Overview
Cash Flow Statement Jan JunActual 2010
Cash Flow Statement Jan - Jun
(Billion JPY)
Operatingactivities
Cash flow from operating activities +6.8Income before taxes and minority interests +26.1Depreciation and amortization +8.4Decrease in working capital +0 5
Investingactivities
+6.8-16.6
activities Decrease in working capital +0.5Decrease in notes and accounts receivable +22.1Increase in inventories -19.7Decrease in notes and accounts payable -1.9
I t id 21 7
activities
Financingactivities
-13.2
Income taxes paid -21.7
Cash flow from investing activities -16.6Payment into time deposits -1.1
activities
Exchange ratechanges
94.5
69 9
-1.5 Increase in marketable and investment securities -8.0Purchases of fixed assets -7.5
Cash flow from financing activities 13 269.9-24.5 Cash flow from financing activities -13.2Payment of dividends -12.5Payment of dividends to minority shareholders -0.7
20
Dec2009
Jun2010

Overview of Development PipelineOverview of Development Pipeline
CHUGAI PHARMACEUTICAL CO., LTD.Executive Vice President Head of Lifecycle Management & Marketing Unit Tatsuro Kosaka
July 22/23, 2010

Overview of Development Pipeline
Projects under Development ( f J l 2010)
Phase I Phase II Phase III Filed
Projects under Development (as of Jul. 2010)
Oncology CIF/RG7167‐ solid tumorsCKI27/RG7304‐ solid tumors
li
MRA/Actemra ‐ PCTP300 ‐ GCRG435/Avastin‐ glioblastoma (relapsed)
/
RG435/Avastin‐ aCC‐ GC‐ aBCl bl
EPOCH/Epogin ‐ CIARG435/Avastin ‐ BCRG1415/Tarceva – PCRG340/Xeloda ‐ GC
/GC33 ‐ liver cancerGA101/RG7159 ‐ NHLRG3502(T‐DM1) ‐ BC
RG1415/Tarceva ‐ NSCLC(1st line)
‐ glioblastoma RG1273/pertuzumab – BC
RG597/Herceptin ‐ GC
G 8 / i ( l) / ( ) iBone & Joint RG484/Bonviva(oral)‐ osteoporosis
MRA/Actemra (overseas)– sJIA– RA(sc) ★
RG1594/ocrelizumab ‐ RARG484/Bonviva(inj)
ED‐71 ‐ osteoporosis
‐ osteoporosis
Renal RG744/Mircera‐ renal anemia
NA808 HCV CSG452/RG7201 RG442/P HBVOthers NA808 ‐ HCVRG1450 ‐ Alzheimer's disease
CSG452/RG7201‐ diabetes
RG1583/taspoglutide‐ diabetes
RG1678/(GLYT1)
RG442/Pegasys ‐ HBVRG442+RG964/Pegasys + Copegus – cirrhosis
‐ schizophrenia
Letters in orange in-house projects★: Projects with advances in stages since Apr 23, 2010
22

Overview of Development Pipeline
Development Status OncologyDevelopment Status-Oncology
Herceptin : Gastric cancerFiled in Mar and designated as a priority review subject in
In-licensed Filed in Mar. and designated as a priority review subject in
May.
23
Overview of Development Pipeline
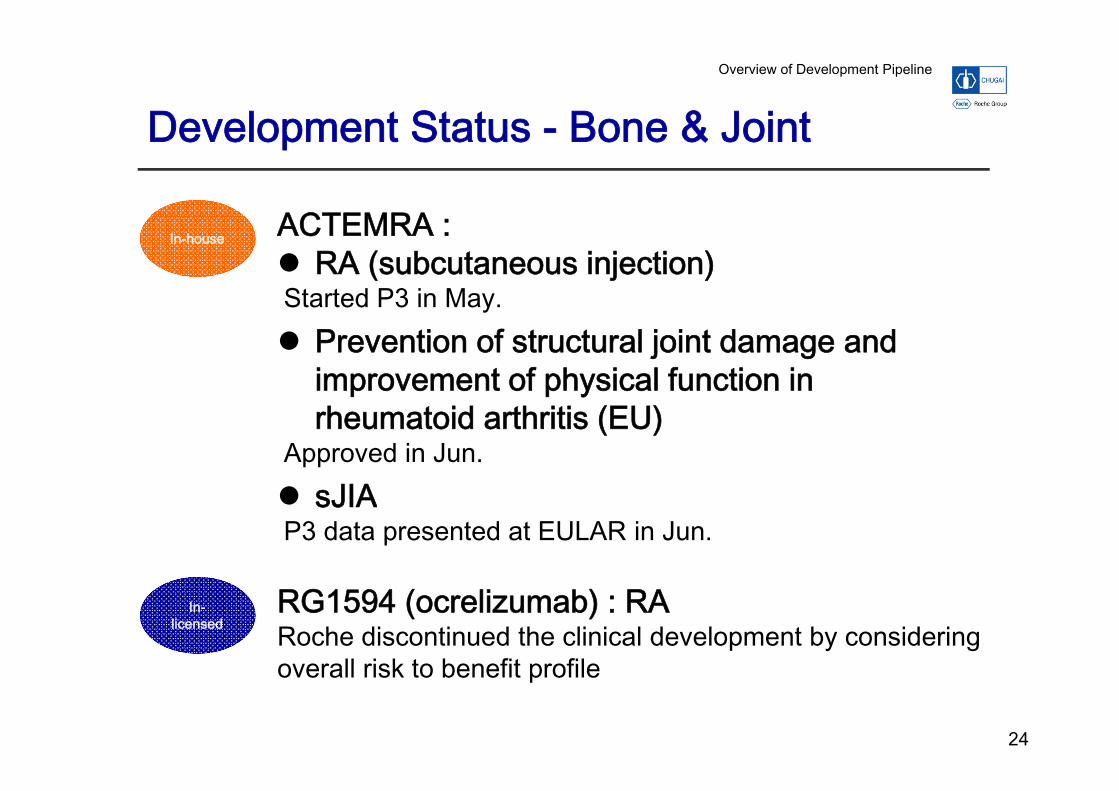
Development Status Bone & JointDevelopment Status - Bone & Joint
ACTEMRAACTEMRA : RA (subcutaneous injection)Started P3 in May.
In-house
Started P3 in May. Prevention of structural joint damage and
improvement of physical function in p p yrheumatoid arthritis (EU)
Approved in Jun. JIA sJIA
P3 data presented at EULAR in Jun.
RG1594 (ocrelizumab) : RARoche discontinued the clinical development by considering overall risk to benefit profile
In-licensed
24
overall risk to benefit profile

Overview of Development Pipeline
Development Status –pTransplant, Immunology, Infectious diseases and others
E iEpogin : Predeposit of autologous blood transfusionApproved in Jun
In-house
Approved in Jun. • once-weekly subcutaneous administration become
availableNTZ : Chronic hepatitis CNTZ : Chronic hepatitis CDevelopment discontinued
• reviewing the priorities of development programs
In-licensed
25

Overview of Development Pipeline
Projected SubmissionsProjected Submissions
Fili f 2 d (1 j ) l d i H2 2010 Filings for 2 products (1 project) are planned in H2 2010
PEG/COPELiver Cirrhosis in-licensed
in-houseNME line extension
Filed
MIRCERA*Renal Anemia
AVASTIN
TARCEVANSCLC(1st line)
XELODA PEGASYSEPOGIN AVASTINpertuzumab
ED‐71Osteoporosis
AVASTINAdj.CC
AVASTINBC
HERCEPTINGC
BONVIVA*Osteoporosis
TARCEVAPC
XELODAGC
PEGASYSHBV
AVASTINAdj.BC
EPOGINCIA
AVASTINGlioblastoma
pertuzumabBC
*Overseas name
2013‐20152009 2010 2011 2012
26

Contacts : Corporate Communications Dept.
Corporate Communications GroupTel: +81 (0)3-3273-0881 Fax: +81 (0)3-3281-6607Tel: +81 (0)3 3273 0881 Fax: +81 (0)3 3281 6607e-mail: [email protected] Yamada, Shinichi Hirose, Hiroshi Araki, Kae Miyata
Investor Relations Groupes o e a o s G oupTel: +81 (0)3-3273-0554 Fax: +81 (0)3-3281-6607e-mail: [email protected] Uchida, Yumiko Watanabe, Yusuke Tokita, Chisato Kitamura