ai2 market report · ai2 market report business jet ... Ø ask versus final transaction value gap...
TRANSCRIPT

AI2MarketReportBusinessJet&TurbopropAircraft–Volume4,October2017
RecordLowAskPricesEnticingBuyers–SalesPrimarilyFocusedonHigherQualityAircraft
90-dayFutureValueeTrendTMProjectsQ4PricingDecline
WelcometotheAI2MarketReportfromAsset Insight,LLC. ThisQuarterlyMarketReport analyzed values for every production year of every modern make/modelBusinessClassaircraft,andourSeptember28,2017maintenanceanalyticscovered92fixed-wingmodelsand1,818aircraftlistedforsale.
Ø OveralldemandimprovedslightlybutremainedbelowaverageMarket demand improved from 2.90 to 2.91 during Q3. On our scale of 1.00(lowest)to5.00(highest),LargeJetsregisteredslightlylowerdemandat2.79versus2.80duringQ2,MediumJetdemandincreasedto2.97from2.89,SmallJetdemanddecreasedfrom2.93to2.90,andTurbopropsremainedunchangedat3.15.
Ø AverageAskPricereachedyetanotherrecordlowAverageAskPricefortrackedaircraftfell6.0%duringQ3,withallgroupsrecordingadecrease. Priceshave fallen16.7%over thepast 12monthsdriven, inpart, bytradesfocusedonthehighervalueassets.
Ø AskversusfinalTransactionvaluegapworsenedslightlySpread between Ask and final Transaction value for Small Jets and Turbopropremainedunchanged,at8.0%and9.2%,respectively.LargeandMediumJetsellersdidnotfareaswell;theformerworsening0.3%to12.5%andthelattercontinuingtopostthegreatest/worstgapat14.8%,anincreaseof0.1%.
Ø 90-DayFutureValuerateofdecreaseexpectedtovarybyassetgroupOur90-dayeTrendTMprojectsLargeJetvalueswillfall24%fasterduringQ4versusQ3, Medium Jets 3% slower, Small Jets 13% faster, while the rate of Turbopropvalue loss is expected to decrease by 18%. Primary drivers are expected to beinventorylevelsandsellertraditionalQ4desiretoselltheirassetpriortoyear-end.
Ø ForsalefleetAssetQualityfellto“VeryGood”Activetradingofhigherqualityaircraft resulted inAssetQualityendingQ3at justabove the12-month low figure–unable tomaintainan“Excellent” rating for thefirsttimesinceJanuary2015.
Ø MaintenanceExposureslightlybetterthanhistoricalaverageThe tracked inventory fleet’s accrued or embedded cost of future scheduledmaintenance(MaintenanceExposure)endedQ3incrementally lower/betterthanthe historical average, with Large Jets registering a 2.1% increase / degradation,whileallothergroupsexperiencedareduction/improvement:MediumJets1.0%;SmallJets16.4%;and,Turboprops5.0%.
Ø MaintenanceExposuretoAskPriceRatio(“ETPRatio”)at59.7%Thefleet’sETPRatio(MaintenanceExposuredividedbyAskPrice)increased4.9AI2basispoints inQ3,posting theworst figure for thepast12months. WeconsideranyETPRatioover40%torepresentexcessiveExposureinrelationtoAskPriceanda hindrance to aircraftmarketability. Assetswhose ETP Ratiowas 40%ormoreduringQ3werelistedforsale31%longer(onaverage)thanaircraftwhoseRatiowasbelow40%(229versus300DaysonMarket).
JohnB.SpoorE:[email protected]:[email protected],ASAE:[email protected],ASAE:[email protected],ASAE:[email protected],ASACandidateE:[email protected]
AssetInsight,LLC1424W.ChurchStreet
SandwichAirportSandwich,IL60548Tel:(888)814-8258
www.assetinsight.com
AssetInsight,LLC(888)[email protected]
AssetInsightQuarterlyMarketReportBusinessJet&TurbopropAircraft–Volume4,October2017
Page2of14
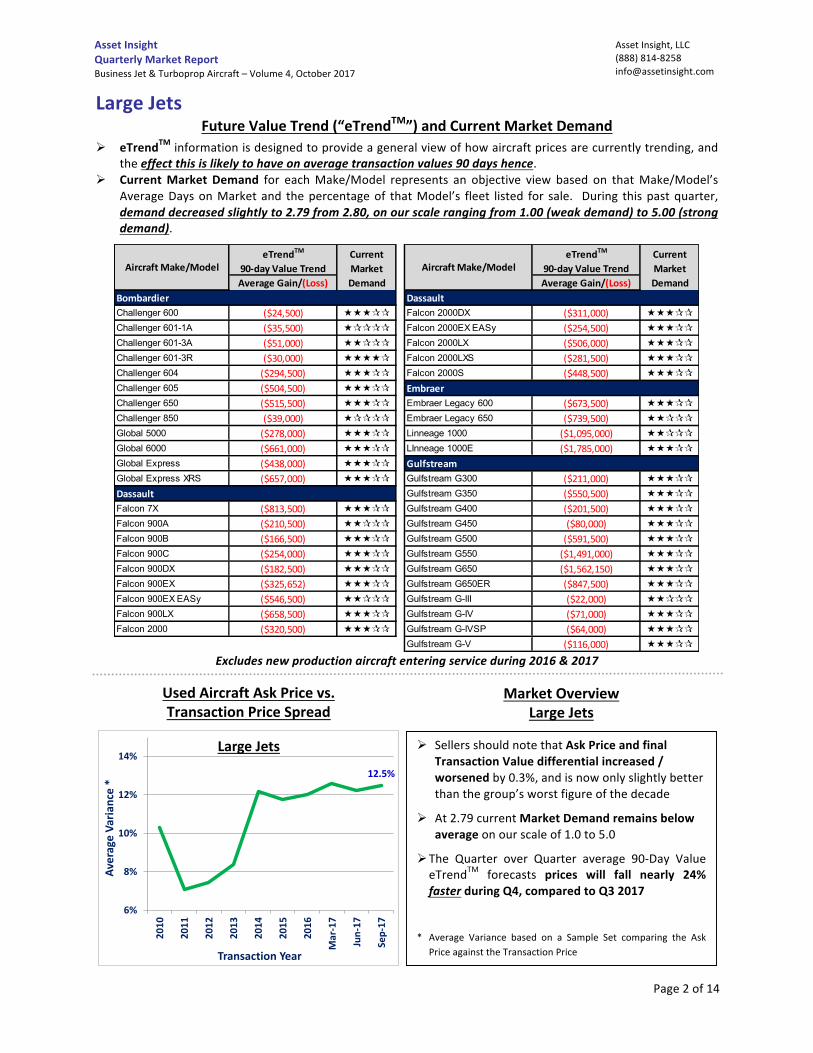
LargeJetsFutureValueTrend(“eTrendTM”)andCurrentMarketDemand
Ø eTrendTMinformationisdesignedtoprovideageneralviewofhowaircraftpricesarecurrentlytrending,andtheeffectthisislikelytohaveonaveragetransactionvalues90dayshence.
Ø CurrentMarket Demand for eachMake/Model represents an objective view based on thatMake/Model’sAverageDaysonMarketand thepercentageof thatModel’s fleet listed for sale. During thispastquarter,demanddecreasedslightlyto2.79from2.80,onourscalerangingfrom1.00(weakdemand)to5.00(strongdemand).
Current CurrentMarket MarketDemand Demand
Challenger 600 «««¶¶ Falcon 2000DX «««¶¶Challenger 601-1A «¶¶¶¶ Falcon 2000EX EASy «««¶¶Challenger 601-3A ««¶¶¶ Falcon 2000LX «««¶¶Challenger 601-3R ««««¶ Falcon 2000LXS «««¶¶Challenger 604 «««¶¶ Falcon 2000S «««¶¶Challenger 605 «««¶¶Challenger 650 «««¶¶ Embraer Legacy 600 «««¶¶Challenger 850 «¶¶¶¶ Embraer Legacy 650 ««¶¶¶Global 5000 «««¶¶ Linneage 1000 ««¶¶¶Global 6000 «««¶¶ LInneage 1000E «««¶¶Global Express «««¶¶Global Express XRS «««¶¶ Gulfstream G300 «««¶¶
Gulfstream G350 «««¶¶Falcon 7X «««¶¶ Gulfstream G400 «««¶¶Falcon 900A ««¶¶¶ Gulfstream G450 «««¶¶Falcon 900B «««¶¶ Gulfstream G500 «««¶¶Falcon 900C «««¶¶ Gulfstream G550 «««¶¶Falcon 900DX «««¶¶ Gulfstream G650 «««¶¶Falcon 900EX «««¶¶ Gulfstream G650ER «««¶¶Falcon 900EX EASy ««¶¶¶ Gulfstream G-III ««¶¶¶Falcon 900LX «««¶¶ Gulfstream G-IV «««¶¶Falcon 2000 «««¶¶ Gulfstream G-IVSP «««¶¶
Gulfstream G-V «««¶¶
($1,562,150)($254,000)
($847,500)
($658,500)
($116,000)($320,500)
($182,500)
($22,000)($325,652)
($71,000)($546,500)
($64,000)
($80,000)($813,500)
($591,500)($210,500)
($1,491,000)($166,500)
($211,000)($438,000)
($550,500)($657,000)
($201,500)Dassault
($739,500)($39,000)($1,095,000)($278,000)
Gulfstream($661,000) ($1,785,000)
Embraer($504,500)($673,500)($515,500)
($51,000) ($506,000)($30,000)
($448,500)($294,500)($281,500)
Bombardier Dassault($24,500) ($311,000)($35,500) ($254,500)
AircraftMake/ModeleTrendTM
AircraftMake/ModeleTrendTM
90-dayValueTrend 90-dayValueTrendAverageGain/(Loss) AverageGain/(Loss)
Excludesnewproductionaircraftenteringserviceduring2016&2017
12.5%
6%
8%
10%
12%
14%
2010
2011
2012
2013
2014
2015
2016
Mar-17
Jun-17
Sep-17
AverageVa
riance*
TransactionYear
LargeJets
Ø SellersshouldnotethatAskPriceandfinalTransactionValuedifferentialincreased/worsenedby0.3%,andisnowonlyslightlybetterthanthegroup’sworstfigureofthedecade
Ø At2.79currentMarketDemandremainsbelowaverageonourscaleof1.0to5.0
Ø The Quarter over Quarter average 90-Day ValueeTrendTM forecasts prices will fall nearly 24%fasterduringQ4,comparedtoQ32017
* Average Variance based on a Sample Set comparing the Ask
PriceagainsttheTransactionPrice
UsedAircraftAskPricevs.TransactionPriceSpread
MarketOverviewLargeJets

AssetInsight,LLC(888)[email protected]
AssetInsightQuarterlyMarketReportBusinessJet&TurbopropAircraft–Volume4,October2017
Page3of14
LargeJets
Worst Average Best Worst Best$3.33 $3.21 $2.82 $3.76 $2.58
-AstheETPRatiodecreases,theaircraft's"value"increases(inrelationtoitsAskPrice)
Highest Average Lowest Highest Lowest -AircraftwhoseETPRatioisabove40%areburdened,$14.27 $12.88 $11.58 $16.61 $11.58 onaverage,withexcessiveMaintenanceExposure
AssetQualityRatingKey
$Millions
ImportanceoftheETPRatio
$Millions $Millions
*Theaccruedcostoffuturescheduledmaintenance
AskPrice-ReferencePoints
Source:Amstat(www.amstatcorp.com)
12-monthFigures HistoricalFiguresMaintenanceExposure-ReferencePoints
MaintenanceExposure*($Mil)
MaintenanceExposuretoAskPriceRatio("ETPRatio")
AssetQualityRatingScale-2.500to10.000
AverageAskPrice($Mil)
12-monthFigures$Millions
HistoricalFigures
5.412
5.350
5.400
5.450
5.500
5.550
Oct-16
Nov-16
Dec-16
Jan-17
Feb-17
Mar-17
Apr-17
May-17
Jun-17
Jul-1
7
Aug-17
Sep-17
$3.243
$2.75
$3.00
$3.25
$3.50
Oct-16
Nov-16
Dec-16
Jan-17
Feb-17
Mar-17
Apr-17
May-17
Jun-17
Jul-1
7
Aug-17
Sep-17
52.8%
30%
40%
50%
60%Oct-16
Nov-16
Dec-16
Jan-17
Feb-17
Mar-17
Apr-17
May-17
Jun-17
Jul-1
7
Aug-17
Sep-17
$11.58$11
$12
$13
$14
$15
Oct-16
Nov-16
Dec-16
Jan-17
Feb-17
Mar-17
Apr-17
May-17
Jun-17
Jul-1
7
Aug-17
Sep-17
Outstanding ExcellentVeryGood Good Average
BelowAverage
5.500or
Greater
5.250to
5.499
5.000to
5.249
4.750to
4.999
4.500to
4.749
Lessthan4.500
DassaultBoeingBBJ 6.8% 317 F900LX 5.7% 374 EmbraerLegacy600 39.6% 371
F2000LX 11.0% 192 GulfstreamCL-605 17.4% 271 F900EXEASy 13.0% 121 G650 2.6% 245GlobalXRS 34.6% 304 Falcon2000EXEasy 20.6% 16 G450 18.4% 174Global5000 37.0% 244 F900DX 21.5% 158 G550 20.8% 148CL-604 39.3% 251 F900B 31.8% 160 GV 42.3% 118GlobalExpress 95.0% 466 F900EX 30.1% 266 GIV-SP 66.0% 232CL-601-3R 105.8% 464 Falcon2000 66.1% 190 GIV-SP(MSG3) 81.4% 292CL-601-3A 191.7% 149 GIV 106.4% 351CL-601-1A 197.9% 158
AskPriceandDaysonMarketsource:Amstat(www.amstatcorp.com)
Bombardier
BoeingModel ETPRatio
DaysonMarket Model ETPRatio
MaintenanceExposuretoAskPriceRatio("ETPRatio")&DaysonMarketDaysonMarket Model ETPRatio
DaysonMarket
Embraer

AssetInsight,LLC(888)[email protected]
AssetInsightQuarterlyMarketReportBusinessJet&TurbopropAircraft–Volume4,October2017
Page4of14
MediumJets
FutureValueTrend(“eTrendTM”)andCurrentMarketDemandØ eTrendTMinformationisdesignedtoprovideageneralviewofhowaircraftpricesarecurrentlytrending,and
theeffectthisislikelytohaveonaveragetransactionvalues90dayshence.Ø CurrentMarket Demand for eachMake/Model represents an objective view based on thatMake/Model’s
AverageDaysonMarketand thepercentageof thatModel’s fleet listed for sale. During thispastquarter,demand increased to 2.97 from 2.89, on our scale ranging from 1.00 (weak demand) to 5.00 (strongdemand).
Current CurrentMarket MarketDemand Demand
Challenger 300 «««¶¶ Embraer 500 «««¶¶Challenger 350 «««¶¶Lear 40 «««¶¶ Falcon 50 «««¶¶Lear 40XR «««¶¶ Falcon 50EX «««¶¶Lear 45 «««¶¶Lear 45XR «««¶¶ Gulfstream G100 «««¶¶Lear 55 «««¶¶ Gulfstream G150 «««¶¶Lear 60 «««¶¶ Gulfstream G200 «««¶¶Lear 60SE «««¶¶ Gulfstream G280 «««¶¶Lear 60XR «««¶¶Lear 70 «««¶¶ Hawker 700A ««¶¶¶Lear 75 «««¶¶ Hawker 750 «««¶¶
Hawker 800A «««¶¶Citation Excel «««¶¶ Hawker 800XP «««¶¶Citation Latitude «««¶¶ Hawker 800XPi «««¶¶Citation Sovereign «««¶¶ Hawker 850XP «««¶¶Citation Sovereign + «««¶¶ Hawker 900XP «««¶¶Citation X «««¶¶ Hawker 1000 «««¶¶Citation X+ «««¶¶ Hawker 4000 «««¶¶Citation XLS+ «««¶¶Citaiton XLS «««¶¶
AircraftMake/ModeleTrendTM
AircraftMake/ModeleTrendTM
90-dayValueTrend 90-dayValueTrendAverageGain/(Loss) AverageGain/(Loss)
Bombardier Embraer($676,000) ($346,000)($256,500) Dassault$17,500 ($25,000)($86,717) ($199,500)($18,000) Gulfstream($134,500) ($34,000)($12,500) ($149,500)($48,000) ($309,000)($64,000) ($458,000)($479,000) HawkerBeechcraft($112,000) ($3,000)($204,500) ($246,500)
Cessna ($24,500)($30,500) ($218,000)
($165,000)($189,000)
($542,500)($97,500)
($144,500)($136,500)
($436,000)
($1,143,000)($63,500)
($238,000)($329,000)
($138,000) Excludesnewproductionaircraftenteringserviceduring2016&2017
14.8%
8%
10%
12%
14%
16%
2010
2011
2012
2013
2014
2015
2016
Mar-17
Jun-17
Sep-17
AverageVa
riance*
TransactionYear
MediumJets
Ø Whileonly0.1%worsethanlastquarter,the14.8%differentialbetweenAskPriceandfinalTransactionValueremainstheworst/highestamongthefourgroups
Ø CurrentMarketDemandimprovedtonearaverageat2.97,onourscaleof1.0to5.0
Ø The Quarter over Quarter average 90-Day ValueeTrendTM forecasts prices will fall 3% slowerduringQ4,comparedtoQ32017
* Average Variance based on a Sample Set comparing the Ask
PriceagainsttheTransactionPrice
UsedAircraftAskPricevs.TransactionPriceSpread
MarketOverviewMediumJets

AssetInsight,LLC(888)[email protected]
AssetInsightQuarterlyMarketReportBusinessJet&TurbopropAircraft–Volume4,October2017
Page5of14
MediumJets
Worst Average Best Worst Best$1.29 $1.25 $1.22 $1.70 $0.85
-AstheETPRatiodecreases,theaircraft's"value"increases(inrelationtoitsAskPrice)
Highest Average Lowest Highest Lowest -AircraftwhoseETPRatioisabove40%areburdened,$3.26 $3.09 $2.95 $4.80 $2.95 onaverage,withexcessiveMaintenanceExposure
AssetQualityRatingKey
AssetQualityRatingScale-2.500to10.000
MaintenanceExposure*($Mil)
MaintenanceExposure-ReferencePoints12-monthFigures HistoricalFigures
$Millions $Millions
$Millions $Millions
Source:Amstat(www.amstatcorp.com)
*Theaccruedcostoffuturescheduledmaintenance
AskPrice-ReferencePoints ImportanceoftheETPRatio12-monthFigures HistoricalFigures
AverageAskPrice($Mil)
MaintenanceExposuretoAskPriceRatio("ETPRatio")
5.158
5.100
5.150
5.200
5.250
5.300
5.350
5.400
5.450Oct-16
Nov-16
Dec-16
Jan-17
Feb-17
Mar-17
Apr-17
May-17
Jun-17
Jul-1
7
Aug-17
Sep-17
$1.263
$1.10
$1.20
$1.30
$1.40
Oct-16
Nov-16
Dec-16
Jan-17
Feb-17
Mar-17
Apr-17
May-17
Jun-17
Jul-1
7
Aug-17
Sep-17
63.5%
35%
40%
45%
50%
55%
60%
Oct-16
Nov-16
Dec-16
Jan-17
Feb-17
Mar-17
Apr-17
May-17
Jun-17
Jul-1
7
Aug-17
Sep-17
$2.95
$2.75
$3.00
$3.25
$3.50
Oct-16
Nov-16
Dec-16
Jan-17
Feb-17
Mar-17
Apr-17
May-17
Jun-17
Jul-1
7
Aug-17
Sep-17
Outstanding ExcellentVeryGood Good Average
BelowAverage
5.500or
Greater
5.250to
5.499
5.000to
5.249
4.750to
4.999
4.500to
4.749
Lessthan4.500
GulfstreamLearjet60XR 23.0% 298 CitationXLS 26.6% 156 G-150 14.1% 288Challenger300 25.6% 147 CitationXLS(MSG3) 27.1% 179 G-200 44.3% 144Learjet45XR 30.1% 631 CitationExcel560XL 36.0% 155 HawkerLearjet45 39.9% 584 CitationX(MSG3) 58.6% 439 Hawker900XP 24.1% 185Learjet45w/APU 49.0% 537 CitationVI 101.7% 88 Hawker850XP 40.9% 188Learjet60 109.1% 338 Dassault Hawker400XP 43.7% 177Learjet55 200.2% 505 Falcon50EX 33.7% 310 HawkerBeechjet400A 56.6% 197Learjet55C 147.6% 429 Falcon50 73.1% 124 Hawker800XP 61.4% 258
Falcon20-5 226.0% 356 HawkerBeechjet400 114.8% 230CitationXLS+(MSG3) 9.0% 183 Hawker1000A 92.0% 611CitationSovereign680 17.1% 138 Hawker800A 135.0% 240
AskPriceandDaysonMarketsource:Amstat(www.amstatcorp.com)
ETPRatioDaysonMarket Model ETPRatio
DaysonMarket
MaintenanceExposuretoAskPriceRatio("ETPRatio")&DaysonMarket
Model ETPRatioDaysonMarket Model
Bombardier Cessna
Cessna

AssetInsight,LLC(888)[email protected]
AssetInsightQuarterlyMarketReportBusinessJet&TurbopropAircraft–Volume4,October2017
Page6of14
SmallJets
FutureValueTrend(“eTrendTM”)andCurrentMarketDemandØ eTrendTMinformationisdesignedtoprovideageneralviewofhowaircraftpricesarecurrentlytrending,and
theeffectthisislikelytohaveonaveragetransactionvalues90dayshence.Ø CurrentMarket Demand for eachMake/Model represents an objective view based on thatMake/Model’s
AverageDaysonMarketand thepercentageof thatModel’s fleet listed for sale. During thispastquarter,demanddecreasedslightlyto2.90from2.93,onourscalerangingfrom1.00(weakdemand)to5.00(strongdemand).
Current CurrentMarket MarketDemand Demand
CessnaPremier 1A «««¶¶ Citation CJ4 «««¶¶Premier I «««¶¶ Citation Encore + ««¶¶¶
Citation Encore «««¶¶Lear 31A ««¶¶¶ Citation M2 «««¶¶Lear 35 ««¶¶¶ Citation Mustang «««¶¶Lear 35A «««¶¶ Citation Ultra «««¶¶Lear 36 «««¶¶ Citation II «««¶¶Lear 36A «««¶¶ Citation III 650 «««¶¶
Citation V «««¶¶Citation Bravo «««¶¶ Citation VII «««¶¶Citation CJ1 «««¶¶ EclipseCitation CJ1+ «««¶¶ Eclipse 500 ««¶¶¶Citation CJ2 «««¶¶ EmbraerCitation CJ2+ «««¶¶ Embraer Phenom 100 «««¶¶Citation CJ3 «««¶¶ Embraer Phenom 100E ««««
Citation CJ3+ «««¶¶ Embraer Phenom 300 «««¶¶
NextantNextant XTi «««¶¶
Bombardier ($47,500)
AircraftMake/ModeleTrendTM
AircraftMake/ModeleTrendTM
90-dayValueTrend 90-dayValueTrendAverageGain/(Loss) AverageGain/(Loss)
Beechcraft($117,500) ($128,000)($14,500) ($45,500)
($26,000) ($49,500)($1,500) ($37,000)($21,000) ($8,500)
($88,500)
($7,000) ($26,500)($7,500) ($7,000)
Cessna ($69,500)($30,500) ($27,000)($24,000)($35,500) ($20,500)
($75,000)
($163,500) ($129,500)($275,000) ($137,500)($249,500) ($189,500)
Excludesnewproductionaircraftenteringserviceduring2016&2017
7.9%
5%
6%
7%
8%
9%
2010
2011
2012
2013
2014
2015
2016
Mar-17
Jun-17
Sep-17
AverageVa
riance*
TransactionYear
SmallJets
Ø AskPriceandfinalTransactionValuedifferentialcontinuestobethebest/lowestamongthefourgroupsandhasnowimprovedtothe2015level.
Ø MarketDemandremainedbelowaverage,fallingto2.90from2.93,onourscaleof1.0to5.0
Ø TheQuarteroverQuarteraverage90-DayValueeTrendTMforecastspriceswillfall13%fasterduringQ4,comparedtoQ32017
* Average Variance based on a Sample Set comparing the Ask
PriceagainsttheTransactionPrice
UsedAircraftAskPricevs.TransactionPriceSpread
MarketOverviewSmallJets

AssetInsight,LLC(888)[email protected]
AssetInsightQuarterlyMarketReportBusinessJet&TurbopropAircraft–Volume4,October2017
Page7of14
SmallJets
Worst Average Best Worst Best$0.75 $0.67 $0.64 $1.07 $0.57
Highest Average Lowest Highest Lowest$2.18 $2.03 $1.87 $2.21 $1.70
$Millions $Millions
Source:Amstat(www.amstatcorp.com)
AssetQualityRatingScale-2.500to10.000
MaintenanceExposure*($Mil)
MaintenanceExposure-ReferencePoints12-monthFigures HistoricalFigures
$Millions $Millions
MaintenanceExposuretoAskPriceRatio("ETPRatio")
-AstheETPRatiodecreases,theaircraft's"value"increases(inrelationtoitsAskPrice)-AircraftwhoseETPRatioisabove40%areburdened,onaverage,withexcessiveMaintenanceExposure
*Theaccruedcostoffuturescheduledmaintenance
AskPrice-ReferencePoints ImportanceoftheETPRatio12-monthFigures HistoricalFigures
AssetQualityRatingKey
AverageAskPrice($Mil)
5.310
5.200
5.300
5.400
5.500
5.600
5.700Oct-16
Nov-16
Dec-16
Jan-17
Feb-17
Mar-17
Apr-17
May-17
Jun-17
Jul-1
7
Aug-17
Sep-17
$0.745
$0.60
$0.65
$0.70
$0.75
$0.80
Oct-16
Nov-16
Dec-16
Jan-17
Feb-17
Mar-17
Apr-17
May-17
Jun-17
Jul-1
7
Aug-17
Sep-17
67.9%
30%
40%
50%
60%
70%
Oct-16
Nov-16
Dec-16
Jan-17
Feb-17
Mar-17
Apr-17
May-17
Jun-17
Jul-1
7
Aug-17
Sep-17
$1.88
$1.8
$2.0
$2.2
Oct-16
Nov-16
Dec-16
Jan-17
Feb-17
Mar-17
Apr-17
May-17
Jun-17
Jul-1
7
Aug-17
Sep-17
Outstanding ExcellentVeryGood Good Average
BelowAverage
5.500or
Greater
5.250to
5.499
5.000to
5.249
4.750to
4.999
4.500to
4.749
Lessthan4.500
Premier1A 44.5% 226 CitationCJ3 13.5% 188 CitationBravo 57.3% 248Premier1 68.3% 165 CitationCJ2+525A 16.3% 161 CitationV560 86.9% 161
CitationEncore 25.2% 133 CitationII 98.9% 267Learjet31 111.7% 487 CitationCJ2 25.4% 189 CitationISP 126.1% 408Learjet35A 175.5% 563 CitationMustang510 26.7% 294 Embraer
CitationCJ1+ 31.2% 212 Phenom300 11.2% 283CitationCJ4525C 7.1% 108 CitationVUltra 50.0% 255 Phenom100 30.2% 270
Bombardier
Cessna
Cessna
CessnaBeechcraftModel ETPRatioETPRatio
DaysonMarketModel ETPRatio
DaysonMarket Model
MaintenanceExposuretoAskPriceRatio("ETPRatio")&DaysonMarket
AskPriceandDaysonMarketsource:Amstat(www.amstatcorp.com)
DaysonMarket

AssetInsight,LLC(888)[email protected]
AssetInsightQuarterlyMarketReportBusinessJet&TurbopropAircraft–Volume4,October2017
Page8of14
Turboprops
FutureValueTrend(“eTrendTM”)andCurrentMarketDemandØ eTrendTMinformationisdesignedtoprovideageneralviewofhowaircraftpricesarecurrentlytrending,and
theeffectthisislikelytohaveonaveragetransactionvalues90dayshence.Ø CurrentMarket Demand for eachMake/Model represents an objective view based on thatMake/Model’s
AverageDaysonMarketand thepercentageof thatModel’s fleet listed for sale. During thispastquarter,demandremainedsteadyat3.15,onourscalerangingfrom1.00(weakdemand)to5.00(strongdemand).
CurrentMarketDemand
208 Caravan (2001+) «««¶¶208 Caravan (2008+) «««¶¶208B Grand Caravan (2001+) «««¶¶208B Grand Caravan (2008+) «««¶¶
BeechKing Air 350 (1990-2009) «««¶¶King Air 350i ««««
PiaggioPiaggio Avanti P180 II ««¶¶¶
PilatusPilatus PC-12 41 and 45 «««¶¶Pilatus PC-12 47 ««««¶Pilatus PC-12-47E NG ««««
SocataSocata 700A TBM «««¶¶Socata 700B TBM «««¶¶Socata Pack TBM 850 «««¶¶
($16,500)
AircraftMake/ModeleTrendTM
90-dayValueTrendAverageGain/(Loss)
Cessna
($34,000)
($63,000)($20,000)($32,000)
($14,000)($252,000)
($88,500)
($22,000)($1,000)($29,500)
($21,000)($8,000)
Excludesnewproductionaircraftenteringserviceduring2016&2017
9.2%
3%
5%
7%
9%
11%
2010
2011
2012
2013
2014
2015
2016
Mar-17
Jun-17
Sep-17
AverageVa
riance*
TransactionYear
Turboprops
Ø AskPriceandfinalTransactionValuedifferentialremainedunchanged,andthebestfiguregeneratedbyTurbopropsince2013
Ø MarketDemandremainsaboveaverageat3.15onourscaleof1.0to5.0
Ø TheQuarteroverQuarteraverage90-DayValueeTrendTMforecastspriceswillfallover18%slowerduringQ4,comparedtoQ32017
* Average Variance based on a Sample Set comparing the Ask
PriceagainsttheTransactionPrice
UsedAircraftAskPricevs.TransactionPriceSpread
MarketOverviewTurboprops

AssetInsight,LLC(888)[email protected]
AssetInsightQuarterlyMarketReportBusinessJet&TurbopropAircraft–Volume4,October2017
Page9of14
Turboprops
Worst Average Best Worst Best$0.61 $0.58 $0.55 $0.70 $0.44
Highest Average Lowest Highest Lowest$1.58 $1.56 $1.53 $1.97 $1.46
$Millions $Millions (inrelationtoitsAskPrice)-AircraftwhoseETPRatioisabove40%areburdened,onaverage,withexcessiveMaintenanceExposure
*Theaccruedcostoffuturescheduledmaintenance
AskPrice-ReferencePoints ImportanceoftheETPRatio12-monthFigures HistoricalFigures -AstheETPRatiodecreases,theaircraft's"value"increases
MaintenanceExposuretoAskPriceRatio("ETPRatio")
AverageAskPrice($Mil)
AssetQualityRatingKey MaintenanceExposure-ReferencePoints12-monthFigures HistoricalFigures
$Millions $Millions
MaintenanceExposure*($Mil)
AssetQualityRatingScale-2.500to10.000
4.944
4.800
4.900
5.000
5.100
Oct-16
Nov-16
Dec-16
Jan-17
Feb-17
Mar-17
Apr-17
May-17
Jun-17
Jul-1
7
Aug-17
Sep-17
$0.607
$0.50
$0.55
$0.60
Oct-16
Nov-16
Dec-16
Jan-17
Feb-17
Mar-17
Apr-17
May-17
Jun-17
Jul-1
7
Aug-17
Sep-17
49.1%
30%
40%
50%
60%
Oct-16
Nov-16
Dec-16
Jan-17
Feb-17
Mar-17
Apr-17
May-17
Jun-17
Jul-1
7
Aug-17
Sep-17
$1.53
$1.50
$1.55
$1.60
Oct-16
Nov-16
Dec-16
Jan-17
Feb-17
Mar-17
Apr-17
May-17
Jun-17
Jul-1
7
Aug-17
Sep-17
Outstanding ExcellentVeryGood Good Average
BelowAverage
5.500or
Greater
5.250to
5.499
5.000to
5.249
4.750to
4.999
4.500to
4.749
Lessthan4.500
KingAir350-Pre-2001 23.6% 112 BeechB-1900C 96.6% 526 PilatusPC-12 15.5% 99KingAirB-200-Post-2000 30.3% 330 KingAirC90 112.5% 645KingAir350-Post-2000 30.7% 259 PiperMeridian 25.8% 133KingAirB-200-Pre-2001 44.5% 219 PiaggioP-180II 51.0% 194KingAir300 45.2% 201 PiaggioP-180 87.1% 167
Beechcraft Pilatus
PiperPiaggio
BeechcraftModel ETPRatio
MaintenanceExposuretoAskPriceRatio("ETPRatio")&DaysonMarket
AskPriceandDaysonMarketsource:Amstat(www.amstatcorp.com)
DaysonMarket Model ETPRatio
DaysonMarketModel ETPRatio
DaysonMarket

AssetInsight,LLC(888)[email protected]
AssetInsightQuarterlyMarketReportBusinessJet&TurbopropAircraft–Volume4,October2017
Page10of14
Aircraftanalyzed–maintenanceanalyticsFollowingisalistoftheaircraftmodelsresearchedtoproducethisMarketReport’smaintenanceanalytics:
LargeJets MediumJets SmallJets TurbopropsBeechcraft-Hawker: • Beechjet400 • Premier1 • KingAirC90 • Beechjet400A • Premier1A • KingAirB-200 • Hawker400XP • KingAir300 • Hawker800A;800XP • KingAir350 • Hawker850XP • B-1900C • Hawker900XP • Hawker1000A Boeing:• BBJ
Bombardier:• CL-601-1A;3A;-3R;-SE • Challenger300 • Learjet31 • CL-604 • Learjet45;45w/APU • Learjet35A • CL-605 • Learjet45XR • Global5000 • Learjet55-55A • GlobalExpress • Learjet55C • GlobalXRS • Learjet60
• Learjet60XR Cessna: • CitationExcel • CitationCJ1+ • CitationSovereign • CitationCJ2 • CitationVI • CitationCJ3 • CitationX(MSG3) • CitationCJ4 • CitationXLS;XLS(MSG3) • CitationBravo • CitationXLS+(MSG3) • CitationEncore • CitationI-SP • CitationII • CitationMustang • CitationV;CitationVUltra DassaultFalconJet:• F2000 • Falcon20-5 • F2000EX;F2000EXEasy • Falcon50 • F2000DX;F2000LX • Falcon50EX • F900;F900B;F900C • F900EX;F900EXEasy • F900DX;F900LX
Embraer: • Legacy600 • Phenom100
• Phenom300 Gulfstream:• G-IV • G-100 • GIV-SP&GIV-SP(MSG3) • G-150 • GV • G-200 • G350 • G450 • G550
Piaggio: • P-180;P180IIPilatus: • PC-12Piper: • MalibuMeridian
AssetInsight,LLC(888)[email protected]
AssetInsightQuarterlyMarketReportBusinessJet&TurbopropAircraft–Volume4,October2017
Page11of14
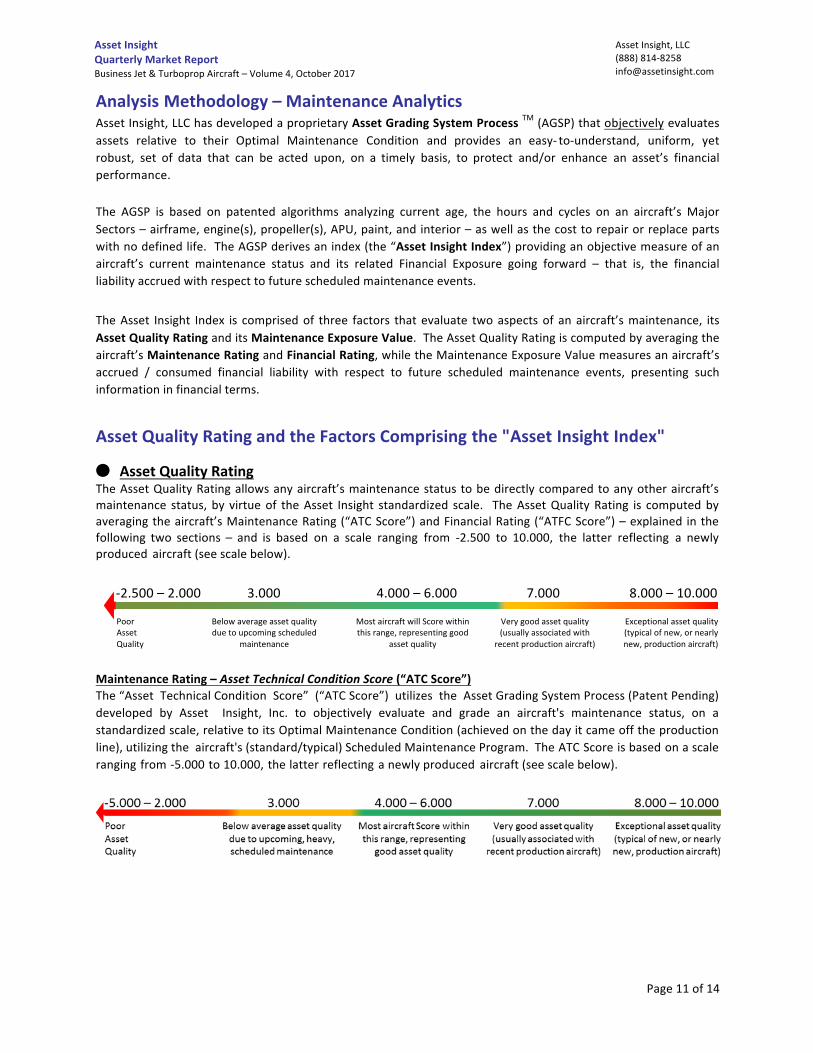
AnalysisMethodology–MaintenanceAnalyticsAssetInsight,LLChasdevelopedaproprietaryAssetGradingSystemProcessTM(AGSP)thatobjectivelyevaluatesassets relative to their Optimal Maintenance Condition and provides an easy- to-understand, uniform, yetrobust, set of data that can be acted upon, on a timely basis, to protect and/or enhance an asset’s financialperformance.The AGSP is based on patented algorithms analyzing current age, the hours and cycles on an aircraft’s MajorSectors–airframe,engine(s),propeller(s),APU,paint,andinterior–aswellasthecosttorepairorreplacepartswithnodefinedlife.TheAGSPderivesanindex(the“AssetInsightIndex”)providinganobjectivemeasureofanaircraft’s current maintenance status and its related Financial Exposure going forward – that is, the financialliabilityaccruedwithrespecttofuturescheduledmaintenanceevents.TheAsset Insight Index is comprisedof three factors thatevaluate twoaspectsof anaircraft’smaintenance, itsAssetQualityRatinganditsMaintenanceExposureValue.TheAssetQualityRatingiscomputedbyaveragingtheaircraft’sMaintenanceRatingandFinancialRating,whiletheMaintenanceExposureValuemeasuresanaircraft’saccrued / consumed financial liability with respect to future scheduled maintenance events, presenting suchinformationinfinancialterms.AssetQualityRatingandtheFactorsComprisingthe"AssetInsightIndex"
u AssetQualityRatingTheAssetQualityRatingallowsanyaircraft’smaintenancestatustobedirectlycomparedtoanyotheraircraft’smaintenance status, by virtueof theAsset Insight standardized scale. TheAssetQualityRating is computedbyaveragingtheaircraft’sMaintenanceRating(“ATCScore”)andFinancialRating(“ATFCScore”)–explained inthefollowing two sections – and is based on a scale ranging from -2.500 to 10.000, the latter reflecting a newlyproduced aircraft(seescalebelow).MaintenanceRating–AssetTechnicalConditionScore(“ATCScore”)The“AssetTechnicalConditionScore”(“ATCScore”)utilizestheAssetGradingSystemProcess(PatentPending)developed by Asset Insight, Inc. to objectively evaluate and grade an aircraft's maintenance status, on astandardizedscale,relativetoitsOptimalMaintenanceCondition(achievedonthedayitcameofftheproductionline),utilizingtheaircraft's(standard/typical)ScheduledMaintenanceProgram.TheATCScoreisbasedonascalerangingfrom-5.000to10.000,thelatterreflectinganewlyproduced aircraft(seescalebelow).
-2.500–2.0003.0004.000–6.0007.0008.000–10.000
PoorAssetQuality
Belowaverageassetqualityduetoupcomingscheduled
maintenance MostaircraftwillScorewithinthisrange,representinggood
assetquality Verygoodassetquality(usuallyassociatedwith
recentproductionaircraft) Exceptionalassetquality(typicalofnew,ornearlynew,productionaircraft)
AssetInsight,LLC(888)[email protected]
AssetInsightQuarterlyMarketReportBusinessJet&TurbopropAircraft–Volume4,October2017
Page12of14
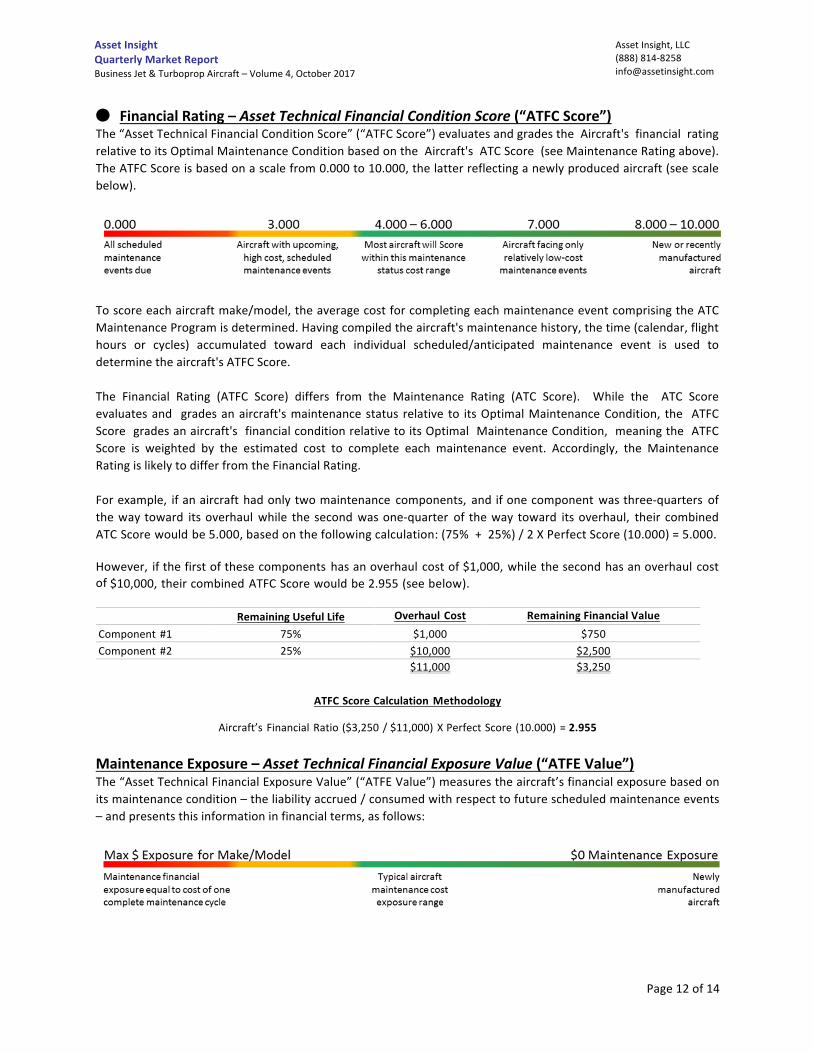
v FinancialRating–AssetTechnicalFinancialConditionScore(“ATFCScore”)The“AssetTechnicalFinancialConditionScore”(“ATFCScore”)evaluatesandgradestheAircraft'sfinancialratingrelativetoitsOptimalMaintenanceConditionbasedontheAircraft'sATCScore(seeMaintenanceRatingabove).TheATFCScoreisbasedonascalefrom0.000to10.000,thelatterreflectinganewlyproducedaircraft(seescalebelow).
Toscoreeachaircraftmake/model,theaveragecostforcompletingeachmaintenanceeventcomprisingtheATCMaintenanceProgramisdetermined.Havingcompiledtheaircraft'smaintenancehistory,thetime(calendar,flighthours or cycles) accumulated toward each individual scheduled/anticipated maintenance event is used todeterminetheaircraft'sATFCScore.The Financial Rating (ATFC Score) differs from the Maintenance Rating (ATC Score). While the ATC Scoreevaluatesand gradesanaircraft'smaintenancestatus relative to itsOptimalMaintenanceCondition, the ATFCScoregradesanaircraft'sfinancialconditionrelativetoitsOptimalMaintenanceCondition,meaningtheATFCScore is weighted by the estimated cost to complete each maintenance event. Accordingly, the MaintenanceRatingislikelytodifferfromtheFinancialRating.Forexample, ifanaircrafthadonlytwomaintenance components, andifonecomponentwasthree-quarters ofthewaytoward itsoverhaul while thesecondwasone-quarter of theway toward itsoverhaul, their combinedATCScorewouldbe5.000,basedonthefollowingcalculation:(75%+25%)/2XPerfectScore(10.000)=5.000.However, ifthefirstofthesecomponents hasanoverhaul costof$1,000,whilethesecondhasanoverhaul costof$10,000,theircombinedATFCScorewouldbe2.955(seebelow). RemainingUsefulLife OverhaulCost RemainingFinancialValueComponent #1 75% $1,000 $750Component #2 25% $10,000 $2,500 $11,000 $3,250
ATFCScoreCalculationMethodology
Aircraft’sFinancialRatio($3,250/$11,000)XPerfectScore(10.000)=2.955
MaintenanceExposure–AssetTechnicalFinancialExposureValue(“ATFEValue”)The“AssetTechnicalFinancialExposureValue”(“ATFEValue”)measurestheaircraft’sfinancialexposurebasedonitsmaintenancecondition–theliabilityaccrued/consumedwithrespecttofuturescheduledmaintenanceevents–andpresentsthisinformationinfinancialterms,asfollows:

AssetInsight,LLC(888)[email protected]
AssetInsightQuarterlyMarketReportBusinessJet&TurbopropAircraft–Volume4,October2017
Page13of14
Toderiveanaircraft'sATFEValue,theestimatedcostforcompletingeacheventcomprisingtheATCMaintenanceProgram has been established. Having compiled an aircraft's maintenance history, the time (flight hours,landings/cycles,and/orcalendarperiod)accumulatedtowardeachindividualscheduled/anticipatedmaintenanceeventisusedtocomputethedollarliabilityaccruedtowardthatevent,withtheATFEValuerepresentingthetotalaccruedliabilitytowardfuturemaintenanceevents.UsedAircraftAskPricevs.TransactionalPriceSpread
Detailed analytics are used to determine the ask price of an aircraft and its bid/ask spreads, including, but notlimitedto,itemssuchasmarketsupply,demand,saturation,aircraftage,competition,utility,damage,economics,financing,trade,exclusivity,compulsiontosell,buyer/sellermarketstrength,etc.FutureValueTrend(“eTrendTM”)andCurrentMarketDemandeTrendTMinformationisdisplayedbyMake/Modelandisintendedtoprovideageneralviewofhowaircraftpricesarecurrentlytrendingandtheeffectthis is likelytohaveonaveragetransactionvalues90dayshence. CurrentMarketDemandforeachMake/ModelisanobjectiveviewbasedonthatMake/Model’sAverageDaysonMarketand the percentage of thatModel’s fleet listed for sale. All figures EXCLUDE new production aircraft enteringserviceduring2016and2017.AskPricevs.AssetExposuretoAskPriceRatio(“ETPRatio”)GraphThegraphdisplaystherelationshipbetweeneachaircraftgroup’s“AssetExposuretoAskPrice”Ratio (theATFEValuedividedbytheAverageAskPrice)andtheAverageAskPrice.Ingeneral,asaircraftAskPricesrise,theRatioshoulddecrease–allotherfactorsbeingequal.However,theRatio’srelationshiptoAskPriceisnotanabsoluteinversecorrelation. Aircraftwithagreateror lessermaintenance-relatedFinancialExposure,butwiththesameAskPrice,may replaceaircraft listed“for sale”duringanygivenmonth. Accordingly, it ispossible forboth theRatioandtheAskPricelinestomoveinthesamedirection.AssetExposuretoAskPriceRatio(“ETPRatio”)TheAssetExposuretoAskPriceRatio(“ETPRatio”)iscalculatedbydividingtheaircraft’sATFEValue(thefinancialliabilityaccruedwith respect to futurescheduledmaintenanceevents)by itsAskPrice. Accordingly,as theETPRatiodecreases, theaircraft’s“value” increases(inrelationto itsAskPrice). AircraftwhoseETPRatio is40%orgreaterarebelievedtohaveaccruedanexcessivelevelofmaintenanceAssetExposure(ATFEValue)inrelationtotheirAskPrice.ETPRatiosareonlyavailableincaseswhereastatisticallysignificantsampleofaircraftAskPriceandmaintenancestatuscanbederivedforaspecificMake/Model.

AssetInsight,LLC(888)[email protected]
AssetInsightQuarterlyMarketReportBusinessJet&TurbopropAircraft–Volume4,October2017
Page14of14
GeneralInformationAsset Insight, LLC (www.assetinsight.com) provides asset evaluation and financial optimization services. Thecompany’s “Asset Grading System Standard” (Patent Pending), and related analyses, provides the ability totranslatetheasset’stechnicalconditionintoeasy-to-understand,actionablefinancialinformation.AssetInsightisindependentofanymanufacturer,appraisalfirm,financialservicesfirm,ortechnicalservicesfacility,enablingittoprovideanunbiasedviewofanasset’sconditionwithrespecttoitstechnicalstatusandrelatedfinancialexposure.Thecompanyismanagedbybusiness,technicalandfinancialprofessionalswithsignificantexperienceinaviationassetmanagement.This Analysis is not intended to represent a technical evaluation of any Aircraft. Further, the reader, or anypartyusinginformationcontainedinthisReport, should recognize that this Report is limited inscope, and thatdiscrepant conditions may exist in the analyzedaircraft thatwere not knownbyAssetInsight,LLC.TheAssetInsightIndexandits ATC Score, ATFC Score, andATFE Valuecomponentsare based upon the aircraftmaintenance condition information reviewedbyAssetInsight,LLC asofacertaindate.Runningan analysisonany aircraftutilizinga differentdate, revisedmaintenance data and/or utilization figures will likely generatedifferent results. Asset Insight, LLC makes no representation concerning the value or condition of any aircraft. Additionally,Asset Insight, LLC does notwarrant the accuracy of the information obtained by Asset Insight, LLC that hasbeenusedtoproducethisReport.CopyrightNoticeThe information contained in this document may be copied for use in presentations, proposals, or otherbusiness matters related to this Aircraft, provided that no money is exchanged. Additionally, the coversheet for all such copies shallcontainthefollowingnoticeinreadable,boldtype:
“Theattachedmaterial istheproprietary informationofAssetInsight,LLC”
Asset Insight, LLC P.O.Box27740,LasVegas,NV89126
Telephone:(888)814-8258|www.assetinsight.com