aice.mannvrijbullrevised. suspects, lies, and videotape: an analysis of authentic high-stake liars...
TRANSCRIPT

AICE.MannVrijBullRevised

Suspects, Lies, and Videotape: An Analysis of Authentic High-Stake Liars
Samantha Mann, Aldert Vrij, and Ray Bull
Background
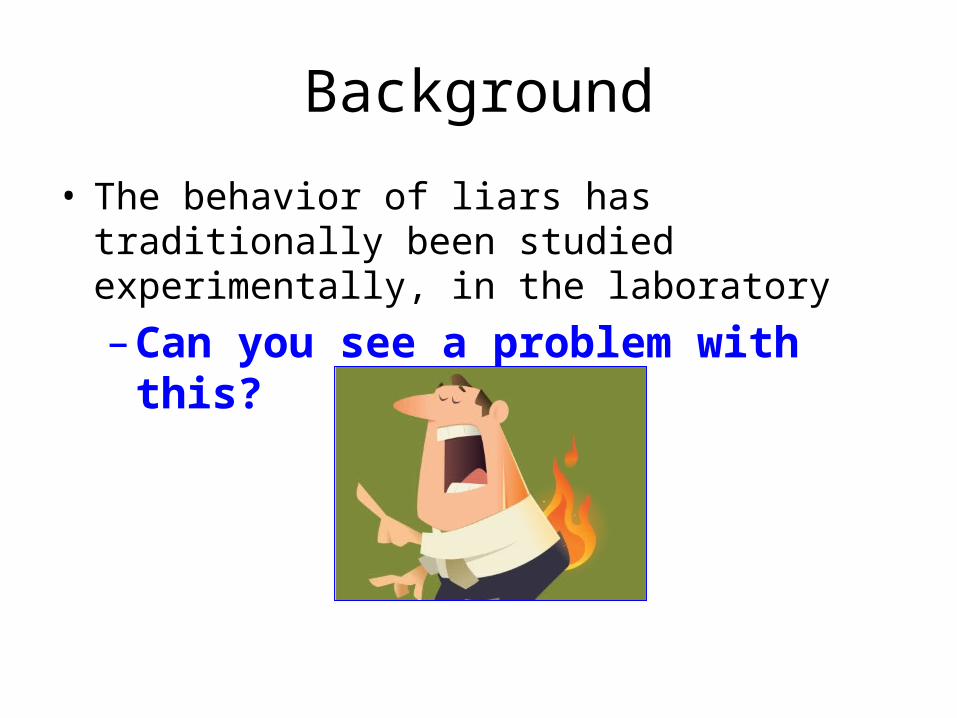
• The behavior of liars has traditionally been studied experimentally, in the laboratory –Can you see a problem with
this?

Background
• Vrij and Mann (2001) Differences between lying in ‘real life settings’ & lying in an ‘experimental situation’ led to examining videotape of a murder in police custody
• This study extends the findings of that study with a larger sample

AIMS
• To determine if there are systematic behavioral indicators to distinguish between those who are telling lies and those who are telling the truth.
• To determine if cognitive load causes changes in behavior related to lying or telling the truth

Cognitive Load
Total amount of mental effort being used in the working memory.
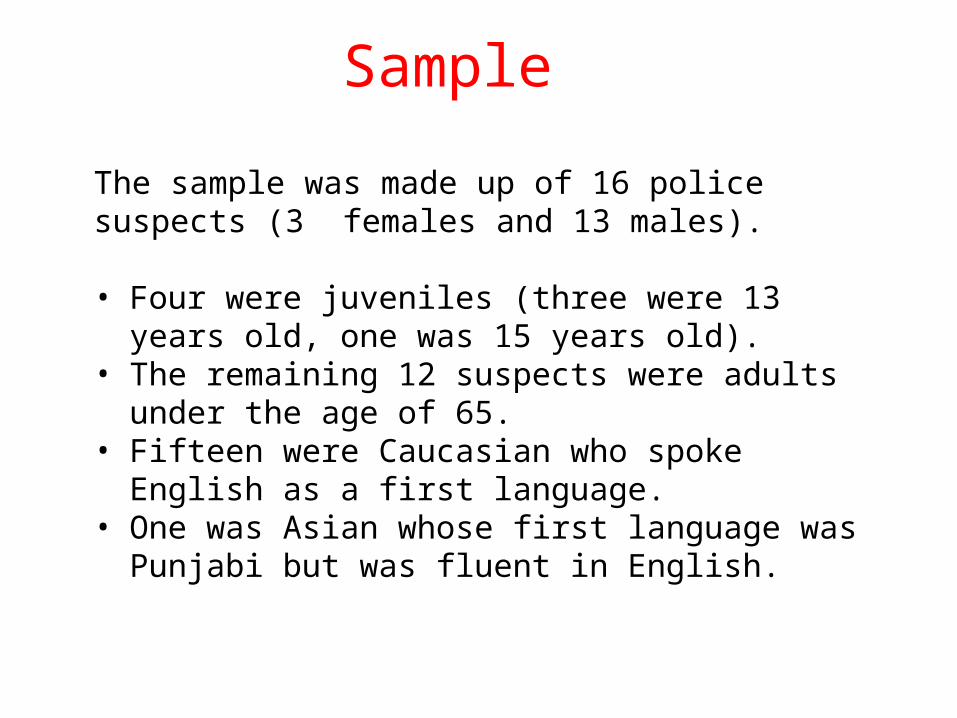
Sample
The sample was made up of 16 police suspects (3 females and 13 males).
• Four were juveniles (three were 13 years old, one was 15 years old).
• The remaining 12 suspects were adults under the age of 65.
• Fifteen were Caucasian who spoke English as a first language.
• One was Asian whose first language was Punjabi but was fluent in English.

Method
• What was the IV?–What was believed to effect the
measured variable?Telling truth/ telling lie
• What was the DV?–What was being measured?
Behavior shown when telling lie/ telling the truth

Method: Quasi Experiment
• Participants are not randomly assigned to experimental groups
• Used when experimenter is interested in an IV that cannot be randomly assigned because it exists innately in that person• EX: pregnancy, race, personality traits
• This was a quasi (or “natural”) experiment because no variable was manipulated by the researchers.

Procedure
• Total of 65 video clips (27 truth / 38 lies)
• Observers were instructed to ‘code the video footage’
• one truth-telling score, and one lie telling score for each behavior for each participant
• Not informed about the hypothesis or nature of the video clips
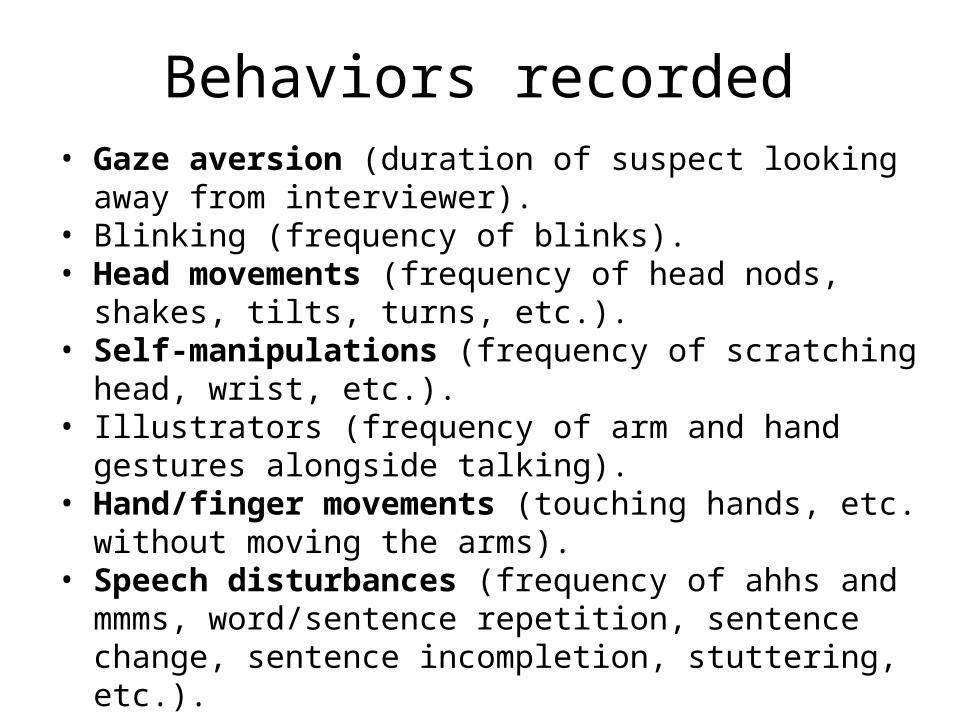
Behaviors recorded• Gaze aversion (duration of suspect looking away from
interviewer).• Blinking (frequency of blinks).• Head movements (frequency of head nods, shakes, tilts, turns,
etc.).• Self-manipulations (frequency of scratching head, wrist, etc.).• Illustrators (frequency of arm and hand gestures alongside
talking).• Hand/finger movements (touching hands, etc. without moving
the arms).• Speech disturbances (frequency of ahhs and mmms,
word/sentence repetition, sentence change, sentence incompletion, stuttering, etc.).
• Pauses (duration of noticeable pauses).

More ControlAn inter-rater reliability test was also conducted to check the similarities in both coder’s judgments. To avoid all bias,• the coder’s were not aware which parts of the
clips were showing truth or lies, and• they were not informed about the hypotheses
behind the study.
Their only instruction was to “code the video footage”. There was a strong consistency between
the coders.

• Lies were accompanied by decreased blinking and increased pauses (shown in 81% of the sample).
• Other than the above, no significant differences of behavior in lying and honesty was observed.
• There were many individual differences.• 50% of liars showed more head movements and speech
disturbances, the other 50% showed a decrease.• 56% of liars shown more gaze aversion, 44% of liars showed a
decrease in gaze aversion.• Most suspects showed a decrease in hand and arm
movements, compared to 31% who showed an increase.
RESULTS
CONCLUSIONS?

Conclusion/Explanation
• Give some support for the cognitive load process in explaining deceptive behavior, as both fewer blinking and longer pauses are possible indicators of cognitive load.
• However, because they did not measure nor manipulate cognitive load and nervousness in this study, all conclusions are speculative

StrengthsVery high ecological validity: The ecological validity of this study was very high because nothing was manipulated or changed by the experimenters; it was all natural behavior in a natural setting.
Quantitative data: Most of the data was quantitative, in the form of frequencies and statistics. This means it is objective and free of personal interpretations, and it is also easier to analyze (how many times someone did something is easier to conclude than ‘why’ someone did something).
Strengths
Reliability of coders (Inter-Rater Reliability): • The coders who organized the material were unaware of
the nature and processes behind the study, making them less likely to bias the findings. Because they were unaware, their observations were objective and based on factual evidence and solid observations rather than their personal thoughts.
• The reliability of both coders’ observations was also checked and found to be very consistent, meaning their ratings were highly similar.
Weaknesses
Less control: There was absolutely no control over confounding variables. • For example: the suspects were interviewed by different
people, they were interviewed about different things, some suspects had more than one interviewer in the room.
Small sample size: The sample consisted of 16 participants only, all from a similar background, ethnicity and area. This means the results cannot be generalized to a wider population as the sample is biased.

EthicsInformed consentDeceptionConfidentialityEmotional or physical harmThe right to withdrawDebriefing