aid for trade and value chains in transport and...
TRANSCRIPT

AID FOR TRADE AND VALUE CHAINS IN TRANSPORT AND LOGISTICS

Aid for Trade and Value Chains in
Transport and Logistics


ACKNOWLEDGEMENTS – 3
AID FOR TRADE AND VALUE CHAINS IN TRANSPORT AND LOGISTICS © OECD/WTO 2013
Acknowledgements
This report was written by Ben Shepherd. The author is grateful to Frans Lammersen
and Michael Roberts for their many inputs into this paper. In addition, the following
people provided helpful information and comments: Jean Acri, Susanne Aigner, Jean-
François Arvis, Heike Barczyk, Deborah Barker, Janaina Borges, Milena Budimirovic,
Olivier Cattaneo, Paulo Cravero, Matthias Helble, William Hynes, Gerard McLinden,
Evdokia Moise, Aime Murigande, Se Eun Park, Shishir Priyadarshi, Conor Trodden,
Matthew Wilson, and Trudy Witbreuk.

TABLE OF CONTENTS – 5
AID FOR TRADE AND VALUE CHAINS IN TRANSPORT AND LOGISTICS © OECD/WTO 2013
Table of contents
Acknowledgements ................................................................................................................................ 3
Acronyms ............................................................................................................................................... 9
Executive Summary ............................................................................................................................ 11
1. Why do transport and logistics matter for development? ........................................................... 15
Indirect impacts on development outcomes ....................................................................................... 16 Direct impacts on development outcomes ......................................................................................... 18
2. Measuring delays and their impacts: The toolkit ......................................................................... 23
3. Emerging trends: Where and why is progress being made? ....................................................... 27
Overall performance .......................................................................................................................... 27 Customs and other border procedures ................................................................................................ 30 Transport and ICT infrastructure ....................................................................................................... 32 Private services and service providers ............................................................................................... 34 Logistics regulation and the business environment ........................................................................... 36 Governance ........................................................................................................................................ 38 Red tape ............................................................................................................................................. 41 Summary ............................................................................................................................................ 43
4. Ensuring alignment and maximizing impact of aid for trade ..................................................... 47
Beneficiary priorities ......................................................................................................................... 47 Aid for transport and logistics............................................................................................................ 50 Partners, programs, and projects ........................................................................................................ 53
5. Conclusions ...................................................................................................................................... 59
References ............................................................................................................................................ 61
Annex A Indicators of delay - An overview ..................................................................................... 65
Tables
Table 1 Factors listed as the ‘most important’ or ‘important’ impacts of trade
on the economy – particularly through GVCs ...................................................................... 15 Table 2 Customs and other border procedure factors identified by the private sector....................... 30 Table 3 Transport and ICT infrastructure factors identified by the private sector ............................. 33 Table 4 Factors listed as national supply-side constraints by the private sector in
entering, establishing, or moving up GVCs .......................................................................... 34 Table 5 Logistics regulation and the business environment factors identified by
the private sector ................................................................................................................... 37 Table 6 Governance factors identified by the private sector ............................................................. 38

6 – TABLE OF CONTENTS
AID FOR TRADE AND VALUE CHAINS IN TRANSPORT AND LOGISTICS © OECD/WTO 2013
Table 7 Type of aid-for-trade support listed by the private sector as being the
‘most effective’ in helping them enter, establish, or move up transport
and logistics value chains ..................................................................................................... 48 Table 8 Donors identifying the listed effects as impacts of their aid-for- trade
and/or value chain support ................................................................................................... 53 Table 9 Donors identifying the type of support as a way in which their aid-for-trade
strategy seeks to promote the development of value chains ................................................ 57
Figures
Figure 1 Cross-country correlation between LPI scores and proportion of parts
and components in total exports.......................................................................................... 17 Figure 2 Cross-country correlation between LPI scores and diphtheria, pertussis,
and tetanus (DPT) immunization rates................................................................................ 19 Figure 3 Cross-country correlation between ‘doing business’ export times and the
total value of exports to the rest of the world in 2005 ........................................................ 24 Figure 4 Cross-country correlation between ‘doing business’ export times and
number of CN 8-digit product lines exported to the EU in 2005 ........................................ 25 Figure 5 LPI scores by income group ................................................................................................ 28 Figure 6 LPI scores by region ............................................................................................................ 28 Figure 7 LPI survey respondents (2012) indicating that customs and other border
procedures that have ‘improved’ or been ‘much improved’ in their country
relative to 2009, by region .................................................................................................. 31 Figure 8 LPI survey respondents (2012) indicating that transport and ICT infrastructure
has ‘improved’ or been ‘much improved’ in their country relative to 2009,
by region ............................................................................................................................. 34 Figure 9 LPI survey respondents (2012) indicating that the quality of private logistics
services is ‘improved’ or ‘much improved’ in their country relative to 2009,
by region ............................................................................................................................. 35 Figure 10 LPI survey respondents (2012) indicating that logistics regulation is
‘improved’ or ‘much improved’ in their country relative to 2009, by region ................... 38 Figure 11 LPI survey respondents (2012) indicating that solicitation of informal
payments in connection with logistics activities is ‘improved’ or ‘much
improved’ in their country relative to 2009, by region ..................................................... 39 Figure 12 Checkpoints, delays, and unofficial payments in West African countries ........................ 40 Figure 13 Number of documents required for export and import, 2009-2012,
by region ........................................................................................................................... 41 Figure 14 Cost to export and import, 2009-2012, by region .............................................................. 42 Figure 15 Aid disbursements related to the transport and logistics sector ......................................... 51 Figure 16 Aid disbursements for transport and logistics by category ................................................ 52
Boxes
Box 1 Logistics and the global food crisis ......................................................................................... 20 Box 2 The LPI and logistics and transport reforms in Indonesia ....................................................... 29 Box 3 World Customs Organization-led customs reform .................................................................. 32 Box 4 Facilitating cross-border trucking services.............................................................................. 35
TABLE OF CONTENTS – 7
AID FOR TRADE AND VALUE CHAINS IN TRANSPORT AND LOGISTICS © OECD/WTO 2013
Box 5 Successful red tape reforms in the doing business database ................................................... 42 Box 6 Shipping containers and quarantine pests ............................................................................... 44 Box 7 WTO agreement on trade facilitation ...................................................................................... 49 Box 8 Roads and trade facilitation for the Europe-Caucasus-Asia corridor ...................................... 53 Box 9 Regional transport corridors in Africa..................................................................................... 54 Box 10 Simplification of border procedures in Africa ...................................................................... 55 Box 11 Private sector development in Brazil..................................................................................... 56 Box A.1 TRS-led reform in a landlocked developing country .......................................................... 66


ACRONYMS – 9
AID FOR TRADE AND VALUE CHAINS IN TRANSPORT AND LOGISTICS © OECD/WTO 2013
Acronyms
AfDB African Development Bank
AFT Aid for Trade
APEC Asia-Pacific Economic Cooperation
ASEAN Association of Southeast Asian Nations
ASYCUDA Automated System for Customs Data
COMESA Common Market for Eastern and Southern Africa
CRS Creditor Reporting System
DPT Diphtheria, Pertussis, and Tetanus
ETI Global Enabling Trade Index
EU European Union
FDI Foreign Direct Investment
GATS General Agreement on Trade in Services
GATT General Agreement on Tariffs and Trade
GCI Global Connectedness Index
GDP Gross Domestic Product
GNI Gross National Income
GVCs Global Value Chains
HDI Human Development Index
ICT Information and Communication Technologies
IPPC International Plant Protection Convention
IRU International Road Transport Union
LPI Logistics Performance Index
OECD Organisation for Economic Co-operation and Development
OSBP One Stop Border Posts
PPP Public Private Partnerships
SPS Sanitary and Phyto-sanitary

10 – ACRONYMS
AID FOR TRADE AND VALUE CHAINS IN TRANSPORT AND LOGISTICS © OECD/WTO 2013
TFI Trade Facilitation Indicators
TRACECA Intergovernmental Commission for the Transport Corridor Europe-
Caucasus-Asia
TRS Time Release Studies
WCO World Customs Organization
WEF World Economic Forum
WTO World Trade Organization

EXECUTIVE SUMMARY – 11
AID FOR TRADE AND VALUE CHAINS IN TRANSPORT AND LOGISTICS © OECD/WTO 2013
Executive Summary
Transport and logistics is a sector in which global value chains (GVCs) play a vital
role in connecting countries, spreading technology, and promoting best practice around
the world. The transport and logistics GVC is notable for the variety of lead firms
involved in it—including major shipping, express delivery, and freight forwarding
firms—and the range of local operators they partner with. Increasingly, transport and
logistics GVCs are extending their reach into developing countries, including some low
income countries and least-developed countries.
In addition to its role as a GVC in its own right, the transport and logistics sector is
also key for the performance of other sectors of the economy. Manufacturing and
agriculture both depend on being able to ship their goods to consumers quickly, cost-
effectively, and reliably. Indeed, the GVC business model that has become so important
in sectors such as electronics or agrifood is impossible to implement without a strong
transport and logistics sector in each of the countries involved. The data suggest that
countries with better logistics performance tend to specialize more in manufacturing
GVCs. Delays, which are related to poor transport and logistics performance, can be
costly: an extra day can reduce exports by at least 1%, and can also impede export
diversification.
Indeed, transport and logistics have a number of direct and indirect links with
important economic and social development goals. On the one hand, transport and
logistics can boost trade performance, which, under appropriate circumstances, leads to
higher incomes, employment gains, and lower poverty rates. Sectoral performance is also
a key determinant of a government’s ability to move important human development
goods—like basic foodstuffs and vaccines—to its population, particularly in remote
areas, at the lowest possible cost.
The available data suggest that there is an encouraging trend of improvement in many
aspects of transport and logistics sector performance in the developing world. Of course,
performance varies considerably from one region to another—which suggests that there is
a significant potential for South-South knowledge exchange to take place in this area. In
terms of the main areas that influence performance of the transport and logistics value
chain, new OECD/WTO survey data from the private sector as well as cross-country
datasets from the World Bank reveal the following trends:
1. Infrastructure: Trade and transport infrastructure remains a serious constraint in many
developing countries. However, there is some evidence of improvement over recent
years in Sub-Saharan Africa, and the Middle East and North Africa. The most striking
trend, however, is the rapid diffusion of information and communication technologies
(ICTs) in most developing regions. It stands out as an area in which donors—
multilateral and bilateral—partner country governments and the private sector have all
made important contributions to a significant development outcome.
2. Customs and Other Border Procedures: Although improvements are evident in most
regions in border procedures, they are more pronounced in customs than in other areas.
In part, this dynamic reflects the global dispersion of best practice through international
12 – EXECUTIVE SUMMARY
AID FOR TRADE AND VALUE CHAINS IN TRANSPORT AND LOGISTICS © OECD/WTO 2013
instruments, as well as the active involvement of donors and partner countries in
upgrading customs. However, other border agencies, such as health/quarantine agencies
and agencies administering sanitary and phyto-sanitary measures also need attention in
order to improve supply chain performance. These other agencies are particularly
important for developing countries involved in emerging agrifood value chains.
3. Private Services and Regulation: The data suggest that the quality of private providers
of transport and logistics services is generally improving around the world. Efforts at
private sector development in this area would therefore appear to be bearing fruit. By
contrast, improvement in the regulatory measures that support and shape the private
sector’s performance is taking place at a slower pace. It is important that policymakers
and sectoral regulators ensure that further private sector upgrading is not inhibited by an
unduly restrictive regulatory environment.
4. Red Tape: Data from the World Bank’s Doing Business project suggest that although
performance improvements are evident in many areas of the transport and logistics
value chain, red tape still remains a serious issue facing importers and exporters in
many developing countries. Reductions in documentary formalities have been minimal
in recent years, and costs have actually increased in many countries. Many countries
have scope to further reduce delays and improve supply chain performance by
rationalizing red tape burdens.
5. Governance: More red tape often means that operators are more willing to make
unofficial “speed money” payments, which undermines the objective of improving
governance. Indeed, the data suggest that governance remains a significant constraint in
many developing countries. The uncertainty associated with poor supply chain
governance can translate into increased indirect costs for operators. Transport and
logistics service providers often find it easier to deal with a known delay, even if it is
not as short as it could be, than with a highly uncertain one. Governance should
therefore be an important aspect of value chain upgrading around the world.
Going forward, there is a clear case for donor countries, partner countries, and the
private sector to continue to work together to improve the transport and logistics value
chain, and help bring about the positive economic and social development outcomes it
can support. In a new OECD/WTO survey analyzed in this paper, partner countries
consistently see domestic and foreign private investment, as well as official development
assistance, as important sources of financing for development of the transport and
logistics value chain.
According to the priorities expressed by partner countries in the same survey, the
following areas will remain key for the aid-for-trade (AfT) agenda in the transport and
logistics sector:
1. Hard infrastructure: Many developing countries still require significant investments in
basic infrastructure like ports, airports, roads, and rail links. Mobilizing funds for an
initial investment is not enough, however. It is also important to ensure that funds are
available for continuous maintenance, so that facilities remain productive in years to
come.
2. “Soft” infrastructure: Hard infrastructure development only brings maximum benefits if
it is combined with other components of a comprehensive AfT agenda. Transport sector

EXECUTIVE SUMMARY – 13
AID FOR TRADE AND VALUE CHAINS IN TRANSPORT AND LOGISTICS © OECD/WTO 2013
regulation is important, because it governs the conditions under which operators can do
business, and often determines the conditions under which they can access key
international gateways. Customs and border procedures also matter, as they can have
serious impacts on delays and uncertainty faced by traders. The multilateral Agreement
on Trade Facilitation, currently under negotiation at the WTO, would help promote
more efficient customs and border procedures to allow goods to cross borders more
quickly and more cheaply and ensure legal certainty between trading partners. Finally,
private sector development is also key, as the private sector is the engine of
technological upgrading in the sector, a role that is enhanced as the transport and
logistics GVC develops further.
3. Coordination and collaboration: The case studies examined in this paper show that the
best results are achieved when multilateral and bilateral donors, as well as partner
countries and the private sector, are all engaged in improving transport and logistics
performance. It is important for the process to be driven by partner country priorities,
with the private sector playing a key role in their development. In terms of donor
collaboration and coordination, different agencies clearly have comparative advantage
in different areas, but transport and logistics work is inherently multi-dimensional. It
therefore requires coordinated input from a range of sources.

1. WHY DO TRANSPORT AND LOGISTICS MATTER FOR DEVELOPMENT? – 15
AID FOR TRADE AND VALUE CHAINS IN TRANSPORT AND LOGISTICS © OECD/WTO 2013
1. Why do transport and logistics matter for development?
There are many connections—both direct and indirect—between the transport and
logistics sector and important development outcomes. The significance of transport and
logistics for development is reflected in the fact that over 80% of partner country
respondents to an OECD/WTO survey on Aid for Trade (AfT) included transport and
trade facilitation among their top three new AfT priorities. Moreover, all respondents
indicate that their national development strategies identify transport as a specific source
of growth. No other sector has such unanimous recognition as a core lever for growth and
development.
One well known connection between transport and logistics and development is in
facilitating international trade transactions, which, under appropriate circumstances, boost
national income, reduce poverty, and thus contribute to economic and social
development.1 The OECD/WTO survey of partner countries provides a useful overview
of the development effects of increased trade connections, in particular through global
value chains (GVCs). Partner countries clearly have a strong belief that increased
participation in GVCs can be good for economic growth and social development. The
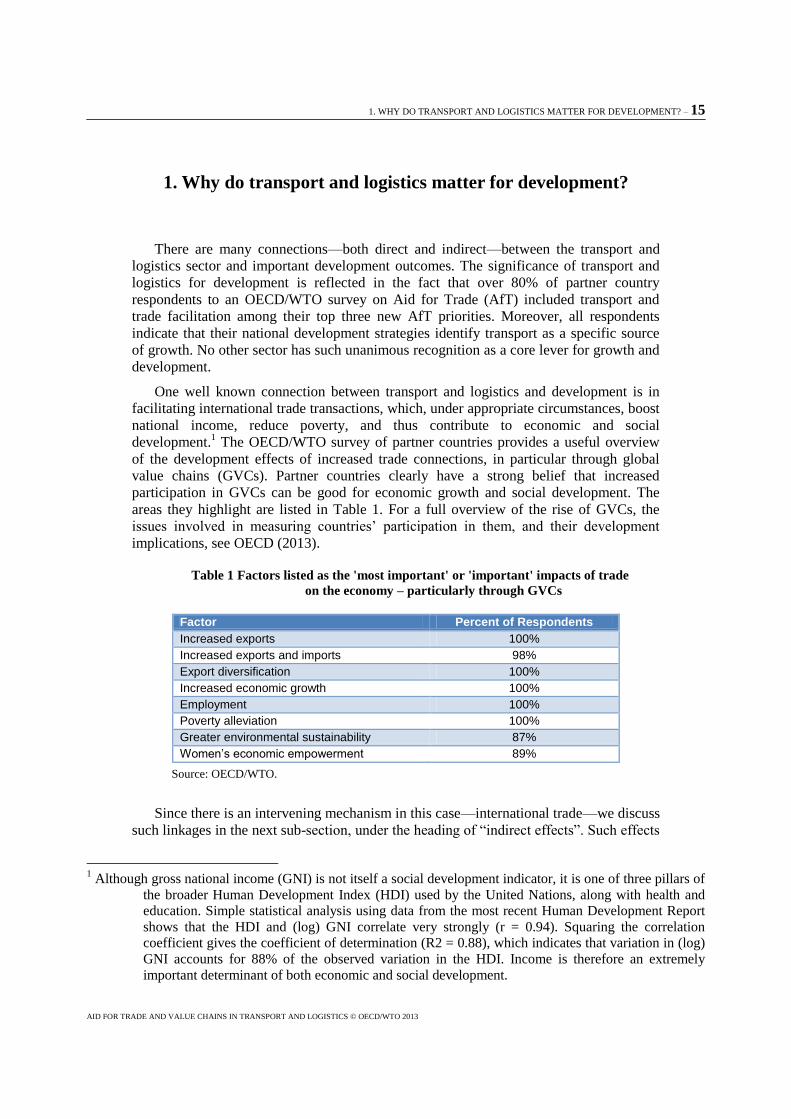
areas they highlight are listed in Table 1. For a full overview of the rise of GVCs, the
issues involved in measuring countries’ participation in them, and their development
implications, see OECD (2013).
Table 1 Factors listed as the 'most important' or 'important' impacts of trade
on the economy – particularly through GVCs
Factor Percent of Respondents
Increased exports 100%
Increased exports and imports 98%
Export diversification 100%
Increased economic growth 100%
Employment 100%
Poverty alleviation 100%
Greater environmental sustainability 87%
Women’s economic empowerment 89%
Source: OECD/WTO.
Since there is an intervening mechanism in this case—international trade—we discuss
such linkages in the next sub-section, under the heading of “indirect effects”. Such effects
1 Although gross national income (GNI) is not itself a social development indicator, it is one of three pillars of
the broader Human Development Index (HDI) used by the United Nations, along with health and
education. Simple statistical analysis using data from the most recent Human Development Report
shows that the HDI and (log) GNI correlate very strongly (r = 0.94). Squaring the correlation
coefficient gives the coefficient of determination (R2 = 0.88), which indicates that variation in (log)
GNI accounts for 88% of the observed variation in the HDI. Income is therefore an extremely
important determinant of both economic and social development.

16 – 1. WHY DO TRANSPORT AND LOGISTICS MATTER FOR DEVELOPMENT?
AID FOR TRADE AND VALUE CHAINS IN TRANSPORT AND LOGISTICS © OECD/WTO 2013
are generally well known, so we deal with them first. Less well known are the “direct
effects” of transport and logistics on development outcomes of importance. We discuss
them in the second sub-section.
Indirect impacts on development outcomes
International trade can, under the right circumstances, be an important engine of
economic growth and poverty alleviation. There is now overwhelming evidence that trade
liberalization is associated with faster productivity growth among developing country
firms (e.g., Pavcnik, 2002 for Chile). Productivity growth, in turn, is a crucial source of
economic growth and technological upgrading.
However, trade does not affect all of a country’s economic activity equally. On the
one hand, trade can cause dislocation of workers within sectors, for which appropriate
adjustment policies need to be put in place. The impact of tariff liberalization on poverty
depends to a certain extent on whether particular households tend to be net buyers or net
sellers of goods in liberalized sectors. In the former case, they tend to gain from
reductions in import protection. In the latter, they may lose. Particularly in areas such as
agricultural production the impact of trade liberalization on poverty may be ambiguous
(OECD, 2012b). However, emerging empirical evidence suggests that trade liberalization
can, in many cases, reduce poverty, particularly if the right complementary policies are
put in place (Hertel and Winters, 2005; OECD, 2012b).
On the assumption that increased trade due to broad-based liberalization can, under
the right circumstances, promote economic and social development through increased
productivity and decreased poverty, then the transport and logistics sector has a crucial
role to play in this process. Transport and logistics service providers are deeply involved
in the mechanics of international trade transactions. It is difficult for a manufacturer to
export at a competitive price or import at a competitive cost if the transport and logistics
sector is dysfunctional. High prices, poor service, and a lack of certainty in transport and
logistics translate into the effective isolation of a country from world markets. Transport
and logistics—understood as air and maritime connectivity, and logistics performance—
together seem to contribute as much to the costs of international trade as geographical
distance (Arvis et al., 2013). Similarly, OECD (2011b) finds that a one day decrease in
time spent at sea could increase trade by about 4.5%.
Of course, transport and logistics performance matters more for some parts of the
trading economy than others. Participation in global value chains (GVCs) in
manufacturing is one part of the economy that depends fundamentally on transport and
logistics for its success. Goods moving through GVCs typically cross multiple borders
during the production process of the final product. Parts and components can be
assembled in various different countries, before being brought together in a different
country for final assembly. Rather than manage inventory, many lead companies in GVCs
now build redundancies into their supply chains, which means that the same component
for the same final good can be sourced from different locations. This approach is a way of
managing the risk that comes with relying on a single component producer who might
experience production problems due to outside causes, thus holding up the entire process.
The end result is a complex network of producers and assemblers, all performing related
functions, before the final product is shipped to the consumer, again in a different
country.

1. WHY DO TRANSPORT AND LOGISTICS MATTER FOR DEVELOPMENT? – 17
AID FOR TRADE AND VALUE CHAINS IN TRANSPORT AND LOGISTICS © OECD/WTO 2013
Transport and logistics performance is also key for ensuring effective participation in
agrifood value chains. Transport and logistics costs may be less in the case of agrifood
products, which are part of simpler supply chains than manufactures, but they have a
greater proportional impact on the price of most agricultural products because of their low
value-to-weight ratio. Furthermore, perishable products suffer particularly from delays,
one of the most significant factors leading to post-harvest losses. Recent OECD research
has found that a 10% improvement in transport and trade-related infrastructure quality
can increase developing countries’ agricultural exports by 30% (OECD 2013).
The bottom line from a commercial point of view is that this kind of business model
is simply impractical without strong transport and logistics performance. GVCs need to
manage cost and risk at all points in the production process. This means that transport
costs have to be kept down, times have to be kept low, and uncertainty has to be
minimized. “New generation” trade facilitation programs, such as APEC’s Supply Chain
Connectivity Initiative, directly recognize the importance of these three objectives.
Similarly, recent research confirms that logistics performance matters more for trade
within GVCs than for other types of trade (Saslavsky and Shepherd, 2012). Using the
proportion of parts and components in total exports as a proxy for manufacturing GVC
participation, Figure 1 confirms that countries with stronger logistics performance tend to
specialize in GVC-related exports. The importance of this type of trade for development
is reflected in the fact that almost half of partner country respondents to an OECD/WTO
survey on AfT identified value chains as among their new AfT priorities.
Figure 1 Cross-country correlation between LPI scores and
proportion of parts and components in total exports
(Logistics Performance Index, ranging from 1-5 percent)
Source: Arvis et al. (2010).
In addition, transport and logistics services are themselves GVCs in many respects.
Lead firms—usually multinationals—work with a variety of local and international firms
to provide a final service to the consumer. Improving performance therefore means not
just working on individual sources of delay, cost, or uncertainty, but taking a GVC-wide
0%
5%
10%
15%
20%
25%
1 1.5 2 2.5 3 3.5 4 4.5 5
Sh
are
of
Pa
rts a
nd
Co
mp
on
en
ts in
To
tal
Ex
po
rts (
%)
LPI Score

18 – 1. WHY DO TRANSPORT AND LOGISTICS MATTER FOR DEVELOPMENT?
AID FOR TRADE AND VALUE CHAINS IN TRANSPORT AND LOGISTICS © OECD/WTO 2013
view of performance. Since transport and logistics are services GVCs, rather than the
more common manufacturing GVCs, it is important to consider the role that barriers to
trade in services can play in holding back performance. Since many services can only be
traded efficiently by establishment of the exporting company in the importing country
(GATS Mode III), restrictions on foreign direct investment (FDI), such as foreign equity
limits, also need to be part of the discussion. Indeed, respondents to the OECD/WTO
partner country survey nearly always identify FDI (98%) and local private investment
(96%) as “most important” or “important” sources of financing for their firms to connect
to regional, South-South, and global markets. As a point of comparison, only 71%
similarly identify official development assistance, and 85% cite local public investment.
From the donor perspective, however, the order is reversed: 92% of respondents to the
OECD/WTO donor questionnaire indicate that official development assistance is a “most
important” or “important” source of financing, while 79% cite FDI and 61% cite local
public investment.
The industrialization process is, of course, dynamic rather than static. As a result,
countries do not want to enter a GVC at one point and remain there for a long period.
Rather, the objective is to “move up the value chain” towards higher value added (higher
productivity) activities (e.g., Baldwin, 2011). China, for example, is well known as an
assembly point for many consumer electronics, which is a labor-intensive, relatively low
value-added activity. However, the country is increasingly moving into other parts of the
value chain, including manufacturing of important components, and even, in some cases,
design or research and development. Although such changes inevitably take place at
different paces in different countries, they provide the opportunity for sustained
productivity growth based on a GVC model, and can thus support important
industrialization and development objectives.
Again, the transport and logistics sector is key to efforts to move up the value chain.
As the manufacturing process become more complex at higher layers of a GVC, so it
becomes even more important to be able to move both inputs and outputs across borders
rapidly, at low cost, and with as little risk as possible. At the top of a GVC—the position
of the “lead firm”—it is necessary to coordinate the activities of firms at all points
throughout the chain, and manage the movement of goods and services from the various
producers to the end consumer. Such operations are only possible in an environment
where the transport and logistics sector exhibits high performance.
Just as transport and logistics performance is more important for some sectors of the
economy (e.g., manufacturing GVCs) than for others, so too is it more important for some
countries than for others. Countries that are geographically isolated—including
landlocked countries and small island developing states—depend all the more strongly on
efficient transport and logistics operations to develop linkages with world markets.
Indeed, geographically disadvantaged economies can do much to reduce their relative
isolation by focusing on policies designed to improve performance in key services sectors
like transport and logistics (Borchert et al., 2012).
Direct impacts on development outcomes
Although the indirect impacts of transport and logistics on development are more
familiar to policymakers, there are also a number of direct impacts that deserve greater
attention. The first is that an efficient transport and logistics sector is in fact key to the
achievement of important social development goals, such as the distribution of vaccines.
Many vaccines have to be moved quickly, under strict temperature controls, in order to

1. WHY DO TRANSPORT AND LOGISTICS MATTER FOR DEVELOPMENT? – 19
AID FOR TRADE AND VALUE CHAINS IN TRANSPORT AND LOGISTICS © OECD/WTO 2013
retain their efficacy. In a country where transport and logistics performance is poor, it is
therefore difficult to conduct effective vaccination programs outside major population
centers, where distances traveled are short. Preliminary econometric evidence indeed
suggests that better logistics performance is linked to higher rates of vaccination, even
after controlling for other factors, including the level of national income, the proportion
of national income spent on health, and a common measure of government effectiveness
(Pasadilla and Shepherd, 2011). Figure 2 reproduces the same basic correlation, although
without controlling for other factors. The same study finds, moreover, that the link
between logistics performance and vaccination rates is stronger in poorer countries than
in richer ones. These findings are one example of a direct way in which the transport and
logistics sector can contribute to important human development outcomes.
Figure 2 Cross-country correlation between LPI scores and
diphtheria, pertussis, and tetanus (DPT) immunization rates
(Logistics Performance Index, ranging from 1-5 percent of the population)
Source: Pasadilla and Shepherd (2011).
Similarly, greater efficiency in transport and logistics means that other socially
important goods, such as basic foodstuffs, can be moved within countries more quickly
and at lower cost. Consumers benefit by gaining access to lower cost goods.
Improvements in transport and logistics can also help producers, including agricultural
smallholders, by bringing them closer to local and regional markets. If distribution
markets work effectively, lower transport costs mean that a higher proportion of the
consumer price can be returned to the producer, thereby increasing incomes among some
of the poorest members of society, improving affordability of food, and helping address
problems of global hunger (OECD 2012b). Indeed, better functioning transport and
logistics markets can make it possible for farmers to access entirely new markets, either
in different regions, or, potentially, internationally. Recent research by Porto et al. (2011),
for example, shows that the income of smallholders in a number of African countries
could potentially be increased by improving infrastructure.
0%
10%
20%
30%
40%
50%
60%
70%
80%
90%
100%
1 1.5 2 2.5 3 3.5 4 4.5 5
DP
T I
mm
un
izati
on
Rate
(%
)
LPI Score

20 – 1. WHY DO TRANSPORT AND LOGISTICS MATTER FOR DEVELOPMENT?
AID FOR TRADE AND VALUE CHAINS IN TRANSPORT AND LOGISTICS © OECD/WTO 2013
Box 1 Logistics and the global food crisis
One way that an efficient transport and logistics sector can directly improve development outcomes is by
reducing consumer prices for essential goods, such as basic foodstuffs. In countries with poor internal
connectivity, where transport and logistics services are under-developed, and where supply chain governance is
poor, the direct and indirect costs of moving food from the farm gate to the consumer are higher than they need
be. This effect is inevitably passed on the form of higher prices. In many countries, transport and logistics costs
can be as high as 20%-60% of the price the final consumer pays. Indeed, in some circumstances, the blow can be
double: a lack of competition in transport and logistics can not only increase prices and decrease availability for
consumers, but it can also result in lower farm gate prices received by farmers, many of whom are themselves
poor.
Transport and logistics services also matter for food distribution more dynamically, in the sense that they
affect a country’s ability to respond to price shocks. Lower transport costs can lower the domestic prices of
imported goods and ensure that a greater share of the price of exported goods accrues to the producer. The effect
on price volatility is more ambiguous: although efficient transport and logistics services can increase world price
transmission to domestic markets, they can also help affected countries respond to food price peaks. By
improving the accessibility of imported grains, on which many developing countries rely heavily, and limiting
the very high product losses (up to 5% in the Middle East and North Africa according to a World Bank/FAO
assessment) linked to extremely lengthy transit times, improvements in transport and logistics can do much to
mitigate the effects of high world food prices.
Source: Arvis et al. (2012); OECD (2012b).
A third way in which efficient transport and logistics sectors contributes directly to
development outcomes is as a source of employment. Jobs growth is vital in the
developing country context, where unemployment rates can be high, and important
segments of the population can be entirely excluded from the formal labor market.
Transport and logistics operations tend to be relatively more labor intensive in developing
countries than in developed ones, due to differences in production technology. Recent
research shows that as low-income countries grow their economies towards middle-
income status, the size of the transport and logistics sector—as measured by its
contribution to GDP—tends to increase (Shepherd, 2011).2 One possible reason is that
there is increased development of specialized transport and logistics firms, which leads to
greater (low cost) outsourcing opportunities for manufacturers that previously had to
conduct such activities in-house (and at high cost). The implication of these findings is
that for the poorest developing countries, transport and logistics can—as part of a broad-
based approach to job creation—provide employment opportunities for a significant
number of people. Like vaccine distribution, access to the labor market is important from
the points of view of both economic and social development.
A fourth set of direct linkages between transport and logistics on the one hand and
development outcomes on the other are in the area of governance and anti-corruption.
Transport and logistics operators are unfortunately in a perfect position to be made
subject to a “hold up” problem in the face of (potentially) corrupt police, customs agents,
or other officials. By their very nature, operators need to confront binding constraints
2 The relationship becomes inverted at around USD 10,000 in PPP terms. After that point, an increase in per
capita income is associated with a smaller transport and logistics sector, probably because
productivity (technology) effects dominate the outsourcing effect referred to in the main text.

1. WHY DO TRANSPORT AND LOGISTICS MATTER FOR DEVELOPMENT? – 21
AID FOR TRADE AND VALUE CHAINS IN TRANSPORT AND LOGISTICS © OECD/WTO 2013
such as access to crucial facilities (roads and ports), or the completion of necessary
processes (customs formalities and other border checks). Poor governance along the
supply chain means that, in some cases, the only way to deal with binding constraints is
by making unofficial payments. Indeed, payments of “speed money” are common in
some developing countries (e.g., Olken and Barron, 2009). Shepherd (2009) shows that
less efficient official processes tend to foster a greater prevalence of speed money
payments, as operators are required to use unofficial channels to expedite their business.
The OECD/WTO private sector survey confirms that governance issues, including
unofficial payments, are a serious issue in the development of transport and logistics
value chains (see Subsection 3, Governance below).

2. MEASURING DELAYS AND THEIR IMPACTS: THE TOOLKIT – 23
AID FOR TRADE AND VALUE CHAINS IN TRANSPORT AND LOGISTICS © OECD/WTO 2013
2. Measuring delays and their impacts: The toolkit
This section examines the data currently available for policymakers to assess the
prevalence, seriousness, and sources of trade delays in their countries. Full details of
individual indicators are available in the Annex A. Indicators can be divided into two
broad groups: single country sources, i.e. those which cannot easily be compared across
countries; and cross-country sources, which are designed and implemented in a
standardized way and can more convincingly be compared from one country to another.
OECD (2012) similarly uses cross-country data as a starting point to analyze the impacts
of aid for trade on particular intermediate and final outcomes of policy interest.
There exists an extensive toolkit for policymakers to use in assessing the prevalence
and sources of supply chain impediments that increase direct and indirect costs for supply
chain participants in their countries, and which can inhibit the growth of GVCs by
making countries less competitive internationally. Of course, all of the cross-country
indicators are necessarily somewhat coarse-grained, as they sacrifice specificity in order
to retain standardization. They are not the end of an analytical process, but rather the
start. Ideally, the reform process should begin with a first level diagnostics exercise in
which broad indicators are consulted to give an idea of where the most serious problems
are. The second step is then to undertake detailed, country-specific work to uncover the
causes of those problems and develop possible remedies to improve time, cost, and
predictability of supply chain transactions. The final step is to implement the proposed
solutions on the ground, monitor progress, and make any changes necessary to ensure
maximum possible results.
At this point, an obvious question arises: what do we know about the trade impacts of
supply chain impediments? Recent academic research provides useful clues as to the
economic effects that delays can have. Hummels (2001) is one of the first papers to
examine the impact of time on trade flows. Using data for US imports, he finds that
reducing international shipping times by one day is associated with an increase in trade of
0.8%. The same reduction also increases the probability that the US will source imports
from a country by 1%-1.5%. To show the importance of delays caused by international
transport, Hummels (2001) estimates that the increasing use of faster transport methods
over recent decades—which reduces trade times—boosted trade by an amount equivalent
to a tariff reduction from 32% to 9% over the 1950-1998 period.
One limitation of the Hummels (2001) study is that it only considers international
transport times. It does not consider other factors that contribute to trade times, such as
internal transit, document preparation, and customs and border formalities. Djankov et al.
(2010) use Doing Business data on export times—discussed in detail in the Annex A—to
examine the impact of those factors on trade. Their results are similar to those of
Hummels (2001) in terms of quantitative magnitude: a one day reduction in pre-shipment
delays is associated with a trade increase of about 1%. (Figure 3 illustrates this negative
correlation.) In effect, countries with long export times are isolating themselves from
world markets: Djankov et al. (2010) estimate that an additional day’s delay in an average
country is equivalent to moving it away from its trading partners by about 70km. The
implication is that trade delays are particularly important for countries that already suffer
from geographic disadvantages, such as being landlocked, or being small island

24 – 2. MEASURING DELAYS AND THEIR IMPACTS: THE TOOLKIT
AID FOR TRADE AND VALUE CHAINS IN TRANSPORT AND LOGISTICS © OECD/WTO 2013
developing states: they can reduce the effects of geographical isolation by improving their
delay performance prior to shipment, including by improving border processes.
Interestingly, Djankov et al. (2010) find that pre-shipment delays matter more for some
products that for others: specifically, time sensitive products—including some
manufactured goods and perishable agricultural products—benefit more from improved
performance than others.
Figure 3 Cross-country correlation between ‘doing business’ export times and
the total value of exports to the rest of the world in 2005
(in logarithms)
Source: WITS-Comtrade for exports; Doing Business for export times.
Recent work by the OECD (OECD, 2013c) goes in the same direction as this
emerging body of evidence. Using data for 133 countries, they find that trade facilitation
performance (in the sense of streamlining border procedures) accounts for around 14% of
the observed variance in bilateral trade costs. The analysis also shows that trade
facilitation measures not only increase imports but also boost exports, in particular
through better access to inputs for production and greater participation in global and
regional value chains. Border process improvements through trade facilitation affect trade
costs, which in turn affect the pattern of bilateral trade flows. Arvis et al. (2013) also
provide econometric evidence that goes in the same direction for a set of 178 countries.
Martincus et al. (2013) focus specifically on the case of customs, but use firm-level
export data from Uruguay, rather than cross-country data as in all the other papers. They
find that customs delays on their own—without considering other aspects of transport,
logistics, and trade facilitation—can be responsible for significant trade reductions.
Concretely, an extra day spent in customs translates into a 2.8% decline in the growth rate
of exports.
It is thus well-established that export delays—from a variety of sources—can have
serious trade-inhibiting effects. However, their trade impacts are also felt in other ways
that are particularly important for developing countries. For example, Dennis and
0
5
10
15
20
25
30
35
0 0.5 1 1.5 2 2.5 3 3.5 4 4.5 5
Lo
g(E
xp
ort
Valu
e)
Log(Export Time)

2. MEASURING DELAYS AND THEIR IMPACTS: THE TOOLKIT – 25
AID FOR TRADE AND VALUE CHAINS IN TRANSPORT AND LOGISTICS © OECD/WTO 2013
Shepherd (2011) show that pre-shipment delays are associated with a lower degree of
export diversification in developing countries, as evidenced by the downward sloping line
of best fit in Figure 4. Export diversification is a serious issue for many developing
countries that tend to concentrate their exports on a few well-established products, and
which therefore see it as an important development aim to develop broader export
bundles. The mechanism in this case is that higher trade costs—to which delays
contribute—mean that only the most productive firms can export, and since they make a
limited range of products, the country’s export bundle becomes correspondingly
concentrated. Shepherd (2010) shows that a similar mechanism is at work in the area of
geographical diversification of developing country exports. Exporting to a range of
markets is an important way of dealing with the risk of a foreign economic slowdown,
with a consequent drop-off in demand for exports. Trade costs—including those that are
related to delays—again mean that only some markets can be profitably accessed, with a
corresponding contraction in the range of countries used as export destinations. Finally,
OECD research shows that complex and non-transparent border procedures and
regulations, as well as weak law enforcement at the border, are significant factors
encouraging informal cross-border trade, with negative economic and developmental
consequences for concerned countries (OECD 2008).
Figure 4 Cross-country correlation between ‘doing business’ export times and
number of CN 8-digit product lines exported to the EU in 2005
(in logarithms)
Source: Dennis and Shepherd (2011).
0
1
2
3
4
5
6
7
8
9
10
0 0.5 1 1.5 2 2.5 3 3.5 4 4.5 5
Lo
g(N
um
be
r o
f E
xp
ort
ed
Pro
du
cts
)
Log(Doing Business Export Time)


3. EMERGING TRENDS: WHERE AND WHY IS PROGRESS BEING MADE? – 27
AID FOR TRADE AND VALUE CHAINS IN TRANSPORT AND LOGISTICS © OECD/WTO 2013
3. Emerging trends: Where and why is progress being made?
The previous sections have highlighted the importance of transport and logistics
services for development and participation in GVCs, as well as the tools available to
measure delays and impediments that inhibit development of the transport and logistics
value chain itself. In this section, we examine recent data on performance, using
responses from an OECD/WTO private sector survey on value chains that highlight the
constraints currently identified by firms as the most important, the factors that most
influence sourcing decisions in their value chain, and the most typical difficulties faced in
providing transport and logistics services in developing countries. In transport and
logistics, the survey involved 96 respondents from a variety of developing and developed
countries. Although it is therefore a small sample, and results need to be treated with
caution, it provides a useful indication of private sector sentiment in the transport and
logistics value chain.
In addition, we look at recent trends contained in data from the OECD Trade
Facilitation Indicators, and the World Bank’s LPI and Doing Business projects. The first
dataset gives us information on general trade facilitation performance, the second dataset
presents areas that the private sector considers to have improved between surveys (2009-
2012), while the last source allows us to track changes in red tape burdens affecting
transport and logistics transactions that facilitate international trade.
Overall performance
There is no question in the OECD/WTO survey dealing with overall transport and
logistics performance, so we turn to the World Bank data as a starting point. As discussed
in the Annex A, the International LPI provides an overall measure of transport and
logistics performance in up to 155 countries around the globe. Since the methodology is
basically unchanged between reports, a comparison of scores in 2007, 2010, and 2012 is
therefore one way of identifying country groups and regions that have seen significant
progress over time, as well as those where additional challenges remain.
We first break out the data by income group, taking simple averages (Figure 5). For
ease of presentation, we consider OECD and non-OECD high income countries as a
single group. For the developing countries—which we consider to be all but the high
income countries—there is clear improvement in all cases between 2007 and 2010. In the
two middle income groups, there is also a small improvement between 2010 and 2012,
but the difference in average scores is very small. Low income countries, by contrast,
exhibit a small lowering of their average score between 2010 and 2012, but the difference
is again very small. Overall, these results are indicative of substantial improvements at
least in the early years of the sample, with a possible slowing down of that progress
towards the end. One important point of comparison is, of course, with the high income
group, where performance is relatively steady over time. One of the most notable points
emerging from Figure 5 is not so much the change in performance of the developing
countries, but the continued large gap between the high income countries and the other
groups in terms of overall logistics performance. This “logistics gap” (Arvis et al., 2012)

28 – 3. EMERGING TRENDS: WHERE AND WHY IS PROGRESS BEING MADE?
AID FOR TRADE AND VALUE CHAINS IN TRANSPORT AND LOGISTICS © OECD/WTO 2013
suggests that expansion of the transport and logistics GVC in developing countries,
including to support integration into other GVCs, still faces very significant obstacles.
Figure 5 LPI scores by income group
(Logistics Performance Index ranging from 1-5, 2007-2012)
Source: LPI database.
The second way in which we can divide up the data is by region, again taking simple
averages. These groupings exclude high income countries, and therefore are limited—in
our definition—to developing countries only. Results are in Figure 6. East Asia and the
Pacific consistently has the highest average LPI score of any developing region.
Importantly, all developing regions exhibit evidence of performance improvements
between 2007 and 2012, although in some cases there is slight backsliding in the latter
part of the sample. Calculating improvement rates between 2007 and 2012 identifies two
groups of countries. The first group—South Asia, Europe and Central Asia, and the
Middle East and North Africa—exhibit fast rates of improvement, between 8% and 12%
over the five year sample period. The second group—Latin America and the Caribbean,
Sub-Saharan Africa, and East Asia and the Pacific—has experienced slower growth in
their LPI scores, of between 4% and 5% over the same period.
Figure 6 LPI scores by region
(Logistics Performance Index ranging from 1-5, 2007-2012)
Source: LPI database.
1
1.5
2
2.5
3
3.5
4
4.5
5
High income Upper middle income Lower middle income Low income
LP
I S
co
re
2007 2010 2012
1
1.5
2
2.5
3
3.5
4
4.5
5
East Asia & Pacific Europe & CentralAsia
Latin America &Caribbean
Middle East &North Africa
South Asia Sub-SaharanAfrica
LP
I S
co
re
2007 2010 2012

3. EMERGING TRENDS: WHERE AND WHY IS PROGRESS BEING MADE? – 29
AID FOR TRADE AND VALUE CHAINS IN TRANSPORT AND LOGISTICS © OECD/WTO 2013
Findings from the regional breakdown suggest two policy conclusions. The first is
that there is an important stock of developing country examples where logistics
performance is relatively strong compared to the rest of the group. It is no coincidence
that it is East Asia and the Pacific—the area where manufacturing GVCs are best
developed—that has the highest average LPI scores. There is thus considerable South-
South knowledge sharing that can take place in the area of transport and logistics, and the
potential for improvement in other regions is significant. Second, the data show that some
developing regions are experiencing rapid improvements in overall performance. In some
cases, such as South Asia, that improvement is taking place from a low baseline.
However, the rate of change demonstrates that some developing countries are succeeding
in developing and implementing reforms that are very positively received by private
sector operators on the ground. These reforms can be expected to boost development of
the transport and logistics GVC in those regions, and by extension, make the business
environment more favorable for manufacturing GVCs. Again, there is significant
potential for South-South exchanges to disseminate these successful examples of reform.
Box 2 The LPI and logistics and transport reforms in Indonesia
One function of a globally visible index like the LPI is to raise national awareness of transport and logistics
issues, and provide momentum for on-the-ground reforms. Indonesia provides an interesting example of this
process. Shortly after publication of the 2007 LPI report, government officials launched a wide-reaching public-
private dialogue on transport and logistics issues in the country. This process led to the preparation of an action
plan focusing on trade costs in its major ports, and the particular challenges faced by a country made up of over
10,000 islands. The World Bank became involved in 2008, working with the government to develop strategies to
improve operations at the country’s largest port.
Of course, the LPI on its own cannot provide the detailed information policymakers need to design detailed
and complex reforms. Rather, it highlights broad issues that can then be investigated further using other
complementary tools, and it can then also serve a monitoring function as a broad indicator of progress. In the
Indonesian case, the government took a number of steps to improve port performance, such as offering 24-hour
service throughout the week. Although a number of issues still remain to be resolved, these initial reforms are
perhaps starting to bear fruit: the country’s LPI rank increased from 75th
to 59th
between the 2010 and 2012
reports.
Source: Arvis et al. (2012).
Of course, the comparison of overall LPI scores can only give us a general indication
of the degree to which progress is taking place on the ground. More useful for
policymakers is a consideration of individual areas in which performance improvements
have taken place, and those in which progress has been slower. The Domestic LPI
contains such information, highlighting particular areas where 2012 survey respondents
indicated the degree of improvement since 2009 (the time of the previous survey). As in
Arvis et al. (2012), we present the data by indicating the percentage of respondents
indicating that a particular area is “improved” or “much improved” relative to the
benchmark. (For data on time and cost, see Subsection 3 on red tape, where we make
extensive use of the Doing Business data on these points.) In the specific area of customs
and other border procedures the OECD Trade Facilitation Indicators (TFIs) offer the most
30 – 3. EMERGING TRENDS: WHERE AND WHY IS PROGRESS BEING MADE?
AID FOR TRADE AND VALUE CHAINS IN TRANSPORT AND LOGISTICS © OECD/WTO 2013
detailed overview of performance by various countries and regions, highlighting the
economic and trade impact of specific trade facilitation measures (OECD 2013c).
Customs and other border procedures
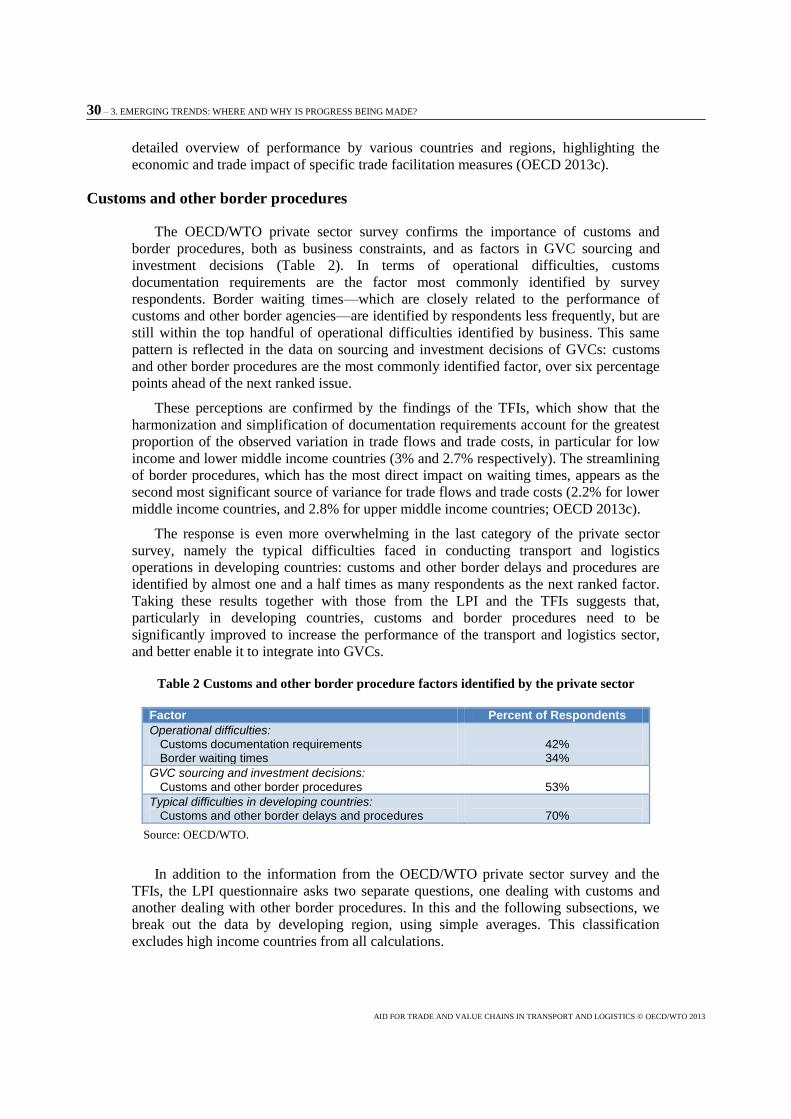
The OECD/WTO private sector survey confirms the importance of customs and
border procedures, both as business constraints, and as factors in GVC sourcing and
investment decisions (Table 2). In terms of operational difficulties, customs
documentation requirements are the factor most commonly identified by survey
respondents. Border waiting times—which are closely related to the performance of
customs and other border agencies—are identified by respondents less frequently, but are
still within the top handful of operational difficulties identified by business. This same
pattern is reflected in the data on sourcing and investment decisions of GVCs: customs
and other border procedures are the most commonly identified factor, over six percentage
points ahead of the next ranked issue.
These perceptions are confirmed by the findings of the TFIs, which show that the
harmonization and simplification of documentation requirements account for the greatest
proportion of the observed variation in trade flows and trade costs, in particular for low
income and lower middle income countries (3% and 2.7% respectively). The streamlining
of border procedures, which has the most direct impact on waiting times, appears as the
second most significant source of variance for trade flows and trade costs (2.2% for lower
middle income countries, and 2.8% for upper middle income countries; OECD 2013c).
The response is even more overwhelming in the last category of the private sector
survey, namely the typical difficulties faced in conducting transport and logistics
operations in developing countries: customs and other border delays and procedures are
identified by almost one and a half times as many respondents as the next ranked factor.
Taking these results together with those from the LPI and the TFIs suggests that,
particularly in developing countries, customs and border procedures need to be
significantly improved to increase the performance of the transport and logistics sector,
and better enable it to integrate into GVCs.
Table 2 Customs and other border procedure factors identified by the private sector
Factor Percent of Respondents
Operational difficulties: Customs documentation requirements Border waiting times
42% 34%
GVC sourcing and investment decisions:
Customs and other border procedures
53%
Typical difficulties in developing countries: Customs and other border delays and procedures
70%
Source: OECD/WTO.
In addition to the information from the OECD/WTO private sector survey and the
TFIs, the LPI questionnaire asks two separate questions, one dealing with customs and
another dealing with other border procedures. In this and the following subsections, we
break out the data by developing region, using simple averages. This classification
excludes high income countries from all calculations.

3. EMERGING TRENDS: WHERE AND WHY IS PROGRESS BEING MADE? – 31
AID FOR TRADE AND VALUE CHAINS IN TRANSPORT AND LOGISTICS © OECD/WTO 2013
The LPI data show that, in all regions, improvements in customs are much more
significant than improvements in other border procedures (Figure 7). Indeed, Arvis et al.
(2012) use results from the LPI survey to show that the private sector’s level of
satisfaction is generally higher with customs than with other agencies involved in the
border clearance process. In part, this might reflect the process of convergence in customs
procedures that has been taking place around the globe, fostered by instruments such as
the Revised Kyoto Convention and the capacity building and technical assistance efforts
of the WCO. The World Bank, regional development banks, and bilateral donors have
also played an active role in helping developing countries improve customs capacity, and,
in some cases, undertake important reforms such as streamlining procedures and
introducing automation (OECD, Forthcoming). By contrast, assistance efforts tend to be
more dispersed for other border agencies, such as those dealing with health requirements
and sanitary and phyto-sanitary measures (SPS). From a transport and logistics point of
view, however, it is the full process of border clearance that matters: delays or uncertainty
that intervene at any point have the potential to hold back development of the industry,
and pose problems for GVCs in other sectors, like manufacturing (OECD 2013d). Health
and SPS issues are a particular problem for emerging agrifood GVCs, which can be
important for some lower income developing countries without an established
manufacturing base but with comparative advantage in some non-traditional agricultural
sectors, such as horticultural goods or fresh flowers (OECD 2013a).
The second point to note from Figure 7 is that within the developing country group,
improvements are more homogeneous in customs than in other border procedures. In the
latter case, there is a significant gap between South Asia—where improvements are
relatively prevalent—and Sub-Saharan Africa, where less than 30% of survey
respondents report that the situation has significantly improved in the last three years.
Figure 7 LPI survey respondents (2012) indicating that customs and other border procedures
that have 'improved' or been 'much improved' in their country relative to 2009, by region
Source: LPI database.
0%
10%
20%
30%
40%
50%
60%
East Asia &Pacific
Europe &Central Asia
Latin America &Caribbean
Middle East &North Africa
South Asia Sub-SaharanAfrica
Perc
en
t o
f R
esp
on
den
ts
Customs Other Border Procedures

32 – 3. EMERGING TRENDS: WHERE AND WHY IS PROGRESS BEING MADE?
AID FOR TRADE AND VALUE CHAINS IN TRANSPORT AND LOGISTICS © OECD/WTO 2013
Box 3 World Customs Organization-led customs reform
In partnership with bilateral donors and multilateral organizations—such as UNCTAD, which developed the
Automated System for Customs Data (ASYCUDA)—the World Customs Organization (WCO) is a leader in
providing capacity building and technical assistance to customs agencies in a variety of developing countries.
Upgrading performance in the context of 21st century customs is a complex operation, involving a number of
different dimensions. On the one hand, WCO’s development of a standardized methodology for Time Release
Studies (TRS—see Annex A), and its ability to engage with individual countries to implement TRS on the
ground, provides a powerful diagnostic tool. In addition, specific programs develop capacity in customs agencies
in a variety of areas, such as management and leadership development, enforcement, and development of
coordinated border management.
An example of the WCO’s approach is in East and Southern Africa, under a project financed by the Finnish
government. The overall objective of the project is to have customs administrations in the region which is
efficiently managed, have good governance and modern working methods, and provide smooth trade facilitation
and strict law enforcement. To be implemented over the 2011-2014 period, the project aims at the following
outputs, in addition to specific objectives in Kenya and Namibia:
Customs’ leadership and management is committed to continuous improvement and modernization of
as well as further capacity building in their administration, and has improved skills in strategic
planning, in change management, and in the management of human and financial resources.
Customs administrations have the necessary hardware and software, as well as related knowledge and
skills, to implement simplified and improved customs procedures with modern customs operational
techniques (National Customs Enforcement Network; intelligence and risk management; information
technology, including interconnectivity; post-clearance audit; and effective anti-smuggling).
Customs administrations and other border agencies are committed to good cooperation and
coordinated border management practices and customs agencies follow simplified and improved
customs procedures (Single Window; One Stop Border Post; and the WCO Data Model).
Increased and better cooperation and coordination of policy and procedures among and between the
regional customs services.
Source: Based on material provided by the WCO.
Transport and ICT infrastructure
According to the OECD/WTO private sector survey data (Table 3), infrastructure
remains a serious constraint in many developing countries, a finding which is in line with
Arvis et al. (2012) and OECD (2013a). In terms of national supply-side constraints that
affect the ability to enter, establish, or move up transport and logistics value chains,
transport infrastructure is cited by nearly half of all respondents, which is more than any
other factor. Similarly, in the partner country and donor surveys, inadequate domestic
infrastructure is the most commonly cited obstacle to greater participation of national
firms in GVCs. OECD (2011c) finds that it is more the availability rather than the quality
of transport infrastructure that constrains the trade performance of developing countries.
By contrast, ICT infrastructure is listed by only 13% of private sector respondents, which
places it among the five least cited factors. In the category of operational difficulties,
inadequate trade and transport infrastructure is the third most commonly recognized
problem among private sector survey respondents. By contrast, inadequate ICT
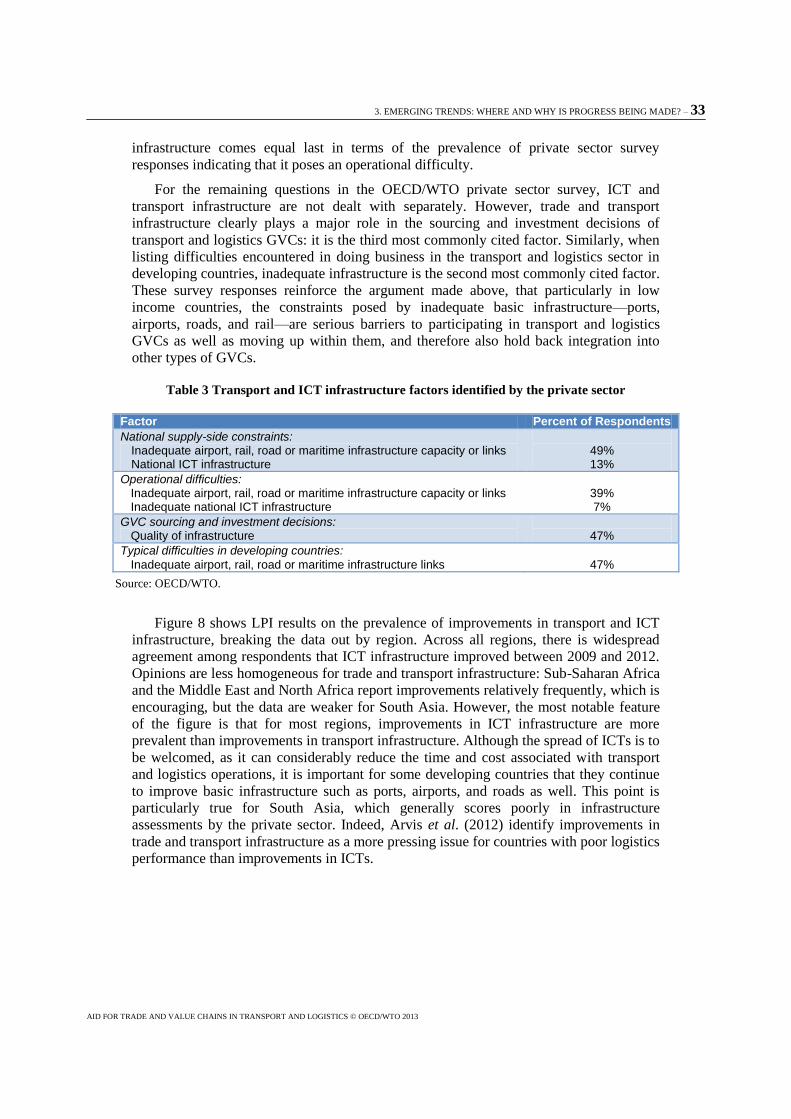
3. EMERGING TRENDS: WHERE AND WHY IS PROGRESS BEING MADE? – 33
AID FOR TRADE AND VALUE CHAINS IN TRANSPORT AND LOGISTICS © OECD/WTO 2013
infrastructure comes equal last in terms of the prevalence of private sector survey
responses indicating that it poses an operational difficulty.
For the remaining questions in the OECD/WTO private sector survey, ICT and
transport infrastructure are not dealt with separately. However, trade and transport
infrastructure clearly plays a major role in the sourcing and investment decisions of
transport and logistics GVCs: it is the third most commonly cited factor. Similarly, when
listing difficulties encountered in doing business in the transport and logistics sector in
developing countries, inadequate infrastructure is the second most commonly cited factor.
These survey responses reinforce the argument made above, that particularly in low
income countries, the constraints posed by inadequate basic infrastructure—ports,
airports, roads, and rail—are serious barriers to participating in transport and logistics
GVCs as well as moving up within them, and therefore also hold back integration into
other types of GVCs.
Table 3 Transport and ICT infrastructure factors identified by the private sector
Factor Percent of Respondents
National supply-side constraints: Inadequate airport, rail, road or maritime infrastructure capacity or links National ICT infrastructure
49% 13%
Operational difficulties: Inadequate airport, rail, road or maritime infrastructure capacity or links Inadequate national ICT infrastructure
39% 7%
GVC sourcing and investment decisions: Quality of infrastructure
47%
Typical difficulties in developing countries:
Inadequate airport, rail, road or maritime infrastructure links
47%
Source: OECD/WTO.
Figure 8 shows LPI results on the prevalence of improvements in transport and ICT
infrastructure, breaking the data out by region. Across all regions, there is widespread
agreement among respondents that ICT infrastructure improved between 2009 and 2012.
Opinions are less homogeneous for trade and transport infrastructure: Sub-Saharan Africa
and the Middle East and North Africa report improvements relatively frequently, which is
encouraging, but the data are weaker for South Asia. However, the most notable feature
of the figure is that for most regions, improvements in ICT infrastructure are more
prevalent than improvements in transport infrastructure. Although the spread of ICTs is to
be welcomed, as it can considerably reduce the time and cost associated with transport
and logistics operations, it is important for some developing countries that they continue
to improve basic infrastructure such as ports, airports, and roads as well. This point is
particularly true for South Asia, which generally scores poorly in infrastructure
assessments by the private sector. Indeed, Arvis et al. (2012) identify improvements in
trade and transport infrastructure as a more pressing issue for countries with poor logistics
performance than improvements in ICTs.

34 – 3. EMERGING TRENDS: WHERE AND WHY IS PROGRESS BEING MADE?
AID FOR TRADE AND VALUE CHAINS IN TRANSPORT AND LOGISTICS © OECD/WTO 2013
Figure 8 LPI survey respondents (2012) indicating that transport and ICT infrastructure has
'improved' or been 'much improved' in their country relative to 2009, by region
Source: LPI database.
Private services and service providers
Improving the performance of the transport and logistics sector is not just a public
sector agenda. Private sector development is also key. The OECD/WTO private sector
survey asks three questions that are relevant to a consideration of private sector dynamics
in the sector (Table 4). Among the national supply-side constraints that might affect a
company’s ability to enter, establish, or move up a transport and logistics value chain are
three that are related to private sector performance: 24% of respondents indicate that
restrictive access practices for core infrastructure represents such a constraint; the same is
true for 23% of respondents in the case of market power of existing companies; and 10%
of respondents state that transport service monopolies represent a national supply-side
constraint. Monopolies are an important issue because they can prevent the benefits of
positive policy changes—such as red tape reductions—being passed on fully to
consumers and firms. Less than competitive markets, even if not full monopolies, can
pose serious difficulties when it comes to implementing change on the ground.
The first two factors identified in the OECD/WTO private sector survey can be
considered to be at moderate levels of prevalence compared with other factors, and the
third is relatively uncommonly cited. Together, these data demonstrate that private sector
development is, in certain circumstances, an important factor in the ability of firms to
enter and move up transport and logistics value chains. Of course, the significance of the
three listed factors is likely to vary greatly from country to country, so the fact that the
survey is based on a small sample means that results should be interpreted cautiously.
Table 4 Factors listed as national supply-side constraints by the private sector
in entering, establishing, or moving up GVCs
Factor Percent of Respondents
National supply-side constraints: Restrictive practices governing access to airport, rail, road, or maritime infrastructure Market power of existing companies Transport service monopolies
24% 23% 10%
Source: OECD/WTO.
0%
10%
20%
30%
40%
50%
60%
70%
80%
East Asia &Pacific
Europe & CentralAsia
Latin America &Caribbean
Middle East &North Africa
South Asia Sub-SaharanAfrica
Perc
en
t o
f R
esp
on
den
ts
Trade and Transport Infrastructure ICT Infrastructure

3. EMERGING TRENDS: WHERE AND WHY IS PROGRESS BEING MADE? – 35
AID FOR TRADE AND VALUE CHAINS IN TRANSPORT AND LOGISTICS © OECD/WTO 2013
The Domestic LPI takes a different approach from the OECD/WTO private sector
survey. It provides data on the prevalence of improvements in the quality of private
logistics service providers. These data are subject to caution, because the survey
respondents are themselves private logistics service providers, which means that their
responses may well not be objective indicators of the reality on the ground. Nonetheless,
the data are useful for their indicative value.
Figure 9 presents results by region. There is strong evidence of improvement across
all regions, although it is less prevalent in South Asia than elsewhere. These data
therefore tend to suggest that the aspects of the transport and logistics sector related to
private sector development and capacity building may be benefitting from increased
policy attention in a variety of countries. Aid programs aimed at building productive
capacity and improving the business environment may also be bearing fruit, although a
more detailed analysis would be required before this question could be answered
definitively. It is encouraging to see robust evidence of improvement in Sub-Saharan
Africa, which is an important partner region.
Figure 9 LPI survey respondents (2012) indicating that the quality of private logistics services
is 'improved' or 'much improved' in their country relative to 2009, by region
Source: LPI database.
Box 4 Facilitating cross-border trucking services
One of the priorities of the International Road Transport Union (IRU) is the promotion of trade and road
transport facilitation. A number of United Nations instruments play a key role in this area, but one is particularly
important: the Customs Convention on the International Transport of Goods under Cover of TIR Carnets (TIR
Convention). The agreement provides a key mechanism for ensuring the efficient passage of goods by road, and
is thus particularly important for landlocked countries that rely heavily on road transport and transit
arrangements through third countries.
In general terms, the TIR Convention establishes the only global customs transit regime allowing goods to
be moved from the place of loading to the destination in secured load compartments approved for transport under
customs seals. Goods moved under cover of TIR Carnets are exempted from payment of import or export taxes
and duties during their transport from the loading place until the destination, through multiple border crossings.
This is thanks to the international financial guarantee provided to all participating customs authorities by the
international chain of guarantee.
0%
10%
20%
30%
40%
50%
60%
70%
80%
90%
East Asia &Pacific
Europe &Central Asia
Latin America& Caribbean
Middle East &North Africa
South Asia Sub-SaharanAfrica
Perc
en
t o
f R
esp
on
den
ts
Region

36 – 3. EMERGING TRENDS: WHERE AND WHY IS PROGRESS BEING MADE?
AID FOR TRADE AND VALUE CHAINS IN TRANSPORT AND LOGISTICS © OECD/WTO 2013
The TIR Convention currently counts 68 Contracting Parties, and is effectively implemented in 57
countries. It allows 3.2 million transports per year, by 40,000 authorized transport companies through the use of
a single customs transit document, the TIR Carnet. The carnet represents both the customs transit declaration and
the evidence of the international financial guarantee provided through it. To facilitate harmonized
implementation of the TIR system, the IRU, in partnership with the WCO, has developed a TIR Distance
Learning Package, which is available free of charge for customs officers in a variety of international languages.
Source: Based on material provided by the IRU.
Logistics regulation and the business environment
Regulation of the transport and logistics sector, and the quality of the business
environment more generally, can be crucial factors in the development and expansion of
GVCs. The OECD/WTO private sector survey contains a range of detailed questions
covering these areas (Table 5). In terms of national supply-side constraints that inhibit a
firm’s ability to enter or move up a transport and logistics GVC, the most commonly
cited factor is a lack of transparency in the regulatory environment, followed by the
general business environment. That these factors are considerably more often cited than
more detailed regulatory issues highlights the problems that uncertainty poses for GVCs:
adapting a business model to a particular regulatory stance, even a restrictive one, is often
much simpler than dealing with the risk created by regulatory uncertainty. This point is
borne out by the ranking of operational difficulties faced by transport and logistics
operators: the main regulatory problem is again a lack of transparency, which leads to
uncertainty, rather than issues such as licensing requirements or transit rules.
Among the factors influencing GVC sourcing and investment decisions, the general
business environment is cited by nearly 40% of respondents as being important, which
places it among the leading issues confronted by GVCs in this area. Interestingly, when
the focus moves to the operational difficulties typically faced in developing countries,
regulatory issues such as visa rules and licensing requirements receive greater
prominence than in the other questions. However, the general business environment and
the possibility of a lack of regulatory transparency are not included in the list of possible
responses for this survey question, so it would be inappropriate to conclude that these
issues are necessarily overshadowed by others in the developing country context. Indeed,
regulatory transparency and the general business environment are typically areas that
require extensive upgrading in many developing countries. This finding is confirmed by
the results of the TFIs analysis, which show that transparency and the availability of trade
information are essential determinants of the level of trade flows to and from developing
countries (OECD 2013c). Unless transport and logistics GVCs can limit the uncertainty
that poor performance in these areas brings with it, they may decide not to enter a
particular market at all, or to serve it only peripherally.
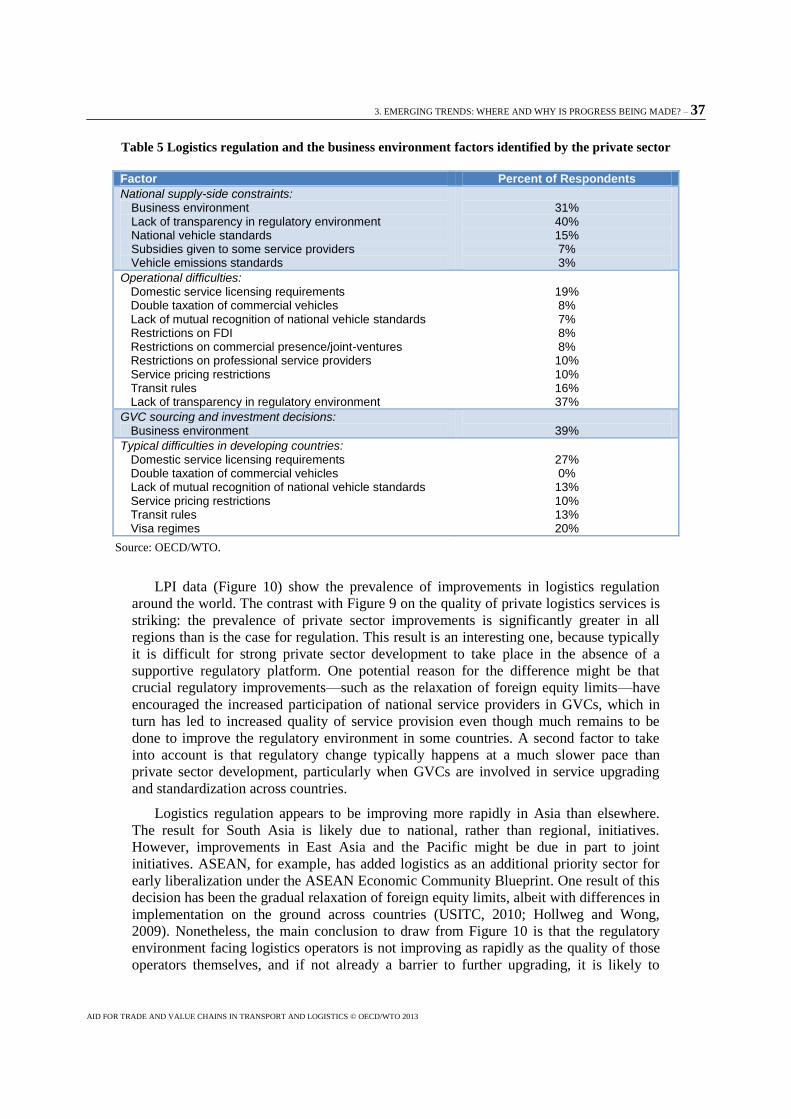
3. EMERGING TRENDS: WHERE AND WHY IS PROGRESS BEING MADE? – 37
AID FOR TRADE AND VALUE CHAINS IN TRANSPORT AND LOGISTICS © OECD/WTO 2013
Table 5 Logistics regulation and the business environment factors identified by the private sector
Factor Percent of Respondents
National supply-side constraints: Business environment Lack of transparency in regulatory environment National vehicle standards Subsidies given to some service providers Vehicle emissions standards
31% 40% 15% 7% 3%
Operational difficulties: Domestic service licensing requirements Double taxation of commercial vehicles Lack of mutual recognition of national vehicle standards Restrictions on FDI Restrictions on commercial presence/joint-ventures Restrictions on professional service providers Service pricing restrictions Transit rules Lack of transparency in regulatory environment
19% 8% 7% 8% 8%
10% 10% 16% 37%
GVC sourcing and investment decisions: Business environment
39%
Typical difficulties in developing countries: Domestic service licensing requirements Double taxation of commercial vehicles Lack of mutual recognition of national vehicle standards Service pricing restrictions Transit rules Visa regimes
27% 0%
13% 10% 13% 20%
Source: OECD/WTO.
LPI data (Figure 10) show the prevalence of improvements in logistics regulation
around the world. The contrast with Figure 9 on the quality of private logistics services is
striking: the prevalence of private sector improvements is significantly greater in all
regions than is the case for regulation. This result is an interesting one, because typically
it is difficult for strong private sector development to take place in the absence of a
supportive regulatory platform. One potential reason for the difference might be that
crucial regulatory improvements—such as the relaxation of foreign equity limits—have
encouraged the increased participation of national service providers in GVCs, which in
turn has led to increased quality of service provision even though much remains to be
done to improve the regulatory environment in some countries. A second factor to take
into account is that regulatory change typically happens at a much slower pace than
private sector development, particularly when GVCs are involved in service upgrading
and standardization across countries.
Logistics regulation appears to be improving more rapidly in Asia than elsewhere.
The result for South Asia is likely due to national, rather than regional, initiatives.
However, improvements in East Asia and the Pacific might be due in part to joint
initiatives. ASEAN, for example, has added logistics as an additional priority sector for
early liberalization under the ASEAN Economic Community Blueprint. One result of this
decision has been the gradual relaxation of foreign equity limits, albeit with differences in
implementation on the ground across countries (USITC, 2010; Hollweg and Wong,
2009). Nonetheless, the main conclusion to draw from Figure 10 is that the regulatory
environment facing logistics operators is not improving as rapidly as the quality of those
operators themselves, and if not already a barrier to further upgrading, it is likely to

38 – 3. EMERGING TRENDS: WHERE AND WHY IS PROGRESS BEING MADE?
AID FOR TRADE AND VALUE CHAINS IN TRANSPORT AND LOGISTICS © OECD/WTO 2013
become such in the near future. Regulatory reform in the transport and logistics sector
could therefore be an important way of encouraging the growth of GVCs in this area.
Figure 10 LPI survey respondents (2012) indicating that logistics regulation is
'improved' or 'much improved' in their country relative to 2009, by region
Source: LPI database.
Governance
In the transport and logistics context, governance mainly refers to corrupt practices
that interfere with supply chain operations. Table 6 presents information from the
OECD/WTO private sector survey. Four areas include questions related to supply chain
governance. 29% of respondents indicate that corrupt practices represent a constraint that
affects their ability to enter or move up a transport and logistics value chain. This number
represents a moderately high number of responses, which suggests—in line with the LPI
results (below)—that supply chain governance continues to be a serious issue in many
countries. Moreover, these responses highlight that it is not just supply chain performance
that is affected by informal practices, but the ability of firms to participate in transport
and logistics GVCs. Similar numbers of respondents—between 30% and 40%—identify
informal practices as either an operational difficulty they face in their own country, or a
typical difficulty encountered in developing countries. In both cases, the response rate is
relatively high compared with other possible factors.
Table 6 Governance factors identified by the private sector
Governance factors Percent of Respondents
National supply-side constraints: Informal controls and corrupt practices
29%
Operational difficulties: Informal or corrupt practices
37%
Typical difficulties in developing countries: Informal practices and payment requests
33%
Source: OECD/WTO.
Figure 11 shows the prevalence of governance improvements affecting the transport
and logistics value chain, based on data from the Domestic LPI. The most striking feature
0%
10%
20%
30%
40%
50%
60%
East Asia &Pacific
Europe &Central Asia
Latin America &Caribbean
Middle East &North Africa
South Asia Sub-SaharanAfrica
Perc
en
t o
f R
esp
on
den
ts
Region
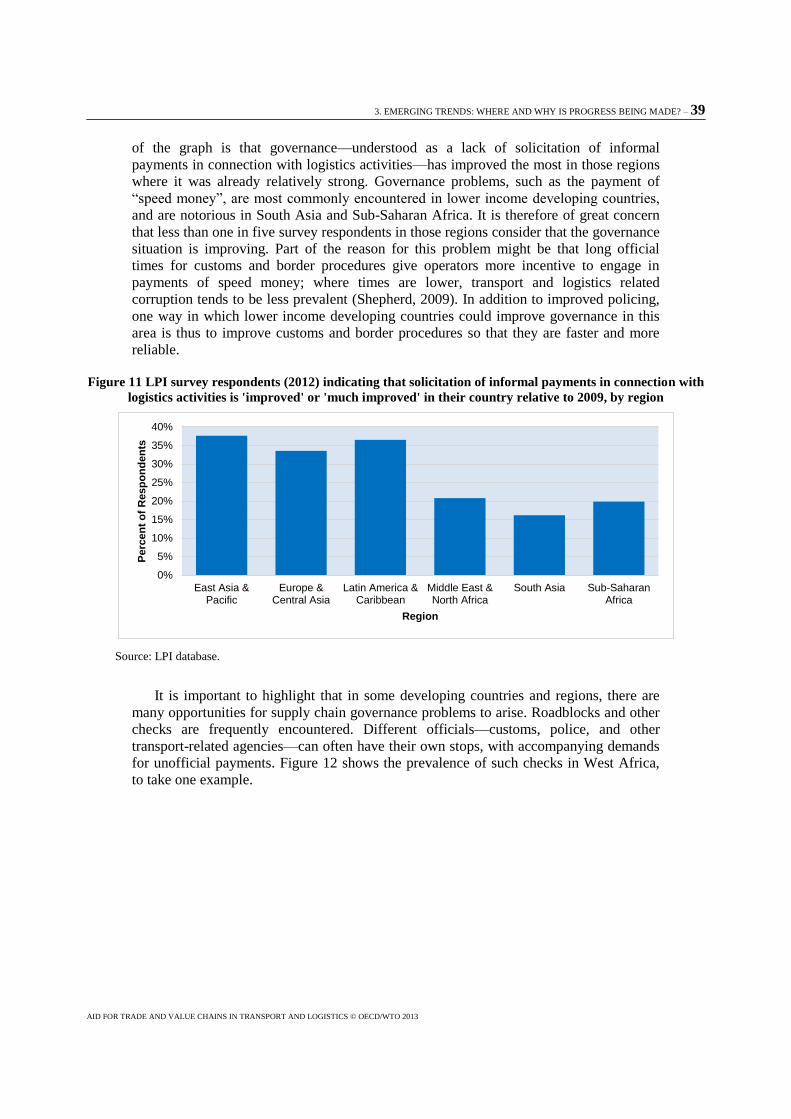
3. EMERGING TRENDS: WHERE AND WHY IS PROGRESS BEING MADE? – 39
AID FOR TRADE AND VALUE CHAINS IN TRANSPORT AND LOGISTICS © OECD/WTO 2013
of the graph is that governance—understood as a lack of solicitation of informal
payments in connection with logistics activities—has improved the most in those regions
where it was already relatively strong. Governance problems, such as the payment of
“speed money”, are most commonly encountered in lower income developing countries,
and are notorious in South Asia and Sub-Saharan Africa. It is therefore of great concern
that less than one in five survey respondents in those regions consider that the governance
situation is improving. Part of the reason for this problem might be that long official
times for customs and border procedures give operators more incentive to engage in
payments of speed money; where times are lower, transport and logistics related
corruption tends to be less prevalent (Shepherd, 2009). In addition to improved policing,
one way in which lower income developing countries could improve governance in this
area is thus to improve customs and border procedures so that they are faster and more
reliable.
Figure 11 LPI survey respondents (2012) indicating that solicitation of informal payments in connection with
logistics activities is 'improved' or 'much improved' in their country relative to 2009, by region
Source: LPI database.
It is important to highlight that in some developing countries and regions, there are
many opportunities for supply chain governance problems to arise. Roadblocks and other
checks are frequently encountered. Different officials—customs, police, and other
transport-related agencies—can often have their own stops, with accompanying demands
for unofficial payments. Figure 12 shows the prevalence of such checks in West Africa,
to take one example.
0%
5%
10%
15%
20%
25%
30%
35%
40%
East Asia &Pacific
Europe &Central Asia
Latin America &Caribbean
Middle East &North Africa
South Asia Sub-SaharanAfrica
Perc
en
t o
f R
esp
on
den
ts
Region

40 – 3. EMERGING TRENDS: WHERE AND WHY IS PROGRESS BEING MADE?
AID FOR TRADE AND VALUE CHAINS IN TRANSPORT AND LOGISTICS © OECD/WTO 2013
Figure 12 Checkpoints, delays, and unofficial payments in West African countries
Source: www.borderlesswa.com/resources/21st-usaid-uemoa-road-governance-map.

3. EMERGING TRENDS: WHERE AND WHY IS PROGRESS BEING MADE? – 41
AID FOR TRADE AND VALUE CHAINS IN TRANSPORT AND LOGISTICS © OECD/WTO 2013
Red tape
Previous subsections have suggested that customs and border procedures present a
significant barrier to value chain development in a range of countries, both directly—by
affecting time, cost, and reliability—and indirectly—by giving agents an incentive to
engage in informal practices. This subsection looks at red tape barriers more closely,
using Doing Business data on the number of documents required for export and import
transactions, and the cost associated with those transactions. For comparability, we
choose the same time period as for the LPI trend questions, namely 2009-2012.
Figure 13 shows the number of documents required for export and import
transactions, a common measure of red tape barriers affecting trade-related transport and
logistics operations. In both cases, there has been very little change over the sample
period. After developing Europe and Central Asia, the largest proportional reductions in
export and import documents have been in Sub-Saharan Africa. However, the numbers
involved are small: 2% for imports and 1% for exports. So although this is an
encouraging development, it does not suggest that there have been major, successful
reforms of customs and border processes at the regional level. Of course, aggregate
results might obscure more positive news at the country level, where there is indeed
evidence of reform in a number of locations.
Figure 13 Number of documents required for export and import, 2009-2012, by region
Source: Doing Business database.
Corresponding information for cost is in Figure 14. The data show that import and
export costs have increased in all regions between 2009 and 2012. In part, this dynamic
reflects the fact that red tape barriers have not been substantially reduced, as shown by
the previous figure. It is important to be cautious in interpreting cost data, however, since
they are not an unambiguous indicator of performance, and they depend on many other
factors, such as inflation and the general price level. The reason that cost is not an
unambiguous indicator of performance is that many technological improvements that are
0
1
2
3
4
5
6
7
8
9
10
Nu
mb
er
of
Do
cu
men
ts
2009 2012
Exports Imports

42 – 3. EMERGING TRENDS: WHERE AND WHY IS PROGRESS BEING MADE?
AID FOR TRADE AND VALUE CHAINS IN TRANSPORT AND LOGISTICS © OECD/WTO 2013
welcomed by the private sector—such as automation—might increase the type of costs
captured by Doing Business, for example through the imposition of user fees. However,
the resulting improvements in time and reliability may mean that overall (direct and
indirect) costs are in fact reduced for operators. The effects of such a technological
improvement are not accounted for in the Doing Business data except through the direct
effect of charges like user fees. Having said this, it is nonetheless notable that the best
performing region—East Asia and the Pacific—has kept cost increases to a minimal level
over the sample period. Substantial increases, such as those in developing Europe and
Central Asia, are potentially a matter for concern.
Figure 14 Cost to export and import, 2009-2012, by region
Source: Doing Business database.
Box 5 Successful red tape reforms in the doing business database
The World Bank’s Doing Business project now catalogues instances of reform that have led to decreases in
the time, documentation, or cost of exporting and importing. Angola, for example, has undertaken two successful
reforms. In 2010, it implemented a customs improvement program that streamlined procedures, and reduced
trade time and cost. It followed up in 2011 by investing in port infrastructure and administration, which also
reduced export and import time. Although Doing Business primarily captures red tape barriers—over half the
time required to export or import is typically accounted for by document preparation—its measures also pick up
complementary reforms that decrease dwell times and inland transit times.
Senegal introduced successful reforms in three years: 2009, 2010, and 2012. In the first wave, it introduced a
single window, meaning that traders can submit all required documentation to a single point, which then
distributes them to the appropriate agencies. In other border processing improvements, Senegal also introduced
an electronic data interchange—an example of the increasing use of ICTs referred to in the main text—extended
customs’ operating hours, and moved to a risk-based inspection system. In addition, it also implemented
improvements in port and road infrastructure, as well as reductions in the number of checkpoints. In 2010 and
2012, the country built on this strong basis of reform by improving facilities at the container terminal, and
0
500
1000
1500
2000
2500
3000
Co
st
(US
D)
2009 2012
Exports Imports

3. EMERGING TRENDS: WHERE AND WHY IS PROGRESS BEING MADE? – 43
AID FOR TRADE AND VALUE CHAINS IN TRANSPORT AND LOGISTICS © OECD/WTO 2013
extending the use of electronic forms. As an additional step, it introduced greater competition in transport
markets. All of these reforms together resulted in improvements in trade documentation, time, and cost. For
example, export time was reduced from 14 days to 11 between 2009 and 2013.
Source: www.DoingBusiness.org.
Summary
From an overall perspective, the “friendliness” of the transport and logistics
environment improved between 2007 and 2012. This finding is true across all developing
regions. Logistics performance tends to be strongly inversely correlated with per capita
income, so richer, more developed countries tend to do better on average. However, even
within the developing country group, there are significant performance differences: East
Asia and the Pacific is the leading region, but Sub-Saharan Africa is lagging. The overall
rate of improvement in logistics performance is fastest in non-high income Europe and
Central Asia, and in South Asia. Progress is at a more moderate rate in other regions.
From a policy perspective, it is also important to break down overall performance,
and to look at individual factors in transport and logistics performance that are improving
rapidly, and to identify those areas where improvements are less prevalent. The stand out
area in terms of progress is ICT infrastructure: the private sector in all regions and income
groups strongly indicates that many improvements have taken place in this area over
recent years. Indeed, the rate of improvement of ICTs appears to be much faster than that
of other types of infrastructure. This development probably reflects the investment of
national resources, as well as technical assistance and capacity building, in areas such as
customs automation. In addition, there has been a strong spread of ICTs within the private
sector—spurred in part by participation in GVCs—that has helped upgrade firm
performance. However, the result of the difference in attention given to ICT infrastructure
as opposed to traditional trade and transport related infrastructure—roads, rail links,
ports, and airports—is that in many developing countries, physical infrastructure is in fact
a more important business constraint than access to modern technology, at least in the
main international gateways. Going forward, there is now an argument for refocusing
attention on traditional “hard” infrastructure, not only at international gateways, but also
improvements designed to improve internal connectivity of countries. For example,
Copenhagen Economics (2013) find that the economic benefits of port upgrading in
Brazil are not properly passed on to the rest of the country without accompanying
improvements to internal infrastructure, such as roads and intermodal transport links that
connect ports with the rest of the country.
Of course, focusing on hard infrastructure development does not stop at building
facilities. It also implies regulatory reform to ensure that firms have non-discriminatory
access to core infrastructure, and that services are provided on a basis that is as
competitive as possible. The data suggest that the quality of private logistics services is
improving at a significantly faster rate than logistics regulation, and this lag needs to be
addressed to ensure the continued growth and development of GVCs in the sector.
Just as in infrastructure, there is a similar contrast between improvements in customs,
and improvements in other border procedures: in most regions, the former are much more
prevalent than the latter. Again, this dynamic reflects the success of standardization,
technical assistance, and capacity building efforts that have been implemented for
customs. However, from a supply chain perspective, it is important that all aspects of the

44 – 3. EMERGING TRENDS: WHERE AND WHY IS PROGRESS BEING MADE?
AID FOR TRADE AND VALUE CHAINS IN TRANSPORT AND LOGISTICS © OECD/WTO 2013
border clearance process, not just customs, work in a way that is rapid, cost effective, and
reliable. The evidence strongly suggests that in many countries, it is important to work on
border agencies such as health, quarantine, and SPS authorities, in addition to continuing
the good work that has been done with customs. Although these agencies are less
important for manufacturing GVCs, and the transport and logistics services they use, they
are crucial for emerging agrifood GVCs in areas such as horticultural goods or cut
flowers. Agrifood GVCs are of particular interest to some developing countries with a
comparative advantage in agriculture, and there are precedents for their having
significantly positive development effects, as in the case of Kenya or some countries in
South America.
Box 6 Shipping containers and quarantine pests
Managing SPS risks is an important issue for producers and consumers alike in agrifood GVCs. Developing
countries have to show that their products will be free from quarantine pests, in addition to being free of products
that cause risks for human health, in order to access major markets like the US and the EU. In practice, this
requirement can mean lengthy and costly procedures prior to export. During the trading process itself, special
certifications are often required, and documentary problems, or a failure to comply with the importing country’s
rules, can delay goods at the border, or even see them rejected from the importing market entirely.
An additional dimension to the problem that is particularly relevant from a transport and logistics point of
view is shipping containers. In light of their frequent movements around the globe, containers can potentially act
as a vector for the entry of quarantine pests into countries where they are prohibited or controlled. Transport
operators, in addition to exporters, need to pay increasing attention to this issue, particularly in light of the move
towards “green logistics” that is currently taking place in the industry.
Since 2008, experts from around the world—including the private sector—have worked together through the
International Plant Protection Convention (IPPC) to develop a standard on Minimizing Pest Movement by Sea
Containers. Although not yet adopted, the IPPC’s work fed into a recent update of the Code of Practice for
Packing of Cargo Transport Units, under the aegis of the International Maritime Organization, and the UN
Economic Commission for Europe. The IPPC’s work was crucial in ensuring that the Code dealt with
phytosanitary requirements for cleaning shipping containers. When the IPPC standard is adopted, it is expected
that the scope for introducing new quarantine pests through shipping containers will be minimized in a way that
is consistent with both good SPS practice, and good business practice.
Source: www.IPPC.int.
Improving border procedures, as well as reducing red tape barriers, can also be an
important step towards reducing governance problems that directly affect transport and
logistics GVCs, such as the need to pay “speed money” in some countries. Unofficial
payments tend to increase costs in an unpredictable way, thereby affecting both the
operating efficiency and reliability of supply chains. Perhaps surprisingly, the types of red
tape barriers that make such payments more likely have not been significantly reduced in
recent years in any region. Although there are encouraging individual instances of reform,
there is much that developing countries can do to reduce documentary requirements and
time taken to complete export and import transactions. In a sense, some ways of reducing
border crossing times and increasing their certainty appear to be relatively straightforward
reforms: decreasing the number of documents or agencies, for example, can be done
administratively. However, the politics of such reforms are very challenging, which
perhaps explains why they are not as widespread as expected. The most common
difficulty is that there is strong bureaucratic resistance, due both to inertia and the
3. EMERGING TRENDS: WHERE AND WHY IS PROGRESS BEING MADE? – 45
AID FOR TRADE AND VALUE CHAINS IN TRANSPORT AND LOGISTICS © OECD/WTO 2013
likelihood of lost revenue for individual civil servants. Unlike with infrastructure, where
finance is a significant constraint for most developing countries, the problem with red
tape barriers lies much more in the area of ensuring strong, policy-level commitment to
drive reform.


4. ENSURING ALIGNMENT AND MAXIMIZING IMPACT OF AID FOR TRADE – 47
AID FOR TRADE AND VALUE CHAINS IN TRANSPORT AND LOGISTICS © OECD/WTO 2013
4. Ensuring alignment and maximizing impact of aid for trade
The previous section examined emerging trends the transport and logistics sector,
focusing on areas of more or less rapid improvement in developing countries. As noted in
Sections 1-2, improvements in transport and logistics performance do not only aid
development of GVCs in that sector, but also support their deepening in other sectors,
such as manufacturing and agrifood. The potential development implications of
upgrading this sector—both direct and indirect—are therefore significant.
In this section, we turn to the question of the role that AfT programs can play in
supporting development and reform of the transport and logistics sector. As a starting
point, we use data from the OECD/WTO survey to help identify the types of actions that
are viewed as most effective by the private sector, and to highlight the beneficiary
priorities that ultimately drive the targeting of Aid of Trade programs. We then analyze
OECD data on aid flows to give an idea of the current distribution of donor resources
across the various areas that can help promote development of the transport and logistics
sector. Finally, we present some case study examples focusing on concrete programs
implemented by the organizations and partnerships that are active in this area.
Beneficiary priorities
Although the OECD/WTO private sector survey is based on a small sample, it has a
number of data points that provide useful information on the ways in which AfT
programs can be refined and better targeted going forward. The first important finding is
that only 25% of respondents indicate that they have benefitted from support to help
address the issues they face in entering, establishing, or moving up the transport and
logistics value chain. Of course, national programs are more common than development
initiatives in this area. However, this relatively low figure might also, in part, reflect a
lack of awareness of the many initiatives in place. Alternatively, it could indicate that
some programs are concentrated on a relatively small number of firms, or perhaps on
sectors other than transport and logistics. In tourism, for instance, over twice the
percentage of respondents indicate having received assistance.
Table 7 sets out the types of support identified by survey respondents as potentially
the most effective. Interestingly, the most commonly-cited one is investment in trade and
transport-related infrastructure. As noted above, ICT infrastructure is now relatively well
developed in a wide range of countries—at least in the main population centers and
international gateways—and so the focus is shifting back to the traditional need to
improve roads, rail links, ports, and airports. Over half of all respondents' list investments
in physical infrastructure as potentially among the most useful types of support, but the
same are only true of around 20% in the case of communications infrastructure.
A large number of respondents believe that support through trade policy can
potentially help them position themselves in transport and logistics GVCs. The two
factors most commonly referred to are better trade facilitation (52%), and improved
market access abroad (44%). Although both factors are clearly important to the private
sector, it is significant that trade facilitation is cited by more respondents than market
access. Although there is scope for countries to agree to reforms and standards as a

48 – 4. ENSURING ALIGNMENT AND MAXIMIZING IMPACT OF AID FOR TRADE
AID FOR TRADE AND VALUE CHAINS IN TRANSPORT AND LOGISTICS © OECD/WTO 2013
group—either multilaterally, at the WTO, or regionally, as in APEC—the most common
approach to trade facilitation is unilateral. Improving border procedures often does not
require the cooperation of other countries, and is beneficial to the reforming country
regardless of what others do. The private sector is therefore strongly suggesting that
governments should continue with the types of trade facilitation reforms examined in the
previous section, at the same time as working for improved market access abroad through
multilateral or, as a second best, regional agreements.
Three responses relating to the general business climate suggest that this factor is also
very important for the private sector. 40% of respondents identify access to finance as a
potentially effective area of support,3 37% cite improvements to the business climate
more generally, and 29% include public-private dialogue with national authorities. The
key to understanding the prevalence of these responses is that firms can only move up the
transport and logistics value chain if they are able to unlock the resources needed to
invest in physical and human capital. Well-functioning financial markets—including an
appropriate degree of international openness—are crucial for efficiently turning savings
into investment. The business environment—including regulatory transparency—affects
firms’ level of certainty as to the future conditions under which their investments will
need to be profitable. As for supply chain management, where uncertainty creates high
levels of indirect cost, it can also be a factor that holds firms back from investing. AfT
programs that target private sector capacity—both in transport and logistics, and in
crucial backbone sectors like finance—as well as those that seek to improve the business
environment and transparency more generally can therefore be expected to have strong
positive impacts on value chains in this sector.
Table 7 Type of aid-for-trade support listed by the private sector as being the 'most effective'
in helping them enter, establish, or move up transport and logistics value chains
Type of Support Percent of Respondents
Investment in infrastructure (road, rail, port, and airport capacity) 55%
Incentives for investment (domestic and foreign) 53%
Trade facilitation measures to streamline customs bureaucracy and border delays
52%
Better market access 44%
Better access to finance 40%
Support to improve the business environment 37%
Public-private dialogue with national authorities 29%
Internationally-recognized standards and certification capacity 27%
Labor force training schemes 26%
Investment in communications infrastructure 19%
Appropriate competition policy 19%
Establishment of export processing zones/special economic zones 18%
Establishment and maintenance of animal or pest-disease free zones 2%
Source: OECD/WTO.
As Table 7 shows, other types of support are less frequently cited by survey
respondents. Interestingly, the establishment of export processing zones is one of the least
3 This finding is in line with the partner country survey, in which limited access to trade finance is the second
most commonly cited factor inhibiting the ability of national firms to participate in GVCs.

4. ENSURING ALIGNMENT AND MAXIMIZING IMPACT OF AID FOR TRADE – 49
AID FOR TRADE AND VALUE CHAINS IN TRANSPORT AND LOGISTICS © OECD/WTO 2013
frequently cited factors, although investment incentives are very frequently cited. Caution
is needed in interpreting the responses on investment incentives, however. To be both
efficient and effective from an economic point of view, investment incentives need to
correct a market failure, perhaps due to difficulty accessing financial services (see above)
or due to a lack of information about future business conditions. However, they have to
be very carefully designed to ensure that they promote new investments at the margin,
rather than simply reward investments that would have been undertaken in any case.
Although there is evidence that investment promotion schemes can be effective in
promoting quality upgrading of exports in developing countries (Harding and Javorcik,
2012), design difficulties and the potential for capture make such schemes risky in
environments without well-developed institutions. They can also lead to significant cross-
sectoral distortions from an economy-wide standpoint, and should therefore be introduced
only when supported by rigorous analysis.
In terms of the broad categorization of AfT flows used by the OECD’s CRS, the
above results—although based on a small sample—are suggestive of some emerging
priorities as seen by the private sector in beneficiary countries. A very important priority
should clearly be assistance in the area of trade-related infrastructure, such as rail and
road links, ports, and airports. Development of ICT infrastructure should at this point be
treated as a less pressing issue, given that considerable progress has already been made. It
is important to note that infrastructure-related AfT needs to take account not just of
construction costs, but also maintenance costs, which can be relatively high in many
developing countries due to their climate and geography. Donor support needs to be
available for both types of expenditure.
Another important priority should be building productive capacity, with a particular
focus on supporting the development of the financial sector—including through an
appropriate level of international openness—and improving the business climate. By
contrast with the “hard” investments required for infrastructure work, this priority is more
about “soft” factors such as regulatory reform and governance. Technical assistance and
capacity building activities can both be useful in this area, as a way of helping the private
sector get the support it needs to enter and move up transport and logistics value chains.
Box 7 WTO agreement on trade facilitation
WTO Members are negotiating a multilateral Agreement on Trade Facilitation. The negotiation aims to
clarify and improve relevant aspects of Articles V, VIII and X of the GATT 1994; enhance customs co-
operation; and enhance the provision of technical assistance and support for capacity building to developing
countries, especially the Least-Developed Countries. The three GATT articles cover Freedom of Transit, Fees
and Formalities connected with Importation and Exportation, and Publication and Administration of Trade
Regulations. The draft text of the new agreement on Trade Facilitation has two main pillars. Section 1 contains
policy and procedural reforms that Members will implement, and Section 2 includes flexibilities for developing
countries and Least-Developed Countries, along with provisions to enhance technical assistance and support for
capacity building to underpin the implementation of their reform programs. Developed countries will be
expected to implement all the provisions upon entry into force of the Agreement; developing countries will be
provided with flexibility to decide on their own implementation schedule.
Source: WTO Secretariat.

50 – 4. ENSURING ALIGNMENT AND MAXIMIZING IMPACT OF AID FOR TRADE
AID FOR TRADE AND VALUE CHAINS IN TRANSPORT AND LOGISTICS © OECD/WTO 2013
Finally, technical assistance for trade policy and regulations should also be a priority
area, focusing resources primarily on those areas in which developing countries can act
unilaterally, in a way that reinforces the multilateral system. One such area should be
trade facilitation. Although this term is used in a relatively narrow sense in the Doha
Round negotiations—it deals primarily with streamlining customs bureaucracy and
border delays—there is a strong case for treating it more broadly in the context of AfT.
The experience in APEC can perhaps serve as a useful model. APEC’s two Trade
Facilitation Action Plans had the overall objective of reducing trade transaction costs.
Those plans have now been superseded by the Supply Chain Connectivity Framework,
which aims to reduce the time, cost, and uncertainty associated with supply chain
transactions. We have argued above that all three factors are important determinants of
transport and logistics performance, as well as of the ability of firms to move up GVCs in
this sector. Aid-for-trade facilitation should therefore encompass not just customs
reform—where considerable success has already been enjoyed—but also improvements
to the full range of agencies and regulations involved in the border clearance process.
Aid for transport and logistics
The OECD’s Creditor Reporting System (CRS) does not identify aid for all projects
related to transport and logistics or GVCs as a separate category, so it is impossible to
know exactly how much is devoted to this area relative to others.4 As noted in the
previous section, transport and logistics covers a wide area, and in fact overlaps with
many other areas of policy interest. Some factors identified as important by transport and
logistics firms for their operations or ability to participate in GVCs, such as hard
infrastructure projects, including ports, airports, roads, and rail links, are clearly of
primary interest to the transport and logistics sector. However other important factors,
such as access to finance, depend on policies and aid practices in quite different areas. It
is therefore necessary to take a broad-based approach in assessing the nature and extent of
AfT activities that affect the transport and logistics sector.
Figure 15 shows the pattern in overall disbursements of aid in four categories that are
of high relevance to the transport and logistics sector: transport and storage (which is
largely infrastructure spending); communications (which reflects ICT infrastructure
spending); finance; and trade facilitation (in the narrow sense of improving border
procedures). The figures include multilateral as well as bilateral lending. After an
increase between 2007 and 2008, the overall level of aid has remained steady in these
categories over recent years. (Information for 2012 is unavailable as of writing.) Data are
in current prices, so it is likely that there has been a small decline in real terms. According
to the OECD/WTO donor country survey, budget cuts may have been responsible for part
of the drop (33% of respondents), but a more likely explanation is a streamlining (i.e.,
reduction in the number) of the countries that receive assistance (100% of respondents).
4 In principle, individual project data could be examined to provide an answer to this question. However, the
analysis here relies on the publicly available CRS data, and a more detailed examination is beyond
the scope of this paper.

4. ENSURING ALIGNMENT AND MAXIMIZING IMPACT OF AID FOR TRADE – 51
AID FOR TRADE AND VALUE CHAINS IN TRANSPORT AND LOGISTICS © OECD/WTO 2013
Figure 15 Aid disbursements related to the transport and logistics’ sector
(USD million, current prices, 2007-2011)
Source: OECD CRS.
Note: For definitions of aid categories see main text. Amounts refer to disbursements.
In light of a pattern of relative overall stability of aid flows in this area, Figure 16
shows that there is also a relatively similar breakdown among the four categories from
year to year: the overwhelming majority of aid, well over 90%, goes to transport and
storage. This finding means that transport infrastructure projects account for by far the
bulk of all aid disbursements relevant to transport and logistics. Communications
projects—which are again mostly infrastructure spending—account for a much smaller
proportion of total spending. This distribution lines up well with the observation that ICT
infrastructure tends to perform much better than basic transport infrastructure in many
developing countries—or at least in their main international gateways—and indeed has
been improving rapidly, thanks in part to considerable private investment in this area.
There is thus less need, relatively speaking, to invest donor funds in communications
projects as compared to basic transport infrastructure.
Interestingly, financial sector aid is the second largest category, although it is still
much smaller than hard infrastructure spending. OECD’s CRS indicates that this category
involves four main types of aid: financial policy administration and management;
monetary institutions; formal sector financial intermediaries; informal or semi-formal
financial intermediaries; and education and training in banking and financial services. All
four types of aid can in principle improve access to finance for a range of businesses,
including those in the transport and logistics sector.
The smallest of the four categories is trade facilitation, as narrowly defined to include
essentially the streamlining of border processes. Although trade facilitation reforms are
generally less costly than large infrastructure investments—and indeed, by increasing
border traffic they tend to create revenue in many cases (e.g., OECD, 2009)—this
approach needs to be reconciled with the importance given to customs and border
procedures by private sector respondents in the OECD/WTO survey discussed in Section
3. Border processes were commonly cited as an operational problem, particularly in
developing countries, and as a factor that inhibits firms from entering or moving up
transport and logistics GVCs.
0
20,000
40,000
60,000
80,000
100,000
120,000
140,000
160,000
180,000
2007 2008 2009 2010 2011
Mil
lio
n U
SD

52 – 4. ENSURING ALIGNMENT AND MAXIMIZING IMPACT OF AID FOR TRADE
AID FOR TRADE AND VALUE CHAINS IN TRANSPORT AND LOGISTICS © OECD/WTO 2013
Figure 16 Aid disbursements for transport and logistics by category (percentage, 2007-2011)
Source: OECD CRS.
Note: For definitions of aid categories see main text. Amounts refer to disbursements.
Although interesting case studies are available, econometric studies on the
effectiveness of AfT expenditures related particularly to transport and logistics are in
their infancy. The only peer-reviewed study is Helble et al. (2012).5 The authors focus on
“Aid-for-trade Facilitation”, but with trade facilitation understood in the broad sense of
reducing trade transaction costs, not the narrow one of streamlining border procedures.
Their data capture most of the areas identified above as potentially important, but also
include some other factors—such as broad trade policy assistance—that are less related to
transport and logistics. Helble (2012) find that although aid-for-trade facilitation has a
relatively small impact in relative terms—using their strongest result, a doubling of aid
would increase recipients’ exports by a little under 2%—the dollar numbers are much
larger because aid flows are relatively small compared with countries’ total exports.
Although there are significant methodological issues surrounding the analytical approach
that Helble et al. (2012) take, their results clearly indicate that aid-for-trade facilitation—
which overlaps to a large extent with aid for the transport and logistics sector—can
significantly benefit recipient countries, including by increasing their exports of other
goods. As noted throughout this paper, efficient transport and logistics services are a vital
input into many other value chains, and this result reflects that dynamic.
Another way of assessing the impact of AfT programs is through impact evaluations
conducted by donors. OECD (2011) provides a meta-analysis of projects in the transport
and storage sector, which have generally been found to produce positive outcomes
including, in some cases, on trade variables and broader economic indicators. OECD
(Forthcoming) provides an overview of projects in selected countries in which ex ante
evaluations project major economic gains. In one case (Costa Rica), the reform strategy
has been vindicated by increased participation in a number of important GVCs.
The OECD/WTO donor survey also deals with the issue of evaluation. It asks
respondents to indicate whether AfT support and/or work on value chains have had
particular development impacts. Results are in Table 8. They suggest that economic
5 Cali and Te Velde (2008) also use econometric methods to examine the impacts of AfT, but their results are
difficult to interpret.
95.5%
96.0%
96.5%
97.0%
97.5%
98.0%
98.5%
99.0%
99.5%
100.0%
2007 2008 2009 2010 2011
Perc
en
t
Year
Transport and Storage Communications Finance Trade Facilitation

4. ENSURING ALIGNMENT AND MAXIMIZING IMPACT OF AID FOR TRADE – 53
AID FOR TRADE AND VALUE CHAINS IN TRANSPORT AND LOGISTICS © OECD/WTO 2013
outcomes have been more prevalent in some areas than in others, but in general terms,
AfT has been effective in promoting the kinds of economic and social development
outcomes referred to in Section 1.
Table 8 Donors identifying the listed effects as impacts of their aid-for-trade and/or value chain support
Development Impact Percent of Respondents
Improved understanding of trade 67%
More focus on trade in the national development plan 40%
Labor skills development 67%
Private sector investment 80%
Increased exports 73%
Increased trade 80%
Export diversification 53%
Increased economic growth 40%
Employment 73%
Poverty alleviation 67%
Women’s economic empowerment 67%
Source: OECD/WTO.
Partners, programs, and projects
AfT programs involve bilateral and multilateral donors, along with a range of private
sector actors as both donors and partner countries. This section provides some case study
examples of successful AfT partnerships in the transport and logistics sector, that have
helped improve performance and bring about significant economic gains for the countries
concerned. Typically, aid activities do not deal with just one area, such as hard
infrastructure, but also address accompanying issues of importance, such as soft
infrastructure, including trade facilitation. Although the categorization presented in the
previous section seems somewhat rigid, donors and partner countries are necessarily
much more flexible in practice. This approach reflects the fact that the transport and
logistics sector has a number of different dimensions, but they all tend to be interlinked in
sometimes complex ways.
Box 8 Roads and trade facilitation for the Europe-Caucasus-Asia corridor
Landlocked countries in Central Asia suffer from high levels of trade costs, and are characterized by
relatively low levels of logistics performance (Arvis et al., 2012; Arvis et al., 2013). In addition to domestic
transport and logistics difficulties, they also depend on performance in neighboring countries when transit is
involved. Although protocols have been designed at an international level to ease the process of transit (see Box
4), travel times are often long, and border waiting times can be extreme in some cases. Supply chain governance
can also be a serious issue in some of these countries.
Collaboration among a group of donors and a set of beneficiary countries has tried to loosen these
constraints. As an example, the Asian Development Bank and the European Bank for Reconstruction and
Development financed the improvement of an important road link between the capitals of Kazakhstan and
Kyrgyzstan. The two beneficiary governments worked together to improve customs procedures at the border,
including through the installation of new equipment and capacity building for staff. Line ministries in the two
beneficiary countries were responsible for implementing the road upgrading and other improvements, with the
two donor organizations proving financing.
Another regional initiative worked in parallel to deal more closely with soft infrastructure issues, such as

54 – 4. ENSURING ALIGNMENT AND MAXIMIZING IMPACT OF AID FOR TRADE
AID FOR TRADE AND VALUE CHAINS IN TRANSPORT AND LOGISTICS © OECD/WTO 2013
customs. The Intergovernmental Commission for the Transport Corridor Europe-Caucasus-Asia (TRACECA)
brings together 12 countries that are important for the transit of goods by land between the various sub-regions.6
It is funded by the European Union. In the case of the Kazakhstan-Kyrgyzstan road link, TRACECA financed
additional customs reforms, building on those already undertaken by the two governments as part of the soft
infrastructure component of the original project.
This case study is a good example of multiple agencies and governments working together to deal with an
important problem in the transport and logistics sector, namely the relative isolation of landlocked countries. The
combination of road upgrading and customs modernization and reform produced significant economic benefits.
In terms of development of the sector, traffic volumes rose by 25%. There were also important flow-on effects to
the rest of the economy: for example, Kyrgyzstan’s exports rose by 160%. This example therefore shows the
importance of a collaborative approach, as well as the need to address multiple issues in order to have maximum
effect.
Source: OECD (Forthcoming); www.TRACECA-org.org.
Box 9 Regional transport corridors in Africa
The African Development Bank (AfDB) has placed the delivery of Infrastructure as a key pillar in its
Medium Term Strategy (2008-2012), and this is anticipated to continue in the Long Term Strategy (2013-2022).
This overall framework will contribute to the improvement of an enabling environment for private sector
development, for example by boosting investment in infrastructure development, and the development of micro,
small and medium-size enterprises connected to regional and global value chains.
The African continent suffers from inadequate physical linkages among rising capital cities on the one hand,
and between production areas and ports—which enable international linkages—on the other. The existence of
lengthy cross-border procedures and barriers also presents a major challenge. The result is low levels of inter-
regional trade, and limited mobility of labor and capital.
AfDB interventions through its Transport & ICT Department (OITC) have been focused primarily on the
delivery of physical infrastructure. However, through the years the Bank has gradually widened its intervention
scope vertically and horizontally. AfDB targets, in so far as possible, a corridor approach to financing transport
infrastructure. The aim is to connect production areas to export/import terminals, provide for railway and road
infrastructure, improve border-crossings, and upgrade port facilities. In parallel, AfDB has begun to slowly
increase its interventions in the areas of transport facilitation and logistics. This step will enable the AfDB to
bring more functionality to these corridors as key backbones in the value chain. Once this has been put in place,
other departments will come in, through country-level coordination tools, to provide assistance to other aspects
of the chain, including energy provision, private sector development, and agriculture programs.
The AfDB’s operations have predominantly been in the provision of road infrastructure, in line with the
development pace of the continent. These operations are spread out across Africa, with a notable concentration
in the Eastern, Western, and Southern regions. Most of these projects are regional corridors spanning more than
one country, in most cases enabling countries (both coastal and landlocked) to connect their agricultural or
industrial production areas to export/import terminals. In many of these operations a transport and trade
facilitation component has come to feature more prominently, coupled with provisions for One Stop Border
Posts (OSBP).
Source: Based on material provided by the African Development Bank.
6 A number of other regional initiatives are also active in this area, such as the United Nations Special
Program for the Economies of Central Asia (SPECA), and the Asian Development Bank’s Central
Asia Regional Economic Cooperation (CAREC).
4. ENSURING ALIGNMENT AND MAXIMIZING IMPACT OF AID FOR TRADE – 55
AID FOR TRADE AND VALUE CHAINS IN TRANSPORT AND LOGISTICS © OECD/WTO 2013
Hard infrastructure is often the focal point of AfT efforts involving transport and
logistics. However, soft infrastructure, including trade facilitation and customs
cooperation, can play more than a secondary role in improving performance. The
following case study highlights that assistance with border procedures can lead to
substantial decreases in border waiting times, which are an important driver of costs in
some international supply chains.
Box 10 Simplification of border procedures in Africa
The African North-South Corridor program is also an AfT effort involving multiple donors, beneficiaries,
and projects. The aspect of the program that is of particular interest for this case study is upgrading of an
important border crossing at Chirundu, which links Zambia and Zimbabwe.
The core reform at Chirundu was the implementation of a one-stop border post. This approach makes it
possible for drivers to deal with all border formalities in one location, thus lowering time, reducing uncertainty,
and improving supply chain performance. On the beneficiary side, the COMESA Secretariat has played an
important coordinating role in the project. A range of donors have been involved, including the Japanese and UK
governments, and the World Bank.
Economic and development benefits of the project have been substantial. Most importantly from a transport
and logistics standpoint, clearance times for commercial trucks have been reduced from an average of five days
to less than 24 hours. A fast lane has also been introduced, which allows clearance of certain vehicles in less than
five hours. Such improvements can have major effects on supply chain costs, times, and reliability, all of which
are key determinants of overall performance. Moreover, lower official waiting times have reduced the
prevalence of “speed money” payments and improved supply chain governance. The importance of these effects
is evidenced by the calls to “scale up” this kind of project to include other border crossings as well.
Source: OECD (Forthcoming); www.ICAfrica.org.
The previous examples might mistakenly give the impression that AfT is a public
sector agenda. In fact, it is an area where the private sector, and public-private
partnerships,7 can work effectively to bring about important economic and social
outcomes. Although public funding is often required to support basic infrastructure
development, it is usually the case that the private sector is more efficient at operating
and using the infrastructure after it is built, provided that appropriate regulation is in
effect. Moreover, large transport and logistics companies—such as lead firms in GVCs—
can be important vectors for technological progress in developing countries, as they
distribute best practice globally and build capacity with private sector operators in-
country. It is therefore important for donors to consult more extensively with the private
sector in the development of AfT programs: currently, only 63% of respondents to the
OECD/WTO donor survey indicate that such consultations are undertaken, although all
respondents include the private sector at the implementation stage.
It is important to stress the constructive role that lead firms in GVCs can play as
agents in the private sector development process. The OECD/WTO private sector survey
shows that two-thirds of lead firm respondents consider development-related activities to
be part of their core business strategy. This figure is double the number of respondents
7 All respondents to the OECD/WTO donor survey indicate that they use public private partnerships for AfT
projects in the transport sector.

56 – 4. ENSURING ALIGNMENT AND MAXIMIZING IMPACT OF AID FOR TRADE
AID FOR TRADE AND VALUE CHAINS IN TRANSPORT AND LOGISTICS © OECD/WTO 2013
indicating the next most common reason, namely that it is part of their corporate social
responsibility agenda. Interestingly, the same proportion of lead firms (two-thirds)
indicate that they are involved with (national) government initiatives, but only 44% are
involved with development agency projects or programs. 44% of respondents also
indicate that they are involved with their own company-led projects. The following box
shows the major impact that the private sector can have on the transport and logistics
sector in a developing country.
Box 11 Private sector development in Brazil
Growing trade in Brazil has put pressure on existing transport infrastructure, particularly maritime ports.
Container port traffic has more than tripled in the last decade. The largest and most important port is the Port of
Santos. Two private sector companies, APM Terminals and Terminal Investment Limited, have together
invested over USD 1 billion in a new container terminal at the Port of Santos. It is expected to increase capacity
by up to 40% and productivity by up to 10%. In terms of direct effects on the transport and logistics sector, it is
expected that this expansion will reduce maritime transport costs by up to 8% and increase trade potential by
USD billion – USD 8 billion in value terms.
Maritime transport in Brazil also faces a technical challenge in terms of the types of vessel that can be
accommodated due to the fact that many Brazilian ports are located at rivers rather than at the sea. In 2011, the
private shipping line Maersk Line started operating 16 new SAMMAX8 vessels on services between South
America and Europe. These vessels are designed to be able to deal better with shallow waters, and can thus call
at most Brazilian ports. However, their cargo capacity exceeds that of the smaller vessels that were being used
previously due to draft restrictions. Capacity and productivity have both increased as a result of this change in
shipping technology driven by private sector development. For example, it is estimated that the move to
SAMMAX vessels increased productivity at the Port of Santos by 7% and trade potential by over USD 1 billion.
Source: Copenhagen Economics (2013).
As examples of ways in which AfT is delivered in the transport and logistics sector,
these case studies have highlighted three important points. The first is that, as indicated in
the other parts of this section, physical infrastructure remains a serious constraint in much
of the developing world. The right “recipe” for unblocking that constraint depends on the
particular nature of the problem, and the extent to which a range of donors and
beneficiaries—including the private sector—can work together to solve it. The second
point to highlight is that coordination among donors is crucial. The Central Asian
example in particular shows that efforts by different groups and initiatives can be highly
complementary, but for maximum impact they need to be carefully coordinated so that
they are mutually reinforcing. The third conclusion, which follows in particular from the
Brazil case study, is that the private sector has an important role to play in the AfT
agenda. This point is just as true in transport and logistics as in other sectors. On the one
hand, private investment can provide much needed funds for infrastructure construction
and maintenance. The private sector can generally also operate infrastructure more
efficiently than the public sector, provided that appropriate regulation is in place. Finally,
technology upgrading and innovation tend most often to come from private sector
activities. Participation in GVCs is an important way for technology diffusion to take
place in developing countries, including in the transport and logistics sector.
8 South American MAXimum.

4. ENSURING ALIGNMENT AND MAXIMIZING IMPACT OF AID FOR TRADE – 57
AID FOR TRADE AND VALUE CHAINS IN TRANSPORT AND LOGISTICS © OECD/WTO 2013
Although this section has focused on transport and logistics, it is important to keep in
mind that it is both a GVC in its own right, and a cluster of important backbone services
for the development of other GVCs. As such, it is also useful to consider the types of AfT
that donors are concentrating on in their efforts to promote GVCs. Table 9 presents
results from the OECD/WTO donor survey, indicating the ways in which survey
respondents’ programs seek to promote value chain development. It is very encouraging
that supporting private sector development is the most commonly cited approach,
followed by the business environment, infrastructure, and supply-side constraints. These
factors line up relatively well with beneficiary priorities, and with the areas in which the
performance review in Section 3 highlighted the need for improvement in developing
countries. However, in the same survey, only 52% of respondents indicate that they have
direct experience of value chain development in the transportation sector, which indicates
that there is far more for donors to do in this area.
Table 9 Donors identifying the type of support as a way in which their aid-for-trade strategy
seeks to promote the development of value chains
Type of Support Percent of Respondents
Creating a conducive trade policy regime 75%
Creating a conducive domestic enabling environment 83%
Addressing infrastructure bottlenecks 79%
Supporting private sector development activities 92%
Addressing supply-side constraints 79%
Direct support for value chain development 67%
Source: OECD/WTO.


5. CONCLUSIONS – 59
AID FOR TRADE AND VALUE CHAINS IN TRANSPORT AND LOGISTICS © OECD/WTO 2013
5. Conclusions
This paper has reviewed the role of the transport and logistics sector in helping
developing countries connect to GVCs in other sectors, in addition to the growing role
that transport and logistics plays as a GVC in its own right. GVCs potentially have major
impacts on economic and social development, through both direct and indirect channels.
In the case of transport and logistics, improvements in value chain performance make it
easier to move important goods such as basic foodstuffs or vaccines to areas outside main
population centers, thus spreading the benefits of development, helping improve access,
and keeping consumer prices down. In addition, the transport and logistics sector is
important as in input into the growth of GVCs in other sectors, including manufacturing
and agrifood. Indeed, it is difficult for modern GVCs to exist at all in those sectors
without efficient transport and logistics to back them up. Goods such as intermediate
inputs have to be moved frequently across borders with as much speed and reliability, and
at as little cost, as possible. Perishable agricultural products also need to be moved
quickly from the producer to the distributor in the importing country. Upgrading transport
and logistics, including through deepening involvement in transport and logistics GVCs,
is thus a key factor in developing countries’ ability to connect to value chains and global
markets.
Sections 2 and 3 have shown that a variety of national and cross-national data are
available on the time taken to complete particular supply chain operations, which is a
crucial aspect of determining total costs (both direct and indirect). Countries that can
make these processes work faster, more reliably, and at lower overall cost will tend to be
more successful in entering and moving up transport and logistics GVCs, as well as
GVCs in other sectors. In terms of emerging trends, there have been a number of positive
developments in recent years. The first is that ICT infrastructure is now relatively well
diffused in all developing regions, at least in the main population centers and
international gateways. This diffusion—aided in large part by private-sector driven
technology upgrading—has helped improve performance of international supply chains,
even though the equally important issue of improving domestic connectivity remains to
be addressed in many countries. Given the success that has been enjoyed in this area, it is
appropriate for ICT infrastructure to be a secondary priority in terms of AfT designed to
assist the transport and logistics sector.
By contrast, physical infrastructure such as roads, rail links, ports, and air ports
remain in serious need of upgrading and maintenance in many developing countries. The
rate of improvement in these areas appears to be noticeably slower than for ICT
infrastructure. In light of the significant need in this area, it is appropriate that AfT
affecting transport and infrastructure should deal with physical infrastructure as a first
priority.
It is also important for appropriate emphasis to be placed on the soft infrastructure
improvements that need to accompany investments in physical infrastructure if they are to
be as productive as possible. Soft infrastructure in this case includes customs and border
procedures—and notably customs cooperation—as well as rules and regulations affecting
the transport and logistics sector, red tape, and private sector development. Indeed,
beneficiaries are increasingly identifying these areas—along with access to finance—as

60 – 5. CONCLUSIONS
AID FOR TRADE AND VALUE CHAINS IN TRANSPORT AND LOGISTICS © OECD/WTO 2013
key for entering and moving up transport and logistics GVCs. There are many examples
of donors and beneficiaries working collaboratively—the private sector together with the
public sector—to build multi-dimensional projects that address these various areas. These
experiences should be scaled up and replicated in other areas to the extent possible.
Governance also needs to be addressed as part of the agenda facing countries that
want to improve their firms’ positions in GVCs. By extension, it also needs to be part of
the AfT agenda in transport and logistics. Case studies as well as cross-country
econometric evidence confirm that it is not just improved policing and training for border
officials that improve governance (although both factors clearly help). An important
determinant of officials’ ability to demand “speed money” from operators is the time
taken by official procedures. Reducing red tape barriers and improving border processes
therefore has an important spinoff effect: it improves governance by reducing the
incentive to make irregular payments, with corresponding economic and social benefits.
In terms of the AfT agenda as it applies to the transport and logistics sector—and thus
to the “hardware” that helps firms enter and move up GVCs in other sectors—the key is
in learning from successful experiences, of which there are a number from different parts
of the world. One important lesson is coherence: donors need to work together, and
beneficiaries in many cases need to collaborate among themselves, because transport and
logistics projects are by their nature cross-border initiatives. The second main lesson is
that the private sector should not be neglected in the process, but rather should be fully
involved. Developing infrastructure can often involve significant budgetary resources that
can be extremely difficult to mobilize in developing countries, and which can present an
issue for some donors in a context of strained government budgets at home. The private
sector can therefore be an important source of investment, and regulatory techniques such
as franchising—having firms compete for a “natural” monopoly right, to be exercised
under appropriate regulation—can help ease the strain on public resources. In addition,
the private sector can be leveraged as a development tool in its own right. In transport and
logistics, GVCs have often acted as vectors of technological upgrading in developing
countries, as they disseminate best practice and improve performance. The involvement
of public and private sector actors is thus key for ensuring success of the AfT agenda in
transport and logistics as a way of helping firms enter and move up GVCs in that sector
and in others that depend on it.

REFERENCES – 61
AID FOR TRADE AND VALUE CHAINS IN TRANSPORT AND LOGISTICS © OECD/WTO 2013
References
Arvis, J.-F., Y. Duval, B. Shepherd, and C. Utoktham. 2013. “Trade Costs in the
Developing World: 1995-2010.” Policy Research Working Paper 6309, World Bank.
http://elibrary.worldbank.org/docserver/download/6309.pdf?expires=1362524462&id
=id&accname=guest&checksum=BA24508BAB2A0FF543AEE4C9BA3F90B9.
Arvis, J.-F., M. Mustra, L. Ojala, B. Shepherd, and D. Saslavsky. 2010. Connecting to
Compete: Trade Logistics in the Global Economy. Washington, D.C.: World Bank.
Arvis, J.-F., M. Mustra, L. Ojala, B. Shepherd, and D. Saslavsky. 2012. Connecting to
Compete: Trade Logistics in the Global Economy. Washington, D.C.: World Bank.
Baldwin, R. 2011. “Trade and Industrialization after Globalization’s Second Unbundling:
How Building and Joining a Supply Chain are Different and Why it Matters.”
Working Paper 17716, NBER, www.nber.org/papers/w17716.pdf.
Borchert, I., B. Gootiiz, A. Grover, and A. Mattoo. 2012. “Landlocked or Policy Locked?
How Services Trade Protection Deepens Economic Isolation.” Policy Research
Working Paper 5942, World Bank, www-
wds.worldbank.org/servlet/WDSContentServer/WDSP/IB/2012/01/10/000158349_201
20110105432/Rendered/PDF/WPS5942.pdf.
Cali, M., and D. Te Velde. 2008. “Towards a Quantitative Assessment of Aid for Trade.”
Working Paper, www.odi.org.uk/sites/odi.org.uk/files/odi-assets/publications-opinion-
files/4432.pdf.
Copenhagen Economics. 2013. “Impact Assessment of Maersk in Brazil.” Report
Prepared for A.P. Moller-Maersk.
Dennis, A., and B. Shepherd. 2011. “Trade Facilitation and Export Diversification.” The
World Economy, 34(1): 101-122.
DHL. 2012. DHL Global Connectedness Index 2012. DHL.
Djankov, D., C. Freund, and C. Pham. 2010. “Trading on Time.” Review of Economics
and Statistics, 92(1): 166-173.
Harding, T., and B. Javorcik. 2012. “Foreign Direct Investment and Export Upgrading.”
Review of Economics and Statistics, 94(4): 964-980.
Helble, M., C. Mann, and J. Wilson. 2012. “Aid-for-trade Facilitation.” Review of World
Economics, 148(2): 357-376.
Hertel, T., and L. Winters (eds.). 2005. Poverty and the WTO: Impacts of the Doha
Development Agenda. Washington, D.C.: World Bank.
Hollweg, C., and M.-H. Wong. 2009. “Measuring Regulatory Restrictions in Logistics
Services.” Discussion Paper No. 2009-14, ERIA, www.eria.org/ERIA-DP-2009-
14.pdf.
Hummels, D. 2001. “Time as a Trade Barrier.” Working Paper.
www.krannert.purdue.edu/faculty/hummelsd/research/time3b.pdf.
62 – REFERENCES
AID FOR TRADE AND VALUE CHAINS IN TRANSPORT AND LOGISTICS © OECD/WTO 2013
Martincus, C., J. Caraballo, and A. Graziano. 2013. “Customs as Doorkeepers: What are
their Effects on International Trade.” Working Paper,
www.usitc.gov/research_and_analysis/documents/Customs_as-Doorkeepers-
What_Are_Their_Effects_on_International_Trade.pdf.
OECD. 2008. “Informal Cross-Border Trade and Trade Facilitation Reform in Sub-
Saharan Africa.” Trade Policy Working Paper No. 86, OECD.
OECD. 2009. “The Cost of Introducing and Implementing Trade Facilitation Measures.”
In OECD (ed.). Overcoming Border Bottlenecks: The Costs and Benefits of Trade
Facilitation. Paris: OECD.
OECD. 2011a. Strengthening Accountability in Aid for Trade. Paris: OECD.
OECD. 2011b. “To What Extent Are High-Quality Logistics Services Trade
Facilitating?” Trade Policy Working Paper 108, OECD.
OECD. 2011c. “Estimating the Constraints to Trade of Developing Countries.” Trade
Policy Working Paper 116, OECD.
OECD. 2012a. Managing Aid to Achieve Development Results: An Analysis of Trade-
Related Targets. Paris: OECD.
OECD. 2012b. “Global Food Security: Challenges for the Food and Agriculture System.”
Document TAD/CA/APM/WP(2012)18/FINAL, OECD.
OECD. 2013a. “Estimating the Constraints to Agricultural Trade of Developing
Countries.” Trade Policy Paper 142, OECD.
OECD. 2013b. Interconnected Economies: Benefitting from Global Value Chains. Paris:
OECD.
OECD. 2013c. “Trade Facilitation Indicators: The Potential Impact of Trade Facilitation
on Developing Countries’ Trade”. Trade Policy Paper 144, OECD.
OECD. 2013d. “Trade Costs: What Have we Learned?” Trade Policy Paper 150, OECD.
OECD. Forthcoming. Aid for Trade in Action. Paris: OECD.
Olken, B., and P. Barron. 2009. “The Simple Economics of Extortion: Evidence from
Trucking in Aceh.” Journal of Political Economy, 117(3): 417-452.
Pasadilla, G., and B. Shepherd. 2012. “Trade in Services and Human Development: A
First Look at the Links.” In P. Sauvé, G. Pasadilla, and M. Mikic (eds.). Service Sector
Reforms: Asia-Pacific Perspectives. Bangkok: United Nations.
Pavcnik, N. 2002. “Trade Liberalization, Exit, and Productivity Improvement: Evidence
from Chilean Plants.” Review of Economic Studies, 69(1): 245-276.
Porto, G., N. Depetris Chauvin, and M. Olarreaga. 2011. Supply Chains in Export
Agriculture, Competition, and Poverty in Sub-Saharan Africa. Washington, D.C.:
World Bank.
Saslavsky, D., and B. Shepherd. 2012. “Facilitating International Production Networks:
The Role of Trade Logistics.” Policy Research Working Paper 6224, World Bank.
Shepherd, B. 2009. “Speed Money: Time, Corruption, and Trade.” Working Paper.
http://mpra.ub.uni-muenchen.de/17337/.

REFERENCES – 63
AID FOR TRADE AND VALUE CHAINS IN TRANSPORT AND LOGISTICS © OECD/WTO 2013
Shepherd, B. 2010. “Geographical Diversification of Developing Country Exports.”
World Development, 38(9): 1217-1228.
Shepherd, B. 2011. “Logistics Costs and Competitiveness: Measurement and Trade
Policy Applications.” Transport Research Support Working Paper, World Bank.
http://siteresources.worldbank.org/INTTRANSPORT/Resources/336291-
1239112757744/5997693-1294344242332/Logistics_costs.pdf.
Shepherd, B. and S. Stone. Forthcoming. “Global Production Networks and Employment:
A Developing Country Perspective.” Trade Working Paper, OECD.
UEMOA. 2012. 21st Road Governance Report. UEMOA.
USITC. 2010. “ASEAN: Regional Trends in Economic Integration, Export
Competitiveness, and Inbound Investment for Selected Industries.” Publication No.
4176, USITC. www.usitc.gov/publications/332/pub4176.pdf.
WEF. 2012. Global Enabling Trade Report 2012. Geneva: World Economic Forum.


ANNEX A. INDICATOR S OF DELAY – AN OVERVIEW – 65
AID FOR TRADE AND VALUE CHAINS IN TRANSPORT AND LOGISTICS © OECD/WTO 2013
Annex A
Indicators of delay - An overview
Single country sources
Border waiting times
Some countries maintain data on wait times for commercial vehicles at individual
border crossings. Among developed countries, the USA and Canada have particularly
detailed information available. Some developing countries also maintain such data,
although coverage tends to be patchy and limited to crossings of particular interest for
development projects, where ex ante and ex post observations are taken.
An example of the project-driven approach to tracking delays—not just at borders but
more broadly through the land supply chain—is the Borderless West Africa initiative
(www.borderlesswa.com). UEMOA (2012) provides a detailed breakdown of
checkpoints, bribes, and delays faced by road transport operators in fourteen important
corridors in the West African region. Data have been measured quarterly starting in 2009,
and are publicly reported. By dealing with issues like checkpoints and unofficial
payments, as well as pure border delays, this approach provides a good example of the
ways in which specific development projects can drive greater awareness of supply chain
issues at a policy level.
Because of the national specificities involved in operating individual border
crossings, these data tend to be highly specific and not easily comparable across
countries. There is therefore no single international source that compiles all available
information. The International Road Transport Union houses a Border Waiting Times
Observatory (www.iru.org/bwt-app), but it only covers certain countries in Europe and
Asia.
From the point of view of individual projects, it is often important to measure not just
congestion-related wait times, and those that are due to red tape and inefficient border
processes, but also those that arise due to regulatory differences between countries. In
some neighboring countries in Africa, for instance, load limits and certification
requirements are different, and cargo has to be unloaded and reloaded at border crossings.
These operations often add significant time and cost to the overall delay experienced by
operators.
Time release studies9
Matsuda (2012) describes the methodology behind the World Customs Organization’s
Time Release Studies (TRS). The TRS is a unique tool and method for measuring the
actual performance of customs activities as they directly relate to trade facilitation at the
border. The TRS thereby measures relevant aspects of the effectiveness of operational
procedures that are carried out by customs and other regulatory actors in the standard
9 This section is based on material provided by the World Customs Organization.

66 – ANNEX A. INDICATOR S OF DELAY – AN OVERVIEW
AID FOR TRADE AND VALUE CHAINS IN TRANSPORT AND LOGISTICS © OECD/WTO 2013
processing of imports, exports, and in transit movements. It seeks to accurately measure
these elements of trade flows so that related decisions to improve such performance can
be properly conceived and carried out. The main purpose of the TRS is, therefore, to
determine where delays exist in the process of releasing goods (types of delays, reasons
for the delays, etc.) and, finally, to propose solutions.
This tool was developed in 1994 and updated in 2011. It provides World Customs
Organization (WCO) members with a methodology divided into three phases: preparation
of the study, collection and analysis of data, and drafting and validation of the study
report. The study results assist customs administrations in identifying the constraints
affecting the release of goods, in considering corrective actions, in identifying areas
requiring simplification of procedures, as well as in establishing client charters and
customs standards.
Box A.1 TRS-led reform in a landlocked developing country
The Uganda Revenue Authority adopted a customs modernization plan for 2006-2009, focusing on four
main areas: business process reform; improved communication; having a professional workforce; and
developing an improved working environment. A TRS, conducted in 2008, was a crucial part of the overall
reform process. A special TRS Task Force was created, which brought together various government agencies, as
well as the private sector, through associations of traders and freight forwarders. The WCO’s support was crucial
in providing both the TRS methodology and expertise to help implement it on the ground.
Benefits from the TRS as an impetus to reform of customs and border procedures included:
Uganda Customs was given a baseline measure for the time taken to clear shipments.
The TRS helped stakeholders identify areas to improve in customs and border procedures, and these
findings drove process re-engineering of the relevant procedures.
Specific initiatives were put in place to deal with the problems brought to light by the TRS. In
addition to process re-engineering, other examples include: introduction of joint border management
at selected posts; initiation of an accreditation process; and selective introduction of 24-hour
operations to provide better customer service.
Source: www.oecd.org/aidfortrade/47799918.pdf.
The TRS is normally for internal use, and due to the specificity of national
procedures, results are not easily comparable from one country to another. Customs
administrations do not have to involve the WCO at all in national/regional TRS exercises.
However, a substantial number of countries have either already received or will benefit
from WCO technical assistance on the TRS. Possible outcomes include: restructuring
within the customs administration, drafting or modifying customs legislation, simplifying
and automating customs procedures, reallocating resources, resolving matters with other
agencies involved in the clearance of goods, or providing a basis for Single
Window/Coordinated Border Management solutions.

ANNEX A. INDICATOR S OF DELAY – AN OVERVIEW – 67
AID FOR TRADE AND VALUE CHAINS IN TRANSPORT AND LOGISTICS © OECD/WTO 2013
Cross-country sources
Doing business data
The Trading across Borders component of the World Bank’s Doing Business database
contains information on export and import times. The data reported are based on a
hypothetical transaction involving a standardized cargo of goods transported by sea;
however, the trade times do not include ocean transit, but are limited to pre-shipment
times. Export and import times include the time necessary for: obtaining all necessary
documents; inland transit (from the seller’s location to the port) and handling; customs
clearance and inspections; and port and terminal handling. To obtain these data, the
World Bank administers a survey to freight forwarders and trade facilitators. Initially, the
sample involved 345 professionals with at least two per country, and conference calls
were used as a follow-up device. In some cases, the data were cross-checked with
customs and port authorities (Djankov et al., 2010).
Since the Doing Business data are based on one, hypothetical transaction, and focus
on official times, they tend to represent an upper bound on the actual export and import
times faced by traders. The World Bank’s LPI takes a different but complementary
approach to measurement, which we discuss in the next sub-section. In terms of the
sources of delay in the Doing Business data, it is possible to break down the information
for each country into the parts due to each of the measured components (see above).
Taking Thailand as a representative example of a developing country heavily involved in
GVCs, the Doing Business data for 2012 record a total export time of 14 days. Of those
14 days, over half (eight days) is accounted for by document preparation. This result is
quite typical, and emphasizes the importance of red tape barriers in calculating the Doing
Business trade times. The other components account for respectively one day (customs
clearance and technical control), three days (port and terminal handling), and two days
(inland transit and handling). The contrast with a country like the Central African
Republic, which is landlocked and not heavily involved in GVCs is striking: total export
time is 54 days, which breaks down into almost even proportions of inland transportation
and handling (24 days)10
and document preparation (23 days), with the remaining
procedures taking much less time (four days for customs clearance and technical control,
and three days for ports and terminal handling).
Logistics performance index
The World Bank’s LPI project takes a fundamentally different approach from the
other tools discussed so far. It has two components: the International LPI and the
Domestic LPI. Both components are now available for three years (2007, 2010, and 2012)
and new indicators will be released in early 2014. Together, the various aspects of the LPI
project aim to provide the most comprehensive cross-country data currently available on
multi-dimensional logistics performance. In this subsection, we focus on the parts of the
LPI that deal with delays and their sources.
The International LPI is a perception index based on survey responses from over
1,000 logistics professionals located in 150+ countries around the world. They provide
10
Transportation times tend to be very long for landlocked countries because Doing Business counts not just
the time required to reach the national border, but the full time needed for goods to arrive in the
nearest port, including transit across one or more third countries, with all the additional controls and
distance that implies.

68 – ANNEX A. INDICATOR S OF DELAY – AN OVERVIEW
AID FOR TRADE AND VALUE CHAINS IN TRANSPORT AND LOGISTICS © OECD/WTO 2013
index scores for up to eight countries they trade with, ranging from one (low
performance) to five (high performance). The index scores cover six core areas of
logistics performance: the efficiency of the clearance process; the quality of trade and
transport infrastructure; the ease of arranging competitively-priced shipments; the
competence and quality of logistics services; the ability to track and trace consignments;
and the timeliness of delivery. The final index is a weighted average of these six scores.
In addition to the one to five score provided by the International LPI’s timeliness
index, the Domestic LPI—in which the same survey respondents evaluate performance in
their own countries—also has useful information about trade times and delays. First, it
contains quantitative data on import and export lead times, distinguishing between land
supply chains and maritime/air supply chains. Export lead times measure the time taken
to move goods from the seller’s factory to the port of loading, or equivalent location.
Import lead times similarly measure the time taken to move goods from the arrival
terminal or equivalent location through border customs clearance in the importing
country. In both cases, respondents are asked to estimate both median and best (top 10%)
lead times, using, in all cases, data on actual shipments. The LPI time data therefore differ
from the Doing Business data in that they capture different processes and are based on
actual shipments, rather than estimated times based on the expected time to complete
official procedures. The Doing Business data can therefore be seen primarily as indicators
of the red tape burdens associated with exporting and importing, whereas the LPI data try
to capture commercial realities on the ground. The two approaches are strongly
complementary.
In addition to the quantitative data on import and export lead times, the Domestic LPI
also contains information on the prevalence and extent of various sources of delay. First,
there is a question asking respondents to estimate the average time taken between
submission of an accepted customs declaration and notification of clearance through
customs, both with and without physical inspection. Second, respondents are also asked
how often they experience major delays due to: compulsory warehousing/transloading;
pre-shipment inspection; and maritime transshipment. They answer on a scale ranging
from “nearly always” to “hardly ever”.
Composite indices
In addition to data sources like Doing Business and the LPI, there are also two other
indices that are commonly used to assess the performance of the trading environment: the
World Economic Forum’s (WEF) Global Enabling Trade Index (ETI), and the DHL
Global Connectedness Index (GCI), as well as a set of indicators specifically related to
border processes, the OECD Trade Facilitation Indicators (TFI). These three indices are
dealt with separately because they are essentially data aggregators rather than original
data on the state of transport and logistics.
The ETI (WEF, 2012) uses a variety of sources, primarily the WEF’s own executive
opinion survey, Doing Business, and the LPI, to produce an overall composite index and
a number of more specific sub-indices summarizing the friendliness of the trading
environment in 132 economies. Each index is a weighted average of data drawn from
other sources. It is therefore informative about various aspects of the trading
environment—including transport and logistics—and is sometimes used as a performance
indicator by governments, in combination with other data. However, it does not provide
hard data on the sources and extent of delays, or their impacts.

ANNEX A. INDICATOR S OF DELAY – AN OVERVIEW – 69
AID FOR TRADE AND VALUE CHAINS IN TRANSPORT AND LOGISTICS © OECD/WTO 2013
The DHL index takes a broadly similar approach, focusing on summarizing the extent
of globalization around the world. It brings together data from sources such as the United
Nations, the World Bank, the IMF, the OECD, and the WTO. Apart from its intrinsic
value as an indicator of the extent to which globalization is affecting different economies,
the GCI also makes abundantly clear the importance of free and open global markets to
companies directly involved in transport and logistics, like DHL itself. According to the
company’s CEO in his preface to the 2012 report: “Global connectedness is part of the
fabric of our organization” (DHL, 2012).
The TFI set is composed of sixteen trade facilitation indicators covering the full
spectrum of border procedures under negotiation at the WTO, in order to estimate the
impact of these procedures on trade volumes and trade costs in 133 countries across
income levels, geographical regions and development stages. Values for indicators are
drawn from publicly available data and subsequently fact-checked with concerned
governments. Their objective is to provide a basis for governments to prioritize trade
facilitation actions and mobilize technical assistance and capacity-building efforts for
developing countries in a more targeted way (OECD 2013c).

Front cover photos courtesy of Shutterstock; ©Dmitry Kalinovsky, ©MJ Prototype, and the World Bank; © Dominic Sansoni, ©Ray Witlin
The study highlights that in some cases, transport and logistics accounts for 20-60% of the cost of a final good. Though there have been improvements across regions in recent years. Major constraints include transport infrastructure, customs and border procedures and regulations, red tape and governance issues. The report indicates that, although aid-for-trade flows to infrastructure are still substantial, support declined in 2011. Furthermore, there is a need to increase coordination and collaboration between donors, partners and the private sector.
Contents
1. Why do transport and logistics matter for development?
2. Measuring delays and their impacts: The toolkit
3. Emerging trends: Where and why is progress being made?
4. Ensuring alignment and maximizing impact of aid for trade
5. Conclusions
Annex A. Indicators of delay - An overview
AID FOR TRADE AND VALUE CHAINS IN TRANSPORT AND LOGISTICS