aiko barsch metabolomics thessaloniki how to link hram...
TRANSCRIPT
METABOSCAPE – A METABOLITE PROFILING PIPELINE DRIVEN BY AUTOMATIC COMPOUND IDENTIFICATION
OR
HOW TO LINK HRAM QTOF PLANT METABOLOMICS DATA TO BIOLOGY
Aiko Barsch, Bruker Daltonics, Bremen, Germany
1
Outline
• If you want to automate data processingworkflows in Metabolomics you have to be ableto rely on the raw data.
• Introducing MetaboScape. Turning MS data into knowledge!
• An example studying the “war” between plants and insects!

Automatic data processing workflows in Metabolomics rely on the raw data quality
• The metabolome is an extremely complex mixture of chemically diverse small molecules covering a large dynamic range of concentrations.
• Robustness and Sensitivity and Dynamic range and High resolution, mass accuracy and isotopic fidelity in one scan mode at LC speed is absolute must in metabolomics.
• So, lets have a look at the capabilities of a QTOF instrument. Can this technology fulfill these needs?

Sample Injection #1
Sample Injection #100
selected BPCs from sequence of human urine sample injected 100 times
3 4 5 6 7 Time [min]0.0
0.2
0.4
0.6
0.8
6x10
Intens.
Phenylalanine peak
Peak Area
Average 730594
StDEV 19720
CV 2.70
Peak area for phenylalanine deviates less than 3% (n=100 injections).
Instrument robustness: >100 injections of complex human Urine sample

3 4 5 6 7 Time [min]0.0
0.2
0.4
0.6
0.8
6x10
Intens.
166.0863
1+
167.08971+
+MS, 2.89-2.96min #834-855
0.0
0.5
1.0
1.5
2.0
5x10
Intens.
166 167 168 169 m/z
Example - Phenylalanine: SmartFormula provides the correct molecular formula based on accurate mass and isotopic pattern fit: C9H12O2
-0.2 ppm mass accuracy
25882 Resolution

SmartFormula makes use of the perfect fit between measured and simulated spectrum
+MS, 2.88-2.97min #830-857
166.08631+
167.0894
1+
C₉H₁₂NO₂, 166.0863
0.0
0.5
1.0
1.5
5x10
Intens.
166 167 168 169 170 m/z
+MS, 2.88-2.97min #830-857
167.0894
1+
168.09171+
C₉H₁₂NO₂, 166.0863
0.0
0.5
1.0
1.5
2.0
4x10
Intens.
167.00 167.50 168.00 m/zzoom
Measured
Simulated
expressed in a low mSigma valueMass accuracy & isotopic fidelity
= confidence in ID

1.5 2.0 2.5 3.0 3.5 4.0 4.5 5.0 Time [min]
0
1
2
3
4
5x10
Intens.
Target compound spiked into the human urine sample can be detected by creating a high resolution EIC trace for the target mass 169.0495m/z.
EIC for vanillicacid
BPC
Reliable ID of target compoundsvanillic acid spiked into the urine sample
Detection by high resolution EIC
Basis for hrEIC=
mass stability across entire dynamic
concentration range

Human urine sample spiked with vanillic acid� Impact II� 4296 MS/MS spectra
acquired at this sample complexity level
200
400
600
800
m/z
2 4 6 8 10 Time [min]
200
400
600
800
m/z
2 4 6 8 10 Time [min]
Time
m/z
Survey View
Impact II - High dynamic range in MS/MS: up to 50Hz instrument scan speed combined with easy to use Instant Expertise software
All precursor ions fragmented in “one shot” acquisition.
MS/MS Spectrum acquired

200
400
600
800
m/z
2 4 6 8 10 Time [min]
120
140
160
180
200
m/z
4.0 4.2 4.4 4.6 4.8 Time [min]
zoom
105.0332
1+
125.05981+
180.0653
1+
169.0494
1+
1. +MS, 4.40-4.42min #1787-1795
39.0229
1+
65.03831+
81.03381+
93.0331
1+
111.0439
1+
125.05971+ 151.0388
1+
1. +MS2(169.0494), 20.0-50.0eV, 4.41-4.43min #1788-17960.0
0.5
1.0
1.5
2.0
2.5
4x10
Intens.
0.00
0.25
0.50
0.75
1.00
1.25
1.504x10
20 40 60 80 100 120 140 160 180 m/z
The target mass 169.0495m/z of the vanillic acid precursor was fragmented successfully.
Instant Expertise selected vanillic acid spiked into the sample for MS/MS fragmentation
0
1
2
3
4
5x10
Intens.
0
1
2
3
4
5
5x10
3.2 3.4 3.6 3.8 4.0 4.2 4.4 4.6Time [min]
0
2
4
6
4x10
Intens.
0
1
2
3
4x10
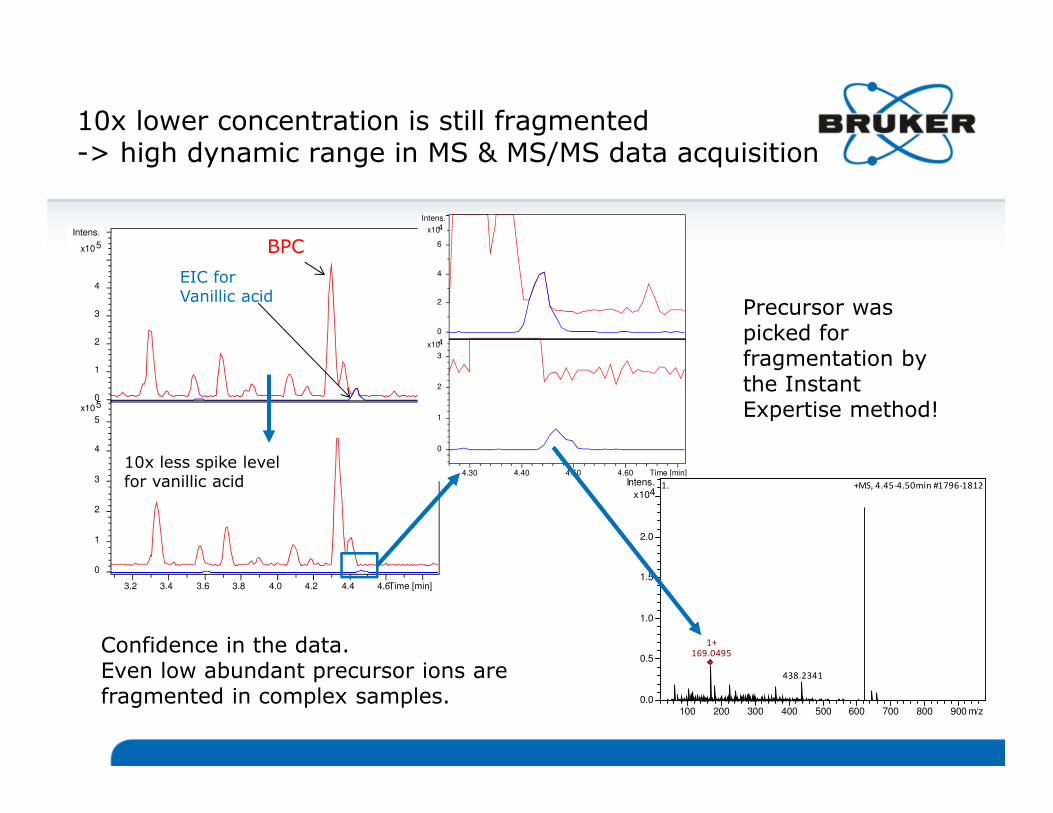
4.30 4.40 4.50 4.60 Time [min]10x less spike level for vanillic acid
EIC for Vanillic acid
BPC
438.2341
169.04951+
1. +MS, 4.45-4.50min #1796-1812
0.0
0.5
1.0
1.5
2.0
4x10
Intens.
100 200 300 400 500 600 700 800 900 m/z
Precursor was picked for fragmentation by the Instant Expertise method!
10x lower concentration is still fragmented-> high dynamic range in MS & MS/MS data acquisition
Confidence in the data.Even low abundant precursor ions are fragmented in complex samples.

105.0336
131.9741158.9623
180.0656
202.0480
169.04951+
1. +MS, 4.45-4.50min #1796-1812
111.04381+
125.0591
151.0391
1+
1. +MS2(169.0495), 20.0-50.0eV, 4.46-4.50min #1797-1813
111.0440
125.0597
136.0155
151.0394
169.0495
O
OH
O
OH
1. HMDB Library: Vanillic acid - HMDB00484, oTOF ESI +MS2(169.049), 20.0eV (P: 789, F: 833, R: 790, M: 1000)
0
1000
2000
3000
4000
5000
Intens.
0
250
500
750
1000
1250
0
100
200
300
100 120 140 160 180 200 m/z
0
1
2
3
4
5x10
Intens.
0
1
2
3
4
5
5x10
3.2 3.4 3.6 3.8 4.0 4.2 4.4 4.6Time [min]
10x less spiked level for vanillic acid
EIC for Vanillic acid
BPC
MS
MS/MS
Library MS/MS
MS/MS spectrum enables identification via Bruker HMDB Metabolite Library query
MS/MS data acquired permits confident ID via spectral library query.In this case via the Bruker HMDB Metabolite Library.

Acquired in collaboration with the “HMDB team“ at the University of Alberta. Lead by Profs. Liang Li and David Wishart.
• ~800 pure reference standards , measured on an impact HD QTOF• up to 5 different collision energies, each mass spectrum manually curated
Perfect matching between Library and experimental spectrum.
Germany
Canada
Deeper insights with the Bruker HMDB Metabolite Library“Human Metabolome Data Base” (HMDB)
April 18, 2016 14
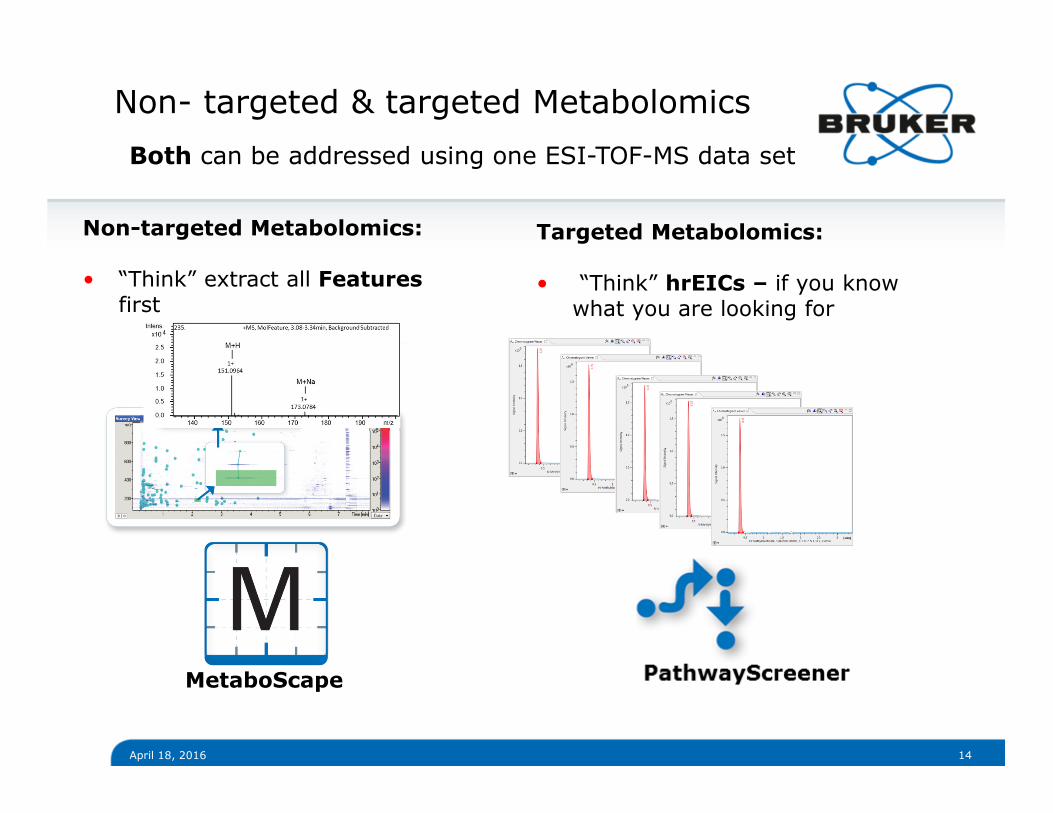
Targeted Metabolomics:
• “Think” hrEICs – if you know what you are looking for
Non-targeted Metabolomics:
• “Think” extract all Features first
MetaboScape
Non- targeted & targeted Metabolomics
Both can be addressed using one ESI-TOF-MS data set
Acknowledgement
Max Planck Society
The study presented was conducted in collaboration with
Sven Heiling, Klaus Gase, Ian T. BaldwinMax Planck Institute for Chemical Ecology, MolecularEcology Department, Jena, Germany
Emmanuel GaquerelCentre for Organismal Studies Heidelberg,Plant Defense Metabolism Research Group, Heidelberg,Germany

wounding by herbivory
jasmonic acid
(conjugates)
- Specialist Manduca sexta – mayor pest on various
solanaceae species
- feeds on green leaf material
activation of defense
metabolites like nicotine, rutin,
chlorogenic acid and
HGL-DTGs
© Danny Kessler
Introduction – tobacco plants have enemies…Manduca sexta induces the Jasmonic acid pathway which activates plant defense mechanisms
Jasm
onic
acid
path
wa
y

CH3
CH3
OH
CH3
CH3
OH
DMAPP3 × IPPCH3
CH3
OPP
NaGGPPS
Introduction 17-HGL-DTG biosynthesis
CH2
CH3
OPP
MEP
DXP
HMBPP
GA3P +
pyruvate
GGPP
17-Hydroxygeranyllinalool
NaGLS
CYP71
Chloroplast
Cytosol
Lyciumoside I
CH3
CH3
CH3
CH3
O
O
OH
OH
OH
OH
OO
OH
OH
OH
OH
NaGT1/
NaGT2
CH3
CH3
CH3
CH3
O
O
OH
OH
OH
OH
OO
OH
OH
O
OH
O
OH
OH
OH
OH
Lyciumoside II
NaGT1/
NaGT2
NaRT1 CH3
CH3
CH3
CH3
O
O
OH
OH
O
OH
OO
OH
OH
OH
OH
O CH3
OH
OH
OH
Lyciumoside IV
NaRT1CH3
CH3
CH3
CH3
O
O
OH
OH
O
OH
OO
OH
OH
O
OH
O
OH
OH
OH
OH
O CH3
OH
OH
OH
Attenoside
MATMAT
MATMAT
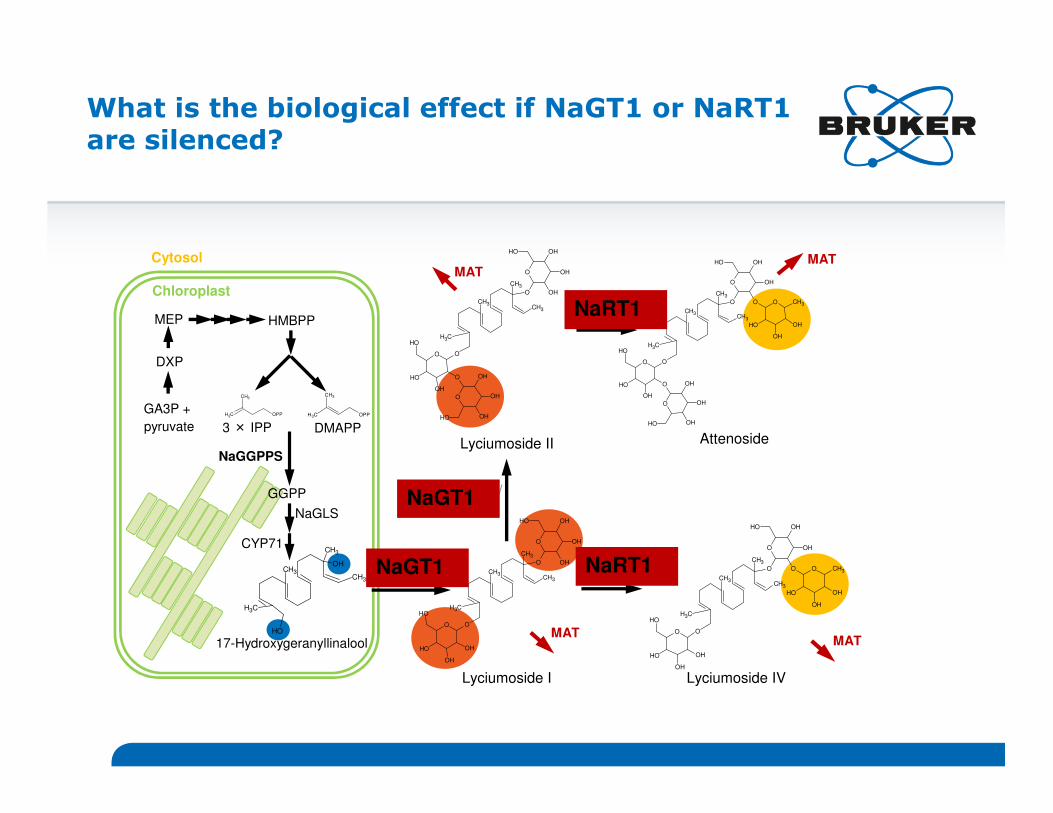
- 17-HGL is glucosylated at C-3 and C-17 hydroxy groups- HGL-DTGs can be further glycosylated by either glucose or
rhamnose- HGL-DTGs can be malonylated up to three times- Until now we identified 46 HGL-DTGs in N. attenuata
NaRT1
NaGT1
These 2 genes will be important later in this talk

Databases of HRAM MS features
In-house database
Alkaloids
Polyamides Flavonoids
HGL-DTGs>46
Acyl sugars
0 5 10 15 20 25 30 35 40 Time [min]0
1
2
3
Inte
nsity ×
10
5
+MS, BPC of N. attenuata
- high resolution mass spectrometry database
- 137 HGL-DTGs in 35 different solanaceous species
- 46 HGL-DTGs in N. attenuata
- detailed fragmentation information (IS-CID, MS, MS/MS) leading to 955 non-redundant explained fragments
- 30 polyamides- 15 acyl sugars- 15 flavonoids- 7 amino acids- 4 alkaloids- others
In-house database

• Silencing NaGGPPS decreases the total HGL-DTG concentration• Total HGL-DTGs have a significant effect on the growth of the specialist
herbivore M. sexta
Ecological function of HGL-DTGs
Heiling et al. 2010, The Plant Cell, 22, 273-292
Chloroplast
Cytosol
DMAPP3 × IPPCH3
CH3
OPP
NaGGPPS
CH2
CH3
OPP
MEP
DXP
HMBPP
GA3P +
pyruvate
GGPP
CH3
CH3
OH
CH3
CH3
OH
17-Hydroxygeranyllinalool
NaGLS
CYP71
CH3
CH3
OH
CH3
CH3
OH
DMAPP3 × IPPCH3
CH3
OPP
NaGGPPS
What is the biological effect if NaGT1 or NaRT1 are silenced?
CH2
CH3
OPP
MEP
DXP
HMBPP
GA3P +
pyruvate
GGPP
17-Hydroxygeranyllinalool
NaGLS
CYP71
Chloroplast
Cytosol
Lyciumoside I
CH3
CH3
CH3
CH3
O
O
OH
OH
OH
OH
OO
OH
OH
OH
OH
NaGT1/
NaGT2
CH3
CH3
CH3
CH3
O
O
OH
OH
OH
OH
OO
OH
OH
O
OH
O
OH
OH
OH
OH
Lyciumoside II
NaGT1/
NaGT2
NaRT1 CH3
CH3
CH3
CH3
O
O
OH
OH
O
OH
OO
OH
OH
OH
OH
O CH3
OH
OH
OH
Lyciumoside IV
NaRT1CH3
CH3
CH3
CH3
O
O
OH
OH
O
OH
OO
OH
OH
O
OH
O
OH
OH
OH
OH
O CH3
OH
OH
OH
Attenoside
MATMAT
MATMAT
NaRT1
NaGT1
NaGT1
NaRT1

WT
NaRT1
Pathway designed by Sven Heiling with PathVisio
XX
X
Metabolites
Proteins
“Silencing” NaRT1 has no visible effect on the plant phenotype
“Silencing” NaRT1
– no visible effect on Phenotype, i.e. the “look of the plant”
- what about the metabolome?
NaRT1
„HGL-DTG biosynthesis“

WT
NaGT1
Pathway designed by Sven Heiling with PathVisio
X
X X
X
X
“Silencing” NaGT1
– severe phenotype, buds mostly stalled, multiple branching
- what about the metabolome?
„HGL-DTG biosynthesis“
NaGT1
“Silencing” NaGT1 causes a severe plant phenotype, buds mostly stalled, multiple branching

Metabolic profiling of WT, GT1 & RT1 tobacco plants
RT1
WT
GT1
Seamless data acquisition of LC-MS/MS measurements for the three N. attenuata lines via impact II & Instant ExpertiseTM
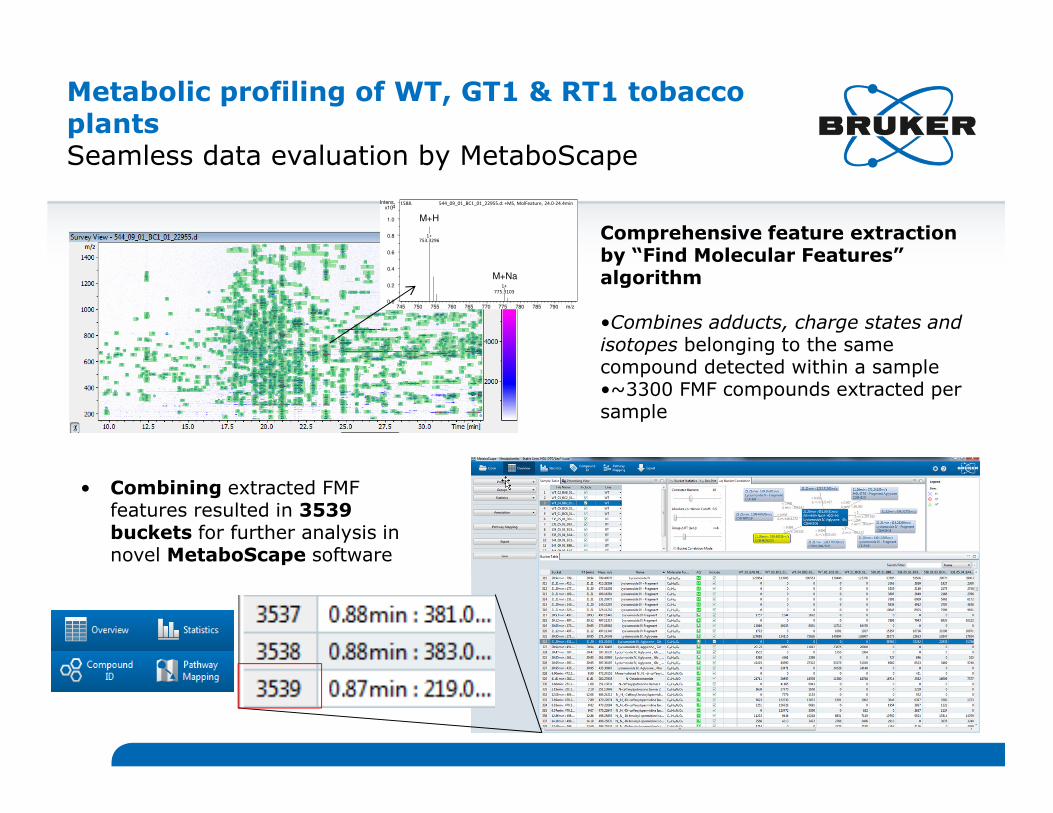
• Combining extracted FMF features resulted in 3539 buckets for further analysis in novel MetaboScape software
Comprehensive feature extraction by “Find Molecular Features” algorithm
•Combines adducts, charge states and isotopes belonging to the same compound detected within a sample•~3300 FMF compounds extracted per sample
753.32961+
775.3103
1+
M+H
M+Na
1588. 544_09_01_BC1_01_22955.d: +MS, MolFeature, 24.0-24.4min
0.0
0.2
0.4
0.6
0.8
1.0
4x10Intens.
745 750 755 760 765 770 775 780 785 790 m/z
Metabolic profiling of WT, GT1 & RT1 tobacco plants Seamless data evaluation by MetaboScape

Automatic identification of known compound >550 bucketsFast and confident de-replication using in-house DB
• 3539 buckets from extracted FMF features in HRAM LC-MS data of samples from WT, GT1 and RT
• Database in simple CSV format of 561 fragments consists of molecular formula, name and retention time
• MetaboScape – with one push of a button: Automatically & confidently annotate 561 buckets
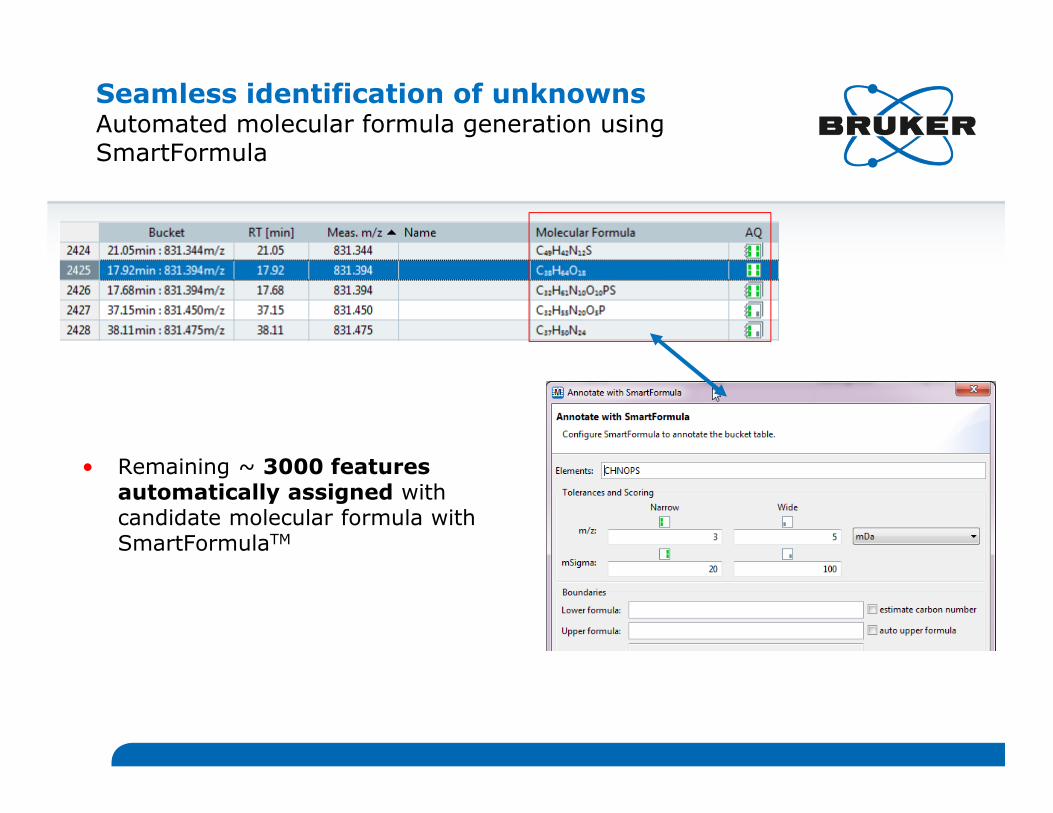
Seamless identification of unknowns Automated molecular formula generation using SmartFormula
• Remaining ~ 3000 features automatically assigned with candidate molecular formula with SmartFormulaTM
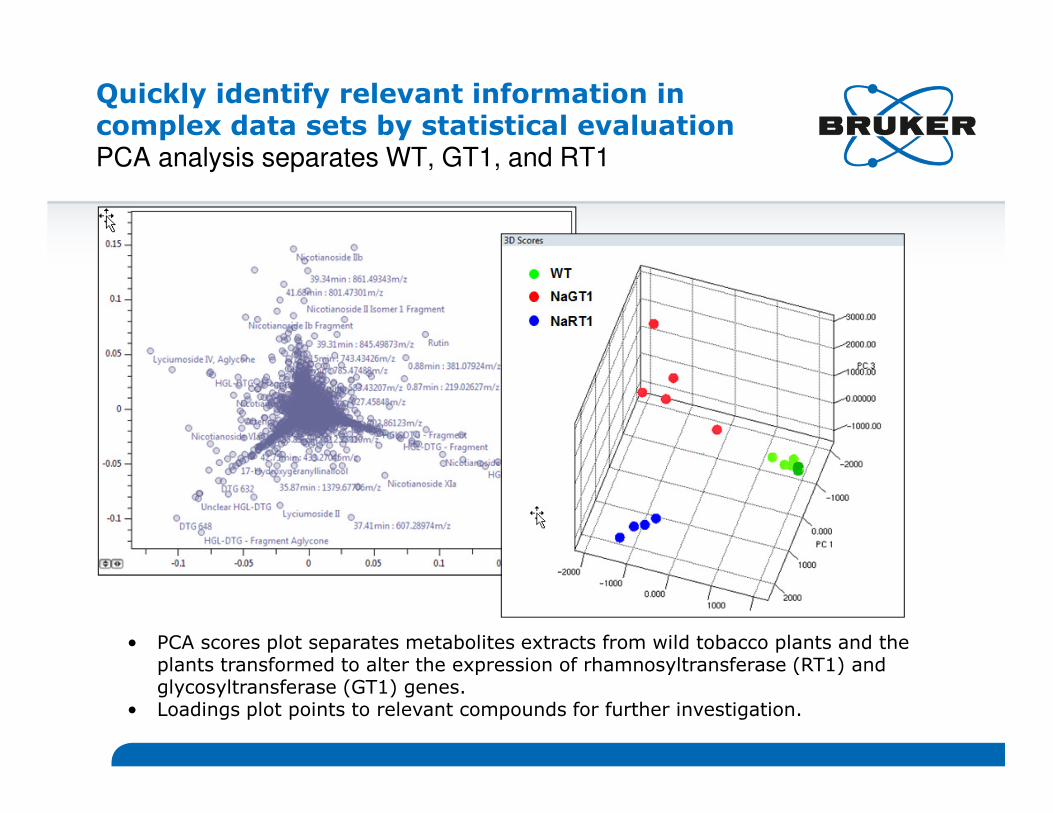
Quickly identify relevant information in complex data sets by statistical evaluation PCA analysis separates WT, GT1, and RT1
• PCA scores plot separates metabolites extracts from wild tobacco plants and the plants transformed to alter the expression of rhamnosyltransferase (RT1) and glycosyltransferase (GT1) genes.
• Loadings plot points to relevant compounds for further investigation.

Seamless identification of relevant compounds Automated molecular formula generation using SmartFormula & structural assignment through DB query
• ~ 3000 features automatically assigned with candidate molecular formula with SmartFormulaTM
• Followed by structural assignment through public database (KEGG*, CheBI, PubChem) queries.
SmartFormulaTM
*

WT
NaRT1
Pathway designed by Sven Heiling with PathVisio
XX
X
Metabolites
Proteins
“Silencing” NaRT1
– no visible effect on Phenotype, i.e. the “look of the plant”
- what about the metabolome?
NaRT1
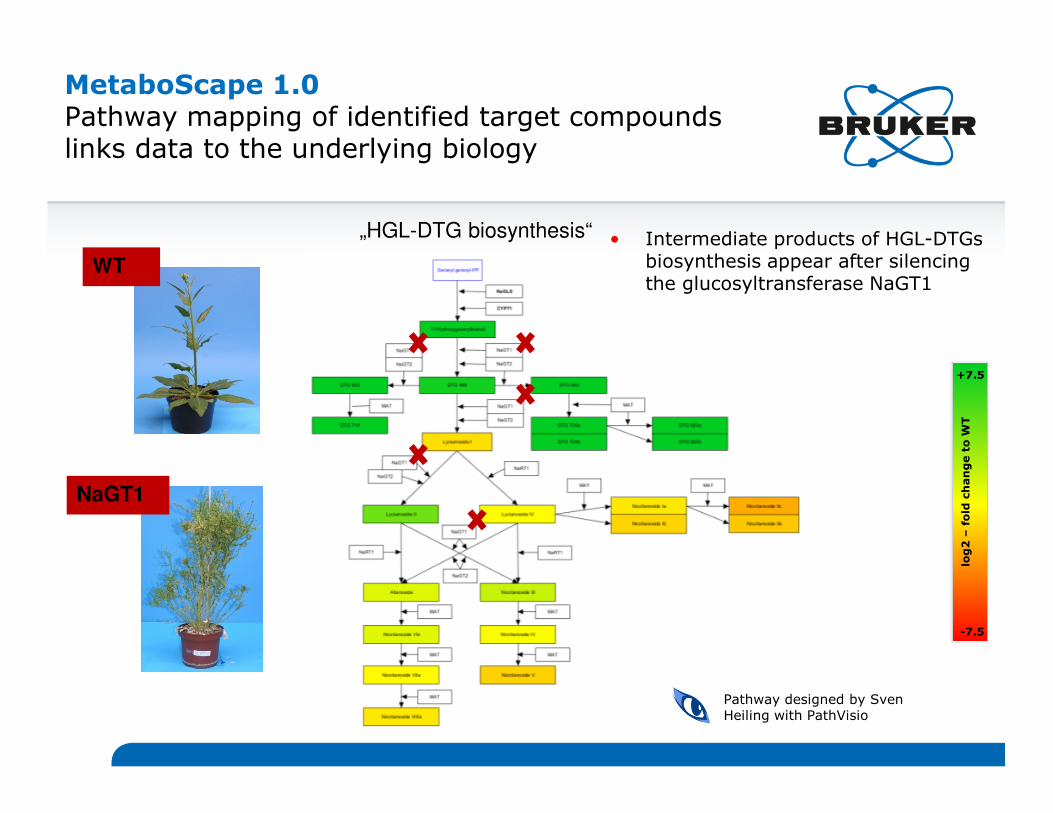
MetaboScape 1.0Pathway mapping of identified target compoundslinks data to the underlying biology
„HGL-DTG biosynthesis“

MetaboScape 1.0Pathway mapping of identified target compoundslinks data to the underlying biology
log
2 –
fold
ch
an
ge t
oW
T
+10
-10
WT
NaRT1
Pathway designed by Sven Heiling with PathVisio
• Silencing rhamnosyltransferase (NaRT1) leads to complete reduction of all HGL-DTGs with rhamnose
• Silencing rhamnosyltransferase (NaRT1) leads to increase in precursor metabolites
„HGL-DTG biosynthesis“

WT
NaGT1
Pathway designed by Sven Heiling with PathVisio
X
X X
X
X
“Silencing” NaGT1
– severe phenotype, buds mostly stalled, multiple branching
- what about the metabolome?
MetaboScape 1.0Pathway mapping of identified target compoundslinks data to the underlying biology
„HGL-DTG biosynthesis“
log
2 –
fold
ch
an
ge t
o W
T
+7.5
-7.5
WT
NaGT1
Pathway designed by Sven Heiling with PathVisio
• Intermediate products of HGL-DTGs biosynthesis appear after silencing the glucosyltransferase NaGT1
MetaboScape 1.0Pathway mapping of identified target compoundslinks data to the underlying biology
„HGL-DTG biosynthesis“

Outline -> Summary
• If you want to automate data processing workflows in Metabolomics you have to be able to rely on the raw data.
• Robustness and Sensitivity and Dynamic range and High resolution, mass accuracy and isotopic fidelity in one scan mode at LC speed is absolute must in Metabolomics: Impact II
• Introducing MetaboScape. Turning MS data into knowledge!
• MetaboScape combines statistical data mining, automatic compound identification routines, and pathway mapping functionalities for linking MS data to biology in discovery metabolomics.
• Here, enabling to detected and link diverse biological effects in genetically silenced lines of N. attenuata impaired in the biosynthetic steps of HGL-DTGs.

April 18, 2016 39
www.bruker.com
For research use only. Not for use in diagnostic procedures. Copyright © 2010 Bruker Daltonics. All rights reserved.