air-conditioning control of hems and bems toward cems€¦ · air-conditioning control of hems and...
TRANSCRIPT

Keio Univ. West Lab 0
Kyosuke Funami
Nishi Laboratory
Graduate School of Science and Technology, Keio University, Japan
Air-Conditioning Control of HEMS and BEMS
toward CEMS

Table of Contents
1. Introduction
2. KNIVES
3. Comfort Index PMV
4. Air-conditioning Control in HEMS/BEMS
5. Demonstration of BEMS/CEMS
6. Conclusion and Future Works
Keio Univ. West Lab 1

Introduction
Keio Univ. West Lab 2
Saving energy is indispensable to solve environmental problems.
Global warming by greenhouse gas
Exhaustion of fossil fuels
Fig.2 Power consumption rate of home appliance
Air conditioners account for one quarter of power consumption.
Energy consumption in a household and an office sector
increases rapidly.
Fig.1 Change of energy consumption in Japan

EMS(Energy Management System)
Keio Univ. West Lab 3
BEMS(Building Energy Management System)
Monitors total power consumption
Controls mainly air conditioners and lighting
Problem • Maintain comfort of people in the building
HEMS(Home Energy Management System)
Observes electric appliances in a house
Controls them by using a demand control terminal or HA
• Perform fine-grained control of the air conditioners Problem
※ HA : Home Automation terminal

Purpose
Keio Univ. West Lab 4
Consideration of air-conditioning controls other than ON/OFF control
Comparison with power consumption and comfort of three control methods
Experiment in real environment
• Environmental measurement and control ・・・ KNIVES (Keio university Network oriented Intelligent and Versatile Energy saving System)
• Comfort Index ・・・ PMV(Predicted Mean Vote)
Implement BEMS into the existing building
Maintain comfort while energy saving
Experiment in real environment
HEMS
BEMS
KNIVES
Keio Univ. West Lab 5
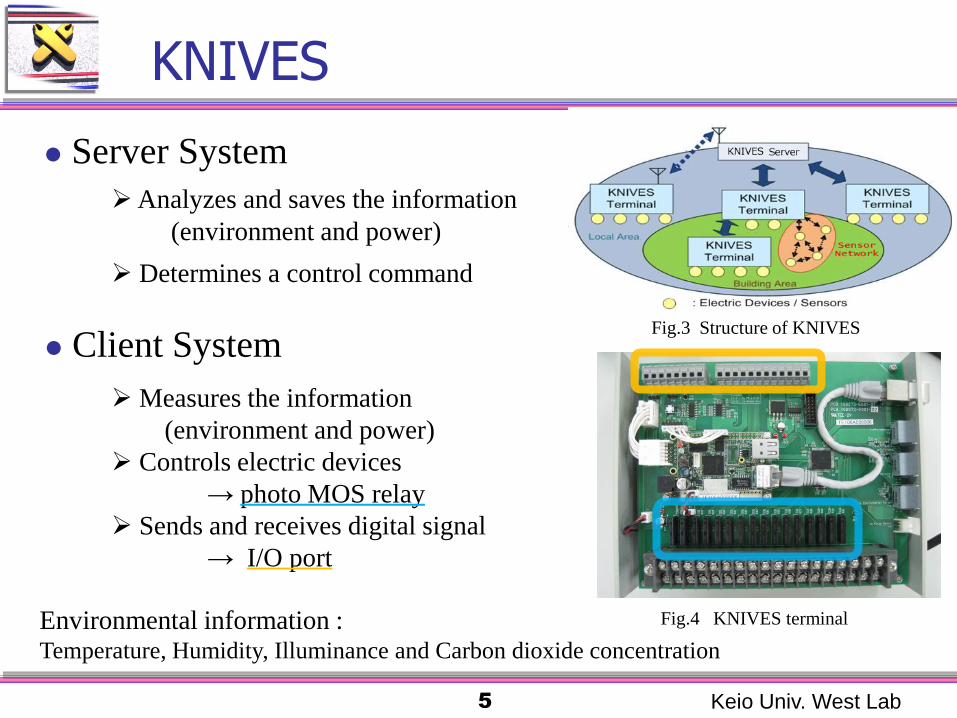
Server System
Fig.4 KNIVES terminal
Analyzes and saves the information
(environment and power)
Determines a control command
Client System
Measures the information
(environment and power)
Controls electric devices
→ photo MOS relay
Sends and receives digital signal
→ I/O port
Environmental information : Temperature, Humidity, Illuminance and Carbon dioxide concentration
Fig.3 Structure of KNIVES

Comfort Index PMV
Keio Univ. West Lab 6
Evaluated by measuring environment including physical and human elements
Takes values from -3(cold) to +3(hot)
ex. PMV = 0 comfortable
PMV(Predicted Mean Vote)
PMV value Sensation
+3 Hot
+2 Warm
+1 Slightly warm
0 Comfort
-1 Slightly cool
-2 Cool
-3 Cold
)028.0303.0(036.0 pM
ePMV
)( CRCreEreEsEdWM
M: metabolic rate(W/㎡) W:external work(W/㎡) Ed:heat loss by water vapor diffusion through skin(W/㎡) Es:rate of evaporative heat loss from skin(W/㎡) Ere:rate of evaporative heat loss from respiration(W/㎡) Cre: rate of convective heat loss from respiration (W/㎡) R:radiative heat loss from the surface of the clothed body(W/㎡) C: convective heat loss from the surface of the clothed body (W/㎡)
(1)
Physical elements : temperature, humidity, wind speed and MRT(Mean Radiant Temperature)
Human elements : amount of clothing and metabolic rate
Air-Conditioning control in HEMS/BEMS
Keio Univ. West Lab 7

Air-conditioning Control(1/2)
Keio Univ. West Lab 8
ON/OFF Control
Photo MOS relay turns on and off a compressor of the air
conditioner. Fig.4 KNIVES terminal
Fig.5 Infrared transmitter module
Fig.6 Demand control unit
Control Method
Infrared Control
The setting temperature is changed by sending infrared
signals from infrared transmitter module.
The module is connected with digital I/O port of KNIVES
terminal.
Inverter Control
The demand power is regulated through the special
demand control unit.
The power can be regulated into 0, 40, 80% and no control.

Air-conditioning Control(2/2)
Keio Univ. West Lab 9
Control Algorithm
control method
PMV value ON/OFF Infrared Inverter
PMV < -0.25 Power ON / 27 ˚C / No limitation
-0.25 < PMV < 0.00 Keeping previous
state
(temperature + 1)
˚C 80%
0.00 < PMV < 0.25 Keeping previous
state
(temperature)
˚C 40%
0.25 < PMV Power OFF (temperature - 1)
˚C 0%
Fig.7 Control Algorithm
TABLE I
Operation by each control method according to PMV value
ex. Infrared control
Temperature : 20 ˚C, PMV : -0.5
Temperature : 23 ˚C, PMV : -0.1
27 ˚C
24 ˚C
i : time count

Experiments
Keio Univ. West Lab 10
area 30m2
height 3.4m
volume 102m3
Experimental Environment
Measurement Sensor
temperature-humidity sensor
(temperature, humidity)
amenity meter
(wind speed)
Air conditioner rated heating capacity(kW)・・・ 5.6 (2.5~7.1)
rated power consumption(kW)・・・ 1.36
manufacturer・・・Daikin Industries, Ltd
Experimental Device
Fig.8 Setting place of the sensors •Top(2.9m)
•Middle(1.5m)
•Bottom(0.1m)
* PMV was calculated by using the central measured value.
Air Conditioner
Ceiling Light
Ventilating Fan
Temperature-Humidity Sensor Wind Speed Sensor

0
2
4
6
8
10
12
14
16
18
20
0 30 60 90 120 150 180 210
ON/OFF
Infrared
Inverter
-1.2
-1
-0.8
-0.6
-0.4
-0.2
0
0.2
0.4
0.6
0 30 60 90 120 150 180 210
ON/OFF
Infrared
Inverter
21
22
23
24
25
26
27
28
0
0.2
0.4
0.6
0.8
1
1.2
1.4
1.6
0 30 60 90 120 150 180 210
ON/OFF
Inverter
Infrared
Results of Experiments (ON/OFF Control)
Keio Univ. West Lab 11
• PMV is oscillated extremely.
• The oscillation can be reduced by narrowing
the difference of control thresholds of PMV.
• Total preparation time for operation is extended.
• Power consumption of the time is wasted.
Fig.10 Comparison of PMV
Fig.11 Power consumption
ON/OFF control
Time(min) Time(min)
Time(min)
Time(min) Time(min)
Time(min)
PM
V
Time(min)
Time(min)
ON
/OF
F(0
-1)
/ O
utp
ut
rate
Set
tin
g T
emp
eratu
re (℃
)
Pow
er C
on
sum
pti
on
(W
h)
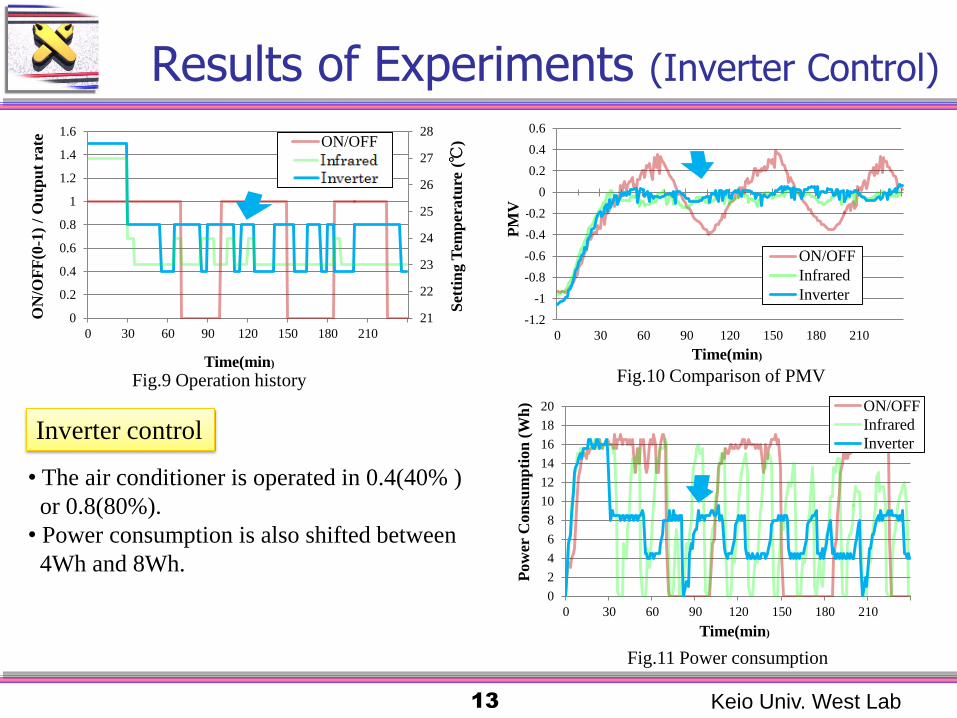
Fig.9 Operation history

0
2
4
6
8
10
12
14
16
18
20
0 30 60 90 120 150 180 210
ON/OFF
Infrared
Inverter
-1.2
-1
-0.8
-0.6
-0.4
-0.2
0
0.2
0.4
0.6
0 30 60 90 120 150 180 210
ON/OFF
Infrared
Inverter
21
22
23
24
25
26
27
28
0
0.2
0.4
0.6
0.8
1
1.2
1.4
1.6
0 30 60 90 120 150 180 210
ON/OFF
Inverter
Infrared
Results of Experiments (Infrared Control)
Keio Univ. West Lab 12
• The maximum value of accumulated power
consumption has decreased as PMV is close to
zero.
• The switching frequency of setting temperature
has decreased gradually.
Fig.10 Comparison of PMV
Fig.11 Power consumption
Infrared control
Time(min) Time(min)
Time(min)
Time(min) Time(min)
Time(min)
PM
V
Time(min) Time(min) Time(min)
Time(min)
Time(min)
ON
/OF
F(0
-1)
/ O
utp
ut
rate
Set
tin
g T
emp
eratu
re (℃
)
PM
V
Pow
er C
on
sum
pti
on
(W
h)
Fig.9 Operation history
0
2
4
6
8
10
12
14
16
18
20
0 30 60 90 120 150 180 210
ON/OFF
Infrared
Inverter
-1.2
-1
-0.8
-0.6
-0.4
-0.2
0
0.2
0.4
0.6
0 30 60 90 120 150 180 210
ON/OFF
Infrared
Inverter
21
22
23
24
25
26
27
28
0
0.2
0.4
0.6
0.8
1
1.2
1.4
1.6
0 30 60 90 120 150 180 210
ON/OFF
Inverter
Infrared
Results of Experiments (Inverter Control)
Keio Univ. West Lab 13
• The air conditioner is operated in 0.4(40% )
or 0.8(80%).
• Power consumption is also shifted between
4Wh and 8Wh.
Fig.10 Comparison of PMV
Fig.11 Power consumption
Inverter control
Time(min)
Time(min)
Time(min)
PM
V
Time(min) Time(min)
ON
/OF
F(0
-1)
/ O
utp
ut
rate
Set
tin
g T
emp
eratu
re (℃
)
PM
V
Pow
er C
on
sum
pti
on
(W
h)
Fig.9 Operation history

0
0.2
0.4
0.6
0.8
1
1.2
1.4
1.6
0
2
4
6
8
10
12
14
16
18
0 30 60 90 120 150 180 210
ac_power
Output Rate
Relation between Controls and Power Consumption
ON/OFF, inverter Control
⇒ Power consumption is controllable.
Infrared Control
⇒ Power consumption is uncontrollable.
Keio Univ. West Lab 14
Fig.12 Results of controls and power consumption
(a) ON/OFF control (b) Infrared control
(c) Inverter control
It is easy to forecast power consumption in
inverter control.
0
0.2
0.4
0.6
0.8
1
1.2
0
2
4
6
8
10
12
14
16
18
0 30 60 90 120 150 180 210
ac_powerON-OFF
Pow
er C
on
sum
pti
on
(W
h)
ON
/OF
F(0
-1)
Time(min)
21
22
23
24
25
26
27
28
0
2
4
6
8
10
12
14
16
18
0 30 60 90 120 150 180 210
ac_powerSetting Temp
Pow
er C
on
sum
pti
on
(W
h)
Time(min)
Set
tin
g T
emp
eratu
re (℃
)
Time(min)
Ou
tpu
t ra
te

Evaluation of Power Consumption
Keio Univ. West Lab 15
Constant 24˚C ON/OFF Infrared Inverter
Accumulated power
consumption(Wh) 2100.5 1931.0 1562.0 1337.5
Power saving rate
from constant (%) ― 8.1 25.6 36.3
Power saving rate
from ON/OFF (%) ― ― 19.1 30.7
TABLE II
Accumulated power consumption and energy saving rate*
* The power consumption was calculated by using measured instant power
consumptions for 210 minutes except first 30 minutes when PMV is under
-0.25.
18
19
20
21
22
23
24
25
26
27
0 30 60 90 120 150 180 210
topmiddlebottom
18
19
20
21
22
23
24
25
26
27
0 30 60 90 120 150 180 210
topmiddlebottom
18
19
20
21
22
23
24
25
26
27
0 30 60 90 120 150 180 210
topmiddlebottom
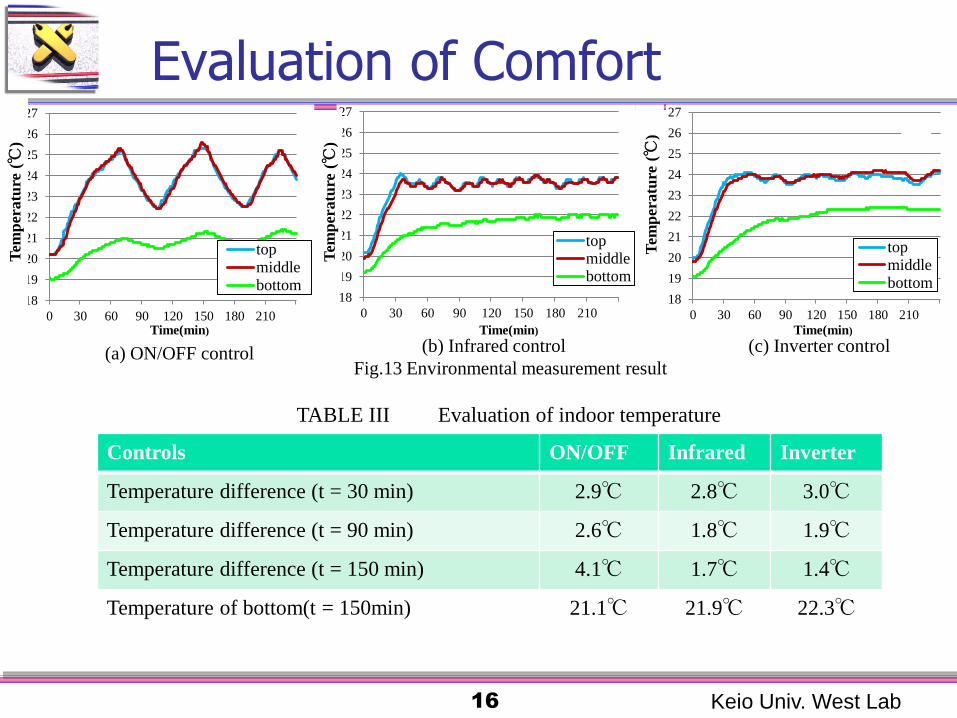
Evaluation of Comfort
Keio Univ. West Lab 16
Fig.13 Environmental measurement result
Time(min) Time(min)
Controls ON/OFF Infrared Inverter
Temperature difference (t = 30 min) 2.9℃ 2.8℃ 3.0℃
Temperature difference (t = 90 min) 2.6℃ 1.8℃ 1.9℃
Temperature difference (t = 150 min) 4.1℃ 1.7℃ 1.4℃
Temperature of bottom(t = 150min) 21.1℃ 21.9℃ 22.3℃
TABLE III Evaluation of indoor temperature
(a) ON/OFF control (b) Infrared control (c) Inverter control
Tem
per
atu
re (℃
)
Tem
per
atu
re (℃
) Time(min)
Tem
per
atu
re (℃
)

Comprehensive Evaluation
Controls ON/OFF Infrared Inverter
Saving power
consumption ○ ◎ ◎
Power consumption
controllability ○ - ○
Maintaining comfort - ○ ○
Comfort of whole room* - ○ ○
Keio Univ. West Lab 17
TABLE IV Comprehensive Evaluation
* The temperature change of four corners in the room resembles that of the center.
Inverter control is the most effective method.

Keio Univ. West Lab 18
Wrap-up of Air-conditioning Control in HEMS/BEMS
Future works of this section
• The infrared control and inverter control can save 19.1% and 30.7% of
power consumption compared with ON/OFF control, respectively.
• The inverter control is effective in maintaining indoor thermal environment.
Moreover, power consumption can be controlled and saved.
• Cooperative control of multi air conditioners should be conducted under the
condition of total-power-demand limitation.
• It is required to improve the control algorithm into fluidly operation.
Wrap-up

Keio Univ. West Lab 19
Demonstration of BEMS/CEMS

Construction Environment
Site
Kurihara City Hall, Kurihara City, Miyagi Prefecture, Japan
Summer : max average temperature 29.3˚C , min average temperature 19.9 ˚C
Winter : max average temperature 1.9˚C , min average temperature -7.8 ˚C
3 Floors (1F: 540m2, 2F: 280m2, 3F: 501m2) , Entrance : 370m2
Measurement Item
Environmental information
Temperature, Humidity, Illuminance, CO2
Power information
Demand Power
Air Handling Unit (AHU) Power
Control Device (Air-Conditioner)
Hot and Chilled Water Generator - Oil type
AHU ×4
Keio Univ. West Lab 20
Installed KNIVES Terminal
Keio Univ. West Lab 21
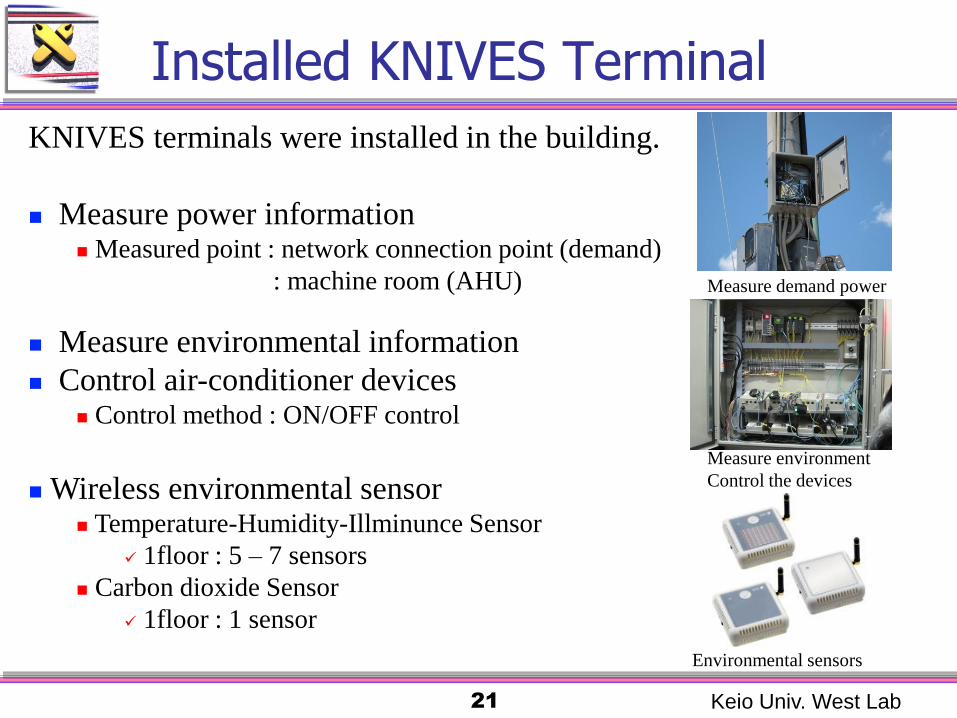
KNIVES terminals were installed in the building.
Measure power information Measured point : network connection point (demand)
: machine room (AHU)
Measure environmental information
Control air-conditioner devices Control method : ON/OFF control
Wireless environmental sensor Temperature-Humidity-Illminunce Sensor
1floor : 5 – 7 sensors
Carbon dioxide Sensor
1floor : 1 sensor
Environmental sensors
Measure environment
Control the devices
Measure demand power

Control Experiment of Air Conditioner in Winter
Purpose
To observe the influence of the air-conditioner control on
indoor environment
Premise
In the usual case, the control devices are turned off at 17:30.
Peak Demand Time : 16:30 – 17:30
Air-Conditioner Power : 45 kWh
Condition
The control devices were turned off
at 16:30.
The indoor temperature was kept
over 20˚C.
Keio Univ. West Lab 22
0
10
20
30
40
50
60
70
80
90
30
min
_d
ema
nd
_p
ow
er(k
Wh)
Time
City_Hall
Fig.14 Current change of demand power

Result of Experiment
Air-Conditioner
OFF time (min)
Demand power of
control time (kWh)
Oil consumption of
Control time (L)
Reduced Rate of
Power (%)
No Control 0 144.4 20.9 -
Control 60 110.8 1.1 23.2%
Keio Univ. West Lab 23
30
40
50
60
70
80
90
30
min
_d
ema
nd
_p
ow
er(k
Wh)
Time
No_Control
Control
Control time
Fig.15 A change of demand power
TABLE V The evaluation of the control result

Influence on Environment
The temperature at the time of control dropped slower than the
temperature at the time of no control.
A change of the temperature became rapid after sunset while the
control devices were turned off.
Keio Univ. West Lab 24
21.5
22
22.5
23
23.5
24
24.5
25
Tem
per
atu
re(℃
)
Time
No_Control
Control
Control time
sunset
1 hour
30 min
Fig.16 Influence of control on temperature

Wrap-up of Demonstration of BEMS
Keio Univ. West Lab 25
Enhancing from BEMS to HEMS
• Existing building was used for installing BEMS.
• KNIVES was installed into Kurihara City Hall and other concerning facilities
for measuring power and environmental information and controlling the
devices.
• As the result of this experiment, 23% of the demand power can be reduced by
stopping the air-conditioner for one hour.
• We build CEMS by connecting two or more BEMS and to carry out electric
power trading between BEMS, and it will be shown in the next section.
• In CEMS, it is indispensable to consider cluster configuration of each
building.
Wrap-up

From BEMS to CEMS
To build CEMS with 8 buildings.
To measure information and control devices in City Hall, Annex,
Library and Memorial House.
Keio Univ. West Lab 26
Library
Community
Center
Memorial
House
Shed
Apartment
House
Divided
point
Divided
point

Profile of Buildings
City Hall
The top of demand power in the buildings is used regularly.
The number of people is larger than other city buildings.
Fixed Holidays : Saturday, Sunday
Junior School
There is a proper demand tendency.
The building has a little cooling equipment.
Fixed Holidays : Saturday, Sunday
Library
The demand power on weekends is larger than one on weekdays.
Fixed Holiday : Monday
Keio Univ. West Lab 27

Structure of CEMS
Keio Univ. West Lab 28
City Hall area
Connection point of some areas
Library area
Environmental Sensor
Pulse Sensor
・Power Consumption ・Oil Consumption
Demand Information
Sensor Information
Network(Wired/Wireless)
Resource Management Server
Internet
Air-Conditioner
制御端末
Network Device
PC
Sensor Information
Keio University
A variety of Information Laptop etc.
Air-Conditioner
Ventilation fan
Environmental Sensor
Terminal
Terminal
Terminal
Control
Command
Control
Command
Control Command
Pulse Sensor
Power Demand Control in CEMS
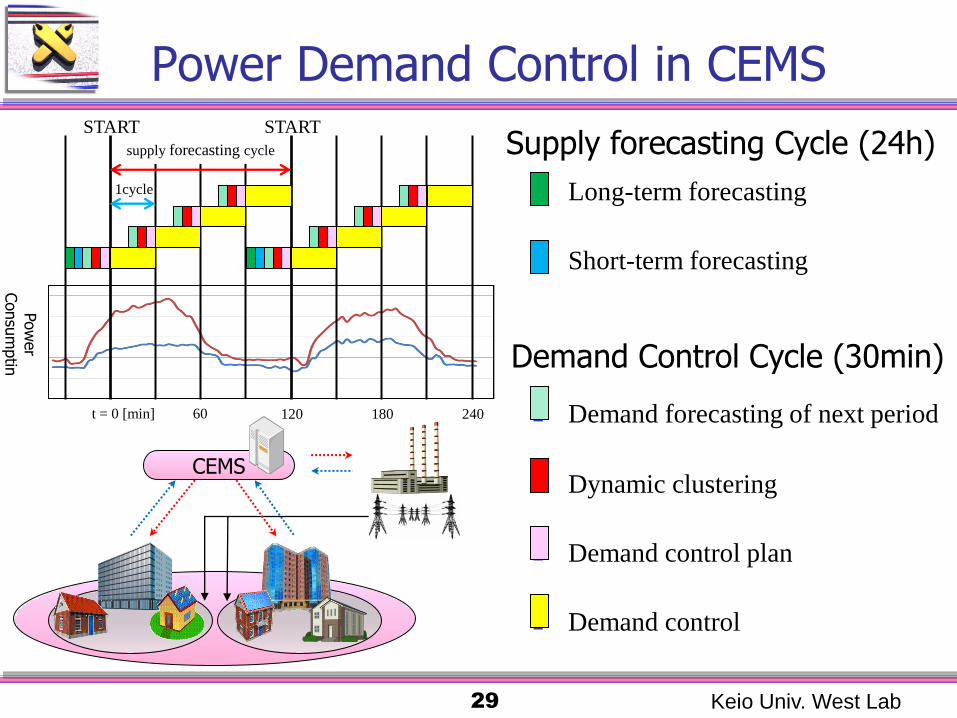
Keio Univ. West Lab 29
Long-term forecasting
Short-term forecasting
Demand forecasting of next period
Dynamic clustering
Demand control plan
Demand control
CEMS
t = 0 [min] 60
Pow
er
Consu
mptin
START
1cycle
supply forecasting cycle
START
120 180 240
Supply forecasting Cycle (24h)
Demand Control Cycle (30min)
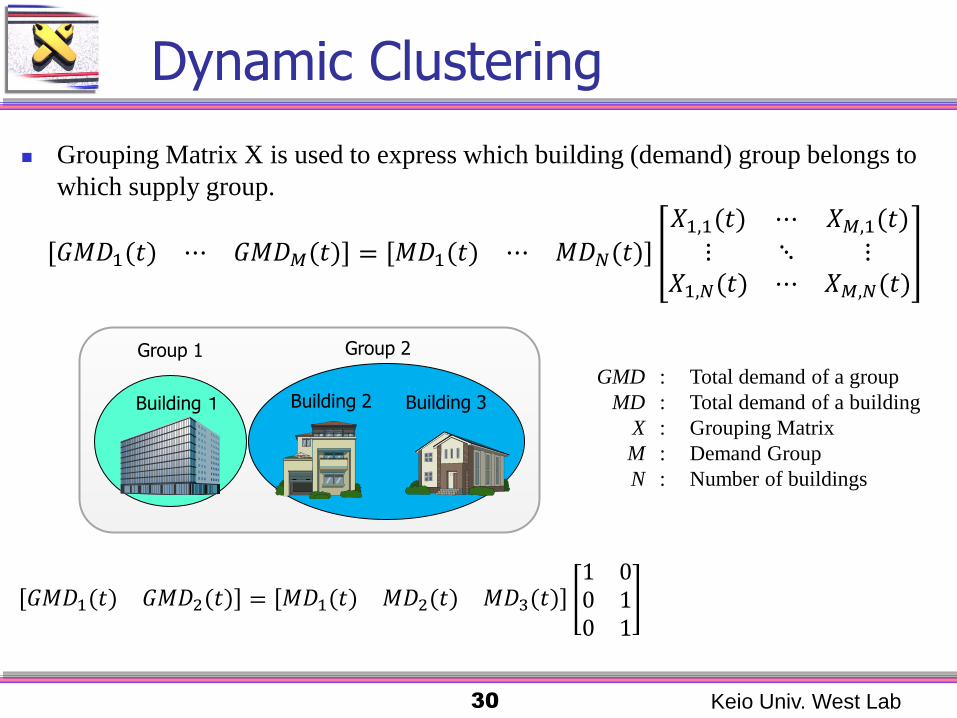
Dynamic Clustering
Keio Univ. West Lab 30
Building 1
Group 2 Group 1
Building 2 Building 3
GMD : Total demand of a group
MD : Total demand of a building
X : Grouping Matrix
M : Demand Group
N : Number of buildings
Grouping Matrix X is used to express which building (demand) group belongs to
which supply group.
𝐺𝑀𝐷1(𝑡) ⋯ 𝐺𝑀𝐷𝑀(𝑡) = 𝑀𝐷1(𝑡) ⋯ 𝑀𝐷𝑁(𝑡)
𝑋1,1(𝑡) ⋯ 𝑋𝑀,1(𝑡)
⋮ ⋱ ⋮𝑋1,𝑁(𝑡) ⋯ 𝑋𝑀,𝑁(𝑡)
𝐺𝑀𝐷1(𝑡) 𝐺𝑀𝐷2(𝑡) = 𝑀𝐷1(𝑡) 𝑀𝐷2(𝑡) 𝑀𝐷3(𝑡)1 00 10 1

Simulation Conditions
Keio Univ. West Lab 31
Used data
Real 60 buildings or houses
SFC of Keio University (18th Nov 2011 to 28th)
This campus has 9 buildings.
Fukue port terminal(18th Nov 2011 to 28th) (This BEMS will be explained in the next presentation.)
50 general Households (18th Nov 2007 to 28th)
Simulation Parameters
Supply forecasting cycle: 24hours
Demand control cycle: 30 minutes
Demand groups
2 groups
Supply rate was fixed; Group 1 : Group2 = 3 : 2
Demand control
5,10,15,20% control was virtually achieved according to the AC power consumption.

Simulation Result
Keio Univ. West Lab 32
Demand
ID 12:30 13:00 13:30
No. 1 1 2 1 No. 2 1 1 1 No. 3 1 1 1 No. 4 2 2 2
⋮ ⋮ ⋮ 1 No.12 2 2 2 No.13 1 1 1 No.14 1 1 1 No.15 2 1 2
Difference between prediction
and real demand
One day One hour
Prediction
Difference [%]
3.28 2.30
Dispersion 2.49 1.98
Group shifting
Demand Control
Grp1 Demand
Grp2 Demand
Grp1 Supply
Grp2 Supply
Grp1 Supply
Grp2 Supply
Grp1 DC
Grp2 DC Pow
er
Consu
mption [
kW
h]
Pow
er
Consu
mption [
kW
h]
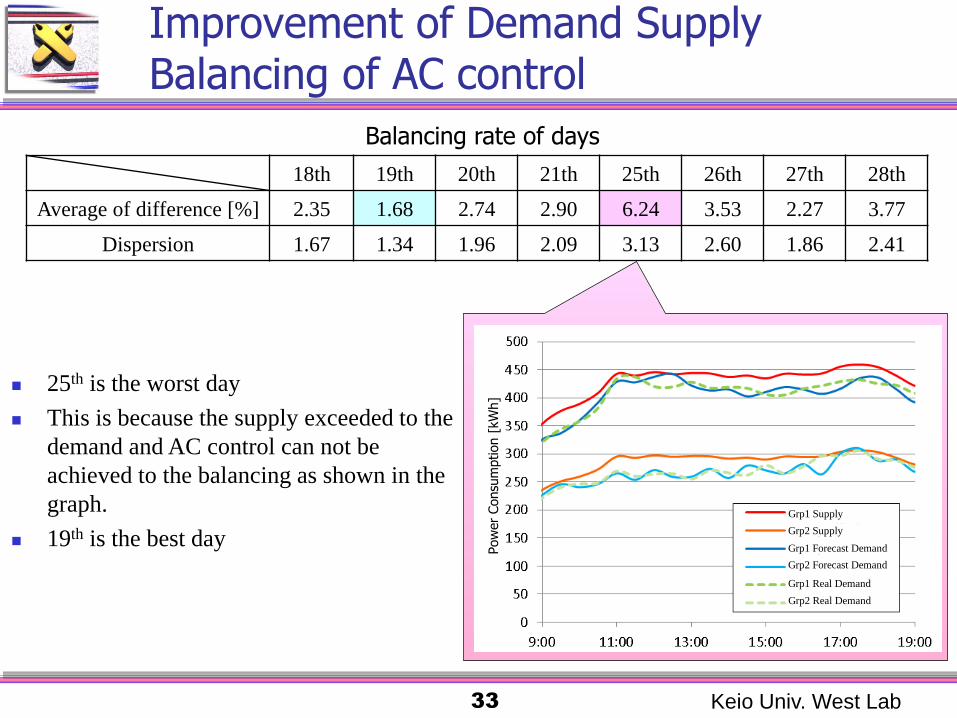
Improvement of Demand Supply Balancing of AC control
Keio Univ. West Lab 33
18th 19th 20th 21th 25th 26th 27th 28th
Average of difference [%] 2.35 1.68 2.74 2.90 6.24 3.53 2.27 3.77
Dispersion 1.67 1.34 1.96 2.09 3.13 2.60 1.86 2.41
25th is the worst day
This is because the supply exceeded to the
demand and AC control can not be
achieved to the balancing as shown in the
graph.
19th is the best day
Balancing rate of days
Grp1 Supply
Grp2 Supply
Grp1 Forecast Demand
Grp2 Forecast Demand
Grp1 Real Demand
Grp2 Real Demand
Pow
er
Consu
mption [
kW
h]

Conclusion and Future works
Keio Univ. West Lab 34
Future works
• The inverter control is effective in maintaining indoor thermal environment.
Moreover, power consumption can be controlled and saved.
• KNIVES was installed into Kurihara City Hall and other concerning
facilities for measuring power and environmental information and
controlling the devices.
• Dynamic clustering method is proposed that updates cluster configuration of
a building in which the difference between the amount of supply forecasting
and demand forecasting becomes the minimum.
• We would like to calculate grouping matrix considering the environmental
amenity of each room or facility.
Conclusion

Thank you for your kind attention.
Keio Univ. West Lab 35

CEMS (Cluster Energy Management System)
Keio Univ. West Lab 36
Building
Distributed generators
HEMS BEMS
Power-grid
Control Command Energy
Information
CEMS
Home
CEMS Cooperates with various distributed
generators and electric devices
Coordinates among energy
management systems of BEMS or HEMS
Optimizes electric and thermal
energy usage in CEMS
Cluster of buildings is formed by Controllable buildings and power
generators where EMS installed
Uncontrollable buildings and power
generators
Conclusion and Future works
Keio Univ. West Lab 25
Future works
• The system is introduced into Kurihara City Hall that measures power and
environmental information and controls the devices. Then, the existing
building is made into BEMS.
• As the result of this experiment, 23% of the demand power can be reduced
by stopping the air-conditioner for 1 hour.
• Measure exact air-conditioners power.
• We will evaluate a weighted value of each floor. If the value is determined,
we find a relationship between comfort and power consumption. As the
result, the schedule of air-conditioners can be determined.
• It is necessary to build CEMS from two or more buildings, and to carry out
power conditioning between buildings.
Conclusion

Real environmental CEMS
Keio Univ. West Lab 38
Structure of CEMS

Outside temperature
Keio Univ. West Lab 39
0
1
2
3
4
5
6
7
8
9
10
1
16
31
46
61
76
91
106
121
136
151
166
181
196
211
226
onoff
Infrare
Inverter
d

KNIVES
Keio Univ. West Lab 40

Structure of experimental system
Keio Univ. West Lab 41

Infrared transmitter module
Keio Univ. West Lab 42

amount of clothing and metabolic rate
Keio Univ. West Lab 43
clothing Clo value
half-pants, T-shirt, sandal 0.300
summer-pants , short-sleeved shirt, tie 0.560
Winter-pants, long-sleeved shirt, high socks, sweater, coat 1.09
activity Met value
Sleeping 0.70
Reading 1.00
Working(light) 2.10
Amount of clothing
metabolic rate

KNIVESML(sample)
Keio Univ. West Lab 44
<knives> <head> <version name="major">0</version> <version name="minor">1</version> <id>ir_data</id> <device name="ip">10.24.128.242</device> <device name="mac">00:11:0C:04:09:23</device> <owner name="company">KEIO_University</owner> </head> <body> <message name="sensor_data"> <timestamp name="date">2010-12-26 2:37:52</timestamp> <timestamp name="timezone">JST</timestamp> <response name="temperature" type="temp" id="">20.8</response> <response name="humidity" type="hum" id="hum_01">14</response> <response name="illuminance" tyape="illmina" id="illmina_01">447</response> <response name="co2" type="co2" id="co2_01">638</response> <response name="temperature" type="temp_hum" id="82">20.0</response> <response name="humidity" type="temp_hum" id="82">18.1</response> <response name="temperature" type="temp_hum" id="83">19.9</response> <response name="humidity" type="temp_hum" id="83">17.4</response> <response name="temperature" type="temp_hum" id="84">20.8</response> <response name="humidity" type="temp_hum" id="84">19.2</response> <response name="ac_power" type="kw-pulse" id="kw-pulse_01">0.0000</response> <state name="relay" type="relay" id="relay_stt_01">0</state> </message> </body> </knives>

Infrared Signal Code
Keio Univ. West Lab 45
lighting Air-conditioner

制御の有無での消費電力の違い(冬期)
制御なし 弱制御 全体制御
1時間の合計電力(kWh) 144.4 145.1 110.8
空調停止時間(分) 0
15
(16:30~
16:45)
55
(16:30~
17:25)
30
40
50
60
70
80
90
30分間需要電力(k
Wh)
制御なし
弱制御
全体制御
制御時間 制御条件 • ピークとなる16時半から空調が停止される 17時半までの1時間を制御時間とする
• 弱制御は人事課の温度低下を考慮し、最小 時間での制御
• 全体制御は人事課は考慮せずに、フロアの 温度が20℃以上に保たれるよう制御
結果 ・弱制御 空調停止の効果以上に、運転開始時の
電力増加が大きかったため、制御なしの場合と需要電力の差は出ない
・全体制御 気温による消費電力の誤差を考慮しても、15%以上の需要電力削減が可能
制御方法による受電電力の変化(1/17~19)
46

Keio Univ. West Lab 47
19
20
21
22
23
24
25
26
27
15:00:00 15:30:00 16:00:00 16:30:00 17:00:00 17:30:00 18:00:00 18:30:00
2F_no
2F_con
3F_no
3F_con