air force base on cape san blas and santaaquaticcommons.org/1096/1/ocrlamont_m_1998.pdf · air...
TRANSCRIPT

S EA T URTLE N ESTING ACTIVlTY ALONG EGLINAIR FORCE BASE ON CAPE SAN BLAS AND SANTA
u,S. Geological Survey/Biological Resour sloriJ a Cooperative Fish and wildlife Rese~ch
Technic-al Report #59
SEA TURTLE NESTING ACTIVITY ALONG EGLIN AIR FORCE BASE ON
CAPE SAN BLAS AND SANTA ROSA ISLAND, FLORIDA FROM
1994 TO 1997
Margaret M. Lamont, H. Franklin Percival, Leonard G. Pearlstine,Sheila V. Colwell, and Raymond R. Carthy
U.S. Geological Survey/Biological Resources DivisionFlorida Cooperative Fish and Wildlife Research Unit
Technical Report #59
1998
This Technical Report covers ResearchWork Order Nos. 129"160, and 181
Recommended Citation:Lamont, M. M., H. F. Percival, 1. G. Pear/stine, S. \.Z Co/weD, and R. R. earthy. 1998. Seaturtle nesting activity along Eglin Air Force Base on Cape San BIas and Santa Rosa Island, Florida/rom 1994 to 1997. U.S.G.S. Biological Resources Division, Florida Cooperative Fish and WildlifeResearch Unit, Tech. Report No. 59.

Acknowledgments
We are grateful to many people for assistance throughout this project. This research would nothave been possible without funding and support from Eglin Air Force Base, particularly RickMcWhite, Carl Petrick, Debby Atencio, Bruce Hagedorn, and Dennis Teague. Assistance frompersonnel at T racor Incorporated on Cape San BIas was also invaluable and we are especiallygrateful to Don Lawley, Judy Watts, Bob Whitfield, Mark Collier, Carl Fox, Billy Griffen, andDeWayne Strader. In addition, we thank Debra Hughes, Barbara Fesler, and Caprice McRae atthe University of Florida. Data collection was accomplished through the dedication of ourtechnicians: Eric Egensteiner, Greg Altman, Dave Huetter, Melinda Schaefbauer, ShawnDiddie, Rudy Martinez, Kris Fair, and Martha Maglothin. This research was conducted underFlorida Department of Environmental Protection permit number TP - 26.

Table of Contents
I. INTRODUCTION 1
II. METHODS 5
III. RESULTS
Cape San BIas1994 71995 91996 101997 12
Santa Rosa Island1994 141995 171996 181997 21
IV. DISCUSSION 23
V. MAI~AGEMENT RECOMMENDATIONS
Cape San BIas... 32Santa Rosa Island 39
VI. LITERATURE CITED 43
11

Adult sea turtles are unevenly distributed throughout the tropical and subtropical
seas (Miller 1997). Although foraging ranges are generally large and may extend beyond
the tropics, nesting areas are more specific and are located almost exclusively within the
tropical and subtropical region. The only exception to this is the loggerhead turtle
(Caretta caretta) which nests primarily in warm temperate and subtropical areas (Miller
1997). Included in the nesting range of the loggerhead turtle is the northern Gulf of
Mexico coast, including barrier islands along the Florida panhandle. In addition to
loggerhead turtles, endangered Green turtles (Chelonia mydas) and Leatherback turtles
(Dermochelys coriacea) have been documented along the northwest Florida coast,
indicating this area may provide essential nesting habitat for threatened and endangered
sea turtles.
The places and conditions under which sea turtles nest are similar among species
(Miller 1997). Nesting females nest predominantly during the warmer months on beaches
that are above high tide and have deep, loose sand (Miller 1997). In addition to similarities
in nesting conditions, sea turtle species share behavioral characteristics. Hatchling sea
turtles move from their natal beaches into the open ocean, often taking refuge in gyres
(Lohmann and Lohmann 1996). The juveniles and sub-adults reside in coastal feeding
areas located hundreds or thousands of miles away from the beaches where they were
hatched. After becoming sexually mature, adult turtles migrate from their foraging areas to
breed at mating areas close to their nesting region. At the end of the mating period, males
return to their foraging grounds and females move to their nesting sites (Lohmann and
Lohmann 1996). This pattern defines three important areas for sea turtle survival: foraging
grounds, mating areas, and nesting beaches. Within each stage, sea turtles are challenged
by natural and human induced disturbances. Because foraging and mating occur at sea and
nesting occurs along beaches, the stage often greatly influenced by human disturbance is
the nesting period.
Sea turtles must survive a variety of challenges throughout each stage of their life.
Nesting female sea turtles are threatened by human activity such as poaching and habitat
destruction, and natural disturbances including tropical storms and beach erosion. Turtle
fishing and importation continued in the United States until 1975 when the U.S. signed the
CITES (Convention on International Trade in Endangered Species ofWild Flora and
Fauna) which banned trade in sea turtle products (Johnson and Barber 1990). In addition,
several native peoples throughout the world gather sea turtle eggs for subsistence or
cultural beliefs. Hunting and egg-poaching continue to present a significant threat to sea
turtle populations throughout the world.
Humans also influence nesting sea turtles through destruction ofhabitat. Beaches
are valuable property for human development. Construction, maintenance, and human use
along these areas may disturb sea turtle nesting in a variety ofways. Building on the beach
directly destroys nesting habitat. In addition, the human presence introduced by the new
development increases potential disturbances to nesting females and allows for greater
human use of the sensitive beach habitat. Increased human use also raises the economic
potential of the beach, which often results in strong political pressure to restore and
maintain beaches (Ackerman 1997). Beaches are typically restored through beach
renourishment which involves locating a suitable source of sand offshore, pumping the
2

sand onto the beach, and mechanically shaping the beach platform (Ackerman 1997). This
is often a short-term repair to the beach and may greatly influence nesting sea turtles by
altering the substrate into which they build their nest and deposit their eggs. In addition,
additional human use increases activities such as beach driving and beach cleaning which
may directly destroy nests and alter the nesting habitat.
Sea turtles must also endure natural disturbances. Peak tropical storm activity in
the southeastern United States, June through November, coincides with sea turtle nesting.
Tropical storms often cause severe beach erosion, flooding, and abnormally high water
tables. Sea turtle nests may be washed away or inundated, thus destroying the clutch.
Consistent beach erosion in some locations also greatly influences nesting sea turtles.
Recent projections based on estimates of climate warming indicated the ocean level may
rise about one foot by 2100, therefore submerging many beaches (Ackerman 1997).
Increased global warming may allow this change in sea level to occur very rapidly which
may accelerate beach erosion (Ackerman 1997). This may be especially severe along
dynamic coasts, such as barrier islands.
There is an extensive chain of barrier islands along the Atlantic and Gulf ofMexico
coasts in the southeastern United States. The Gulf ofMexico coast is more dynamic and
unstable because it experiences smaller tidal ranges and has a lower wave energy regime
(Johnson and Barbour 1990). One of the greatest erosional rates in Florida occurs on
Cape San BIas, a barrier island located along the northern Gulf ofMexico coast (Fig. 1;
Johnson and Barbour 1990). The dynamics of this barrier island present a severe threat to
the loggerhead sea turtles that nest along this beach. In addition to severe erosion, sea
3

~---------~_._--
turtles nesting along Cape San BIas must also cope with the vehicular traffic that is
permitted along these beaches and with predators such as raccoons and coyotes that are
present along Cape San BIas. The dynamics of this barrier island present unique challenges
to the sea turtles nesting on Cape San BIas.
Along EAFB on Cape San BIas, the only sea turtle species nest observed has been
the loggerhead turtle. The first green turtle nest documented along the Florida panhandle
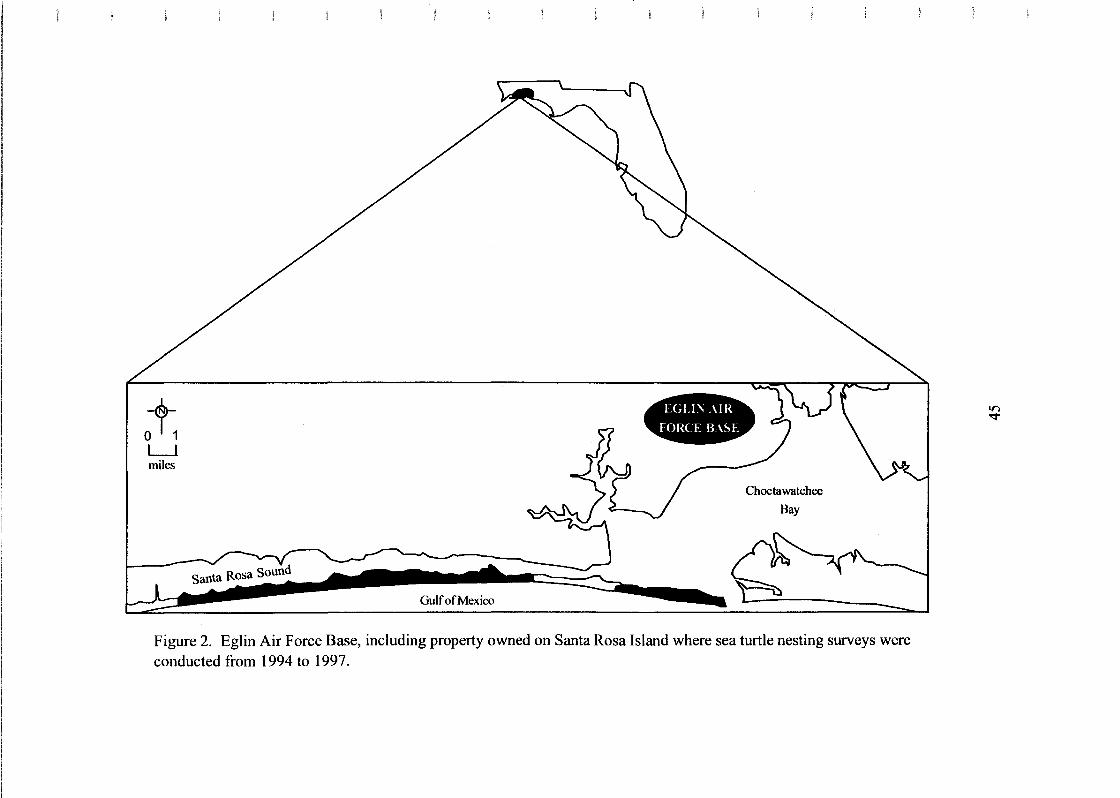
coast was observed on EAFB property, however (D. Atencio, EAFB, pers. comm). Santa
Rosa Island, located approximately 150 miles west of Cape San BIas supports a small but
consistent, group of nesting green turtles (Fig. 2). Although erosion is not as severe along
Santa Rosa Island as it is on Cape San BIas, and vehicular traffic is not permitted, sea
turtles nesting on this barrier island must survive severe tropical storms, predation, and
artificial lighting to be successful. Because this area supports a rare group ofnesting green
turtles and is disturbed by intense artificial lighting from Air Force missions and adjacent
resort towns, continued monitoring is necessary. The sea turtle species that nest along this
barrier island, and the human activities that disturb those sea turtles present unique
circumstances for management of this area. Protection of the significant nesting
populations of sea turtles on EAFB properties on Cape San BIas and Santa Rosa Island
requires yearly monitoring of the nesting activity and the natural and human disturbances
influencing the nesting females.
The objectives of this study were to monitor sea turtle nesting along EAFB on
Cape San BIas to determine number of nests and hatching success, assess disturbances,
and determine proper management to ensure successful nesting and hatching.
4
Methods
From 1994 to 1997, the beaches along EAFB on Cape San BIas and Santa Rosa
Island, Florida were monitored for nesting sea turtles. Every morning from May 15
through October 1, personnel traveled the beach on foot or all-terrain vehicle. When sea
turtle tracks were observed, data were collected on the crawl and personnel determined
whether it was a nesting or non-nesting (false) crawl. Ifit was determined to be a nesting
crawl, the nest was located and different protocol were followed according to geographic
location. At both locations, data collected included width and length of crawl, height of
crawl above mean high water, height of dunes at mean high water, distance mean high
water to dunes, time crawl/nest was located, whether it was a nesting or false crawl,
whether the nest was relocated or left in situ, and number of eggs in the clutch (if
available). Each nest was marked with a number corresponding to when it was located and
the date on which it was located.
Cape San BIas
On Cape San BIas, because of severe erosion and inundation nests often required
relocated, and due to severe predation, nests were typically screened. Eggs were always
located in nests along Cape San BIas because screens had to be placed over the clutch or
eggs required relocation. Nests left in situ were screened with a three foot by three foot
square piece of two inch by four inch screening placed over the clutch. Screens were held
in place by wooden stakes pounded into each comer of the screen. Neon orange flagging
was placed around the stakes to mark the nest, and a sign identifying it as a sea turtle nest
and explaining disciplinary actions taken for disturbing it was nailed to one of the wooden
5

stakes. During relocation, eggs were found, removed individually from the nest and placed
in a black bucket. Relatively moist sand from the original nest site was placed in the
bottom ofthe bucket. Special care was taken to maintain the original orientation of each
egg during relocation. After all eggs were placed in the bucket they were transported to a
more stable location. At the relocation site, the surface sand was scraped away. A post
hole digger was used to dig an egg-chamber similar in size and shape to the original egg
chamber. Eggs were placed into the artificial egg-chamber in the same order they were laid
(eggs laid in the bottom ofthe original clutch were placed in the bottom of the artificial
nest, those on top remained on top, etc.). The artificial chamber was filled in with sand,
screened, staked, and flagged.
The beach along EAFB was separated into three areas; east, cape, and north. Mile
markers were placed in front of the dune line every 0.1 miles along the entire beach. The
area between mile marker 0.0 to 0.99 was designated east beach, 1.0 to 1.99 was the cape
beach, and 2.0 to 2.99 was called north beach (Fig. 1).
Santa Rosa Island
On Santa Rosa Island, nests were rarely relocated because erosion and inundation
were not as severe as along Cape San BIas. Nests were identified, however, eggs in the
clutch were not located unless relocation or screening were required. Nests were only
screened after predation attempts occurred during incubation. Most nests were left in situ,
with wooden stakes and flagging placed around the entire body pit. A sea turtle sign was
also placed on each nest.
6

Results
Cape San Bias
1994
One-hundred and thirty loggerhead turtle crawls were located along EAFB
property on Cape San BIas in 1994 (Table la). Ofthose, 77 were false crawls and 53 were
nesting crawls (Fig. 3). Most false crawls were located on north beach (40; 51.9%), the
second greatest (31; 40.3%) on cape beach, and the fewest (6; 7.79%) on east beach. The
earliest crawl was observed on May 19 and the latest on August 12, with the earliest being
a false crawl and the latest a nesting crawl. Most false crawls were observed in July (30;
39.0%), the second greatest number were located in June (29; 37.7%), and the fewest in
August (18; 23.4%). No false crawls were observed in May.
~
The earliest of the 53 loggerhead nests located on Cape San BIas in 1994 was
observed on May 19 and the latest on August 12 (Table 2). Most nests (54.7%) were laid
in July, the second greatest number (24.5%) were located in June, third greatest (7.55%)
in August, and the fewest (3.77%) in May. The greatest number of nests were laid on the
cape beach (23;43.4%), second greatest on east beach (18; 34%), and the fewest on north
beach (12; 22.6%). Of all nests laid, nineteen (35.8%) were relocated, and 34 (64.2%)
remained in situ (Table 4a). Thirty-three (62.3%) nests were destroyed by erosion, and
four (7.55%) were partially or completely depredated (Table Sa). Of all eggs laid, 313
were lost to predators and 835 were destroyed by erosion. Primary predators were
raccoons (Procyon loctor) and ghost crabs (Ocyopode quadrata).
7

Of all nests, clutch size of23 (43.4%) nests was known. The average clutch size
for those 23 nests was 102.7 eggs, with the largest clutch containing 168 eggs and the
smallest numbering 40 eggs. The total number of eggs in those nests of known clutch size
was 2,361.
Hatching Success
Average hatching success for all 53 nests was 5.73% (Fig. 4). Of all nests laid, 10
(18.9%) hatched at least one egg and of those, average incubation length was 64.7 days.
The longest incubation period was 75 days and the shortest was 54 days. Of all eggs laid,
356 hatched and hatchlings emerged, 186 showed no development, 212 were addled, 338
experienced arrested development, and 126 hatched but hatchlings were dead in the nest.
In situ versus relocated
Average hatching success for all nests left in situ was (7.12%) and for all relocated
nests was (3.23%). Ofthe 34 nests left in situ, 7 (20.6%) produced at least one hatchling,
whereas three (15.8%) of the 19 relocated nests had at least one hatchling emerge. Of
those nests that produced at least one hatchling, average incubation length for in situ nests
was 64.1 days and for relocated nests was 66 days. From the 522 eggs located in the five
in situ nests of known clutch size, 268 (51.3%) hatchlings emerged, whereas 84 (4.68%)
hatchlings emerged from the 1,839 relocated eggs located in the 18 nests ofknown clutch
size. Average number of eggs in the five in situ nests of known clutch size was 104.4,
whereas for the 18 relocated nests, average clutch size was 102.17 eggs.
8

1995
In 1995, 181 loggerhead turtle crawls were located along Cape San Bias. Sixty of
those were nesting crawls and 121 were false crawls (Table la). The greatest number of
false crawls were located on north beach (56; 46.3%), second greatest on cape beach (43;
35.5%), and the fewest on east beach (22; 18.2%). The earliest crawl was observed on
May 16 and the latest on August 22, with both being false crawls. Most false crawls were
observed in July (55; 45.5%), the second greatest number were located in June (49;
40.5%), third greatest in May (10; 8.3%), and the fewest in August (7; 5.8%).
Hw
In 1995, of the 60 nests located the greatest number were laid in July (37; 61.7%),
the second greatest in June (18; 30%), third greatest in May (3; 5.00%), and fewest in
August (2; 3.33%; Table 2). The earliest nest was observed on May 25 and the latest on
August 18. Most nests were located on cape beach (34; 56.7%), the second greatest
number on north beach (16; 26.7%), and the fewest on east beach (10; 16.7%). Thirty-six
nests (60%) were relocated in 1995, and 24 (40%) remained in situ (Table 4a). Of all
nests laid, 27 (45%) were completely or partially destroyed by predators, and 17 (28.3%)
were influenced by erosion (Table 5a). Primary predators were coyotes (Canis latrans)
and ghost crabs.
Of all nests, clutch size of 52 (86.7%) nests was known. The average clutch size
for those 52 nests was 89.1 eggs, with the largest clutch containing 140 eggs and the
smallest numbering 25 eggs. The total number of eggs in those nests ofknown clutch size
was 4,633.
9

Hatching Success
Average hatching success was 9.54% for all nests. Of all nests laid, 11 (18.3%)
hatched at least one egg, and of those, average incubation length was 55.9 days. The
longest incubation period was 63 days and shortest was 52 days. Of all eggs laid, 470
hatched and hatchlings emerged, 110 showed no development, 260 were addled, 324
experienced arrested development, and 93 hatched but hatchlings were dead in the nest.
In situ versus relocated
Average hatching success for all nests left in situ was 9.94% and for all relocated
nests was 9.28%. Of the 24 nests left in situ, 5 (20.8%) produced at least one hatchling,
whereas 10 (27.8%) of the 36 relocated nests had at least one hatchling emerge. Of those
nests, average incubation length for all nests left in situ was 56.2 days and for all relocated
nests was 56.5 days. From the 1,369 eggs located in the 18 in situ nests ofknown clutch
size, 248 (18.1%) hatchlings emerged, whereas 227 (6.95%) hatchlings emerged from
3,264 eggs located in the 34 relocated nests ofknown clutch size. Average number of
eggs in the 18 in situ nests was 76.1 eggs, whereas the average clutch size for the 34
relocated nests was 96.0 eggs.
1996
In 1996, 70 loggerhead turtle crawls were located, 25 of which were nesting
crawls and 45 were false crawls (Table la). Most false crawls were located on the cape
beach (17; 37.8%), second greatest on north beach (15; 33.3%), and the fewest on east
beach (13; 28.9%). The earliest crawl was observed on May 27 and was a false crawl. The
latest crawl was also a false crawl and was observed on August 15. Most false crawls
10
were located in June (24; 53.3%), the second greatest number were observed in July (16;
35.6%), third greatest in August (4; 8.9%), and the fewest in May (1; 2.2%).
~
In 1996, the greatest number ofnests were located in June (13; 52%), the second
greatest in July (10; 40% ), and the fewest in August (2; 8%; Table 2). No nests were
observed in May. The greatest number of nests were located on the north beach (12;
48%), second greatest on the cape beach (8; 32%), and fewest on the east beach (5; 20%).
The earliest nest was located on June 7 and the latest on August 10. Fifteen (60%) nests
were relocated in 1996, and 10 (40%) remained in situ (Table 4a). Ofall nests laid, 14
(56%) were partially or completely depredated and none were lost to erosion or tropical
storm damage (Table Sa). The primary predators were coyotes and ghost crabs.
Of all nests, clutch size was determined. The average clutch size was 96.24, with
the largest clutch containing 127 eggs and the smallest numbering 67 eggs. The total
number of eggs was 2,406.
Hatching Success
Average hatching success for all nests was 26.9%. Of all nests laid, at least one
hatchling emerged from 11 (44.0%) nests, and of those, average incubation length was
64.2 days. The longest incubation period was 70 days and shortest was 62 days. Of the
2,406 eggs observed in sea turtle nests, 717 (29.8%) hatched and hatchlings emerged, 244
(9.93%) showed no development, 142 (5.8%) were addled, 278 (11.24%) experienced
arrested development, and 1,007 (41.9%) hatched but hatchlings were dead in the nest.
11

In situ versus relocated
Average hatching success for all nests left in situ was 0.0% and for all relocated
nests was 44.9%. Of all in situ nests, none hatched, whereas at least one egg hatched in 10
(66.7%) of all 15 relocated nests. Average incubation length for in situ nest was zero
days, whereas for the 9 relocated nests of known incubation length it was 64.2 days. From
the 790 eggs left in situ, none hatched, whereas 717 (44.4%) hatchlings emerged from the
1,616 relocated eggs. Average number ofeggs in in situ nests was 79.0, whereas average
clutch size for relocated nests was 107.7 eggs.
1997
In 1997, 109 loggerhead turtle crawls were located, 54 ofwhich were nesting
crawls and 55 were false crawls (Table la). Most false crawls were located on north beach
(26; 47.3%), second greatest on cape beach (17; 30.9%), and the fewest on east beach
(12; 21.8%). The earliest crawl was a false crawl located on May 15, and the latest was
also a false crawl observed on August 12. Most false crawls were observed in July (25;
45.5%), the second greatest number were located in June (20; 36.4%), third greatest in
May (6; 10.9%), and the fewest in August (4; 7.3%).
~
In 1997, the greatest number of nests were located in June (27; 50%), the second
greatest in July (22; 40.7%), the third greatest in May (3; 5.6%), and the fewest in August
(2; 3.7%; Table 2). The greatest number of nests were located along north beach (36;
66.7), second greatest along cape beach with 10 (18.5%), and fewest along east beach (8;
14.8). The earliest nest was located on May 19 and the latest on August 11. Forty-three
12

(79.6%) nests were relocated in 1997, and 11 (20.4%) remained in situ (Table 4a). Of all
nests laid, 12 (22.2%) were partially or completely depredated and none were lost to
erosion or tropical storms (Table 5a). The primary predators were ghost crabs and fire
ants (Solenopsis invictus).
Clutch size was determined for all nests. Average clutch size was 112.37, with the
largest clutch containing 159 eggs, and the smallest numbering 75 eggs. The total number
of eggs was 6,068.
Hatchini Success
Average hatching success for all nests was 64.3%. Of all nests laid, at least one
hatchling emerged from 47 (87.0%) nests, and of those, average incubation length was
63.5 days. The longest incubation was 72 days and the shortest was 56 days. Of the 6,068
eggs laid, hatchlings emerged from 3,949 (65.1%), 140 showed no development, 846
(13.90.10) were addled, 1,012 (16.7%) experienced arrested development, and 43 (0.71%)
hatched but hatchlings were dead in the nest.
In situ versus relocated
Average hatching success for all nests left in situ was 33.78%, whereas for
relocated nests it was 72.2%. Ofall in situ nests, at least one hatchling emerge from 6
(54.5%) nests, and ofall relocated nests, at least one hatchling emerged from 41 (75.9%)
nests. Average incubation length for in situ nests was 53 days and for relocated nests was
62.2 days. From the 1,242 eggs left in situ, 449 (36.2%) hatchlings emerged, and from the
4,826 eggs relocated, hatchlings emerged from 3,499 (72.5%). Average number of eggs
left in situ was 112.9 whereas, average clutch size for relocated nests was 112.2 eggs.
13

Santa Rosa Island
1994
Crawls
In 1994, 106 sea turtle crawls were located on Santa Rosa Island (Table 1b).
Forty-eight were nesting crawls and 58 were false crawls (54.7%). The earliest and latest
crawls were both false and were observed on May 23 and August 23. Forty-four (75.9%)
of the false crawls were loggerhead crawls and 14 (24.1%) were green turtle crawls. Most
false crawls were observed in July (20; 34.5%), the second greatest number were observed
in June (19; 32.8%), the third greatest in August (12; 20.7%), and the fewest in May (7;
12.1%).
~
Imal
Forty-eight sea turtle nests were located along Santa Rosa Island in 1994, 32 of
which were loggerhead turtle nests and 16 were green turtle nests (Table 3). Most nests
were laid in July (22; 45.8%), the second greatest number were laid in June (19; 39.6%),
third in August (5; 10.4%), and the fewest were laid in May (2; 4.2%). The earliest nest
was located on May 25 and the latest on August 7. Five (10.4%) nests were relocated
(Table 4b). Of all nests, 16 (33.3%) were destroyed by storms and 8 (16.7%) were
partially or completely depredated by a variety of predatory species including ghost crabs,
fire ants, and raccoons (Table 5b).
14

Loggerheads
Most loggerhead nests were laid in June (15; 46.9%), the second greatest number
were laid in July (12; 37.5%), third greatest in August (3; 9.4%), and the fewest in May
(2; 6.3%). The earliest loggerhead nest was observed on May 25 and the latest on August
7. Of all loggerhead nests, 5 were relocated (15.6%), 14 (43.8%) were influenced by
storms, and 6 (18.8%) were partially or completely depredated.
Greens
Most green turtle nests were laid in July (10; 62.5%), the second greatest number
in June (4; 25%), third greatest in August (2; 12.5%), and the fewest in May (0). The
earliest green turtle nest was located on June 2 and the latest on August 5. Of all green
turtle nests, none were relocated, 2 (12.5%) were influenced by storms, and 2 (12.5%)
were partially or completely depredated by raccoons.
Hatching Success
Imal
Hatching success for all 48 nests was 30.8%. Of all nests laid, at least one egg
hatched in 20 (41.7%) nests, and of those, average incubation length was 71 days. The
longest incubation was 82 days and the shortest was 65 days. Clutch size was known for
22 nests (45.8%) which contained 2,596 eggs, and averaged 118 eggs per nest. The
largest clutch held 141 eggs and the smallest contained 67 eggs. Of all eggs in all nests,
1,652 hatchlings emerged, 413 experienced no development, 108 were addled, 99 were in
arrested development, and 365 hatched but hatchlings were dead in the nest.
15

Loggerheads
Hatching success for all 32 loggerhead nests was 24.97%. Of all nests laid, at least
one egg hatched in 11 (34.4%) nests, and of those, average incubation length was 70.2
days. The longest incubation was 76 days and the shortest was 65 days. Clutch size was
known for 10 nests which contained 1,291 eggs, and averaged 129.1 eggs per nest. The
largest clutch held 136 eggs and the smallest contained 67 eggs. Of all eggs in all nests,
982 hatchlings emerged, 99 experienced no development, 108 were addled, 85 were in
arrested development, and 146 hatched but were dead in the nest.
Greens
Hatching success for all 16 green turtle nests was 42.4%. Of all nests laid, at least
one egg hatched in 10 (62.5%) nests, and of those, average incubation length was 64.8
days. The longest incubation period was 82 days and the shortest was 66 days. Clutch size
was known for 12 (75.0%) nests which contained 1,305 eggs and averaged 108.8 eggs per
nest. The largest clutch held 141 eggs and the smallest contained 74 eggs. Of all eggs in all
nests, 670 hatchlings emerged, 314 experienced no development, none were addled, 14
were in arrested development, and 219 hatched but hatchlings were dead in the nest.
In situ versus relocated
All five nests relocated in 1994 were loggerhead nests. Of all relocated nests, at
least one egg hatched in two (40%) nests, whereas at least one egg hatched in 9 (33.3%)
in situ nests. Ofthose that hatched, average incubation length for relocated nests was 73
days and 69.6 days for in situ nests. Clutch size was known for two (40.0%) relocated
nests and average 107.5 eggs per nest whereas for in situ nests, clutch size was known for
16

8 nests that contained 1,076 eggs and averaged 134.5 eggs per nest. Average hatching
success for relocated nests was 16.8% and for in situ nests was 26.5%.
1995
Crawls
Twenty-eight crawls were located in 1995, 10 (35.7%) of which were false crawls
and 19 (67.9%) were nesting crawls (Table 1b). The earliest and latest crawls were both
nesting crawls and were observed on May 25 and August 8. All crawls located in 1995
were produced by loggerhead turtles. Most false crawls were observed in June (5; 50%)
and the second greatest in May (2; 20%) and July (2; 20.0%).
~
IQ1al
Eighteen loggerhead sea turtle nests were located along Santa Rosa Island in 1995
(Table 3). Most nests were laid in June (9; 50.0%), the second greatest number were laid
in July (7; 38.9%), and the fewest nests were laid in May (1; 5.56%) and August (1;
5.56%). The earliest nest was located on May 25 and the latest on August 8. Four
(22.2%) nests were relocated (Table 4b). Ofall nests, 17 (94.4%) were destroyed by
storms and 5 (27.8%) were partially or completely depredated prior to being destroyed by
storm activity (Table 5b). The remaining nest (5.56%) not lost to storms was completely
depredated. Predatory species included raccoons and unidentified canids (either fox or
coyote).
17

._-------.~-------
Hatching Success
None of the nests laid on Santa Rosa Island in 1995 hatched, therefore hatching
success was 0.0%. Clutch size was known for 4 nests (22.2%) which contained 460 eggs,
and averaged 115 eggs per nest. The largest clutch held 138 eggs and the smallest
contained 99 eggs.
1996
Crawls
Eighty-eight crawls were located on Santa Rosa Island in 1996. Forty-two were
nesting crawls and 46 (52.3%) were false crawls (Table lb), The earliest crawl, a false
crawl, was located on May 27 and the latest, a nesting crawl, on August 17. Thirty-four
(73.9%) of the false crawls were loggerhead crawls and 12 (13.6%) were green turtle
crawls. Most false crawls were observed in June (19;41.3%) and July (19; 41.3%), the
second greatest number were located in August (6; 13.0%), and the fewest occurred in
May (4; 8.70%).
~
IQ1al
Forty-two sea turtle nests were located along Santa Rosa Island in 1996,28
(66.7%) ofwhich were loggerhead turtle nests and 14 (33.3%) were green turtle nests
(Table 3). Most nests were laid in July (21; 50.0%), the second greatest number were laid
in June (16; 38.1%), and the fewest were laid in August (5; 11.9%). No nests were laid in
May. The earliest nest was located on June 7 and the latest on August 17, and both were
green turtle nests. Sixteen (38.1%) nests were relocated (Table 4b). Of all nests, one
18

,---------,-,---------,-
(2.38%) was destroyed by storms and 25 (59.5%) were partially or completely depredated
by a variety of predatory species including ghost crabs, raccoons, fox, and coyotes (Table
5b).
Loggerheads
Most loggerhead nests were laid in June (17; 60.7%), the second greatest number
were laid in July (9; 32.1%), and the fewest were laid in August (2; 7.1%). The earliest
loggerhead nest was observed on June 9 and the latest on August 8. Of all loggerhead
nests, 15 (53.6%) were relocated, 1 (2.38%) was influenced by storms, and 14 (50.0%)
were partially or competely depredated.
Greens
Most green turtle nests were laid in July (7; 50.0%), the second greatest number in
June (4; 28.6%), and the fewest in August (2; 14.3%). The earliest green turtle nest was
located on June 7 and the latest on August 17. Of all green turtle nests, one (7.1%) was
relocated, none were influenced by storms, and 11 (39.3%) were partially or completely
depredated by raccoons.
Hatching Success
Imal
Hatching success for all 42 nests was 25.0%. Of all nests laid, at least one egg
hatched in 24 (57.1 %) of nests, and of those, average incubation length was 71.1 days.
The shortest incubation duration was 57 days and the longest was 81 days. Clutch size
was known for 40 nests which contained 3,118 eggs and averaged 78.0 eggs per nest.
The largest clutch held 194 eggs and the smallest contained 61 eggs. Of all eggs in all
19

---"-----
nests, 936 hatchlings emerged, 194 experienced no development, 768 were addled, 551
showed arrested development, and 84 hatched but hatchlings were dead in the nest.
Loggerheads
Hatching success for all 28 loggerhead turtle nests was 31.6%. Of all nests laid, at
least one egg hatched in 19 (67.9%) ofnests, and of those, average incubation length was
1.0 days. The longest incubation duration was 77 days and the shortest was 57 days.
Clutch size was known in 27 (96.4%) nests which contained 3,046 eggs and averaged
121.8 eggs per nest. The largest clutch held 159 eggs and the smallest contained 72 eggs.
Of all eggs in all nests, 1004 hatchlings emerged, 46 experienced no development, 332
were addled, 332 showed arrested development, and 83 hatched but hatchlings were dead
in the nest.
Greens
Hatching success for all 14 green turtle nests was 14.7%. Of all nests laid, at least
one egg hatched in 5 (35.7%) ofnests, and of those, average incubation length was 73.4
days. The longest incubation duration was 81 days and the shortest was 66 days. Clutch
size was known for 13 nests which contained 1.421 eggs and averaged 109.3 eggs per
nest. The largest clutch held 194 eggs and the smallest contained 61 eggs. Of all eggs in
all nests, 252 hatchlings emerged, 146 showed no development, 311 were addled, 219
experienced arrested development, and one hatched but the hatchling was dead in the nest.
20

In situ versus relocated
LOiierheads
Fifteen (53.6%) loggerhead nests were relocated in 1996 and 13 (42.3%) were left
in situ. Of all relocated loggerhead nests, 11 (73.3%) hatched at least one egg, and of
those, average incubation length was 67.2 days. Of all in situ nests, 8 (61.5%) hatched at
least on egg and of those average incubation length was 73.3 days. Average hatching
success for relocated nests was 39.2% and for in situ nests was 22.9%. From the 1,798
eggs in the 15 relocated nests, 684 (38%) hatchlings emerged, whereas 320 (25.6%)
hatchlings emerged from the 1,248 eggs in the 12 in situ nests of known clutch size.
Average number ofeggs in the relocated nests was 119.9 eggs per nest, and in in situ
nests was 104.0 eggs per nest.
Greens
One (6.3%) green turtle nest was relocated in 1996 and 13 (92.9%) were left in
situ. None of the 101 eggs laid in the one relocated nest hatched.
1997
Crawls
Forty-seven crawls were located on Santa Rosa Island in 1997 (Table 1b).
Twenty-two were nesting crawls and 25 (53.2%) were false crawls. The earliest crawl, a
false crawl, was located on May 28 and the latest, a nesting crawl, on August 14. All
crawls were loggerhead turtle crawls. Most false crawls were observed in June (11;44.0%)
and July (8; 32.0%), the second greatest number were located in May (4; 16.0%), and the
fewest occurred in May (2;8.00%).
21
~-----_._-----------_._-
Th1al
Twenty-two sea turtle nests were located along Santa Rosa Island in 1997, all of
which were loggerhead turtle nests (Table 3). Most nests were laid in June (13; 59.1%),
the second greatest number were laid in July (5; 22.7%), third greatest in August (3;
13.6%), and the fewest were laid in May (1; 4.55%). The earliest nest was located on
May 29 and the latest on August 14. One (4.55%) nest was relocated (Table 4b). Of all
nests, four (18.2%) were destroyed by storms and 12 (54.5%) were partially or completely
depredated by a variety of predatory species including ghost crabs, raccoons, and canids
(Table 5b).
Hatching Success
Th1al
Hatching success for all 22 nests was 27.2%. Of all nests laid, at least one egg
hatched in 15 (68.2%) nests. Incubation period was known for 7 nests, and average
incubation length for those nests was 75.7 days. The longest incubation period was 90
days and the shortest was 67 days. Clutch size was known for 15 nests that contained
1,443 eggs and averaged 96.2 eggs per clutch. Of all eggs laid, 780 hatchlings emerged,
128 exhibited no development, 108 were addled, 387 were in arrested development, and
one hatched but the hatchling was dead in the nest.
22

In situ versus relocated
One loggerhead turtle nest was relocated on Santa Rosa Island in 1997. This nest
contained 142 eggs and was partially depredated (8 eggs) by ghost crabs. Of the 141 eggs,
51 (35.9%) hatchlings emerged. Incubation length was 74 days. The remaining 21 nests
were left in situ. These nests contained 1,301 eggs and had an average clutch size of92.9
eggs per nest. Average hatching success for all in situ nests was 26.8%. Of all in situ
nests, at least one egg hatched in 14 (66.7%) nests. Clutch size was known for 14 nests,
and from those, 729 (56%) hatchlings emerged.
Discussion
The timing and density of sea turtle crawls and nests along Cape San BIas and
Santa Rosa Island fluctuated between 1994 and 1997, however they remained within the
typical range of sea turtle nesting along the Florida panhandle. Much of the inconsistency
in numbers along Santa Rosa Island reflected a biyearly nesting ofgreen turtles along this
island. On Cape San BIas, however, the fluctuations in numbers primarily reflected
changes in the number offalse crawls. In 1995, nearly 67% ofall crawls observed along
Cape San BIas were false crawls, whereas in 1996, only 36% were false crawls. This may
be due to a variety of factors, including beach conditions or nesting behavior of the sea
turtles.
Perhaps disturbances along the beach in 1995 caused turtles to abandon nesting
attempts. Debris and other disturbances may cause the nesting female to change direction
or even abandon the nesting effort (Miller 1997). A large number of sea turtle nests were
23

depredated by coyotes in 1995. Possibly, coyotes were roaming the beach at night in
search of prey. If a coyote came upon a turtle attempting to find an appropriate nesting
site, the turtle may have abandoned the effort, recognizing the threat of depredation the
coyote posed. The percentage of nests depredated increased and the number of false
crawls decreased in 1996 however, which indicated the presence of coyotes on the beach
may not have been the primary cause of the increased number of false crawls observed in
1995.
Coyotes are opportunistic feeders however, and may shift their primary prey items
when necessary (MacCracken and Uresk 1984). Coyotes did not depredate many sea
turtle nests in 1994, therefore perhaps coyotes first recognized sea turtle nests as an
appropriate food source in 1995 and were required to spend more time in search of nests
while they "learned" to use this resource. While looking for sea turtle nests, coyotes may
have roamed the beach more often than normal thereby disturbing many female turtles
attempting to nest. In 1996, coyotes may have been more adept at depredating sea turtle
nests, thus they were able to spend less time in search of nests which would have resulted
in fewer disturbed nesting sea turtles. Coyotes were also depredating sea turtle nests along
Santa Rosa Island, and an increase in false crawls was not apparent, which would appear
to suggest that coyotes were not influencing the number of false crawls along Cape San
BIas. Santa Rosa Island is a much larger area than Cape San BIas (26 miles versus three
miles). Perhaps, coyotes on Santa Rosa Island do not roam the entire area in search of
prey, thus they would effect only a fraction of the turtles nesting in this area. It is,
therefore, possible that coyotes along Cape San BIas influenced the number of false crawls
24
observed along this beach in 1995.
Additional disturbances may have also influenced sea turtles attempting to nest
along Cape San BIas in 1995. Vehicular traffic is allowed along this beach. Perhaps a
larger number of vehicles and peoplewere using the beach at night in 1995 than in 1994 or
1996. More vehicles and people may have created more disturbances to nesting sea turtles
and resulted in a greater number of false crawls. Vehicular traffic is not allowed on Santa
Rosa Island, therefore changes in the number of false crawls would not be expected due to
this disturbance.
The fluctuation in the number of false crawls may have been a natural fluctuation
in the sea turtles nesting along Cape San BIas between 1994 and 1997. Different turtles
may have been nesting in this area in 1995 than in 1994 or 1996, and fluctuations in
nesting behavior would be expected among different groups ofturtles. Changes in the
beach or offshore environment may also have resulted in the inconsistency in numbers of
false crawls. Possibly, sea turtles use cues on the beach to identify appropriate nesting
sites, If changes in the beach occurred between 1994 and 1995, sea turtles may have had
greater difficulty locating appropriate nesting sites thus increasing the number of false
crawls.
Although the number of crawls fluctuated, the number of sea turtle nests laid along
Eglin Air Force Base on Cape San BIas and Santa Rosa Island, Florida remained relatively
stable from 1994 to 1997. There was a decrease in the number of nests observed along
Cape San BIas in 1996, however in the following season, the number increased again to
more a typical nesting density. Along Santa Rosa Island, a pattern was observed of fewer
25

nests in odd years than even years. This was due to biyearly nesting of green turtles that
occurs along Santa Rosa Island (16 in 1994, 14 in 1996). In even years, the number of
loggerhead turtle nests remained relatively stable.
The decrease in the number of nests observed along Cape San BIas in 1996 may
have been due to a natural fluctuation in sea turtle nesting. In general, female sea turtles
do not reproduce every year (Miller 1997). The mean interval between laying for female
sea turtles varies among species, and ranges from one to 9 years (Miller 1997). For the
loggerhead turtle, the average interval among nesting years is 2.59 years (Miller 1997).
Possibly, the turtles that nest in successive years along Cape San BIas are not a consistent
group, therefore fluctuations in numbers would be expected.
Sea turtles nesting along both locations, nested within the typical season for the
loggerhead and green turtle in Florida. The earliest nests were most often observed during
the last week in May and the latest nests during the first week in August. On Cape San
BIas the greatest average percentage ofnests laid per year occurred in June (45.0%) and
July (45.2%) whereas on Santa Rosa Island the greatest percentage were laid in June
(46.7%) and the second greatest in July (39.4%). The average percentage of nests laid in
May (approximately 4%) and August (approximately 10%) in both locations was similar.
The loggerhead turtle typically nests in Florida from late April to early September (Van
Meter 1992). Peak nesting along Cape San BIas and Santa Rosa Island are encompassed
within this time span. The difference in nesting percentage between June and July along
Santa Rosa Island is most likely a natural fluctuation in the nesting pattern of the sea turtle
group nesting along this island.
26

In 1994 and 1995 along Cape San BIas, the greatest number of nests were laid in
July, whereas in 1996 and 1997 the greatest number were laid in June. This may indicate
that separate groups of turtles are nesting along Cape San BIas from year to year,
following the typical 2 year internesting period exhibited by most loggerhead turtles
(Miller 1997). These fluctuations may also reflect environmental variations along Cape
San BIas that may influence timing of nesting of these turtles. Hurricane Opal severely
influenced this area in 1995. Possibly, this storm altered the offshore or onshore
environment along Cape San BIas, which resulted in turtles nesting earlier than in the
previous years. Santa Rosa Island was also greatly influenced by Hurricane Opal, however
and this pattern was not evident. This indicates the fluctuations in timing of nesting along
Cape San BIas were most likely a natural pattern within the sea turtle group laying along
this beach.
The three miles ofbeach along Cape San BIas are extraordinarily dynamic. The
north beach erodes severely while the east beach accretes (see erosion chapter). Sea
turtles nesting along Cape San BIas typically laid along the eroding cape or north beach
rather than the accreting east beach. In 1994 and 1995, most nests were laid on the cape
beach (43.4% and 56.7%), whereas in 1996 and 1997 most nests were laid along north
beach (48% and 66.7%). Fewer than 25% of nests were laid along east beach throughout
each year of the study. This may reflect changes in the sea turtle group nesting along Cape
San BIas, or alterations in the offshore or onshore environment of this area.
Possibly, sea turtles nesting in 1994 and 1995 represented different individuals than
those nesting in 1996 and 1997. Variations in nesting behavior throughout this may be due
27

---------------------'-----
to these changes, The location of mating grounds of the loggerhead turtles nesting along
the Florida panhandle is unknown, If turtles are mating in the western gulf, and then
moving towards their nesting beaches along the panhandle, they may be approaching their
nesting beaches from the west, If this occurred off Cape San BIas, the turtles moving
along the coastline would be forced to cross the Cape San BIas spit to nest along the east
beach, The Cape San BIas spit extends approximately 15 miles into the Gulf ofMexico
and presents a barrier between the east and north beaches of Cape San BIas, Sea turtles
may primarily nest along the cape and north beach because of their direction of approach
to the island, and the barrier presented by the Cape San BIas spit.
Sea turtle nests laid along Cape San BIas and Santa Rosa Island encountered
several challenges to survival between 1994 and 1997, A severe storm season in 1995
influenced many nests along Cape San BIas and destroyed all but one nest along Santa
Rosa Island, Storm damage also affected both locations in 1994, however a mild season in
1996 and 1997 helped minimize losses to water inundation and erosion caused by tropical
storms,
In addition to storms, predators greatly influenced sea turtle nests along Cape San
BIas and Santa Rosa Island from 1994 to 1997, The number ofnests along Cape San BIas
lost to predators in 1994 increased from 7,55% to 56.0% in 1996, This pattern was also
evident along Santa Rosa Island, Predators claimed 16,7% of nests in 1994 and 59,5% in
1996, These increases were due primarily to an increase in coyote depredation of sea turtle
nests in both areas.
28

____'_~.ft _
Several activities were initiated in 1995 to assist in reducing losses to storm and
depredation. Along Cape San BIas, an increased number of nests were relocated from
1995 to 1997 than in 1994. Nests laid along the north beach are greatly influenced by
erosion and a high water table. In 1994, 35.8% of nests were relocated. This increased to
60% in 1995 and 1996, and 79.6% in 1997. A greater number of nests were relocated
between 1995 to 1997 because of the increased awareness of the threat of erosion and
depredation along Cape San BIas beaches, and due to the increased number ofnests laid
along the cape and north beaches.
On Santa Rosa Island, erosion was not as severe as along Cape San BIas, therefore
fewer nests required relocation due to inundation or erosion. Nests were relocated,
however, when influenced by predators. On Santa Rosa Island, a nest was relocated only
after an initial attempt at depredation occurred. The number of depredated nests increased
from 1994 to 1996, therefore a greater number of nests were relocated in 1995 and 1996
than in 1994. Fewer nests were relocated on Santa Rosa Island than on Cape San BIas.
In addition to relocation of nests, coyote control was conducted in the state park
adjacent EAFB on Cape San BIas in 1996 in an attempt to reduce losses of sea turtle nests
to coyotes. These methods appeared to be successful for the entire St. Joseph Peninsula.
The number of nests depredated along Cape San BIas decreased to 22.2% in 1997.
Continued trapping of coyotes within the state park may assist in protecting sea turtle
nests along EAFB on Cape San BIas.
Hatching success along Cape San BIas and Santa Rosa Island reflected numbers of
nests influenced by storms and depredation, and the numbers relocated. Hatching success
29

and the number ofnests that hatched at least one egg increased along Cape San BIas from
1994 to 1997. This is most likely a result of a decreased number of nests lost to storms
(62.3% in 1994 vs 0% in 1997) and an increased number ofnests relocated (35.0% in
1994 and 79.6% in 1997).
Along Santa Rosa Island, hatching success and the number ofnests that hatched at
least one egg decreased sharply in 1995, but then increased in 1996 and 1997. The sharp
decrease in 1995 is the result of a severe storm season that destroyed 94.4% of nests laid
that season. Although a greater number of nests were depredated along Santa Rosa Island
in 1996, more nests were also relocated, therefore hatching success and hatching per nest
were also able to increase. Losses from depredation and storms decreased in 1997,
therefore hatching success was again able to increase. Less depredation and storm activity
also allowed for relocation offewer nests in 1997.
It appears relocating nests along Cape San BIas and Santa Rosa Island from 1994
to 1997 promoted increased success of sea turtle nests laid along in areas. Along Cape San
BIas, the number of nests that hatched at least one egg was greater for relocated than in
situ nests during every year of the study. In 1994 and 1995, hatching success was slightly
less for relocated than in situ nests, but in 1996 and 1997 it was substantially greater for
relocated than for in situ nests. The severe storms that influenced Cape San BIas during
1994 and 1995 most likely contributed to the decreased success of relocated nests in those
years. Total hatching success was also less in 1994 and 1995 than in 1996 and 1997. With
an increase in total hatching success in 1996 and 1997, an increase in success of relocated
nests was also observed.
30

Similar trends were observed along Santa Rosa Island. Hatching success and the
number ofnests that hatched at least one egg were less for relocated than in situ nests in
1994. In 1995, no nests hatched, but in 1996 and 1997, both measures of hatching success
were greater for relocated than for in situ nests. Again, total success was less in 1994 than
in 1996 and 1997, most likely due to the severe storm season of 1994. When total success
increased, success of relocated nests also increased. This indicates that along Cape San
BIas and Santa Rosa Island, relocating nests may have resulted in increased hatching
success of nests.
Development among those eggs that did not hatch, varied from no development to
arrested development. When laid, the egg shell is creamy-white. Shortly after being laid,
the top of the egg turns white, and this process continues for approximately 10 days, until
the entire egg is white. Eggs that do not tum white are most likely infertile or the embryo
died before attaching to the shell membrane (Miller 1997). Those eggs that showed no
development or addled conditions when examined may have been infertile when laid, or
may have been influenced by external factors, such as environmental factors or
disturbances. Excessive rain may cause inundation ofeggs thereby drowning embryos
before they are able to develop. In addition, disturbances to the egg chamber may destroy
conditions necessary for successful development. Predators may invade the chamber and,
in addition to direct death of eggs, they may result in cessation ofdevelopment.
Movement of eggs during relocation may also cause enough disturbance to cease
development of embryos.
31

Management Recommendations
Cape San BIas
The natural and human disturbances that influence Cape San Bias also effect the
sea turtles that rely on its beaches for survival. The severe erosion that occurs along north
beach threatens the majority ofnests laid on that beach. In 1994, three nests were left in
situ along north beach. In 1995, one nest was left in situ, and in 1996 five nests remained
in situ along north beach. Ofthese nests, none of the eggs hatched. In 1997, 8 nests were
left in situ, and of those, five nests experienced some degree of hatching. Of the 436 eggs
in those nests, 229 hatched (52.5%). Average hatching success among all four years was
13.1%, indicating that nests left in situ along north beach have a small chance of success.
From 1994 to 1997, the number of nests laid along north beach increased, therefore
threatening the survival of more nests. It is impossible to stop the natural erosional forces
influencing this area, therefore continued monitoring and protection of sea turtle nests is
necessary to preserve successful hatching of nests laid along Cape San BIas beaches.
1. Continued monitoring of sea turtle nests laid along EAFB on Cape San Bias is
recommended. In addition to monitoring, relocating nests severely threatened by
erosion and inundation is advised, however, only those nests in immediate danger
should be moved. Moving approximately 25% or fewer of nests laid in highly
eroding areas (north and cape beaches) is suggested.
32

In addition to storms, predators have also greatly influenced sea turtle nesting
success along Cape San BIas. It would be difficult to remove all predators from the Cape
San BIas area, therefore continued protection of sea turtle nests from predators is
necessary. Reduction of the coyote population through control may decrease the number
of coyotes depredating sea turtle nests, however if may increase raccoon predation.
Coyotes often decrease populations of additional predators, such as raccoons or foxes
through competition, therefore, an increase in the number of coyotes in an area may help
decrease the raccoon or fox depredation, however it may also result in depredation of sea
turtle nests by coyotes. On Cape San BIas, from 1994 to 1997, coyotes did not depredate
nests once the nests had been screened. All coyote depredation occurred before nests had
been located during morning surveys. Therefore, surveying at night for nesting turtles, or
starting morning surveys earlier may reduce the number of nests influenced by coyotes.
Coyote control would assist in decreasing the coyotes population, however it may also
allow for an increase in the raccoon population. Raccoons depredate sea turtle nests
throughout incubation and are able to reach through screens to remove eggs, therefore
they are more difficult to manage for than coyotes. Using coyotes to control the raccoon
population and then managing for coyotes may be the most efficient way to manage for
these predators.
There are additional predators that influence sea turtle nests, including ghost crabs
and fire ants. Ghost crabs are an abundant and important species among most southeastern
beach systems, therefore their removal would be difficult and would most likely adversely
effect the beach habitat (Ruppert and Fox 1988). Because they depredate such a few
33

number of sea turtle eggs per season, it may be unnecessary to attempt control of these
predators.
Fire ants, however, may require control along Cape San BIas in the future. No
eggs were lost to fire ants in 1994, however, since then the number of nests affected by
these predators has increased. Red imported fire ants were introduced into the United
States in the 1930's and have now spread to most of the southeastern U.S. (Allen et al. in
press). Fire ants tend to invade an area in extremely high densities and then population
numbers stabilize or slowly increase (Allen et al. in press). They typically favor disturbed
areas, such as pastures, yards, clear-cut forests, or plowed fields. They are excellent and
aggressive colonizers that can readily out compete native species, therefore they are not
limited to disturbed sites, but are also known to invade undisturbed areas, such as the
Marquesas Keys, west ofKey West, Florida. General habitat requirements for red
imported fire ants include high sun exposure and adequate moisture, both ofwhich are
readily available along Cape San BIas. Fire ants are capable of depredating species much
larger than themselves, including bobwhite quail, alligators, and box turtles (Terrapene
carolina triunguis; Allen et al. in press, Montgomery 1996). Fire ants are attracted to
proteins, sugar, and moisture. A readily available source of these are egg contents and
newborn young ofvertebrates, as well as insects. Waterbird nest mortality was as high as
100% on fire ant infested barrier islands (Drees 1994), and Moulis (1996) documented a
15% decrease in hatchling release rate for loggerhead sea turtles emerging from nests
infested with fire ants as compared to uninfested nests. Because of the increase in
numbers ofnests along Cape San BIas affected by fire ants from 1994 to 1997, it is
34

apparent fire ants have immigrated to Cape San BIas.
It is difficult to protect sea turtle eggs from fire ant depredation. Use of pesticides
near sea turtle nests may be harmful to the incubating eggs. Continued monitoring of fire
ant depredation of sea turtle nests is necessary to determine the extent of the threat these
species pose to nests along Cape San BIas. If their depredation rates increase, protection
efforts, such as Amdro, may be necessary.
2. Continued screening of sea turtle nests is recommended for protection from
coyotes and raccoons. Further research into fire ant removal will help provide safe
methods for protecting nests without harming eggs or the surrounding wildlife.
In addition to natural threats, sea turtles nesting along Cape San BIas must also
survive human disturbances. Vehicular traffic is permitted along EAFB on Cape San BIas.
The affects of this activity on the beach habitat is not completely known, however it may
contribute to the erosion that occurs in this area (see erosion chapter). Erosion on this
barrier island occurs primarily due to natural forces, therefore restricting vehicles on Cape
San BIas may not eliminate this threat to nesting sea turtles. Sea turtles also typically nest
at night, therefore driving along the beach during the day may not disturb nesting females.
Driving during the day may, however, greatly influence nests and hatchlings, and night
time driving may severely disturb nesting females, nests, and hatchlings. Therefore,
although beach driving may not affect sea turtle nests by causing erosion, it may greatly
influence nesting sea turtles, particularly at night.
Day-time driving along the beach may cause injury primarily to nests and
35

--_.~._-,._-------
hatchlings. Sea turtles often lay below the dune line. Nests laid close to or below mean
high water are often relocated by sea turtle nest monitors during morning surveys.
Occasionally, however, vehicles driven on the beach before sea turtle surveys have been
completed, ride over nests laid seaward of the dune line. This may disturb or destroy a
nest, particularly if the nest was laid in soft, wet sand that could not support the weight of
the vehicle.
Driving on the beach during the day may also influence hatchling sea turtles.
Vehicles often leave ruts in the beach, especially in dry sand. Hatchling sea turtles
attempting to make their way seaward after emergence often get caught in vehicle tire ruts
and are either unable to escape or become more obvious prey for predators. In addition to
increasing the risk of death while traveling down the beach, hatchlings may also use more
energy attempting to escape tire ruts. This may deplete much of their energy reserves,
which may increase their risk of death once they reach the water.
Vehicles may also influence hatchling sea turtles more directly. Hatchlings typically
emerge when sand temperatures are cool, which often occurs after the sun has set (Miller
1997). Because sand temperature is the primary cue for hatchling emergence, hatchlings
also emerge occasionally at dawn or during a daytime rainstorm when sand temperatures
have decreased (Miller 1997). Vehicles driving on the beach during an emergence may
drive over hatchlings attempting to reach the water. Both directly and indirectly, daytime
vehicular traffic along Cape San BIas beaches represents a potentially destructive
disturbance to sea turtles, especially to their nests and hatchlings. Because daytime
emergences and nests laid below mean high water are rare, however, daytime traffic may
36

be possible if intense public education occurs and specific driving restrictions are
observed.
3. Driving vehicles on the beach during daylight hours (0600 to 2200 hours) may
continue to occur, however close monitoring of nesting and hatching should
continue.
Driving along the beach at night, however, poses a much more serious threat to
sea turtles including, nesting females, nests, and hatchlings. Vehicles traveling on the
beach at night provide a variety ofhazards to nesting sea turtles, including direct death,
lighting disorientation, and nest abandonment. Because females come ashore to nest at
night, drivers traveling on the beach after dark may have difficulty seeing a turtle on the
beach, and may crush her beneath the vehicle's tires. Driving without lights increases the
chances of running over a turtle, whereas driving with headlights may severely disorient
and disturb a female attempting to nest. Vehicles driven at night may also effect sea turtle
nests by traveling over a newly laid nest, which may damage or destroy the eggs. Vehicles
traveling on the beach at night during sea turtle nesting season represent a serious threat
to nesting females and the nests they are laying.
Hatchlings may be at the greatest risk from vehicles driven at night both directly
and indirectly. Hatchling sea turtles often emerge from the nest at night in a group,
therefore a vehicle driven along the beach during an emergence may not crush only one
hatchling but a large group of hatchlings (Miller 1997). Sea turtle hatchlings are small,
approximately 20 g in total weight, and dark colored. A driver operating a vehicle would
37

have an extremely difficult time observing hatchlings moving down the beach at night. If
drivers use their headlights they would be able to see the hatchlings, however headlights
would cause severe hatchling disorientation and would indirectly threaten hatchling
survival as much as the vehicles themselves. Hatchling sea turtles orient themselves to the
water using several cues (Salmon and Wyneken 1994). They typically move downhill and
away from the darkest part of the horizon and towards the lightest region (Salmon and
Wyneken 1994). Artificial lights on the beach result in significant disorientation of sea
turtle hatchlings (Witherington and Bjomdal 1989). Lights such as vehicle headlights,
porch lights, spot lights, flashlights, and bonfires cause hatchlings to become disoriented
(pers. obs).
Because EAFB property on Cape San BIas is contiguous with adjacent beaches, it
would be difficult to restrict driving on EAFB property. A fence or gate would have to be
placed vertically along the beach to prevent drivers from entering the property. This
would be logistically difficult, if not impossible, because wave action and sand movement
would quickly destroy the structure. A more effective method of restricting traffic on
EAFB property is to limit driving along the entire beach from Indian Pass to St. Joseph
State Park. Limitations have already been placed on drivers using the beach north of
EAFB property, therefore control would only be necessary along Indian Pass and EAFB
property. There are no vehicle entry points along EAFB property, therefore, access to this
beach is limited to entry points east ofEAFB property to Indian Pass. Blocking illegal
access roads and limiting access to legal entry points would effectively control vehicular
traffic on EAFB property during sea turtle season. This requires cooperation with the
38

Gulf County Sheriff's Department. Official and illegal access roads would have to be
monitored by deputies to enforce proper use and to close the roads when driving is
restricted. Minimal effort is required, however, for this to be effective.
4. Vehicles and bonfires should be restricted on EAFB beaches on Cape San Bias
from June 15 through October 15 during night-time hours (2200 hours to 0600
hours). CONTROL OF ACCESS ROADS FROM INDIAN PASS TO EAFB
PROPERTY AND COOPERATION WITH THE GULF COUNTY SHERIFF'S
DEPARTMENT WILL ALLOW RESTRICTIONS TO BE EFFECTIVE.
Santa Rosa Island
Variations in the number of nests laid along Santa Rosa Island appear to be the
result of a biyearly pattern ofgreen turtle nesting that occurs on this barrier island. Green
turtles typically nest on large dunes, therefore Santa Rosa Island offers suitable nesting
habitat for green turtles. Destruction of this dune system may prevent green turtles from
nesting in this area. In 1995, however, Hurricane Opal destroyed much of Santa Rosa
Island's dune system, yet 14 (33%) green turtle nests were laid in 1996. This indicates
that even after severe damage, the dune habitat along Santa Rosa Island provides
appropriate nesting sites for green turtles. Protection of these dunes by planting of dune
vegetation, may assist in protecting this habitat.
1. Planting of dune vegetation may assist in protecting this habitat for green turtle
nesting.
39
----------------------
Two forces influencing sea turtle nests along Santa Rosa Island cause the greatest
amount of destruction to the success of these nests. Hurricanes have detrimentally
affected the success of sea turtle nesting along this portion ofEglin Air Force Base since
sea turtle monitoring by the University ofFlorida began in 1994. The affect of predators,
however, appears to have increased since 1994, insinuating an increase in the number of
predators located on this island.
Hurricanes are natural forces therefore it is difficult to create management plans
for these disturbances. Sea turtle nests laid near or below mean high water appeared to be
at greatest risk during the minor storms that influenced this area between 1994 and 1997,
therefore relocating nests laid in this area may assist in protecting them during minor
tropical systems. Major storms, such as Hurricanes Erin and Opal, however, caused
severe damage to all nests, therefore management actions, such as relocating nests, appear
to be futile against these severe forces.
2. Although hurricanes cause severe damage to sea turtle nests, it is difficult to
prevent this destruction. Relocation of nests above mean high water may protect
nests during minor tropical storms.
Management actions against depredation of nests may be more successful,
however. On Santa Rosa Island, sea turtle nests are not screened until evidence of
depredation appears. Typically, some damage to nests occurs before screens are used.
Earlier placement of screens, such as when nests are laid, may assist in preventing this
initial depredation.
40

After initial depredation, screens appear to reduce coyote depredation, however
they do not seem to reduce raccoon or fox depredation (M. Lamont, pers. obs.). Fox and
raccoons are able to fit their paws through the screening and pull eggs or hatchlings out of
the egg chamber, or to dig under the screen (M. Lamont, per. obs.). To assist with these
more dextrous predators, wire cages were developed that protect the egg chamber from
above and along the sides. The cages rest approximately one foot above the nest thereby
preventing raccoons from reaching through the cage and into the egg chamber. The cage
is buried at least 6 inches in a trench surrounding the nest to prevent foxes from digging
into the egg chamber from the side. Use of these cages from the day a nest is laid may
prevent depredation of nests by coyotes, fox, and raccoons. If additional depredation
occurs after cages have been put in place, predator control along the island may be
necessary.
3. Caging nests upon deposition should assist in preventing depredation by coyotes,
raccoons, and foxes. If nests continue to be depredated, predator control should be
implemented.
Variations in hatching success along Santa Rosa Island have occurred primarily
due to storms and depredation. Management of these forces may stabilize or increase
hatching success of sea turtle nests along Eglin Air Force Base on Santa Rosa Island.
Increasing hatching success may allow for more hatchlings to be produced along
Santa Rosa Island, however more hatchlings emerging may simply result in more
disoriented hatchlings. Hatchlings emerging along Santa Rosa Island often disorient
41

towards lights on Air Force buildings or the glow of surrounding cities such as Destin and
Fort Walton Beach. In the past, the dune system shielded the beach from these lights,
however destruction of these dunes by Hurricane Opal allowed for direct illumination of
the beach and increased hatchling disorientation. Lights on Air Force buildings should be
shut off at night, or replaced by low sodium vapor lights that may reduce the chance of
disorientation. It is more difficult, however to shut off all the lights ofDestin or to replace
them all with low sodium vapor bulbs. It may be possible, however, to shield the beach
from these lights with backdrops. Several days before a nest is scheduled to hatch, a large
shield may be placed at the dune line, landward of the hatching nest. When hatchlings
emerge, this shield may block the glow of lights from surrounding cities and allow for
hatchlings to properly orient themselves. This may be logistically difficult however.
Therefore, if a backdrop is not possible, volunteers may monitor hatching at night, and
relocate emerged hatchlings to darker areas of the beach. Non-releasing cages may also
be used which would allow for hatchlings to emerge naturally, however, they would not be
able to escape the cage. Volunteers or technicians may then move the hatchlings to a
darker area and allow to crawl to the sea. If cages are monitored frequently (at least late
each evening and early each morning), hatchlings may successfully emerge and not
become disoriented.
4. Turning ofT Air Force lights or replacing Air Force light bulbs with low sodium
vapor bulbs may assist in decreasing hatchling disorientation. In addition, non
releasing cages should be used, which would allow hatchlings to emerge naturally
and then be relocated to darker areas.
42
Literature Cited
Ackerman, R. A. 1997. The nest environment and the embryonic development of seaturtles. Pages 83-106 in The Biology of Sea Turtles, P. L. Lutz and 1. A. Musickeds. CRC Press, Boca Raton, FL.
Johnson, A. F. and M. G. Barbour. 1990. Dunes and Maritime Forests. Pages 429-480 inEcosystems ofFlorida, R. L. 'Myers and 1. 1. Ewel, eds. 765 pp.
Lohmann, K. 1. and C. M. F. Lohmann. 1996. Orientation and open-sea navigation in seaturtles. The Journal ofExperimental Biology 199: 73-81.
MacCracken,1. G. and D. W. Uresk. 1984. Coyote foods in the Black Hills, SouthDakota. Journal ofWildlife Management 48(4): 1420-1423.
Miller, 1. D. Reproduction in sea turtles. Pages 51-82 in The Biology of Sea Turtles, P. L.Lutz and 1. A. Musick, eds. CRC Press, Boca Raton, FL.
Van Meter, V. B. 1992. Florida's Sea Turtles. Florida Power and Light Company.Miami, FL 60 pp.
Ruppert, E. E. and R. S. Fox. 1988. Seashore animals of the Southeast. University ofSouth Carolina Press, Columbia, South Carolina. 429 pp.
Salmon, M. and 1. Wyneken. 1994. Orientation by hatchling sea turtles: mechanisms andimplications. Herpetological Natural History 2(1): 13-24.
Witherington, B. E. and K. A. Bjorndal. 1991. Influences of artificial lighting on theseaward orientation of hatchling loggerhead turtles Caretta caretta. BiologicalConservation 55: 139-149.
43

Imiles
0.00 0.25
I~-l
N
t
Figure 1. Eglin Air Force Base on Cape San Bias, Florida where sea turtle nestingactivity was monitored from 1994 to 1997.
44
~L-lmiles
Santa Rosa Sound b -=2:znGulfof Mexico
Choctawatchee
Bay
iii~
Figure 2. Eglin Air Force Base, including property owned on Santa Rosa Island where sea turtle nesting surveys wereconducted from 1994 to 1997.

200
180
160
14J CSB
120
100
80
60
40
20
0
1994
CSB
1995 1996
• Crawls - CSB
o False Crawls - CSB
IINests - CSB
liS Crawls - SRI
r::IFalse Crawls SRI
8Nests - SRI
1997
\0"¢
Figure 3. Number of sea turtle crawls, false crawls and nests along Eglin Air Force Base on Cape San BIasand Santa Rosa Island, Florida from 1994 to 1997

-----
/
/
r~
,,,,
1997
,/
/
/,/
/,/
/
-
/,/
I",/,
1996
"..,."..
"..
".."..
".."..
".."..
1995
- .- . nests that hatched - CSB
- - • - -hatching success - CSB
--nests that hatched - SRI
- hatching success - SRI
100
90
80
70 -
VlVl 60Q)00~Vl
eo 50j0~~ 40~
30
20
10
0
1994
Figure 4. Hatching success and percent nests that hatched at least one egg along Eglin Air Force Base on CapeSan BIas and Santa Rosa Island, Florida from 1994 to 1997

-- --------- ------------------------------------------------------- ---------------
Table 1. A summary of the sea turtle crawls that occurred along Eglin Air Force Baseon Cape San BIas (a.) and Santa Rosa Island (b.), Florida from 1994 to 1997.
a
1994 1995 1996 1997
Total # Crawls 131 181 70 109
Total # False Crawls 77 121 45 55
Earliest May 19 May 16 May 27 May 15
Latest Aug. 13 (N) Aug. 22 Aug. 15 Aug. 12
May 0(0.00%) 10 (8.30%) 1 (2.20%) 6 (10.9%)
June 29 (37.7%) 49 (40.5%) 24 (53.3%) 21 (38.2%)
July 30 (39.0%) 55 (45.5%) 16 (35.6%) 24 (43.6%)
August 18 (23.4%) 7 (5.80%) 4 (8.90%) 4 (7.30%)
North 40 (51.9%) 56 (46.3%) 17 (37.8%) 26 (47.3%)
Cape 31 (40.3%) 43 (35.5%) 15 (33.3%) 17 (30.9%)
East 6 (7.79%) 22 (18.2%) 13 (28.9%) 12 (21.8%)
b.
1994 1995 1996 1997
Total # Crawls 106 28 88 47
Total # False Crawls 58 10 46 25
# Loggerhead 44 (75.9%) 28 (100%) 34 (73.9%) 47 (100%)
# Green 14(24.1%) 0(0.00%) 12 (13.6%) 0(0.00%)
Earliest May 23 May 25 (N) May 27 May 28
Latest Aug. 23 Aug. 8 (N) Aug. 17 (N) Aug. 14 (N)
May 7 (12.1%) 2 (20.0%) 4 (8.70%) 4 (16.0%)
June 19 (32.8%) 5 (50.0%) 19 (41.3%) 11 (44.0%)
July 20 (34.5%) 2 (20.0%) 19 (41.3%) 8 (32.0%)
August 12 (20.7%) 0(0.00%) 6 (13.0%) 2 (8.00%)
48

Table 2. A summary of the sea turtle nests laid along Eglin Air Force Base on Cape San BIas andfrom 1994 to 1997.
1994 1995 1996 1997
Total # nests 53 60 25 54
Earliest May 19 May 25 June 7 May 19
Latest Aug. 12 Aug. 18 Aug. 10 Aug. 11
May 2 (3.77%) 3 (5.00%) 0(0.00%) 3 (5.60%)
June 13 (24.5%) 18 (30.0%) 13 (52.0%) 27 (50.0%)
July 29 (54.7%) 37 (61.7%) 10 (40.0%) 22 (40.7%)
August 4 (7.55%) 2 (3.33%) 2 (8.00%) 2 (3.70%)
North 12 (22.6%) 16 (26.7%) 21 (48.0%) 36 (66.7%)
Cape 23 (43.4%) 34 (56.7%) 8 (32.0%) 10 (18.5%)
East 18 (34.0%) 10 (16.7%) 5 (20.0%) 8 (14.8%)
Avg. clutch size 102.7 89.1 96.2 112.4
Hatching success 5.73% 9.54% 26.9% 64.3%
# nests hatched at least 1 egg 10 (18.9%) 11 (18.3%) 11 (44.0%) 47 (87.0%)
Avg. incub. length 64.7 55.9 64.2
49
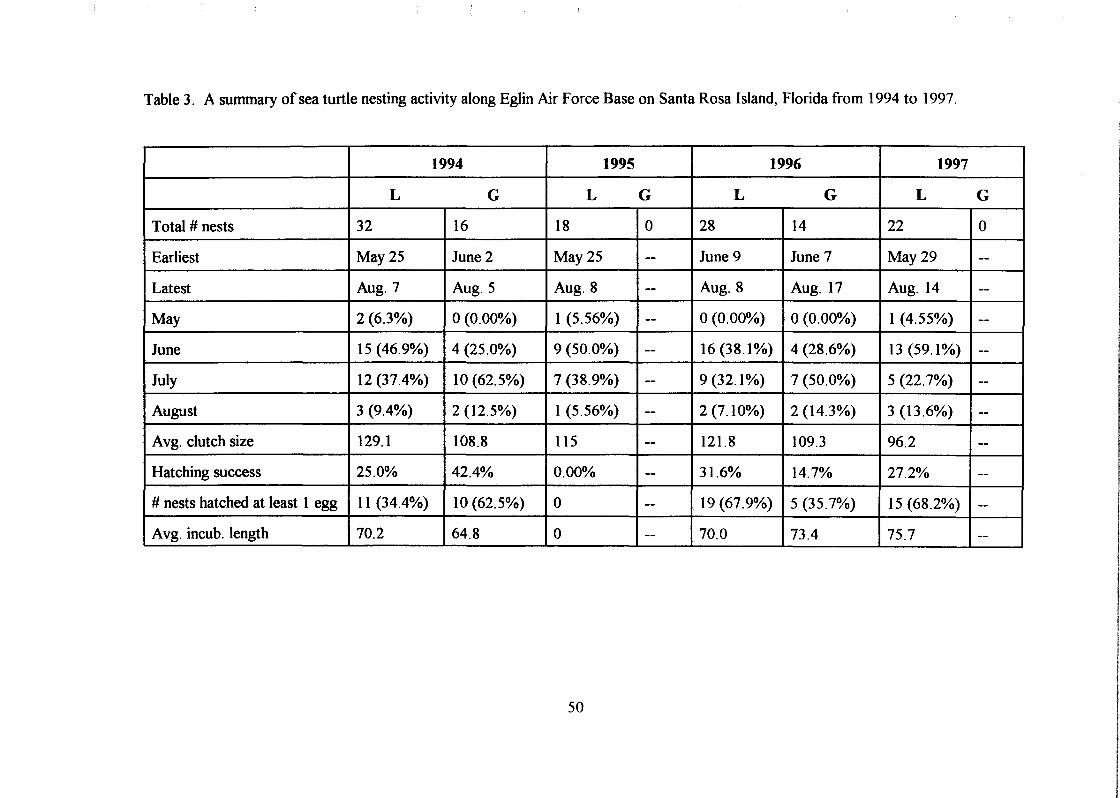
Table 3. A summary of sea turtle nesting activity along Eglin Air Force Base on Santa Rosa Island, Florida from 1994 to 1997.
1994 1995 1996 1997
L G L G L G L G
Total # nests 32 16 18 0 28 14 22 0
Earliest May 25 June 2 May 25 -- June 9 June 7 May 29 --Latest Aug. 7 Aug. 5 Aug. 8 -- Aug. 8 Aug. 17 Aug. 14 --
May 2 (6.3%) 0(0.00%) 1 (5.56%) -- 0(0.00%) 0(0.00%) 1 (4.55%) --
June 15 (46.9%) 4 (25.0%) 9 (50.0%) -- 16(38.1%) 4 (28.6%) 13 (59.1%) --
July 12 (37.4%) 10 (62.5%) 7 (38.9%) -- 9 (32.1%) 7 (50.0%) 5 (22.7%) --August 3 (9.4%) 2 (12.5%) 1 (5.56%) -- 2 (7.10%) 2 (14.3%) 3 (13.6%) --Avg. clutch size 129.1 108.8 115 -- 121.8 109.3 96.2 --Hatching success 25.0% 42.4% 0.00% -- 31.6% 14.7% 27.2% --
# nests hatched at least 1 egg 11 (34.4%) 10 (62.5%) 0 -- 19 (67.9%) 5 (35.7%) 15 (68.2%) --Avg. incub. length 70.2 64.8 0 -- 70.0 73.4 75.7 --
50

Table 4. Summary of relocated sea turtle nests along Eglin Air Force Base on Cape San BIas (a)and Santa Rosa Island (b), Florida from 1994 to 1997.
a
1994 1995 1996 1997
# relocated nests 19 (35.8~) 36 (60.0%) 15 (60%) 43 (79.6%)
Hatching success - reI. 3.23% 9.28% 44.9% 72.2%
in situ 7.12% 9.94% 0.00% 33.8%
at least one hatchling - rel 7 (20.6%) 10 (27.8%) 10 (66.7%) 41 (75.9%)
in situ 3 (15.8%) 5 (20.8%) 0(0.00%) 6 (54.5%)
Incubation length - reI. 66.0 days 56.5 days 64.2 days 62.2 days
in situ 64.1 56.2 0 53
Avg. clutch size - reI. 102.2 eggs 96 eggs 107.7 eggs 112.2 eggs
in situ 104.4 76.1 79.0 112.9
b
1994 1995 1996 1997 ~l
L G L G L G L G'
# relocated nests 5 0 4 (22.2%) 0 15 (53.6%) 1 (6.30%) 1 (4.50%) <qHatching success - reI. 16.8% -- 0.00% -- 39.2% 0.00% 35.9% -
in situ 26.5% -- 0.00% -- 22.9% 15.9% 26.8% -~I
At least one hatchling - rel 2 (40%) -- 0(0.00%) -- II (73.3%) 0(0.00%) 1 (100%) -,in situ 9 (33.3%) -- 0(0.00%) -- 8 (61.5%) 5 (38.5%) 14 (66.7%)
_I
Incubation length - reI. 73 days -- -- -- 67.2 days -- 74.0 days -"l69.6 days 73.4 days
Iin situ -- -- -- 73.3 days 75.9 days -
Avg. clutch size - reI. 107.5 -- N/A -- 119.9 eggs 101 eggs 142 eggs -~l
eggs
in situ 134.5 -- N/A -- 104.0 eggs 109.9 eggs 92.9 eggs --1eggs
51

Table 5. Summary of storm and predator damage to sea turtle nests along Eglin Air Force Base onCape San BIas (a.) and Santa Rosa Island (b.), Florida from 1994 to 1997.
a.
1994 1995 1996 1997
# lost to erosion 33 (62.3%) 17 (28.3%) 0(0.00%) 0(0.00%)
# depredated 4 (7.55%) 27 (45.0%) 14 (56.0%) 12 (22.2%)
coyotes 4 27 14 --
raccoons -- -- -- --ghost crabs -- I partial -- 9 partial
fire ants -- -- -- 4 partial
unknown -- -- -- 2 partial
b.
1994 1995 1996 1997
# lost to erosion 16 (33.3%) 17 (94.4%) 1 (2.38%) 4 (18.2%)
# depredated 8 (16.7%) 1 (5.60%) 25 (59.5%) 12 (54.5%)
coyotes -- -- 14 --raccoons 5 -- I partial --
foxes -- I partial 16 12
ghost crabs 1 partial 1 partial 3 partial 6 partial
fire ants 1 partial -- -- --unknown 1 -- -- --
52