air photo interpretation in soil survey
DESCRIPTION
Detailed analysisTRANSCRIPT

2. AIR PHOTO INTERPRETATION I N SOIL SURVEYS
2.1. AIR PHOTO INTERPRETATTON AS A TOOL
Air photo interpretation is an essential tool in modern soil surveys. It should be applied, however, in a systematic way, following the methods which have been developed for this. The method developed by BURMGH (1960) at the I.T.C. is what we call full systematic air photo interpretation. This method always requires a systematic field check as well (see par. 2.2.). In the following paragraphs we shall try to give a rough impression of the amount of field observation which in general we think is necessary for the various publication scales of soil maps. In its full implications however, this only is valid for the soil scientist who does not take sufficiently to heart the maxim that “each soil unit is a particular kind of landscape. It is defined by its landform and profile and ranges in each” (Soil Survey Manual, page 131). This can also be expressed in the following: “its landform is an essen- tial part of a soil, conceived as a three dimensional landscape resulting from the synthetic effect of all the materials and processes in its environment” (Soil Survey Manual, page 155). Various other quotations can be given to the effect that the efficient soil survey takes the landscape into its survey as well as the profile. The efficiency of a soil survey is mainly determined by the way in which the soil surveyor can combine these two aspects of the soil. If this is done, the rigid grid survey is almost wholly out of the picture and in- stead there comes the more flexible way of surveying as it is handled by most modern soil surveys in various parts of the world. On the one hand this makes for a better and more efficient system of soil survey. On the other hand it certainly makes it necessary to have better trained field personnel. This is also the reason why the various data from tables 2-5 (par. 3.4) are given with a large margin.
According to BURINGH (personal communication) it should be remembered that the field observations of a soil survey consist of three different kinds :
12

Air photo interpretation
I . observations for soil description and classification, 2. observations for soil boundaries, and 3. special observations according to the practical purpose of the survey. In any area the most efficient survey method is determined by the physiographic features, their correlation with the soils, the expert knowledge of the soil surveyors working in the area, and by the practical purpose of the survey. According to these the three different kinds of field observations will be combined in a different way, both as regarding the total number of observations and the percentages of each kind. This holds still more for the use of air photos, which in theory is of the same order. The air photo gives a systema- tic approach to what any competent soil surveyor would do in the field anyway. In many cases it does have the result, that the soil association is easier to map than the soil series. In this way the air photo certainly has a direct influence on soil science regarding the general kind of soil map which will be provided. In soil surveys the air photo is a tool which may perhaps be best compared with the mi- croscope in biology, where it is a tool which has had a certain influence on the relative importance which is attributed to various biological phenomena. This is now perhaps being gradually replaced by the more modern instruments and methods such as bioche- mistry. In the same way the air photo is a tool, but the most efficient use of this tool will make it possible to map the soil associations quite easily, and perhaps in some cases will have the influence of a slightly more practical effect on the execution of soil surveys over large areas for practical purposes. This is certainly not meant to detract the systematic and theoretic pedological field research, but the latter should be done in well chosen sample areas. In this way the sample area gives various possibilities without a large area having to be mapped in an impractical way. First of all the sample area is used as a control for the interpretation of the air photo and for establishing correlations between the phenomena observed from the air photo and in the field. Secondly it is then used to describe and in- vestigate the variations within the soil mapping units as used for the total survey area in correlation with air photo interpretation. Thirdly the sample area provides the best loca- lities for research of a more theoretical pedological nature which is certainly necessary for more investigation into the soils of a region. Generally the sample areas are picked specially for their typical characteristics, thus giving the possibility of studying pedological phenomena in the most interesting spots. They are also the best areas for specific investigations of a more practical nature.
The specifications for a soil survey using au photo interpretation must consider the vari- ous aspects of the survey. First of all a list of specifications for the air photos must be prepared (see appendix). Secondly the way of executing the air photo interpretation must be indicated. In the third place the way of choosing the sample areas and of describing the soils in these areas must be indicated. In the fourth place the general field check which follows
13

after the investigations in the sample areas have advanced sufficiently should be described, together with the kind of chemical and physical soil analyses which must be made. All this can, however, only be done after a careful discussion with all persons and organizations concerned, of 1. the purpose of the soil survey, 2 . the scale of map which is really needed for this purpose, 3. the time within it should be ready and the number of personnel available. In many cases it is this last point which raises the most difficulties. The only practical way of approach to the specifications of a soil survey is therefore to realize what can be done. The putting-out of specifications without sufficient thought to these points is in most cases senseless and does not give satisfaction either to the organi- zation ordering the survey or to the people who have to be trusted with the execution.
The ordering of a soil survey even if it is done by tender is not to be compared with a tender for a construction of a road or a bridge. Soil survey is a piece of research. This gives a fundamental difference with projects of construction, where the necessary research has been done before the project is undertaken. The organization which handles a soil survey by tender is in fact hiring a temporary ex- tension to its soil survey department. Of course the financial consequences should be kept within the reasonable limits of a budget in the same way as any research must be budgeted for and controlled. But the commercial tender as such should be handled very carefully, because it may make for poorer quality work than the client has a right to expect, simply because the client himself does not realize that research always brings up new problems which can sometimes be put on the shelf if they are of a more or less theo- retical nature, but which sometimes give the indication of very important practical aspects of the use of the survey in the region concerned.
2.2. SOIL SURVEY AND THE AERIAL PHOTOGRAPH
The field methods used in soil survey often have a very personal aspect, which is caused partly by the variations in the set-up of the soil classification system and legends of the various countries, and partly by the influence of the physiography of the area to be mapped. The efficiency of a soil survey is largely dependent on the personal experience and capa- bilities of the soil surveyor. We all know, that there are enormous differences between the time needed by different persons for a survey of a certain area. The cost of the soil survey is also very largely influenced by this personal aspect. Part of this difference is caused by the more or less effective use that the soil surveyor makes of various indications in the field such as the geomorphology, vegetation, land use and other phenomena. This holds especially for semi-detailed soil surveys, for instance on a scale of 1 : 50.000. An equiva- lent of this is the scale of 1 inch to 1 mile which is very often used in Britain and America. But nevertheless this approach is also very important for the production of detailed soil maps. For soil maps on very small scales, such as 1 :lOO.OOO or less, the use of the soil
14

Air photo interpretation
association in a physiographic sense is undisputed. There, in any case, every capable soil surveyor would use the physiographic boundaries as his main units, indicating them as associations of, for instance, series families or soil groups.
The use of air photos for soil surveys is in fact comparable to the use which any soil sur- veyor makes of the correlative indications in the field, but in this respect the air photo has some very definite advantages. First of all it is possible to analyse systematically the whole area to be surveyed, using the air photo. Secondly if vertical air photos are used, the point of view of the whole area is the same. The soil surveyor trudging up a hill (which in any case is often a very rare phenomenon) to get a view over an area, is often hampered by the vegetation which he finds blocking his view, even when he has climbed the hill. So the third advantage, a very simple one, is that the whole countryside may be viewed. There is a fourth advantage, which consists of the possibility of planning in advance the field work to be done in the area, taking into account the indications of the physiography that have been studied on the air photo. All these various aspects are important in determining the enhanced production of soil surveys by the use of air photo interpretation. The necessity of going into the field to really map the soils always remains as the soil as such is not to be seen on the aerial photograph. All lines drawn in air photo interpretation for soil surveys are based on the above mentioned correlations, but the soil surveyor who has some experience of this kind of work succeeds in drawing almost all the lines needed for his survey. Of course a large part of this efficiency is also determined by his pre-inter- pretation knowledge of the area. Roughly it may be said, however, that about 80 % of all the observations made in the field during a normal soil survey are needed for locating the boundaries, the other 20 % being used to describe the soils. In an average case, using air photo interpretation, it is possible to reduce the amount of field work for locating the boundaries to about 10%. This means that the total observations are reduced to about 30 % of the field observations normally made during a traditional soil survey. Also, be- cause of more careful planning of the field traverses, the lines to go between the observa- tions will, on the average, be shorter. So therefore it may be said that at least in very many cases the efficiency of the soil survey using air photo interpretation is about 3 times as high as that of the traditional soil survey. Of course, depending on the kind of basic soil survey unit used, there are various diffe- rences. In general the physiographic unit is the one most adapted to soil surveys based on air photo interpretation. So the association of the series, and some phases of the associa- tion, is often a better basic unit for this kind of survey than some of the preconceived soil series. In this case much depends on the way in which the basic soil series have been defin- ed originally. In general this also means that for large scales, for instance soil surveys to be published in the scale of 1 : 10.000 (6 inch at 1 mile), the amount of field work in the same area will be relatively much greater than in the case of a soil survey to be published on the 1 inch to 1 mile scale. It is impossible to give exact data on this, but we do have some graphs that give an idea of this relationship (VEENENBOS, 1957) (Figure I).
15

Where soil differences are very intimately correlated with phenomena which can be seen on the aerial photograph, the accuracy of the boundaries drawn may be much higher even than the accuracy achieved in an intensive field survey. So in some cases we have as an advantage of the air photo not only the greater efficiency, but also an improvement in the accuracy of the boundaries. The following figure, derived from a publication by BURINGH (1960), gives an indication of the various relationships for a survey on scale 1 : 50.000, taken from a practical example somewhere in Iraq (Figure 2). The method for a systematic interpretation of air photos can be only summarily described in this paper. A fuUer publication on this subject is given in BURINGH’S publication cited above. We shall indicate here only some aspects. First of all we have the so-called elements of interpretation. In all we now recognize up to about 20 different elements. These may be divided into 4 large groups. The first division contains the elements concerned with geomorphology. Secondly we have the group of elements concerned with vegetation and land use. Thirdly we have some general aspects of colour tone and texture of the aerial photograph. There is a fourth group consisting of the very specific human aspects, such as the sites of dwellings, dykes, way of running of irrigation canals and many more such criteria. Some indications of this are given in fig. 3, which is also derived from the above cited publication by BURINGH. Briefly, this diagram of elements may be explained as follows. Of the various individual elements used in interpretation, six different kinds were chosen. First of all the area is analysed according to differences in land type, that is in large physiographic or geomor-
ho per year 1500 O00 - - - - - - without application of photo-malyris - with application of photo-andysir
. . . . . . . and interpolation-extrapolation
Fig. 1. The relationship between air photo interpre- tation and soil survey production (Veenenbos f9S7)
16


1 Air photo interpretation
each boundary line has been given a value according to the number of various analyses of individual elements in which it appears. In this way the line occurring six times is the most certain to correlate with the soils. In the same way one can indicate a relative difference between all the various other lines. The boundary only occurring once, and then only on the map of vegetation and land use, is a very uncertain one and will need special attention during the field check. Based on these considerations, map 8 in this figure gives the preliminary map which is the result of the air photo interpretation. This map, which in general is called an air photo interpreta- tion map for soil survey purposes, is the basis for field work, and enables decisions to be taken about points that need special attention. The systematic traverses and sample areas are also largely determined by studying this interpretation map. After the field check when the boundaries have been controlled and the soils have been described, the soil map is delivered. The interpretation map is not a soil map, but it is a very useful tool for mak- ing a soil map, as indicated above. The nomenclature of the classification on the inter- pretation map however, should never be in terms of soils, unless one has special pre-inter- pretation knowledge about the soils derived from previous field observations. This de- pends, among other things, on which survey-procedure is followed (see BURINGH, 1960).
The interpretation according to individual elements, as described above, is not the only method of air photo interpretation for soil surveys. In fact, we prefer to use the method of what we call physiographic analysis as far as possible. The way of looking at the photo- graphs in itself is the same, so the same phenomena are used. The difference lies in the fact that these phenomena are not seen as separate individuals, but that we try to find as soon as possible the physiographic systems that have been and are predominant in the formation of the area. These physiographic systems are sometimes of a structural and stratigraphical geologic nature. In other cases there are more sedimentary or erosional processes. The following may give an idea of what we consider to be physiographic ele- ments useful for our work.
- The system of a meandering river with its levees, point bars, playas, ox-bows, basins, etc.
- The formation caused by a braiding river system, a very typical phenomenon in peri- glacial areas and periods, but which also exists, for instance, in some parts of the arid zone and of the humid tropics.
- An eolian system, such as is formed in deserts, but also in the dry tundra areas.
- Various glacial systems and fluvio-glacial phenomena.
- Volcanic systems, such as the volcanic cone itself, with its slopes and lava- or mud flows.
4 Fig. 3. Diagram of elements of air photo interpretation (Buringh. 1960)
19


graphs in soil surveys. They have been described extremely well by BURINGH (1960) and the scope of this paper does not permit us to give a detailed description of them. We recognize in general three groups, in the first of which the air photo is mainly used as a base map. Sometimes a small amount of analysis of the air photo is applied, but then it is only done during the mapping of the soils in the field. For the man who is acquainted with the results and possibilities of air photo interpretation this first group is slightly out of date, although certainly in most cases the use of the air photo is an advantage even if it is used only as a base map. The second group consists of those procedures that are most useful for mapping of' soils in countries where the various parts of the area are in general easily accessible and where accuracy is more important than time. In this group of me- thods the field survey indicates the boundaries, and the air photo analysis is only used for simplifying the finding of these boundaries and for locating them as exactly as pos- sible wherever a good correlation with the interpretation elements is found. The third group is more specially adapted to unknown or little known areas which are not so easily accessible or which lie far away from the centre from which the survey is carried out. In this case a full air photo interpretation of the photos of the area is made before going into the field. The field work does not exclude the checking of boundaries, but in so far as sufficient correlations are found, the boundaries taken in the first interpretation are main- tained. The main field work then consists, at least if the interpretation has proved to be of good quality, of describing the soils found in the physiographic soil associations that form the main units of the map. In figure 4 (see pp. 20 and 21) an example is given of the air photo interpretation map of an area and of the soil map of the same area which was the result of the fieldcheck made on the basis of this interpretation. The legends of both maps are given in table 1l). It will be seen that there is in this area almost never a full correlation between photo inter- pretation and soil map. Therefore, the photo interpretation can never be taken as a final result. Still the advantage of the photo interpretation in this experimental area was such that a gain of at least 50% of manpower, time and money over the conventional field methods could be recorded. This is especially significant as the map made in this case is published on scale 1 : 25.000 and therefore it is more detailed than is usually the case in large development projects.
2.3. THE LEGEND OF THE SOIL MAP
As has been described in the Soil Survey Manual (SOIL SURVEY STAFF, 1951) the setting up of a soil survey legend requires special skill. Careful decisions on all aspects of the soils considered and on their relative importance in the survey area are necessary. For a soil survey which is carried out with the use of air photo interpretation this is still more urgent because the relative importance of the interpretation lines and of their classification for the soil survey must also be considered. A line which seemed of primary importance I) See pp. 23-25.
22

Air photo interpretation
a. Photo Interpretation map
Legend Nr.
C
c 1 Cl l c 12 C13 c 2
c 2 1 c 22
C 23 C 24 C 25
c 3
C312 C313 C314 C315
C 32
c 3 3 c 34
C341 C 342 C3421 C 3422 c 343 c 4 C41
C 42
Description (40 numbers from a legend with
220 numbers)
AREA CHARACTERISED BY STRONG DIFFERENCES IN RELIEF
Remnants of plateau Flat and undulating tops steep slopes Moderate slopes Sloping area between remnants and valley sides Moderate slopes Ridge of undulating slop surrounding remnant Steep to moderate slopes Steep directed slopes Gentle sloping area down to G 1 Guílies Main gullies to river plah Bottom steep slopes Moderate slopes V-shaped bottoms V-shaped gullies with recent erosion Steep short gullies on slopes, V-shaped Heads of big gullies Deeply incised short gully patterns Bottom Sides Steep to moderate sides Moderate to gentle sides V-shaped bottoms Concave depressions With visible surface drainage Without visible surface drainage
b. Soil map
xgend Nr.
> 11
12
13
1 4
J
VL
tL12
v'L2 dL 3
VM
VM 1
VM 2
VM2R VM 3
VM4R
VM5 VM5T
VM6
Description (38 numbers from a legend with
121 numbers)
AREA OF THE ARDENNES
Acid brown soils in very gravelly sandy loam, on shale! id. in gravelly sandy loam on shales Colluvial soils of sandy loam to sandy clayloam Complex of soils in sandy mark and in shales in gullies and small valleys
VALLEY AREA
Association of the shallow loess covers
Greybrown Podsolic soils and BFSl) in loess on clay BFS in loess on gravel Complex of BFS in shallow loess covers, in marks and in conglomerates
Association of BFS in Marks
BFS of varying depth in sandy loam to sandy clay- loam BFS of less than 30 cm. dept with marlfragment idem, steep phase BFS deeper than 30 cm with marlfragments Complex of lithosols and shallow BFS, steep
Complex of VM 2 and VLM idem, moderate to steer slopes Complex of BFS and Rend. zina's
Correlates with Interpr. nr.
3
311
3 12
3 222 3213, Ç214, G223
C + D + G
0 12 E l l
C 12 + C23 + C32
C3421
C11 +C3422
c 1 2 + c 2 3 + c 3 2 + D13
e 3 3
c11
l) BFS = Brown Forest Soils (turn page)
23

a. Photo Interpretation map
Legend Nr.
D
D I D11 D 12
E
E l l
E12
E2 E 32
E33
G
G I G11
G 12 G I 5 G 2 G211 G212 G213
G214 G 22 G221 G 222
Description (40 numbers from a legend with
220 numbers)
MIDDLE PLATEAU W. OF ALZETTE
Undulately plateau Undulating top Gentle sloping area
RIVER-v ALLEYS
Actual floodplain, mainlj pastures Actual floodplain, mainlj cultivated Young terraces Older terraces, lower level Older terraces, sloping
UNDULATING COUNTRY IN N.PART OF AREA
Upperpart of the Spurs Flat and gently rolling tops Moderate slopes Spurs of a lower level Gullies Main Gullies, bottom Main Gullies, slopes Main Gullies, moderate slopes V-shaped bottoms Smaller gullies Bottoms Slopes
Legend Nr.
VB VB 1
VBlS VB2
VB31
VB 32
VB6
VG
VG 1
VG2
VG 3
VG3T VG4
VG6
vs VS 6
VD
b. Soil map ~ - _ _ _ _ - _ _ _ _ _
Description (38 numbers from a legend with
121 numbers)
BFS in solifluction material
BFS of varying depth in sandy loam on weathered marls idem, moderate slopes BFS of varying depths in sandy loam on weathered marls and Buntersandstone BFS deeper than 50 cm in slightly gravelly mandy loam to sandy clayloam Complex of BFS of varying depths in slightly mandy loan to sandy clayloam Complex of BFS in sandy loam to sandy clay loam on various substrata
Gravelly BFS
Very gravelly soils in slightly sandy loam to sandy clay loam Gravelly soils in sandy loam to sandy clay loam Complex of transitional soils VG2 dominating id. moderate to steep slopes Gravelly soils of varying depth on yellowish brown gravelly clay loam Soils in gravelly solifluction covers
Association of the sandy soils
Weak acid brown soils etc in loamy sand
Association of BFS and re- lated soils in depressions
Correlates with Interpr. nr.
c 2 1
C25
C13
c 1 1
C21f C23
C11 +D11,G15+G12
D12,C12,C13+G213 :25 i- C3422,G 15 t G 12
c 1 2
G12, G15
C32
c11
24

Air photo interpretation
a. Photo Interpretation map
Nr. 1 Description (40 numbers
I 220 numbers) Legend from a legend with Legend
Nr.
v D 2
VD 3
vD31
VD 5
VE
VE2
VE 4
VA
VA22
VA3
A
A2
A21
A22
b. Soil map
Description (38 numbers from a legend with
121 numbers)
BFS in slightly gravelly sand loam BFS and Acid Brown Soil in gravelly loamy sand to sandy loam BFS in sandy loam to sandy clay loam BFS with marl fragments in sandy loam to sandy clay loam
Complex of recent and sub- recent erosion gullies
Acid Brown Soils in loamy sand to sandy loam Complexes of soils in slightly loamy sand to clay loam
Colluvial soils
in sandy loam to sandy clay loam with marlfragments in gravelly sandy loam
Alluvial soils
Alluvial deposits of the river work in the valley Transitional z6ne with col- luvial influence Well- and poorly drained soils
Correlates with Interpr. nr.
C32 + C3421
c314 + c 3 2 + c 3 3
C41+ C42
C 314
C33 +C41, C42
C23 + C341
C311 +C313+C314 +G211, G211 +G213
E12 + E 2 +E33
E l l +E12+E2
during the interpretation may have to be left out of the soil map, or at least may come down to a low level of classification in the legend of the soil survey. Other lines, which looked rather dubious during the interpretation may be found to indicate some extreme- ly important differences in soils. All this is complicated by the time factor. The air photo interpretation is expressly carried out to expedite the field work in the soil survey. This means a very large cut in the time for pondering about a possible field legend. It also means that by definition the decision on this legend must be taken on a small part
25
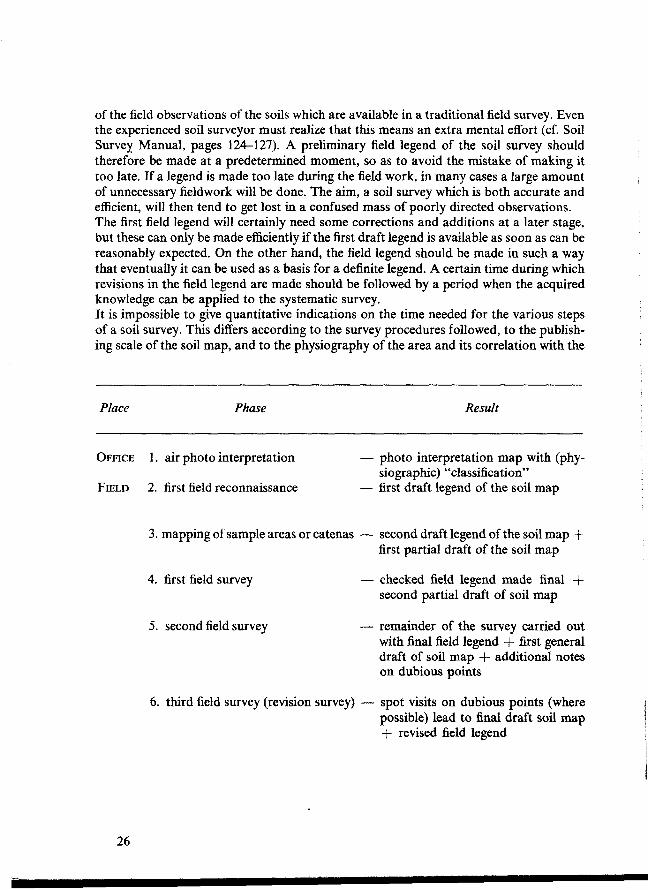
of the field observations of the soils which are available in a traditional field survey. Even the experienced soil surveyor must realize that this means an extra mental effort (cf. Soil Survey Manual, pages 124-127). A preliminary field legend of the soil survey should therefore be made at a predetermined moment, so as to avoid the mistake of making it too late. If a legend is made too late during the field work, in many cases a large amount of unnecessary fieldwork will be done. The aim, a soil survey which is both accurate and efficient, will then tend to get lost in a confused mass of poorly directed observations. The first field legend will certainly need some corrections and additions at a later stage. but these can only be made efficiently if the first draft legend is available as soon as can be reasonably expected. On the other hand, the field legend should be made in such a way that eventually it can be used as a basis for a definite legend. A certain time during which revisions in the field legend are made should be followed by a period when the acquired knowledge can be applied to the systematic survey. It is impossible to give quantitative indications on the time needed for the various steps of a soil survey. This differs according to the survey procedures followed, to the publish- ing scale of the soil map, and to the physiography of the area and its correlation with the
Place Phase Result
OFFICE 1. air photo interpretation
FIELD 2. first field reconnaissance
- photo interpretation map with (phy-
- first draft legend of the soil map siographic) “classification”
3. mapping of sample areas or catenas - second draft legend of the soil map + first partial draft of the soil map
4. first field survey
5. second field survey
- checked field legend made final 3. second partial draft of soil map
- remainder of the survey carried out with final field legend + first general draft of soil map + additional notes on dubious points
6. third field survey (revision survey) - spot visits on dubious points (where possible) lead to final draft soil map + revised field legend
26

Air photo interpretation
Place Phase Result
OFFICE 7. map editing + draft report - final polishing of map + careful editing of the final survey legend + the survey report which is as essential as the soil map itself
8. soil survey interpretation + final - all notes and observations on quality and suitability of the soils are com- bined to give the final report + soil survey interpretation maps
report
soil units to be mapped. The following steps should be taken as indicative of the gradual grouping of air photo interpretation, field observations, and deductive knowledge to form a soil map and report of good quality and of practical value : This diagram also demonstrates, that the legend should be made during the field work. Any attempt to make a legend after the fieldwork has been “completed” gives rise to un- expected problems and to soil maps of poor quality.
2.4. VARIOUS ASPECTS OF THE USE OF AERIAL PHOTOGRAPHS IN A SOIL SURVEY
There are various aspects in the use of aerial photographs in a soil survey. Some of these are inherent in the aerial photo interpretation itself, but various others could also be applied, at least in theory with other soil survey methods. They may be summed up as follows:
1. Base-map The aerial photograph if flown relatively recently is by far the most reliable base map for orientation in the field. As a reporting map it gives the soil surveyor the possibility of constructing his own base map if no suitable topographic maps are available.
2. Systemaiic preparation of tke$eld work In theory the systematic preparation of the field work can be done without the aerial photograph if various other maps and data on the physiography, the vegetation and the geology of the area are available. In the latter case, the preparation tends to be less com- prehensive because the physiographic picture of the survey area is never obtained as com- pletely as by air photo interpretation.
A
27

3 . Quantitative data on the physiography
The air photo interpretation, as commonly used in soil survey until now, does not provide for quantitative data such as river-gradients, gradients of old terraces, height of formations etc. Their relative height may, however, be estimated by making use of the parallax bar. This technique must be developed more carefully in the near future. Good topographic maps give rather exact height data which are very useful for the soil surveyor. A better understanding and closer co-operation between photogrammetrist and soil surveyor, espe- cially in the survey of development regions, will certainly provide the best and quickest solution of this problem.
4. Final editing of the map and report The stereoscopic image provides the opportunity of recombining all observations when writing the report and when considering various aspects of soil survey interpretation (landclassification : soil quality, soil suitability, etc.).
2.5. AIR PHOTO INTERPRETATION, IS IT QUANTITATIVE ? The remark is often heard, that photo interpretation is not quantitative, whereas photo- grammetry, of course, is a very quantitative science. Even some people working on inter- pretation have pronounced opinions that this is an art and art is almost never quantitative. Now one may just as well ask whether microscopy is quantitative. In some cases, like sedimentary petrology, microscopy is extremely quantitative. On the other hand, in the biological sciences there are very many examples of the use of the microscope in a non- quantitative way. The interpretation of aerial photographs is not an independent science but a method of extreme importance for various sciences. The sciences themselves, however, are called, for instance : geology, hydrology, glaciology, archeology, or soil science. For each of these sciences various aspects can be studied with the help of aerial photographs but many other aspects are not at all related to what can be seen or deduced from the photographic image. The interpretation of the aerial photograph is starting to influence the sciences just named. But interpretation stiU remains a group of methods, and not a science as such. The question of whether interpretation is quantitative or not is therefore only of very limited importance. To take soil science as an example, interpretation of air photographs is not very quantitative, but soil science itself has an enormous amount of quantitative methods and data. Historically, however, these quantitative data have mostly come from chemistry. The man making soil maps is first of all a soil scientist who expresses his ob- servations on a map. The soil surveyor strictu sensu is a very recent phenomenon. Therefore, not only the interpretation of aerial photographs but also the whole system of soil survey lacks a fixed quantitative basis. This is very often reflected in the difficulty of making good specifications for tenders asking for soil surveys. In the same way as the microscope has influenced biological sciences, the aerial photograph and, more gene-
28

Air photo interpretation
rally the contact between surveyors and photogrammetrists on the one hand, and soil scientists on the other, should provide a possibility of quantifying this part of our science (see also STEUR, 1961). It is sometimes suggested, that there is no fundamental difference between photogram- metry and the “interpretation” sciences. The main fundamental difference is, however, that in photogrammetry the objects to be mapped are not themselves subjects of research, whereas in the “interpretation” sciences the research of the objects themselves comes first and foremost. Photogrammetry as it has developed in the last decade is mainly mathematics, whereas many of the sciences which use photographic interpretation are typical “natural sciences”. As such, they are inherently more descriptive and less mathematical. Nature must be described first of all and the mathematical treatment of natural phenomena can only be partly succesful. The problem of quantifying soil surveys and their specifications has various aspects. In the first place comes the accuracy of the base map, which in fact is a problem of general photogrammetry. It has however, some specific relations to the problem of soil survey itself. The second problem is in fact a problem of classification of the soils in soil survey. This is a specific problem of soil science, and it will remain the central problem in soil survey as long as this science continues to develop. In the following paragraphs we shall try to contribute to this development.
29