air pollution in chapel hill - university of north
TRANSCRIPT
Air Pollution in Chapel Hill
Panayiota Boutis
Rives Deuterman
Erica Gallerani
Karen Gouws
Joshua Mu
Cole Shoup
Tammy Xu
Morgan Zemaitis
Advised by: Brian Naess
Capstone Research and Policy Proposals December 2016

This project was created as a capstone assignment for the Curriculum for
Environment and Ecology at the University of North Carolina.
It was given to the Town of Chapel Hill for informational purposes.
The research and finalization of this report started in August 2016 and ended
in December 2016.

Contents
Executive Summary . . . . . . . . . . . . . . . . . . . . . . . . . . . . . . . . . . . . . . .
Introduction . . . . . . . . . . . . . . . . . . . . . . . . . . . . . . . . . . . . . . . . . . . . . .
Section 1: Health Impacts . . . . . . . . . . . . . . . . . . . . . . . . . . . . . . . . . . .
Section 2: Improving Traffic Flow. . . . . . . . . . . . . . . . . . . . . . . . . . . . .
Section 3: Reducing Sources of Pollution . . . . . . . . . . . . . . . . . . . . . . .
Section 3: Absorbing Existing Pollution . . . . . . . . . . . . . . . . . . . . . . . .
Section 4: Project Finance . . . . . . . . . . . . . . . . . . . . . . . . . . . . . . . . . . .
Appendix . . . . . . . . . . . . . . . . . . . . . . . . . . . . . . . . . . . . . . . . . . . . . . . . .
4810
page 3
1426384449

Executive Summary

Focus
This report is focused on a variety of policy and project proposals for the Town of Chapel Hill
with the specific goal of reducing air pollution from vehicle traffic in the downtown area. In the
figure below our study area is outlined along with an indication of high and low traffic areas. It
is clear that there is a lot of vehicle traffic around Franklin and Rosemary, but why look into
air quality? Cars, buses, and trucks that run on gas or diesel produce harmful emissions that
can greatly affect human health. This study focuses on the reduction of PM2.5 or fine
particulate matter less than 2.5 micrometers in diameter. Adverse health effects can be seen at
any concentration of this pollutant such as respiratory disease, lung cancer, cerebrovascular
disease, and the worsening of asthma. Young people (under 18) and the elderly are considered
to be sensitive populations to PM2.5, and make up over 25% of Chapel Hill’s population. Also
EPA data show that for over 55% of days in 2015, PM2.5 was the main pollutant in the
Durham-Chapel Hill area.
Three strategies for improving downtown air quality are proposed: improving traffic flow,
reducing the sources of pollution, and absorbing existing pollution. All of the proposals
contained in these three strategies also have a variety of added benefits that can be seen in
Figure 1 on page 7.
Improving Traffic Flow
As the speed of vehicles increases (from 0 MPH up to about 55 MPH), PM2.5 and other
pollutant concentrations from vehicular emissions decrease exponentially. This is due to the
vehicle spending less time in the area and efficiency gains in engine operation. Based on results
from a numerical model called C-LINE, an increase in average speed from 5 MPH to 10 MPH
resulted in a 31% drop in PM2.5 emissions at locations in downtown Chapel Hill. With every 5
MPH increase after that, PM2.5 drops 14%. Therefore the following proposals focus on
increasing the average speed of cars downtown through improved traffic flow. This section
contains proposals for Roundabouts, Mini-Roundabouts, One Way Streets, Smart Traffic Lights
and Smart Parking.
page 5
Reducing Sources of Pollution
The EPA states that the most preferred way of environmental protection is source reduction. C-LINE
results showed that for every 10 gas cars taken off the road, there is a 1% decrease in PM2.5
concentrations. This section contains several proposals that will reduce Franklin Street AADT and
improve the individual practices of those in vehicles to reduce emissions. These proposals focus on
Electric Bus Technology, Electric Vehicle Campaigns, Bike Share Programs, Carpooling Incentives,
and Eco-Driving/Anti-Idling Campaigns.
Absorbing Existing Pollution
It has been found that one of the possible solutions for reducing PM2.5 concentrations in urban
landscapes is increased vegetation cover (Chen, et al. 1). This report explores different means
through which the Town of Chapel Hill could increase its downtown canopy cover and used the
software developed using U.S. Forest Service data, iTree, to calculate their air quality and other
benefits. A list of seven recommended tree species for the Town to plant in future Street Greening
projects downtown is presented, along with a discussion of the development of Pocket Parks and the
installation of Living Walls.
Conclusion
The report recommends a combination of proposals using all three different strategies in order to
achieve a comprehensive approach to air quality improvement in downtown Chapel Hill. Sources for
funding that correspond to each section can be found in the Project Finance section on page 44.
page 6

page 7
Figure 1 Summary of Benefits for Each Proposal

IntroductionWhat is the focus of this project?
Chapel Hill is a special town for the fact that it shapes, and is shaped by, a stream of young, diverse minds alongside
permanent residents and community members. The effects from these interactions are widespread and beneficial. Franklin
Street, the preeminent and picturesque heart of Chapel Hill, has the capacity to provide these benefits to every individual.
The array of possible improvements to the area presented in the Downtown 2020 Work Plan, Downtown Imagined Plan,
and Streetscape MasterPlan documents the Town’s efforts to improve the health, safety, and vibrancy of the downtown
area. This report attempts to work within the framework of these plans in order to ensure that air quality improvements
are considered, reinforcing a space where everyone can be healthy and safe.
The EPA found in their 2014 National Emissions Inventory that 21.4% of PM2.5 in Orange County, North Carolina comes
from the mobile sector (“Air Emission”). In Chapel Hill, PM2.5 was the primary pollutant of concern over 55% of the time in
2015 (“Air Quality”). Any level of exposure to PM2.5 can be dangerous, with serious human health impacts arising at higher
levels. For this reason, this study focused on reducing PM2.5 in the areas surrounding Franklin Street and Rosemary Street.
Many of the proposals have several, additional benefits outside of reducing air pollution and improving human health
including helping the town reach its goal of reducing carbon emissions. They will also make the downtown a safer, more
pedestrian-friendly and attractive destination by promoting community-building and improving general well-being. While
the main objective is to make the air cleaner and safer for the residents of Chapel Hill, making Franklin Street a beautiful
and lively space and promoting economic vitality to the businesses that make it so unique are also considered. All of these
benefits have been grouped into the following categories: health and air quality; safety; cost savings; aesthetics; stormwater
management; and economic vitality, and each proposal description mentions any appropriate benefit category(ies).
Through a combination of literature and case study reviews and original research, this report describes three basic
strategies to reduce air pollution in downtown Chapel Hill: improving the flow of traffic, reducing the sources of pollution,
and absorbing the existing and potential future pollution. A comprehensive and diverse portfolio of proposals for mitigating
air pollution is offered under each of these strategies.
page 9
air quality cost savings economic vitality aesthetics stormwater safety
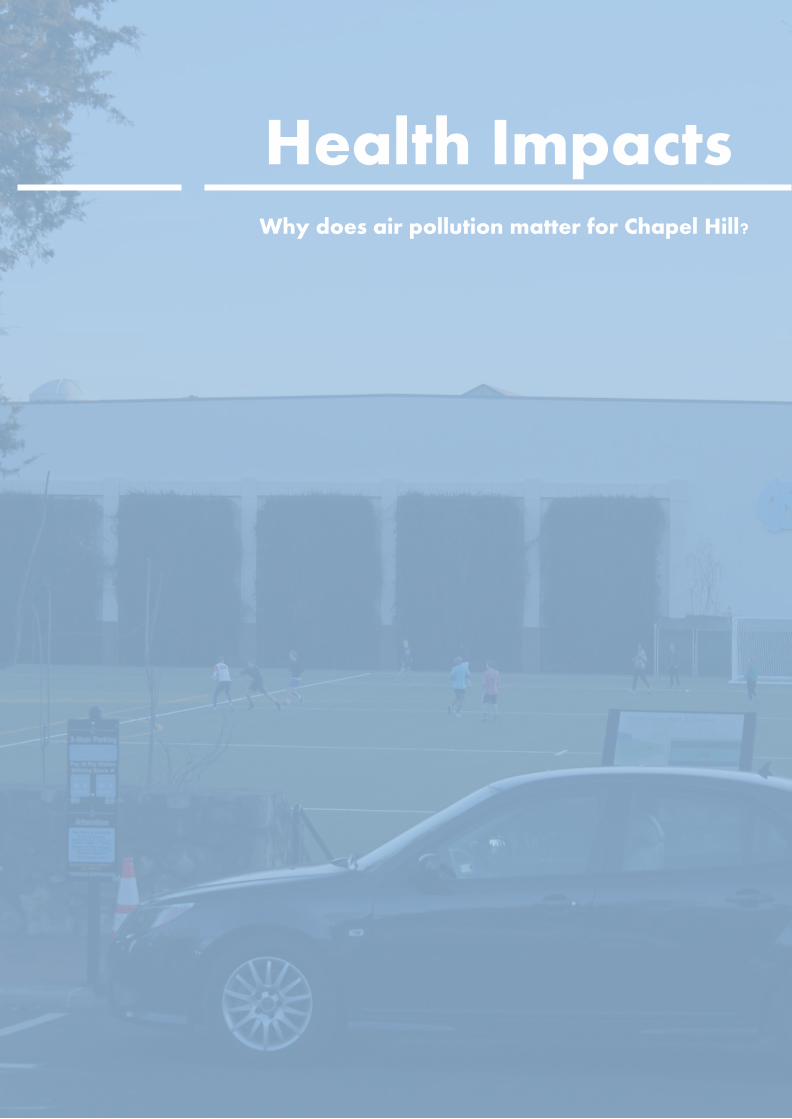
Health ImpactsWhy does air pollution matter for Chapel Hill?
Air pollution is no longer an environmental concern confined to metropolitan areas such as Los
Angeles and Beijing. The problems associated with poor air quality now affect small cities and
suburban areas which rely on automobiles for transportation– including Chapel Hill. In the United
States alone, approximately one half of all citizens live in areas that fail to meet federal air quality
regulations (“Vehicles, Air Pollution, and Human Health”). In order to mitigate and solve these
harmful impacts, it is important to recognize and fully understand the different pollutants which
most adversely affect human health.
There are several types of emitted pollutants that are hazardous to human health:
• Carbon monoxide (CO) is produced through vehicle exhaust, and is fatal to humans in high
enough quantities (“Carbon Monoxide (CO)”).
• Nitrogen dioxide (NO2) is released into the atmosphere primarily by the burning of fossil fuels,
and is a major component in the formation of ozone (“Nitrogen Dioxide (NO2)”).
• Ozone (O3) is a pollutant formed when sunlight reacts with nitrogen oxides and volatile organic
compounds. It is not emitted directly from any human source, but forms due to chemical reactions
between emitted pollutants already in the atmosphere. High concentrations of ozone can cause
respiratory irritation and chest pain, particularly for people with asthma (“Ground-level Ozone
(O3)”).
• Sulfur dioxide (SO2) is released into the atmosphere through industrial processes and motor
vehicle emissions, also exacerbating respiratory distress (“Sulfur Dioxide (SO2)”).
However, one of the most dangerous pollutants has been found to be particulate matter, or PM. PM is
composed of a combination of small particles that often cannot be seen with the human eye, and are
released through a variety of processes (“Particles”). This includes things like dust, dirt, soot, sand,
and smoke, many of which have a high propensity for reacting with other pollutants. There are two
classes of PM based on the size of the particle released. PM10 is considered “coarse” and refers to
particles that are 2.5-10 micrometers in diameter. PM2.5 is considered “fine” and refers to particles
that are less than 2.5 micrometers in diameter. For reference, the diameter of a human hair is 70
micrometers—hundreds of times larger than the smallest PM.
Due to its extremely small size, 2.5 is not filtered out of the body by nasal hairs upon inhalation.
page 11
Health Problems from PM
respiratory disease
lung cancer
stimulated asthma
cardiovascular disease
cerebrovascular disease
autonomic dysfunction
Transportation is a primary source of PM2.5 (see Figure 2), and in Chapel Hill, PM2.5 is the
primary pollutant on 55% of days where air pollution was recorded (Zheng, “Air Quality
Index Report Chapel Hill”). According to the 2010 US Census, 17.4% of Chapel
Hill’s population is 18 and younger, and 9.2% of Chapel Hill’s population is
over the age of 65. Thus, a total of 26.6% of Chapel Hill, over a quarter of
the population, is in a sensitive group (US Census Bureau). Figure 3 on the
next page visualizes this population. This represents a significant minority
of the population that is unusually susceptible to worsening air pollution,
particularly for PM. Thus, it is very important that all air pollution concerns
be addressed quickly, in order to make the town, and Franklin
Street, a more livable, family friendly environment.
Due to the relevance of PM2.5 in Chapel Hill, as well as its severe
health effects, it is the main pollutant that is discussed in each of
our policy proposals. Most proposals that reduce PM2.5 also aid in
reducing other dangerous air pollutants as well. This is important
to recognize, because it presents the breadth of impact from which
any proposals can mitigate not just one source, but many sources
of air pollution, and, in the process, make downtown Chapel Hill a
cleaner and more healthy destination for everyone.
page 12
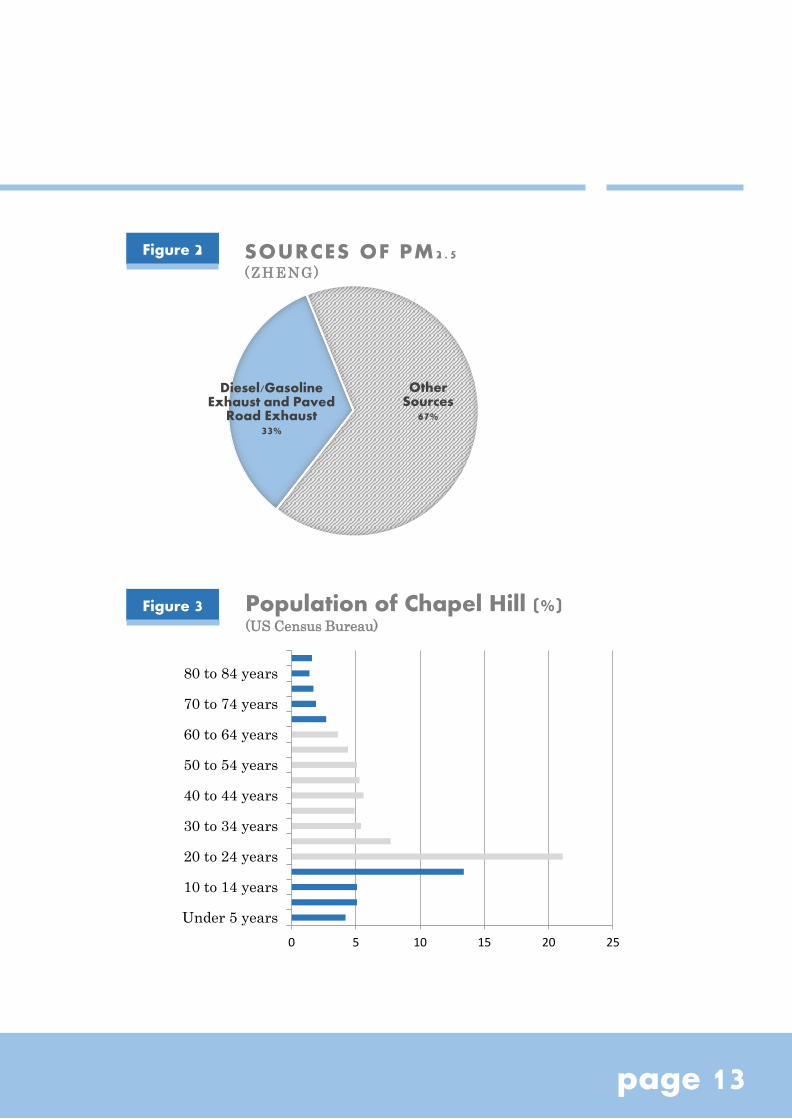
Diesel/Gasoline Exhaust and Paved
Road Exhaust 33%
Other Sources
67%
SOURCES OF PM2 . 5 ( Z H E NG)
0 5 10 15 20 25
Under 5 years
10 to 14 years
20 to 24 years
30 to 34 years
40 to 44 years
50 to 54 years
60 to 64 years
70 to 74 years
80 to 84 years
Population of Chapel Hill (%)(US Census Bureau)
Figure 2
Figure 3
page 13

Improving Traffic FlowHow can cars move more efficiently on Franklin St.?

The health of both the people of Chapel Hill and the surrounding environment are vitally important
to the success of the Town. There are several ways in which air quality, and therefore health, can be
improved. One of the major sources of pollution comes from the cars and buses traveling through the
downtown area. With traffic and increased idling times due to parking issues, the flow of traffic is of
particular concern. This section focuses on the how to reduce levels of PM2.5 with improvements to the
traffic flow. The policies suggested include roundabouts, implementation of one-way streets, smart
traffic lights, and smart parking systems. The specific effects on emissions were analyzed and
calculated by using the web-based modeling tool C-LINE, developed by the UNC Institute for the
Environment with funding from the US EPA, to model concentrations of air pollution from roadways
in downtown Chapel Hill.
page 15
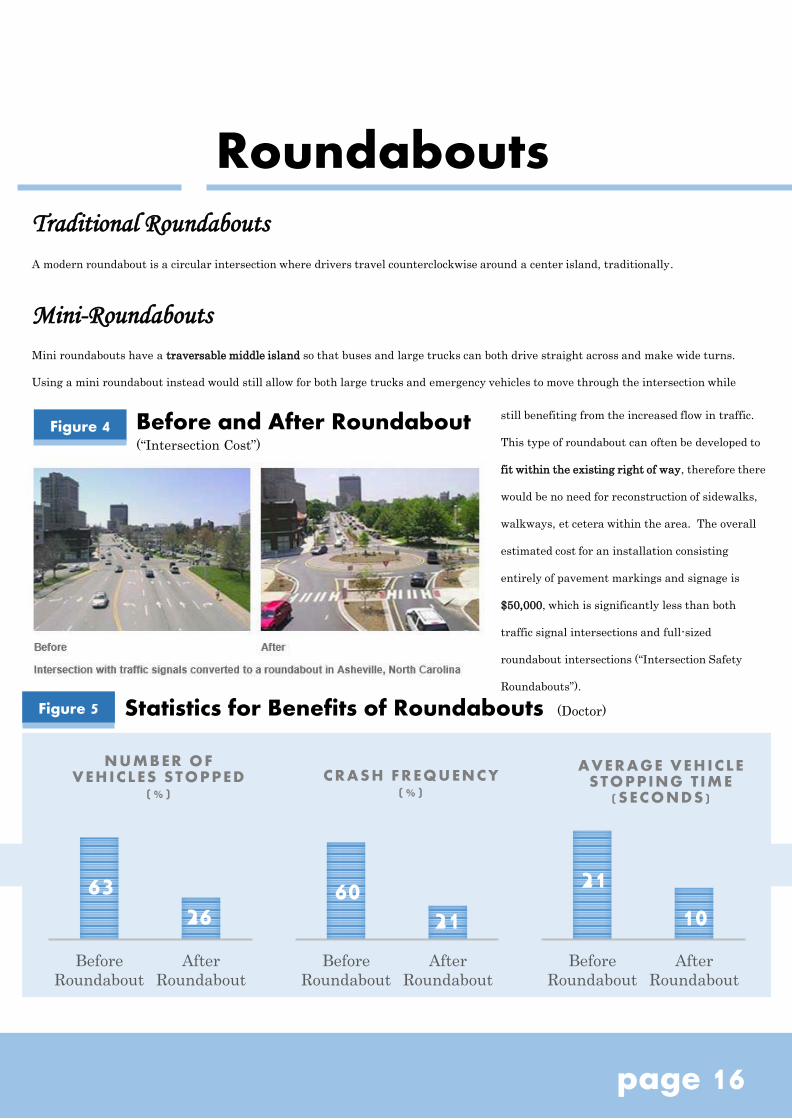
still benefiting from the increased flow in traffic.
This type of roundabout can often be developed to
fit within the existing right of way, therefore there
would be no need for reconstruction of sidewalks,
walkways, et cetera within the area. The overall
estimated cost for an installation consisting
entirely of pavement markings and signage is
$50,000, which is significantly less than both
traffic signal intersections and full-sized
roundabout intersections (“Intersection Safety
Roundabouts”).
Roundabouts
2110
Before
Roundabout
After
Roundabout
AVERAGE VEHICLE STOPPING T IME
(SECONDS)
6326
Before
Roundabout
After
Roundabout
NUMBER OF VEHICLES STOPPED
(% )
6021
Before
Roundabout
After
Roundabout
CRASH FREQUENCY (% )
Figure 5 Statistics for Benefits of Roundabouts (Doctor)
Traditional Roundabouts
A modern roundabout is a circular intersection where drivers travel counterclockwise around a center island, traditionally.
Mini-Roundabouts
Mini roundabouts have a traversable middle island so that buses and large trucks can both drive straight across and make wide turns.
Using a mini roundabout instead would still allow for both large trucks and emergency vehicles to move through the intersection while
Figure 4 Before and After Roundabout (“Intersection Cost”)
page 16

Safety
Crash Reduction - Rather than an
intersection where cars have the
potential of crashing into one another
perpendicularly, the flow of traffic within
the circular nature of roundabouts
removes the potential of high angled
collisions. For North Carolina, crashes of
all types were reduced by almost half in
the areas in which roundabouts replaced
an existing traffic light intersection
(“Your Guide”).
Better Speeds - Speeds through
intersections with roundabouts are
slower and more even when compared to
those that incorporate traffic lights
(Doctor). This allows for more reaction
time and “beating” the light–speeding up
quickly to catch a changing light.
Helps Sensitive Populations - The older
the driver is, the more likely they are to
experience a serious crash at an
intersection. 35 to 40 percent of
pedestrian deaths of people aged 65+
occur at intersections (Doctor), and older
drivers are two times as likely to be
killed while driving through an
intersection than younger drivers
(Doctor). Removing the intersection
altogether would increase the safety for
this vulnerable population.
Why are roundabouts better than intersections?
Emissions Reduction
Less Toxins – Because of reduced
traffic, an average decrease of 29
percent was found for carbon monoxide,
21 percent for nitrogen oxides, and a 28
percent decrease for overall fuel
consumption (Varhelyi). Based on an
annual average daily traffic (AADT) of
23,500 vehicles, these reductions
translate to 23.5 kilograms of carbon
monoxide, 1.9 kilograms of nitrogen
oxides and 144.6 kilograms of fuel
reduced and saved per year (Varhelyi).
Signals Pollute - Intersections may
actually generate more emissions when
compared to roundabouts. Mustafa et
al. (1993) found that intersections with
a traffic signal generate about 50%
more emissions than a roundabout. This
is especially exacerbated during heavy
traffic, which causes more emissions of
hydrocarbons, nearly doubling that of
roundabouts (Mustafa).
Lower Cost
Longer Life - According to several case studies,
the service life of a roundabout compared to that
of a traffic light is not only longer but cheaper as
well.
Crash Reduction - The reduction of both minor
and fatal crashes had huge cost-benefits that can
be directly linked to the implementation of a
roundabout. A study from the Maryland State
Highway Association indicated that for every
dollar spent, taking into account the 20-year
service life of a roundabout, there was a return of
approximately $13 through crash reduction
(“Intersection Safety”).
Less Traffic - The decrease in vehicle stoppage
from a roundabout can be monetarily calculated.
As stated by the 2012 Texas Transportation
Institute's Urban Mobility report, the cost per
vehicle-hour delay is $16.79 (“Intersection Cost
Comparison”). With the increased efficiency
provided by roundabouts, this can reap huge
savings.
No Hardware -
The elimination of hardware, maintenance, and
electrical costs associated with traffic signals can
save between $5,000 and $10,000 per year
(“Roundabout Benefits”). The cost of retiming
traffic signals at an intersection has a default
value of $5,000 per year and annual signal
maintenance costs around $3,750 per year
(“Intersection Cost Comparison”). These costs
would be completely eliminated with the use of a
roundabout.
Project Value - Overall, the net present value of a
roundabout after 30 years is estimated at $2.34
million while that of a traffic signal is calculated
to be $2.94 million (“Intersection Cost
Comparison”). This translates to a savings of
$600,000 in favor of roundabouts over the course
of their estimated lifetime.
Pedestrian-Friendly
Improved Walkways - Since roundabouts can process traffic quicker, fewer lanes are needed
leading up to the intersection. This could allow the pedestrian area on Franklin Street to widen
dramatically. A wider pedestrian walkway provides businesses and pedestrians with more space
for economic activity, such as increased dining areas and advertising and marketing spaces.
Positive Public Opinion
Changing Perceptions - The benefits of
implementing roundabouts are
recognized and appreciated by the
communities where they exist. In many
cases, public opinion changed
dramatically before and after the
roundabouts were built. In an LSU
study, 31% of those surveyed were in
favor of constructing a roundabout,
while 41% were opposed. However,
after the roundabouts were put in place,
63% were in favor and only 15% of the
public were opposed (Doctor). This
shows that the public benefits were not
just theoretical, but rather recognizable
and widespread.
Business-Friendly
Increased Revenues - In many cases, it
was found that businesses along a
corridor near a roundabout experienced
increased business and sales. One case
study in Golden, Colorado observed a
60% increase in sales tax revenue along a
business corridor next to a newly
installed roundabout intersection
(Doctor). This could have major beneficial
outcomes for the several businesses
around the intersection of Franklin and
North Columbia.
page 17

Roundabouts
In Chapel Hill…To apply the benefits of roundabouts to Chapel Hill itself, two scenarios of implementation were chosen. The location
for both of these options are shown on Figure 6 on the next page. Once the scenarios were chosen, then the health
impacts of each roundabout were modeled.
Option 1
For this design, a roundabout would replace the intersection of Franklin Street and Columbia Street. This particular
intersection moves a high volume of traffic every day, and would benefit the most from having a roundabout in place
instead of a traditional traffic light setup.
The specific effects on emissions were analyzed and calculated by using the web-based modeling tool C-LINE. More
information about C-LINE and the methodology used can be found in the Appendix on page 49. The first roundabout
scenario measured reductions in PM2.5 at three different markers close to the Franklin St. and Columbia St.
intersection. The PM2.5 concentrations were modeled at three different markers along Franklin Street that
experience varying levels of emissions.
• The first marker was the University Baptist Church, right at the intersection of Franklin Street and North
Columbia Street. After running the simulations, the percent reductions were calculated for both summer and
winter. There was a 29% reduction seen for the winter months and a 10% reduction for the summer at this
location. This large reduction is mainly due to the higher speeds expected to result with the use of a full-sized
roundabout at the Franklin St. and Columbia St. intersection.
• The second marker used was the area around TRU Deli, at the corner of Henderson Street and East Rosemary
Street. There was a 0.20% reduction calculated for the winter period and a surprising 35% jump in emissions
during the summer, likely due to differences in meteorological conditions.
• The third and final marker was placed at the bus stop near the Franklin Street intersection on North Columbia.
After adjusting speeds, a 0.27% reduction was seen for the winter period and a 19% decrease during the summer
months. The trend here was the reduction in PM2.5 emissions due to the increased speeds.
Replacing a traffic light intersection with a roundabout increases the overall efficiency of both the intersection itself
and the vehicles utilizing the space. This translates to both money saved for the individual and an improvement in
the air quality of the surrounding area due to decreases in potentially harmful emissions.
.
page 18

Option 2
As an alternative to one roundabout, four mini-roundabouts can help mitigate traffic at the proposed locations on
Figure 6. These mini-roundabouts would likely require less construction costs than a full roundabout would.
C-LINE was also used to estimate air quality changes from the proposed mini roundabouts. The same three markers
used in the first simulation were also used for this model.
• For the first church marker, the adjusted speeds resulted in a 30% decrease of PM2.5 concentrations in the
winter and a 11% decrease in the summer.
• Once again, the numbers for the marker at the intersection of Rosemary and Henderson were slightly different
than the rest, showing a decrease of 15% during the winter and a 14% increase during the summer.
• The final bus stop marker showed very high rates of decreased pollution with the higher speeds. A 30%
decrease was modelled for the winter months and a 16% decrease was modelled for the summer.
Again, these numbers support the fact that increased speeds will decrease the amount of pollution at most locations.
maps.google.com
Figure 6 Proposition for Roundabouts
page 19
Efficiency
One-Way Streets
Safety
Cost
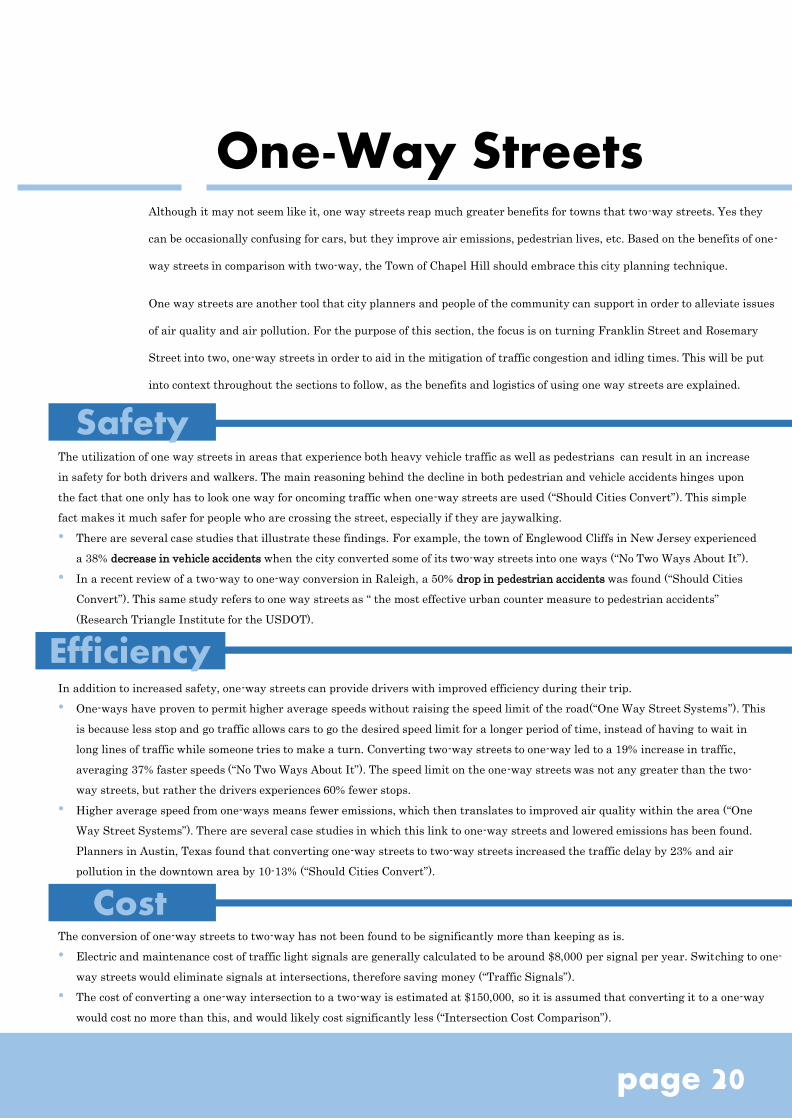
Although it may not seem like it, one way streets reap much greater benefits for towns that two-way streets. Yes they
can be occasionally confusing for cars, but they improve air emissions, pedestrian lives, etc. Based on the benefits of one-
way streets in comparison with two-way, the Town of Chapel Hill should embrace this city planning technique.
One way streets are another tool that city planners and people of the community can support in order to alleviate issues
of air quality and air pollution. For the purpose of this section, the focus is on turning Franklin Street and Rosemary
Street into two, one-way streets in order to aid in the mitigation of traffic congestion and idling times. This will be put
into context throughout the sections to follow, as the benefits and logistics of using one way streets are explained.
The utilization of one way streets in areas that experience both heavy vehicle traffic as well as pedestrians can result in an increase
in safety for both drivers and walkers. The main reasoning behind the decline in both pedestrian and vehicle accidents hinges upon
the fact that one only has to look one way for oncoming traffic when one-way streets are used (“Should Cities Convert”). This simple
fact makes it much safer for people who are crossing the street, especially if they are jaywalking.
• There are several case studies that illustrate these findings. For example, the town of Englewood Cliffs in New Jersey experienced
a 38% decrease in vehicle accidents when the city converted some of its two-way streets into one ways (“No Two Ways About It”).
• In a recent review of a two-way to one-way conversion in Raleigh, a 50% drop in pedestrian accidents was found (“Should Cities
Convert”). This same study refers to one way streets as “ the most effective urban counter measure to pedestrian accidents”
(Research Triangle Institute for the USDOT).
In addition to increased safety, one-way streets can provide drivers with improved efficiency during their trip.
• One-ways have proven to permit higher average speeds without raising the speed limit of the road(“One Way Street Systems”). This
is because less stop and go traffic allows cars to go the desired speed limit for a longer period of time, instead of having to wait in
long lines of traffic while someone tries to make a turn. Converting two-way streets to one-way led to a 19% increase in traffic,
averaging 37% faster speeds (“No Two Ways About It”). The speed limit on the one-way streets was not any greater than the two-
way streets, but rather the drivers experiences 60% fewer stops.
• Higher average speed from one-ways means fewer emissions, which then translates to improved air quality within the area (“One
Way Street Systems”). There are several case studies in which this link to one-way streets and lowered emissions has been found.
Planners in Austin, Texas found that converting one-way streets to two-way streets increased the traffic delay by 23% and air
pollution in the downtown area by 10-13% (“Should Cities Convert”).
The conversion of one-way streets to two-way has not been found to be significantly more than keeping as is.
• Electric and maintenance cost of traffic light signals are generally calculated to be around $8,000 per signal per year. Switching to one-
way streets would eliminate signals at intersections, therefore saving money (“Traffic Signals”).
• The cost of converting a one-way intersection to a two-way is estimated at $150,000, so it is assumed that converting it to a one-way
would cost no more than this, and would likely cost significantly less (“Intersection Cost Comparison”).
page 20

In Chapel Hill…A vision of Chapel Hill with one-way streets is proposed in Figure 7, where Rosemary St. is set up as
westbound and Franklin St. as eastbound. This setup can remediate traffic congestion and decrease air
pollution; some of the lanes can even be used as bike lanes or widened pedestrian walkways.
However, one way streets can seem confusing to new visitors to Chapel Hill. The networks of one-ways in
larger cities are often unintelligible and difficult to navigate. In contrast, Chapel Hill will not be a network,
but rather a single couplet. Navigating would not become any more confusing. If a car were to miss a turn,
there are a number of roads that can be taken to redirect onto the original route.
Figure 7 One-Way Proposition
page 21

Smart Traffic Lights
Traffic Reduction
Smart traffic lights encourage an improvement in the flow of
traffic, and the overall efficiency of the cars is increased since
drivers get to their destinations faster. There are several studies
that showcase these findings. Pittsburgh installed nine smart
traffic lights in 2012 that showed significant improvement in
idling times and emissions (Okonkwo and Gong). The signals
used employed a software known as SURTRAC (Scalable Urban
Traffic Control). This study claims that travel times reduced by
26% due to the added sensitivity of the traffic signals, idling time
was reduced by 41%, and overall vehicle emissions were reduced
by 21% (Okonkwo and Gong). Additionally, the study showed
that vehicles made 30% fewer stops along their route with the
applied technology in place. the Community Development Block
Grant Program.
Another technology that should be considered are smart traffic lights. These are designed to be incredibly efficient and
sensitive to traffic trends, in order to create a faster flow of traffic for everyone on the roads. One version of this technology
uses a network of sensors and cameras to monitor traffic in real time. In addition to this, these systems then have a computer
that optimizes the traffic signals at each intersection based on data gathered from the sensors (Keith). An alternative
technology utilizes the vehicles on the street as well to collect data. This is done by equipping the vehicles with “IntelliDrive”
hardware that gathers data from the car, such as the location and speed, and sends it to the network of traffic lights (“Next
Generation Traffic Signals”). This data is then used to create optimal timing of the traffic lights to ensure faster travel for
those on the roads. The major obstacle to this type of technology is the actual implementation, as it would be difficult to install
proper technology into every vehicle to really make it worthwhile. Another obstacle this particular system faces is the bias
towards vehicles, without being able to take into account bicycles and pedestrians.
Cost-Effectiveness
As opposed to the roundabouts or one-way street solutions, the smart traffic
lights can be installed one at a time instead of having to do a large, all
encompassing project that costs the town large amounts of money. Signals can
instead be installed one at a time, and efficiency of the system gradually
improves as more of the lights are integrated into the overall system (Barry).
This gradually improves the efficiency of the light system while still maintaining
a budget that the town could afford. Being able to slowly implement this new
technology saves money through reduced delay. Generally speaking, providing
intersections with smart traffic light technologies costs around $20,000 per
intersection (Ononkwo and Gong). While this is a relatively sizable amount of
money to put down, costs of the technology decreases as more intersection are
fitted with the software. There is potential for government grants that could at
least partially fund the process of replacing current lights with smart traffic
light technologies.
Benefits of Smart Traffic Lights
page 22

In Chapel Hill…
To implement more smart traffic lights in
Chapel Hill (as shown by Figure 8), it is
suggested to add this technology in
phases. This allows for much easier
financing on the part of the town. If there
isn’t money to retrofit several
intersections at one time, it can instead
be done as little as one or two at a time
(see Figure 9 for recommendation).
Figure 9 Proposed Phases of Smart Traffic Light Implementation
Figure 8 Diagram of Smart Traffic Light (Damra)
page 23
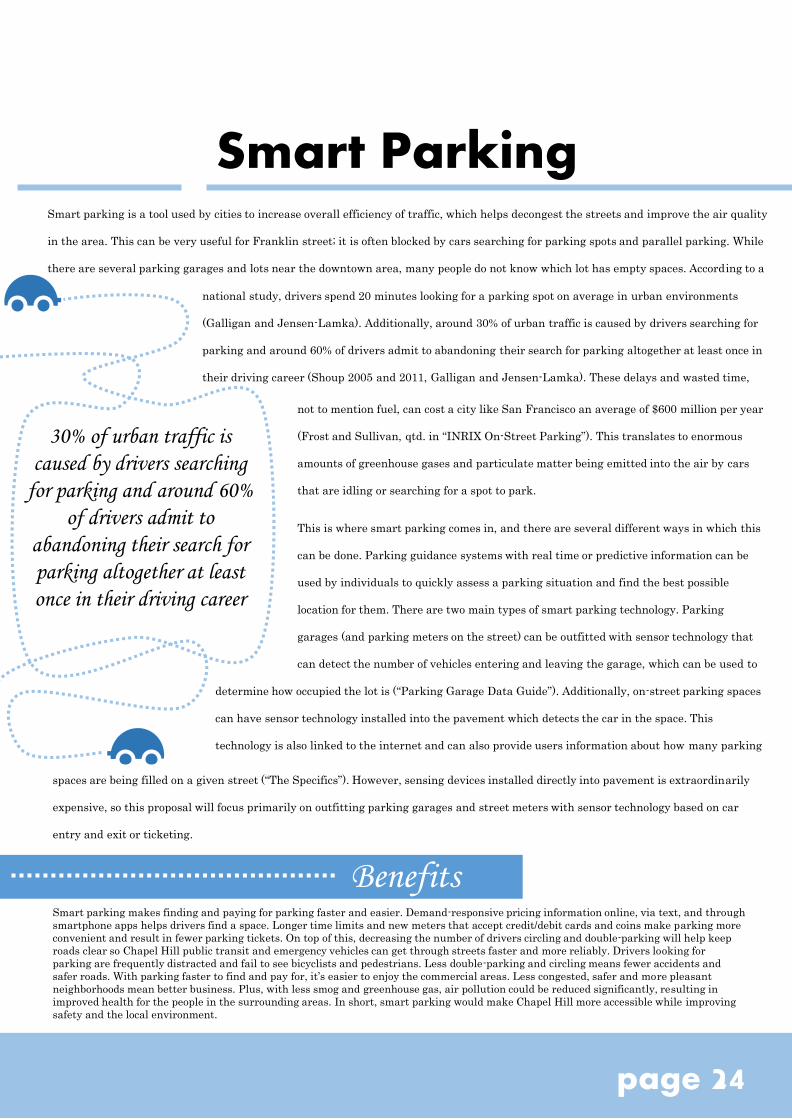
national study, drivers spend 20 minutes looking for a parking spot on average in urban environments
(Galligan and Jensen-Lamka). Additionally, around 30% of urban traffic is caused by drivers searching for
parking and around 60% of drivers admit to abandoning their search for parking altogether at least once in
their driving career (Shoup 2005 and 2011, Galligan and Jensen-Lamka). These delays and wasted time,
Smart Parking
30% of urban traffic is
caused by drivers searching
for parking and around 60%
of drivers admit to
abandoning their search for
parking altogether at least
once in their driving career
not to mention fuel, can cost a city like San Francisco an average of $600 million per year
(Frost and Sullivan, qtd. in “INRIX On-Street Parking”). This translates to enormous
amounts of greenhouse gases and particulate matter being emitted into the air by cars
that are idling or searching for a spot to park.
This is where smart parking comes in, and there are several different ways in which this
can be done. Parking guidance systems with real time or predictive information can be
used by individuals to quickly assess a parking situation and find the best possible
location for them. There are two main types of smart parking technology. Parking
garages (and parking meters on the street) can be outfitted with sensor technology that
can detect the number of vehicles entering and leaving the garage, which can be used to
determine how occupied the lot is (“Parking Garage Data Guide”). Additionally, on-street parking spaces
can have sensor technology installed into the pavement which detects the car in the space. This
technology is also linked to the internet and can also provide users information about how many parking
Benefits Smart parking makes finding and paying for parking faster and easier. Demand-responsive pricing information online, via text, and through
smartphone apps helps drivers find a space. Longer time limits and new meters that accept credit/debit cards and coins make parking more
convenient and result in fewer parking tickets. On top of this, decreasing the number of drivers circling and double-parking will help keep
roads clear so Chapel Hill public transit and emergency vehicles can get through streets faster and more reliably. Drivers looking for
parking are frequently distracted and fail to see bicyclists and pedestrians. Less double-parking and circling means fewer accidents and
safer roads. With parking faster to find and pay for, it’s easier to enjoy the commercial areas. Less congested, safer and more pleasant
neighborhoods mean better business. Plus, with less smog and greenhouse gas, air pollution could be reduced significantly, resulting in
improved health for the people in the surrounding areas. In short, smart parking would make Chapel Hill more accessible while improving
safety and the local environment.
spaces are being filled on a given street (“The Specifics”). However, sensing devices installed directly into pavement is extraordinarily
expensive, so this proposal will focus primarily on outfitting parking garages and street meters with sensor technology based on car
entry and exit or ticketing.
Smart parking is a tool used by cities to increase overall efficiency of traffic, which helps decongest the streets and improve the air quality
in the area. This can be very useful for Franklin street; it is often blocked by cars searching for parking spots and parallel parking. While
there are several parking garages and lots near the downtown area, many people do not know which lot has empty spaces. According to a
page 24
In Chapel Hill…Technology and Data Behind Smart Parking
Sensor data can be shown at
the entrance of a parking
garage or be linked to a website
or app that people can access
before and during their trip.
This helps drivers get to
parking areas more quickly,
therefore getting them off the
road and relieving a portion of
the congestion (Fabusuyi et al.
2013). Sensor data can serve a
variety of purposes, including
helping drivers find nearby
spaces through in-car guidance
apps, guiding law enforcement
officers to parking violations,
and aiding policy decision-
making. This particular method
is used in San Francisco. Cars
roll over a “loop counter” (which
is essentially a metal detector)
which engages a ticket
machine. Hourly parkers press
a button for a ticket upon entry,
or insert a ticket upon exit, and
monthly parkers scan their
card. The counter registers the
car as being in the lot, and
registers it leaving upon exit.
This data is linked to the
internet, which can be
displayed in an app for users to
see. Pricing and routes to the
lot are also given in-app,
allowing people to get to
parking places faster (“Parking
Garage Data Guide”).
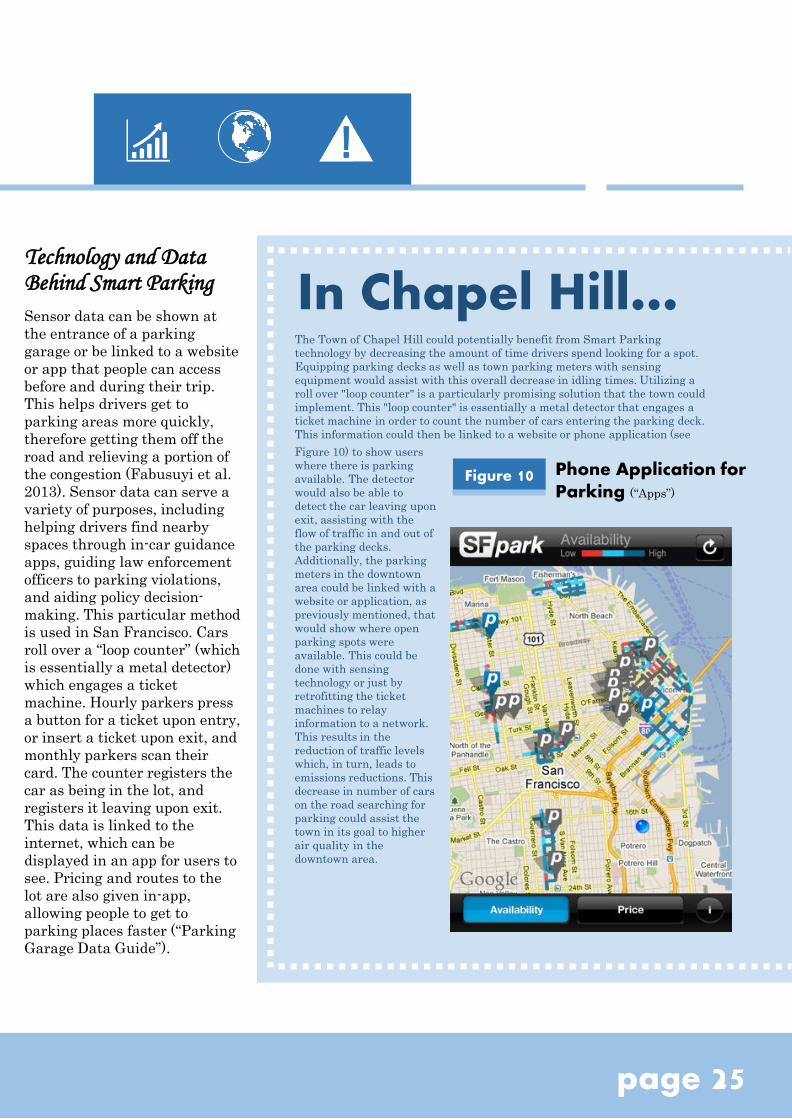
The Town of Chapel Hill could potentially benefit from Smart Parking
technology by decreasing the amount of time drivers spend looking for a spot.
Equipping parking decks as well as town parking meters with sensing
equipment would assist with this overall decrease in idling times. Utilizing a
roll over "loop counter" is a particularly promising solution that the town could
implement. This "loop counter" is essentially a metal detector that engages a
ticket machine in order to count the number of cars entering the parking deck.
This information could then be linked to a website or phone application (see
Figure 10 Phone Application for Parking (“Apps”)
page 25
Figure 10) to show users
where there is parking
available. The detector
would also be able to
detect the car leaving upon
exit, assisting with the
flow of traffic in and out of
the parking decks.
Additionally, the parking
meters in the downtown
area could be linked with a
website or application, as
previously mentioned, that
would show where open
parking spots were
available. This could be
done with sensing
technology or just by
retrofitting the ticket
machines to relay
information to a network.
This results in the
reduction of traffic levels
which, in turn, leads to
emissions reductions. This
decrease in number of cars
on the road searching for
parking could assist the
town in its goal to higher
air quality in the
downtown area.

Reducing Sources of Pollution
How can the car population decrease?

There are a variety of methods that can reduce air pollution in a region by cutting vehicle emissions,
and reducing the number of vehicles on the road is the most obvious way of doing this. Modeling
work done through C-Line has found that for most roads, removing 100 gas cars from the road per
day reduces PM2.5 concentration by 1%. All streets in Chapel Hill would see a significant
improvement in local air quality merely by reducing the number of vehicles on the road. Thus large
reductions in emissions can be obtained by relatively minor steps. Commuters and visitors can be
incentivized to ride electric buses, drive electric vehicles, take a bike to work, or carpool.
Alternatively, they can be taught how to drive their current vehicles in a more efficient manner in
order to conserve fuel and reduce emissions, a practice known as eco-driving.
Any of these suggestions, or more ideally, a combination of them, can be used to reduce pollutant
emissions in Chapel Hill as well as traffic and gridlock. Fewer cars on the road would also increase
the amount of available parking and make Chapel Hill more accessible to visitors and tourists who
can better enjoy all the city and Franklin Street have to offer.
page 27
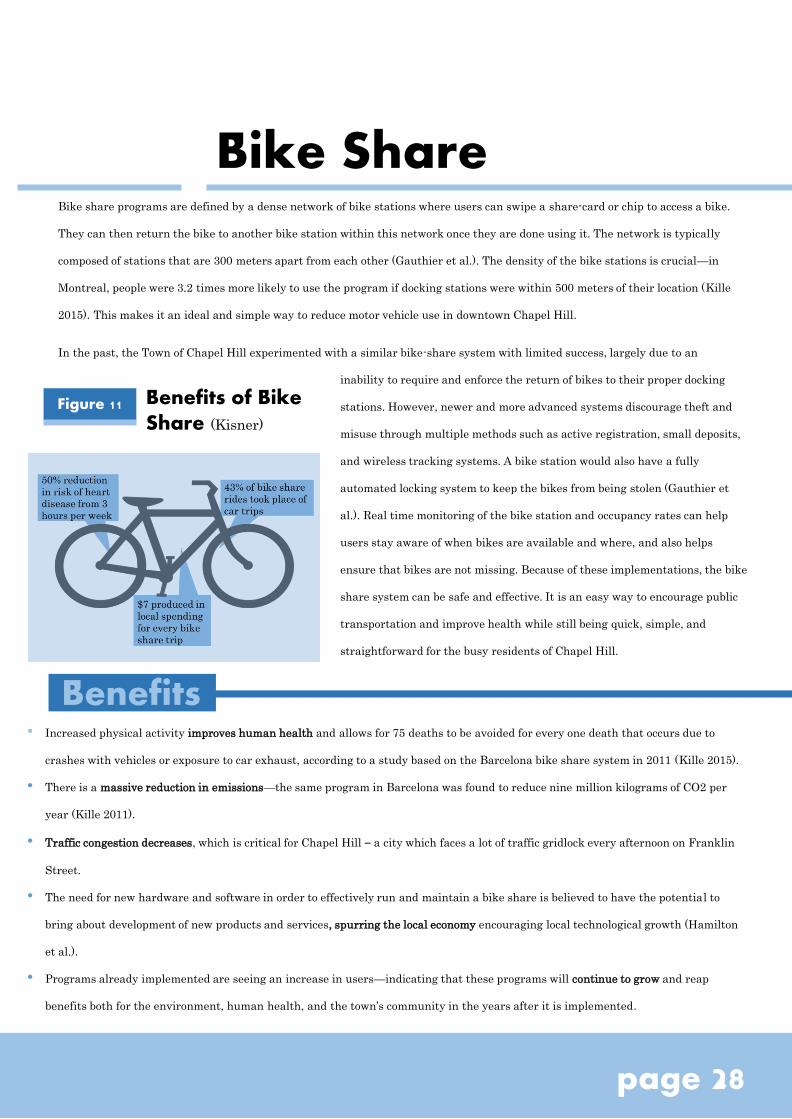
Bike share programs are defined by a dense network of bike stations where users can swipe a share-card or chip to access a bike.
They can then return the bike to another bike station within this network once they are done using it. The network is typically
composed of stations that are 300 meters apart from each other (Gauthier et al.). The density of the bike stations is crucial—in
Montreal, people were 3.2 times more likely to use the program if docking stations were within 500 meters of their location (Kille
2015). This makes it an ideal and simple way to reduce motor vehicle use in downtown Chapel Hill.
In the past, the Town of Chapel Hill experimented with a similar bike-share system with limited success, largely due to an
Bike Share
• Increased physical activity improves human health and allows for 75 deaths to be avoided for every one death that occurs due to
crashes with vehicles or exposure to car exhaust, according to a study based on the Barcelona bike share system in 2011 (Kille 2015).
• There is a massive reduction in emissions—the same program in Barcelona was found to reduce nine million kilograms of CO2 per
year (Kille 2011).
• Traffic congestion decreases, which is critical for Chapel Hill – a city which faces a lot of traffic gridlock every afternoon on Franklin
Street.
• The need for new hardware and software in order to effectively run and maintain a bike share is believed to have the potential to
bring about development of new products and services, spurring the local economy encouraging local technological growth (Hamilton
et al.).
• Programs already implemented are seeing an increase in users—indicating that these programs will continue to grow and reap
benefits both for the environment, human health, and the town’s community in the years after it is implemented.
Benefits
inability to require and enforce the return of bikes to their proper docking
stations. However, newer and more advanced systems discourage theft and
misuse through multiple methods such as active registration, small deposits,
and wireless tracking systems. A bike station would also have a fully
automated locking system to keep the bikes from being stolen (Gauthier et
al.). Real time monitoring of the bike station and occupancy rates can help
users stay aware of when bikes are available and where, and also helps
ensure that bikes are not missing. Because of these implementations, the bike
share system can be safe and effective. It is an easy way to encourage public
transportation and improve health while still being quick, simple, and
straightforward for the busy residents of Chapel Hill.
page 28
Figure 11 Benefits of Bike Share (Kisner)

Minneapolis
With 700 bikes and 65 stations, the
program runs from April to
November. 89% of riders reported
using Nice Ride for transportation,
not just recreation. In fact, 4.3% of
workers bike to and from work now.
Minnesota’s bike share program was
developed through a combination of
funding from public and private
sources.
Mission Alignment with the town
A bike share program in Chapel Hill aligns well with the Town’s bike plan and 2020
plan by supporting an entrepreneurial atmosphere, as well as creating “bikeable
connections” with downtown and the surrounding areas, connecting the town with
varying spaces and encouraging people to travel, work, and shop in different areas
that may be too far away to walk to. In the Town’s bike plan, a variety of
recommendations were included to help direct the process of creating a bike share.
These include making a coordinator for the plan, conducting bicycle counts to
determine current conditions, increasing coordination between town departments and
supporting local advocacy groups, among other things (“The Chapel Hill Bike Plan”).
The Triangle as a Bicycling Hub
Other areas in the Triangle and beyond have similar programs. For instance, the UNC
campus, Raleigh, and Charlotte all have other bike programs that can be used as a
model and, in the case of the UNC campus, can even be tied into the nascent Chapel
Hill bike program. And for Triangle cities, there are many ways to get a bike program
off the ground. Raleigh received a 1.6 million dollar federal grant to fund its program,
leaving less than $500,000 necessary in public funding to start the program and cover
initial operating costs (Specht).
A Continuous Bicycle System
Carrboro is also exploring a bike share program. As of 2015, Carrboro was developing
a parking management plan that included a recommendation for a bike share
program. If UNC’s campus and Carrboro both have a bike share, the Town of Chapel
Hill can include its own program to create a unified network. This could increase the
total number of users and reduce the traffic in Chapel Hill even more than an isolated
program. Washington D.C.
A city plagued by traffic gridlock, the
Capital Area Bike Share was installed
with 10 stations and 100 bikes, with
1,000 more bikes to be added in the
coming years. Over 25 years the
program is predicted to see a 42%
increase in users (Kisner).
In Chapel Hill…Cities love bikes!
Many cities around the country have
launched similar programs with great success.
Denver
43% of bike rides took the place of car
trips, reducing 313,000 lbs of CO2 per
year. Members can even use the B-
Cycle website to track things such as
their ride history, calories burned, and
carbon emissions reduced (Kisner).
page 29

Chapel Hill Transit is the second largest transportation system in North Carolina and covers over 160 square miles (Facts and
Figures). The Town of Chapel Hill has identified a reduction in emissions by 20 pounds per day when individuals chose to travel by
transit over individual car trips (Facts and Figures). With 98 fixed route vehicles annually covering over 2.5 million miles, this
provides an excellent opportunity for reducing the town’s reliance on fossil fuels for transportation services (Facts and Figures).
Electric-power buses complement this goal by providing an identical method of transportation without the corresponding air
pollution. These buses run on electricity, which eliminates the need for fuel burning to power the vehicle and thus the amount of
pollution emitted. The system utilizes features such as electric motors, electric energy storage devices, electric controllers, and
inverters to allow the bus to function purely or primarily on electrical power (Eudy and Gifford). In general, electrification has been
found to reduce harmful ground level ozone, the primary ingredient of smog, by lowering emissions of compounds that react together
to create ozone—nitrogen oxides (NOx) and volatile organic compounds (VOCs) (Tonachel).
Electric Buses
Purely electric propulsion buses requires a relatively large electrochemical battery, which is used as the sole power source (Callaghan and Lynch). An electric traction motor (or several) provides power for propulsion and all accessory systems. Proterra, a startup in San Francisco, is working on new innovations for electric buses. Their model can go a full day with no charging. This saves $50,000 a year in diesel costs, and even more money is saved in maintenance costs. The bus can even charge in less than 10 minutes, fitting well into the rapid bus schedules of many major cities. However, the 35 foot Proterra model costs approximately $650,000 and the 40 foot Proterra model costs approximately $750,000 ( "The ProterraCatalyst 40-Foot Transit Vehicle"). Although this is very expensive, they can be government subsidized, drastically improving the affordability of the vehicle (Eudy and Gifford). Electric buses can also be centrally located and charged, allowing for easier maintenance and scheduling, and have a greater tolerance for added weight. They also have less rigorous pull-out and start-up requirements. However, some issues exist with purely electrical vehicles. Storing the electricity effectively remains a challenge, and electrical errors could cause major problems for the vehicle (Eudy and Gifford).
Electric Bus Technology
Hybrid buses have a fuel-burning prime power source, which is typically an internal combustion engine (ICE), and couple it with an electrochemical or electrostatic energy storage device (Callaghan and Lynch). The two systems work together to provide energy for propulsion through an electric traction drive system. Power for all vehicle accessory systems can thus be provided for using either electrical power or mechanical power from the ICE, or it can be provided for using a mix of the two. Hybrid-electric propulsion technology is developing quickly. It allows for direct energy replacement capability in transit, as the energy storage system and ICE are designed in a way so that the batteries are never depleted, meaning the only cap on the range of the vehicle is the amount of fuel (Callaghan and Lynch). And although they are not purely electric, there are big mileage increases—hybrid buses have been found to have 20% better mileage than diesel buses (Thoms et al.). Additionally, they have 15-17% better fuel economy (Feldman et al.). However, there are very high maintenance costs to maintain such a complicated system, and one study found that hybrid buses actually increased NOx emissions, suggesting that not all pollutants will be reduced by redesigning the bus fleet (Barnitt). Hybrid buses are less expensive than purely electric buses. Costs can range anywhere from around $385,000 up to $450,000 (Barnitt; Eudy and Gifford).
Fuel cell buses convert chemical energy from a fuel source into electrical energy. The electrical energy produced by the fuel cell is used for propulsion and accessory systems via one or several electric traction motors. This can be used on its own as a power source, or can be used as the primary power source in a hybrid-electric system (Callaghan and Lynch). Many fuel cell vehicles use this configuration. Fuel cells have a lot of potential, but are still in an early stage of development (Callaghan and Lynch).In other cities around the country, hybrid and electric buses have begun to take off as an alternative mode of transit. In Durham, the “Bull City Connector” is a hybrid-electric bus service that charges no fares to its passengers. It runs from downtown Durham to Duke University, and allows movement of people between Durham’s major city centers while ensuring that such movement does not harm the environment (“Bull City Connector”). Charlottesville, Virginia, is going a step further by planning to have all its diesel buses replaced by hybrids by 2020 (Thoms et al.). The first two hybrids-which went into use in 2011-consume 7,000 less gallons of fuel per year, which saves the city $21,000 (“CAT Introduces Hybrid Buses to Charlottesville”).
page 30

Create a Pilot Program
In Chapel Hill, there is a large opportunity for integrating electric buses into the fleet.
Though the fleet already has 14 hybrid buses out of 99 total, it has great room for
growth and expansion towards its goal of providing safe and reliable transportation to
the town (“Chapel Hill Transit Facts and Figures”). The fleet covers 160 square miles,
with over 2.5 million miles per year and 7 million rides, speaking to the fact that
adding even a few more all-electric or hybrid buses could have a big impact on the
area’s long-term air quality.
Because of the long-term cost effectiveness of the Proterra buses mentioned before,
adopting one of these vehicles as a pilot test is a step the Town of Chapel Hill can take
to a fuel-free fleet.
Charlottesville as a Funding Example
For example, Charlottesville, Virginia now has a variety of alternative fuel vehicles in
operation. This includes 23 hybrid-electric vehicles, three all-electric vehicles, two
compressed natural gas (CNG) school buses, and several others that utilize fuels such
as ethanol/gas blends and biodiesel, adding up to a total of 49 alternative fuel vehicles
(“Alternatively Fueled Vehicles”). Providing this may seem prohibitively expensive,
but Charlottesville received 3.7 million dollars in federal funds to get these buses.
Some of the federal funding was paid for with money budgeted from the American
Recovery and Reinvestment Act (ARRA), with other funds coming from more local
sources (“City Receives $3.7M for Hybrid Buses, Transit Projects”).
Charlottesville shows that ample federal and local funds are available to pay for
significant portions of the upfront costs of purchasing electric buses. Funding ideas for
getting an electric bus are mentioned in the Funding Section on page 44.
In Chapel Hill…Electric buses can even be used in
school districts. In the San
Joaquin Valley in California, the
Kings Canyon Unified School
District has become one of the
earliest adopters of multiple all-
electric school buses, with the use
of these buses beginning in 2014
(Tweed). Due to predictable
routes for school buses, the
battery’s limited range is less of
an issue, and a schedule for
charging can be developed so that
the bus does not run out of power
(Tweed). Although many states
already have anti-idling laws that
apply to school buses to reduce air
pollution around children,
exceptions are often made. For
instance, in order for the bus to
run heat or air conditioning, the
bus must be powered on, so idling
is permitted in these cases.
Electric buses for
schools
(Tweed)
page 31

Eco-driving is a practice that encourages people to change their driving habits in order to reduce the
emissions of their car. It is composed of two major categories: things you can do to maintain your vehicle
before your trip that will reduce your emissions, and things you can do during your trip that will reduce
your emissions. Drivers can also save money through fuel savings. Depending on what combination of
practices a person uses, fuel savings can reach upwards of 40% (Wengraf). Eco-driving averages about
10% of fuel saved, but getting up to 30 miles per gallon instead of 20 miles per gallon saves the average
driver about $990 dollars per year solely in fuel costs according to the NC Department of Transportation.
One of the main components of eco driving is reducing idling. Running an engine when the vehicle is
stopped needlessly wastes 5-8% of fuel in the tank (Barkebus). While stop-start systems can help reduce
this problem, drivers must learn to become more aware of how they are driving so that they can save
money and reduce pollution, especially in places like schools, where idling in carpool lines is a serious
problem for the children who go there. Avoiding idling is an important part of eco-driving, as drivers save
in fuel and maintenance costs, extend the lifetime of their vehicle, and of course, reduce emissions. Anti-
idling programs use three main methods to encourage better driving habits: technology, policies, and
education.
Eco Driving and Anti-Idling
• Performing regular vehicle maintenance.
• Checking tire pressure to avoid be wasting
fuel just trying to get the car to move on low-
pressure tires.
• Planning the trip route to allow the driver to
avoid slowdowns in high traffic areas and to
avoid getting lost, also saving fuel and
money.
• Reducing the amount of weight in the car to
reduce the car’s strain under a lot of
unnecessary weight (Wengraf).
Depending on what
combination of
practices a person
uses, they can save
up to 40% of fuel.
Most average about
10% of fuel saved,
but that adds up—
getting up to 30
miles per gallon
instead of 20 saves
the average driver
about $990 dollars
per year solely in
fuel costs.
Before Driving During Driving
• Below 40 miles per hour, it is more fuel efficient
to just open a window; after 40 miles per hour, it
is more fuel efficient to use the air conditioning.
• Drive at reasonable speeds, as driving too far
below or too far above energy efficient speeds
means a driver will waste more fuel.
• Turn off the engine if the car is going to be
stopped for more than one minute (Wengraf).
• Reduce idling by purchasing stop-start systems
and learning to become more aware driving
habits (Barkebus).
page 32

Encouraging eco-driving also presents an opportunity for Chapel Hill to meet the goals of its Green Fleets policy, and
with much less upfront cost. Section 4b of the Green Fleets Policy emphasizes that Chapel Hill should work to operate
and maintain its current fleet in a manner that is energy efficient and reduces emissions (Horton). Eco-driving and
anti-idling practices can be implemented in a variety of ways:
In Chapel Hill…
Technology
Many promising devices are now on the market
that can reduce idling.
• The Governor to Reduce Idle and Pollution
(GRIP): turns the engine off after a set
period of time but keeps the battery on. It
costs $3,000, but saves $3,500 after the first
year, easily paying itself back.
• Energy Xtreme: battery pack that
automatically recharges when the car is
running. This lets the driver turn the
engine off and avoid idling. It allows for
$3,000 worth of savings per year. The
Dallas Police Department saves an
estimated 72.75 lbs of CO2 emissions per
vehicle per day.
• Scangauge: works with most cars produced
after 1996 and acts as a real time vehicle
monitor, providing drivers with information
on fuel consumption, trip costs, carbon
dioxide emissions, and much other useful
information (“Scangauge E”). It allows for
10% of savings in fuel economy and can be
purchased individually for about $150.
Policy
There are also a variety of
policies that the Town of
Chapel Hill can implement to
reduce idling.
• In sensitive locations such
as Franklin Street, idling is
a big problem, especially for
delivery trucks and buses
that idle in the area for
extended periods
throughout the day. This is
also a problem in schools in
Chapel Hill. Fines can be
implemented to discourage
the practice.
• Incentives can be
implemented to help people
afford the costs of anti-
idling technologies. This
can include things like cash
incentives or tax
reductions.
Education
One of the most crucial ways to
encourage eco-driving is through
education (Ryan).
• This can include information
flyers, or utilizing events such as
Earth Day celebrations to include
information as part of the
celebration and activities.
• Training at motor shows can also
teach people how to use vehicles in
an environmentally-friendly way
(Wengraf). In fact, there are many
professional training associations
that work to promote these goals,
and they can collaborate with
school-based driver education
programs to teach people when the
information is most likely to stick:
when they learn how to drive.
There are many existing programs
that the Town can use as a model,
such as the EPA’s Idle Free Schools
Toolkit.
page 33

Electric vehicles are fueled primarily by electric power instead of fossil fuels. Encouraging commuters to invest in electric
vehicles, or replacing town vehicle fleets with electric vehicles, has many benefits including fewer emissions and lower
operational costs. There are two main types of electric vehicles: plug-in electric vehicles, or PEVs, and battery-electric
vehicles, or BEVs (“Alternative Fuel Tool Kit - How To Implement: Electric Vehicles.”). PEVs have both a gas engine and an
electric motor, and the battery can be recharged by plugging into the local power grid or through running the engine. A BEV
only uses electricity, which is obtained from the power grid (“Alternative Fuel Tool Kit - How To Implement: Electric
Vehicles.”).
PEVs have lower fuel and maintenance costs than traditional gasoline-powered cars which can offset the higher initial cost of
purchasing the vehicle. Per gallon of gasoline, PEVs run at a cost equivalent to 50-70 cents, saving the user a lot of money.
Because electricity rates are more stable than the price of gasoline, it is easier to budget and plan ahead. PEVs have much
lower emissions than conventional vehicles, and battery-electric vehicles (BEVs) have no emissions at all. The combined
effect is that encouraging Chapel Hill commuters to purchase PEVs or BEVs will not only improve the air quality in Chapel
Hill, but will save consumers money on gasoline, which they can then spend at local businesses (“Alternative Fuel Tool Kit -
How To Implement: Electric Vehicles.”).
Electric Vehicles
Charging Infrastructure ChallengesPerhaps the biggest challenge a department must face when transitioning a fleet to EVs is the lack of charging stations,
especially for departments that regularly travel on longer stretches of road. Oregon addressed this in 2009 with funding
from the American Recovery and Reinvestment Act (ARRA) which allowed the Oregon Department of Transportation to
install DC fast charging stations at 10 intersections along I-5 in southern Oregon. This created 200 miles of interstate that
was “PEV-ready.” Level 1 and 2 charging units are also being installed all over residential and commercial spaces in
Oregon, and as of September 2014, there were already 373 publicly available EV stations. In June 2013, Oregon Senate
Bill 536 was passed, which allowed state agencies to install charging equipment at locations owned by the state. These
developments cover a crucial step that must be taken to encourage people to buy EVs: creating a network of charging
stations vast enough and dense enough so that the consumer can be sure that their vehicle will be able to get them to their
destination without running out of charge. This is particularly an issue for BEVs, but all EVs need to have a dense
network of charging stations for them to be a good financial decision, and Oregon’s model represents a smart, strategic way
of alleviating these concerns (“Feasibility and Implications of Electric Vehicle (EV) Deployment and Infrastructure
Development.”).
In fact, the city of Houston calculated that in order for every point in the Houston area to be within one mile of a charging
station, the city would need 400 charging stations. For an urban area covering 1,300 square miles with 1,000 fossil fuel
stations, 400 charging stations seems feasible (“Electric Vehicle Charging Long Range Plan for the Greater Houston
Area.”). Public funding for installing charging stations is available in many places. In the Bay Area of California, for
example, one million dollars was budgeted from the Bay Area Air Quality Management District (BAAQMD) to provide up
to $20,000 per DC Fast Charger assuming it meets their program requirements. Other state organizations and bills such
as SB 359, which provides funding for programs that encourage environmentally-friendly automobile purchases, and AB
1092, which requires building changes to include the installation of EV charging infrastructure, also pushes businesses
and organizations to make EV usage more accessible. While California leads the way in terms of green technology, North
Carolina also has programs that encourages infrastructure projects designed with EV usage in mind-such as in Charlotte.
page 34

In Chapel Hill…Mission Alignment with the Town
The Town of Chapel Hill has already expressed interest in transitioning the town’s fleet of vehicles to a fleet that has reduced
emissions and is more efficient in the Green Fleets Policy (Horton). The Town emphasizes three key goals: reducing the energy
consumption of its current fleet in order to save costs, reducing dependence on foreign oil, and improving air quality across the region.
These are all necessary for establishing Chapel Hill as progressive city committed to technological advancement and environmental
health. As noted in the policy, it would also save money: as of 2005, 68% of the Town’s energy bill comes from its transportation, which
consists of a mixed vehicle fleet and a transit bus fleet. The policy outlines a need for Chapel Hill to purchase or lease vehicles which
are as energy efficient as possible, while also ensuring that they can still perform the duties required of them (Horton). In this,
transitioning to a fleet that is more heavily composed of EVs would be an obvious extension of this policy.
Power2Charlotte as a Model
There are many good examples around the country and state of electric vehicle programs that have been effective in addressing
challenges posed in transitioning from fossil fuel vehicles to EVs. Charlotte has been energized to start thinking about cost-effective
electric vehicle solutions. The Power2Charlotte campaign was launched by the Queen City in order to encourage energy efficiency
awareness and was funded by the U.S. Department of Energy through an Energy Efficiency Conservation Block Grant, or EECBG
(“Power2Charlotte”). Of the 16 projects covered by the campaign, one focused on electric vehicles, budgeting $275,000 for the city to
add eight EVs to their fleet plus install 26 EV charging stations in seven places. Policy initiatives are also in place to support the EV
campaign. For example, PEVs are exempt from emissions inspection requirements throughout the state of North Carolina, and are
permitted to use High Occupancy Vehicle (HOV) lanes even if there is only one person in the vehicle. Green vehicle loans are offered
through the Local Government Federal Credit Union to allow people to buy new and used fuel-efficient vehicles, with interest rates 0.5
percent lower than typical new or used car loan rates. These initiatives not only make it easy for people to use EVs, but help offset the
initial cost of purchasing one through loans and offering additional financial perks throughout the lifetime of the vehicle
(“Power2Charlotte”).
Opportunities in Chapel Hill
The Town of Chapel Hill can implement similar programs revolving around marking campaigns to change the culture of electric vehicle
decisions in Chapel Hill. This can be in the form of advertisements on the shells of Chapel Hill Transit Buses, commercials during UNC
football games on charging locations around the town, and so much more. By creating a community that prioritizes vehicles that do
not consume fuel, the Town of Chapel Hill can better demonstrate the need to fund more charging infrastructure.
page 35

The people of Chapel Hill currently have a variety of programs that allow them access to information about how to set up a carpool or
vanpool, which is the most important step in establishing a carpool program. These programs include ShareTheRideNC, which is a
carpool matching service sponsored by the North Carolina Department of Transportation and GoTriangle. This service helps drivers find
people to make carpools with. Carpoolers can register for the Emergency Ride Home Program, which allows drivers to use a vehicle to go
home in the case of an emergency, which lets participants carpool while still being flexible (“Carpool”). Chapel Hill also has a thriving
vanpool program, with several van routes available between different cities in the Triangle and Triad. Commuters sign up for a vanpool,
pay a yearly fee, and can ride the van to work instead of paying large amounts of money for gas and car maintenance by driving every
day. The fee is approximately $624, though it varies by the number of riders and the miles traveled by the van. Currently, there are seven
vanpools available, and they are leased by GoTriangle or the Piedmont Authority for Regional Transportation, or PART (“Vanpool”).
Although carpools and vanpools are accessible in Chapel Hill, there are no programs that encourage people to make the leap to carpooling.
Creating an incentives program in Chapel Hill would encourage people to start carpooling and stay carpooling, reducing air pollution and
traffic.
An incentives program provides some incentive (usually monetary) to carpoolers to encourage commuters to share rides. Even once the
incentive ends, many people tend to continue carpooling (Ben-Akiva and Atherton). There are several types of incentives that can be used.
Payments encourage people to begin carpooling by giving small, limited payments to those who do. These can be private and based with
the employer, or public and sponsored by a local government. This proposal will focus on government-based incentives, however
incentivizing businesses to start programs of their own is also possible. Preferential parking is another type of incentive which lets
carpoolers have designated, preferred parking spaces (Ben-Akiva and Atherton). In Chapel Hill, where one of the biggest complaints
about transportation is lack of parking, this could be particularly effective.
Government-based payment incentives work by sending money to registered carpoolers—usually 1-3 dollars a day. Usually, the program
is capped at some amount of money or some length of time. Cheating is discouraged through methods such as registering carpoolers and
requiring them to provide the contact information of their employer, who can then be randomly called to ensure that the driver is still
carpooling. There have been successful programs in many cities, such as Atlanta, Washington D.C., Redmond, WA, and Los Angeles
(Brown). According to surveys done by the University of Vermont, cash incentives have a high likelihood of encouraging people to start
carpooling (Watts).
In Washington D.C., this program has had much success. A test program was started in the fall of 2009, and it allowed commuters along
three congested corridors to get $2/day for carpooling. The program was paid for with federal Congestion Mitigation and Air Quality
Improvement funds that were budgeted for 2009 but never used. The total projected cost in 2009 was determined to be $192,000, with
$95,000 budgeted directly for the payments for approximately 700 carpoolers and the rest going to administration and advertising
(Brown). The program discouraged cheating by making random calls, and also required carpool members to vouch for one another’s travel
reports to ensure honesty. Since 2009, the original corridor restrictions of this project have been lifted, and the program has been
expanded to appeal to a wider variety of commuters. Nicholas Ramfos, the program director of the transportation operations programs in
D.C., described a follow-up survey in fiscal year 2011 that found that 93% of the original demonstration project participants continued
carpooling after the incentives were completed (Ramfos). Of new participants, 98% said they planned to carpool after the incentives
stopped coming. Based on the success of the original program, a vanpool incentives program was created in 2012. In 2014, another survey
was conducted of all program participants that had completed the program and found that there was a 55% retention rate among
carpoolers and vanpoolers. The eligible vanpools receive a $200 per month incentive, and the carpool program allows new carpoolers to get
$130 over a 90 day time frame (Ramfos). The success of the D.C. program over more than five years is a testament to the effectiveness and
versatility of carpool incentive plans.
A similar program was launched in Atlanta, which offers $3/day for up to three months for commuters to switch to alternatives. This
includes carpooling, biking, public transit, or working from home (Brown). From 2002-2009, 29,000 commuters participated in the
program, which reduced 32.8 million vehicle miles of travel (VMT) according to the Clean Air Campaign. 9-12 months after the cash flow
stopped, 64% of participants were still using these alternatives at least once a week, according to a survey from the Center for
Transportation and the Environment. The success of carpooling programs is not just limited to D.C.— it can take off in many cities and
really last. Cheating was discouraged in Atlanta by requiring commuters to provide employer contact information when they register, as
well as signatures from their supervisors. As of 2009, only 25 cheaters were caught, suggesting that it is unlikely that a significant
amount of people will try to manipulate the program (Brown).
Carpooling
page 36

Preferential parking is another method that can be used to encourage drivers. Here, the city (or employers) would give preferential
parking spaces to carpoolers. One can also combine this policy with area-wide parking disincentives for single-occupancy vehicles, which
has an even greater increase in shared rides but also sees a spike in public transit use, as well (Ben-Akiva and Atherton). According to the
transportation survey done by the University of Vermont referenced earlier, respondents said that parking measures, such as preferred
spots or reduced parking fees would also be likely to encourage them to start carpooling (Watts). This is especially relevant in Chapel Hill,
where a lack of parking is a constant complaint. Giving carpoolers preferred spots would not only reduce traffic and air pollution, but the
increase in the number of carpoolers would mean that less vehicles would be on the road and thus less vehicles would be taking up
parking spaces. This would free up more spaces for even more visitors to Chapel Hill, alleviating parking stress.
There are many financial, economic, and of course, environmental benefits to incentivizing carpooling. Pollutant reductions were
calculated based on data from the Washington D.C. program, EPA guides, and data from the Fayetteville Area Metropolitan Planning
Association (Rogers et al.; “Sample Calculation of Emission Reductions and Fuel Savings from a Carpool Program”; and “Vehicle
Occupancy Rate”). Using the assumption of an incentive of $2/day, the new vehicle occupancy rate (the average number of passengers per
vehicle) of Chapel Hill was determined based on the Washington D.C. pilot program estimates. The reduction in the number of vehicles on
the road was then determined by comparing the old vehicle occupancy rate with the new vehicle occupancy rate. The original number of
vehicles on the road was determined based on the C-LINE model, which included information about the average annual daily traffic
(AADT) on each road. Using this data, the reduction in vehicles was calculated. For a $2 daily incentive, the calculations predict the
number of vehicles on the road will decrease by 4.3%.
In Chapel Hill…There are a number of ways the Town of Chapel Hill can implement incentives and infrastructure that
encourages carpooling participation. Any one of the measures previously described has a significant effect on
the air quality of Chapel Hill.
C-LINE Modeling
Using data from the C-LINE model, PM2.5 reductions based on changes in AADT were calculated. Each 5%
decrease in the number of gas car trips is associated with a decrease in the concentration of PM2.5 of 0.053
micrograms per cubic meter (ug/m3), assuming the AADT is 10,000 vehicles. Roads with higher AADTs, such as
Franklin Street, see even greater reductions in PM2.5 (about 0.003 ug/m3 for every additional 500 trips). Most of
downtown Franklin Street sees PM2.5 concentrations from transportation-related sources ranging from 1-10
ug/m3. Thus, a decrease in PM2.5 due to carpooling would be significant and would have a large impact on the
environment of Franklin Street.
Even More Benefits
Beyond reducing pollution and making Franklin Street a more hospitable place, more carpooling means that
more people can access Franklin Street without having to confront traffic and low parking. This encourages
business growth, as more patrons are visiting. A reduction in air pollution will also make Franklin Street a
more welcoming environment, encouraging visitors and tourists to come. An increase in carpooling would also
put money in commuters’ pockets by allowing them to save money on gas and vehicle maintenance, and this is
money they can easily spend at local businesses to grow the economy of Chapel Hill.
page 37

Absorbing Existing Pollution
How can existing air pollution be remediated?
ONE GENERATES$31,250 WORTHOF OXYGEN
PROVIDES$62,000 WORTHOF AIR POLLU-TION CONTROL
&IN 50 YEARSTREE
The incorporation of policies to improve the flow of traffic and reduce vehicular sources will have a
large impact on the environment and atmosphere in downtown Chapel Hill, however they will not
remove all pollution-emitting vehicles from the roads. Therefore, this report outlines a set of
proposals to absorb the existing pollution from vehicle traffic. It has been found that one of the
possible solutions for reducing PM2.5 concentrations in urban landscapes is increased vegetation
cover (Chen, et al. 1). This section discusses the installation of some pocket parks in the downtown
area, street greening, and living walls. The U.S. Forest Service has found that over a 50-year
lifetime, one tree can generate $31,250 worth of oxygen and provide $62,000 worth of air pollution
control along with many other benefits, including stormwater retention, carbon sequestration,
improvement of a street’s image, and increased human health (Sherer, 19). It is not
uncommon to see several inches of water
inundating parts of Franklin street during a severe
storm. Surveys have also shown a preference for
more shade while walking down the sidewalk on a
hot summer’s day, and many feel connected to a
beautiful tree that breaks up some of the urban
monotony. For all these reasons and the many
benefits trees and other types of vegetation produce
through the reduction of PM2.5 and ozone, three
approaches to greening Chapel Hill are proposed.
page 39

The Street Greening proposal aims to provide the Town with suggestions for specific species of trees for planting in the future that will
improve air quality. iTree is software that uses U.S. Forest Service data with several useful tools for the urban planner looking to green
their city. The iTree species tool allows the user to rank different processes and benefits on a scale of 1 to 10 that they want in an urban
tree. The software also takes into account the area’s climate. Research for this project produced a top 10% list of species from iTree by
ranking air quality as the highest priority. This list was cross-checked with recommended street tree species from the State of North
Carolina Division of Forest Resources to come up with seven species that the Town of Chapel Hill can plant in the future in order to
insure improved air quality and more resilience in tree populations. These species include; Freeman Maple (Acer X freemanii),
Horsechestnut (Aesculus hippocastanum), Sugarberry (Celtis laevigata),Turkish Hazelnut (Corylus colurna), Ginkgo (Ginkgo
biloba),Littleleaf Linden (Tilia cordata), and Silver Linden (Tilia tomentosa). iTree modeling also prioritized air temperature reduction,
carbon storage, and stream flow reduction as functions of the trees. Therefore, these species will not only be effective in improving air
quality, they will be effective in retention of storm water, carbon storage, and cooling downtown Chapel Hill.
Street Greening
In order to measure the real effect that planting these species could have on air quality on Franklin Street, a survey of the tree
species was conducted on October 13th of this year to record each tree species, diameter at breast height (DBH), and crown condition
from Crook’s Corner to the Henderson Street intersection. These data were then processed through another iTree tool, iTree Eco,
which uses local hourly air pollution and meteorically data to quantify the value of trees and their environmental effects. One-
hundred and twenty-four trees were recorded. The current population of trees on Franklin Street annually removes 64 pounds of air
pollution, sequesters 1 ton of carbon, produces 4 tons of oxygen, and retains 2,520 cubic feet of stormwater runoff 1. To then create a
report of how the recommended species could improve the air in the downtown area, the tree population was then modified to
include the seven new species. Trees that were classified in the worst condition were replaced, Google Maps was used to estimate
that 21 trees could be planted along the street at the construction site of Carolina Square (see picture). With a new total of 145 trees,
including the recommended species entered with a median DBH of the current trees (12in), the benefits increased substantially. The
amount of air pollution removed went up to 78 pounds per year, with 2 tons of carbon sequestration, 5 tons of oxygen produced, and
3,123 cubic feet of avoided runoff. Also when looking specifically at the air pollution removal of the new population of trees, the most
economic savings comes from their removal of ozone and PM2.5. While the trees remove the most pounds of ozone per year, the
smaller amount of PM2.5 removed is highly valuable due to its severe health implications, saving $74.64 per year.
In Chapel Hill…
EACH YEAR:
14 more pounds of air pollution removed
1 more ton of carbon sequestered
1 more ton of oxygen produced
603 more cubic feet of avoided runoff
page 40
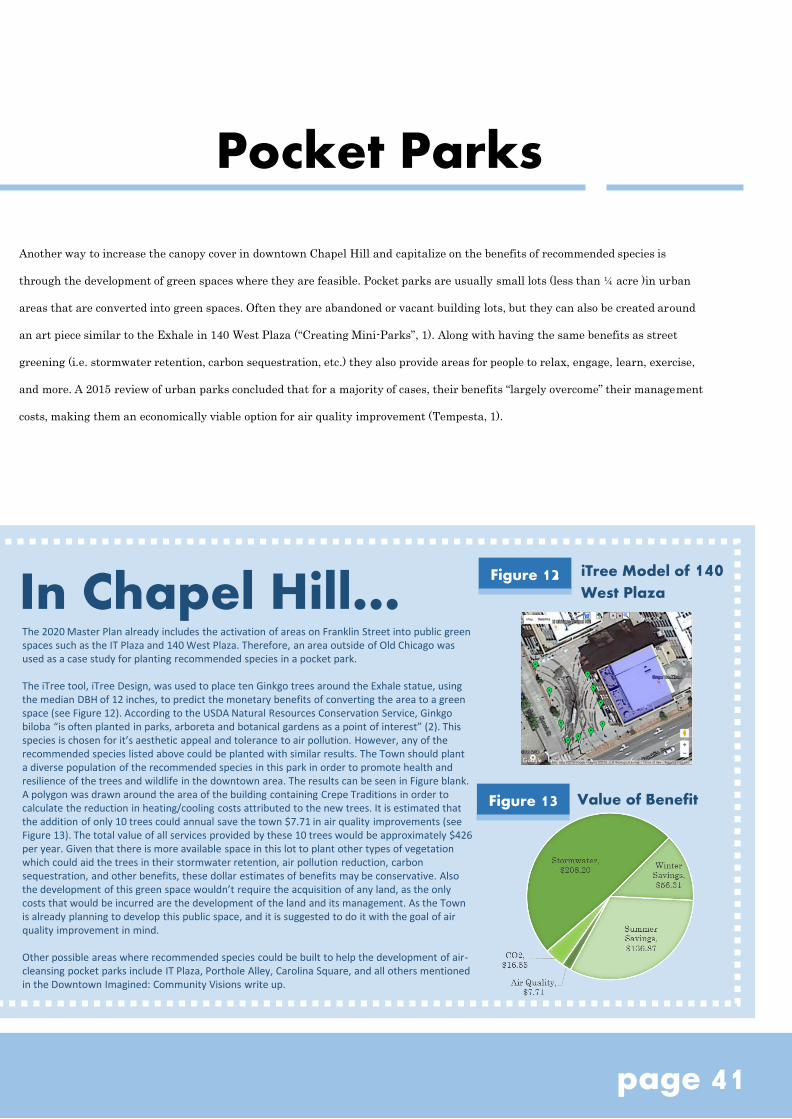
Another way to increase the canopy cover in downtown Chapel Hill and capitalize on the benefits of recommended species is
through the development of green spaces where they are feasible. Pocket parks are usually small lots (less than ¼ acre )in urban
areas that are converted into green spaces. Often they are abandoned or vacant building lots, but they can also be created around
an art piece similar to the Exhale in 140 West Plaza (“Creating Mini-Parks”, 1). Along with having the same benefits as street
greening (i.e. stormwater retention, carbon sequestration, etc.) they also provide areas for people to relax, engage, learn, exercise,
and more. A 2015 review of urban parks concluded that for a majority of cases, their benefits “largely overcome” their management
costs, making them an economically viable option for air quality improvement (Tempesta, 1).
Pocket Parks
The 2020 Master Plan already includes the activation of areas on Franklin Street into public green spaces such as the IT Plaza and 140 West Plaza. Therefore, an area outside of Old Chicago was used as a case study for planting recommended species in a pocket park.
The iTree tool, iTree Design, was used to place ten Ginkgo trees around the Exhale statue, using the median DBH of 12 inches, to predict the monetary benefits of converting the area to a green space (see Figure 12). According to the USDA Natural Resources Conservation Service, Ginkgo biloba “is often planted in parks, arboreta and botanical gardens as a point of interest” (2). This species is chosen for it’s aesthetic appeal and tolerance to air pollution. However, any of the recommended species listed above could be planted with similar results. The Town should plant a diverse population of the recommended species in this park in order to promote health and resilience of the trees and wildlife in the downtown area. The results can be seen in Figure blank. A polygon was drawn around the area of the building containing Crepe Traditions in order to calculate the reduction in heating/cooling costs attributed to the new trees. It is estimated that the addition of only 10 trees could annual save the town $7.71 in air quality improvements (see Figure 13). The total value of all services provided by these 10 trees would be approximately $426 per year. Given that there is more available space in this lot to plant other types of vegetation which could aid the trees in their stormwater retention, air pollution reduction, carbon sequestration, and other benefits, these dollar estimates of benefits may be conservative. Also the development of this green space wouldn’t require the acquisition of any land, as the only costs that would be incurred are the development of the land and its management. As the Town is already planning to develop this public space, and it is suggested to do it with the goal of air quality improvement in mind.
Other possible areas where recommended species could be built to help the development of air-cleansing pocket parks include IT Plaza, Porthole Alley, Carolina Square, and all others mentioned in the Downtown Imagined: Community Visions write up.
In Chapel Hill…
page 41
Figure 12 iTree Model of 140West Plaza
Figure 13 Value of Benefit

life,” they found that Danes were aware that green spaces are essential to environments which promote health (Stigsdotter, U. K., et al.,411).
Green spaces held real importance for the residents of that particular urban area. It is highly unlikely that development of these greening
initiatives will fade into the background of everyday life for the average Chapel Hill resident. They will be utilized, they will be enjoyed, and
they will be appreciated. Not only for the way they improve the physical health of those breathing in less vehicle-related air pollution, but also
for the way they reduce stress and increase overall well-being. The reason that Ram Reality developed 140 W Plaza to include Exhale was to
increase the appeal of the surrounding businesses. Utilizing these green proposals can make certain areas on Franklin Street more appealing,
creating spaces for people to relax, engage, build community, and educate. Therefore, not only do public green spaces and landscaping
improve property value, they can also increase retail activity (Kozloff).
Mounting evidence from previous studies and from our own research suggest that urban greening can greatly improve the air quality of the
area by absorbing the existing pollution from vehicles. However, it is important to note that they are not the only solution to this problem. As
the study of urban trees in Strasbourg City, France concluded, it is essential to pair managing urban forest resources with other strategies
that consider built structures and street design (Selmi, et al., 192). If the three projects from this section, street greening, implementation of
Pocket Parks, and living wall installations, were used in conjunction with a combination of the plans previously proposed, serious progress can
be made on the front of air quality.
Living WallsGreen walls are classified in two categories; living walls and green facades. Green facades requires the
utilization of climbing plants such as vines or ivy that can be planted at the ground at the base of a
structure. Living walls (example shown in Figure 14) are more complex systems of pre-vegetated
panels that are fixed vertically to a structural wall or frame, consisting of a diversity of plant species
(Green Roofs for Healthy Cities, 5). Three types of living wall systems include the trellis system,
planter box system, and felt layer system (Feng). The facades can hold groundcovers, ferns, low shrubs,
perennial flowers, and even edible plants (Sharp, et al., 8). As Chapel Hill is looking to grow the “town
and gown” collaboration, they could expand the Edible Campus initiative to include aspects of Franklin
Street with living walls. See the map and tables to discover the locations identified as suitable for living
walls, along with estimates of size, cost of installation, and air quality benefits. Given the relatively
high cost of green walls, green facades should be considered as a cheaper alternative. However, it is
likely that green facades are less effective in absorbing air pollutants such as PM and ozone. Many of
the open space on structural walls are located in alleyways. The downtown area is setup such that
pedestrians often travel across Franklin and Rosemary street using alleyways. Living walls could be a
way to make the common pedestrian alleyways more aesthetically pleasing to the Chapel Hill resident
or visitor.
Benefits of Urban GreeningThe three proposals aimed at reducing existing pollution all have a similar array of diverse benefits.
There is significant improvement of the mental well-being of citizens who can access green spaces and
aesthetic appeal. Data from the 2005 Danish Health Interview Survey was used to analyze the
relationship between “distance to green space and self-perceived stress.” Not only did the survey reveal
a strong positive correlation between distance from green space and poorer “health-related quality of
page 42
Figure 14
Living Wall Example (Meinhold)

In Chapel Hill…Based on a number of analytical methods, nine possible sites for living walls, as shown in Figure XX. Given existing plans to
make Porthole Alley pedestrian only, the Town should consider the installation of a green façade on the east-facing wall of
the alley way, across from the Carolina Coffee Shop. As this is a University owned building, this project could strengthen the
“town and gown” collaboration in order to encourage sustainability and improved safety of the residents and students. Also
having the living walls in an alleyway rather than facing the street wouldn’t necessarily reduce their effectiveness at
absorbing air pollutants. Living walls have a “filtered avenue” effect, in which they absorb pollutants with long atmospheric
times (ozone and PM) even in non-dense urban areas (Pugh, 7697). Along with their air quality benefits, living walls can
increase the energy efficiency of the buildings on which they are fixed, and reduce noise pollution by an average of 15 decibels
(Green Roofs, 9-10). However, all of these benefits don’t come without a cost. It is estimated that living walls cost anywhere
from $75-$125 per square foot for installation, plants, soil, and irrigation (Mathew, 14). On this particular wall, there would
be two separate section both measuring 549 ft2 with a total of 1,098 ft2 covered by vegetation. This wall would reduce PM10
annually by 114-220 grams and would absorb 876-1419 grams of total air pollutants yearly depending on the type of
vegetation. The recommended types of vegetation include short grass, tall herbaceous plants, and small, deciduous trees.
Installation of this wall would cost anywhere from $104,000 to $181,000. Using a University building as a pilot is a great
jumping off point for discussing the high cost of this project. First of all, it is not uncommon for living walls to be utilized as
advertising for large companies. Coke-a-cola, PNC, Adidas, and many other companies have taken to this innovative and
exciting way to communicate to people through
plants. A locally recognizable company such as PNC,
Wells Fargo, or even Nike, with its strong relationship
with University athletics, could contribute
significantly to the cost of installing a living wall in
Porthole Alley. Other funding options can be found in
the Appendix. Because green facades reduce the
ambient temperature around buildings through
evapotranspiration and shading and buffer against
wind during winter months, the University could
share the data on its energy efficiency savings from
before the installation to a few years after (“Green
Walls Benefits”). This way local businesses and other
buildings downtown could become interested in
developing living walls themselves.
page 43
Figure 15 Potential Living Wall Sites

Project FinanceWhere will the money come from?

Regardless of all of the aforementioned policies’ strengths and benefits, the feasibility of
implementing such measure depends heavily on the existence of funding sources. The area from
which funding sources are most likely available varies from case to case and section to section. This
section provides evidence to the town that these policies could potentially be funded, regardless of the
current budget of the town. There are several federal sources of funding that could be used for both
the traffic flow improvement suggestions as well as the suggestions regarding the reduction of the
sources of pollution. These are often focused on air quality and public health issues, which is one of
Chapel Hill’s main concerns for the downtown area. There are also several state-wide funding
programs that could provide funds for several of the flow improvement measures detailed previously.
Much of the state funding comes directly from the North Carolina Department of Transportation.
The final section regarding the absorption of existing pollutants has the potential to receive funding
from both private sources such as independent companies as well as from universities. These sources
of funding would likely be partnerships, displaying an advertisement or piece of art in some cases.
The importance of finding funding sources for the above-mentioned policy suggestions cannot be
stressed enough. Many municipalities have plans in existence to implement air quality improvement
measures, there is just a lack of funding. This section provides sources of funding as well as their
completion dates and areas of interest.
For the simplicity and clarity of the information presented, links to the information found on the
table are located in the References section on page 54 instead of directly in the table.
page 45
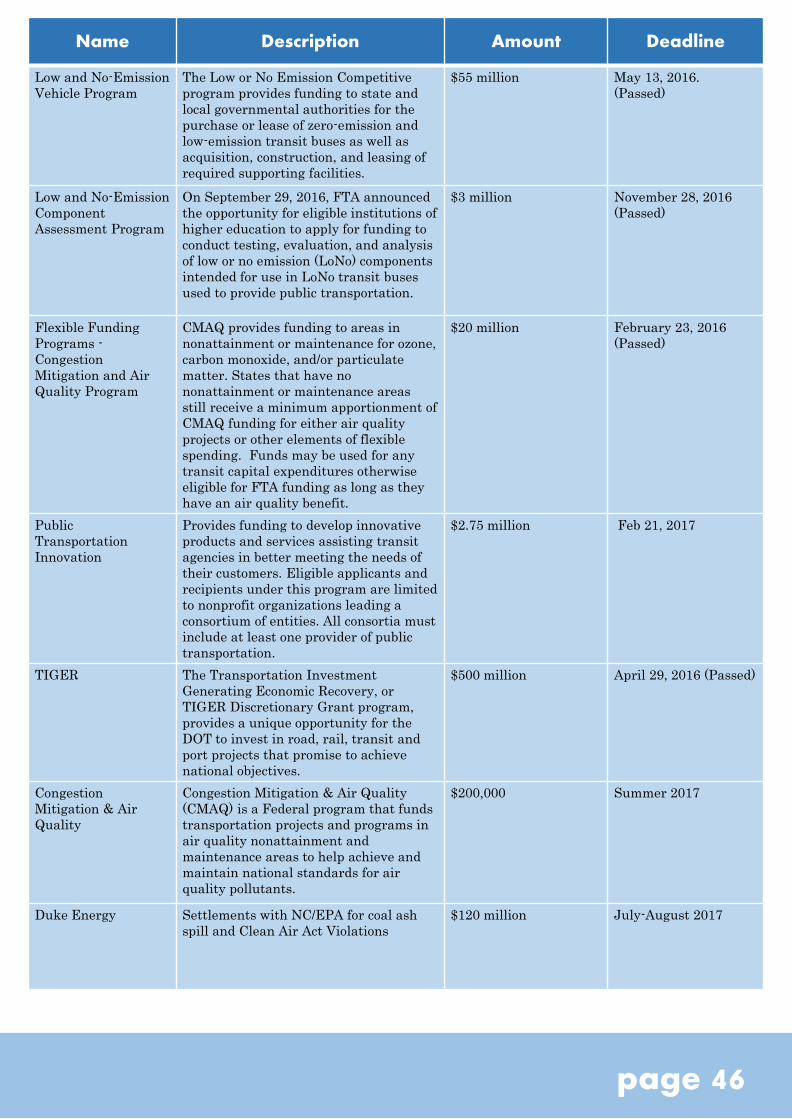
Name Description Amount Deadline
Low and No-Emission
Vehicle Program
The Low or No Emission Competitive
program provides funding to state and
local governmental authorities for the
purchase or lease of zero-emission and
low-emission transit buses as well as
acquisition, construction, and leasing of
required supporting facilities.
$55 million May 13, 2016.
(Passed)
Low and No-Emission
Component
Assessment Program
On September 29, 2016, FTA announced
the opportunity for eligible institutions of
higher education to apply for funding to
conduct testing, evaluation, and analysis
of low or no emission (LoNo) components
intended for use in LoNo transit buses
used to provide public transportation.
$3 million November 28, 2016
(Passed)
Flexible Funding
Programs -
Congestion
Mitigation and Air
Quality Program
CMAQ provides funding to areas in
nonattainment or maintenance for ozone,
carbon monoxide, and/or particulate
matter. States that have no
nonattainment or maintenance areas
still receive a minimum apportionment of
CMAQ funding for either air quality
projects or other elements of flexible
spending. Funds may be used for any
transit capital expenditures otherwise
eligible for FTA funding as long as they
have an air quality benefit.
$20 million February 23, 2016
(Passed)
Public
Transportation
Innovation
Provides funding to develop innovative
products and services assisting transit
agencies in better meeting the needs of
their customers. Eligible applicants and
recipients under this program are limited
to nonprofit organizations leading a
consortium of entities. All consortia must
include at least one provider of public
transportation.
$2.75 million Feb 21, 2017
TIGER The Transportation Investment
Generating Economic Recovery, or
TIGER Discretionary Grant program,
provides a unique opportunity for the
DOT to invest in road, rail, transit and
port projects that promise to achieve
national objectives.
$500 million April 29, 2016 (Passed)
Congestion
Mitigation & Air
Quality
Congestion Mitigation & Air Quality
(CMAQ) is a Federal program that funds
transportation projects and programs in
air quality nonattainment and
maintenance areas to help achieve and
maintain national standards for air
quality pollutants.
$200,000 Summer 2017
Duke Energy Settlements with NC/EPA for coal ash
spill and Clean Air Act Violations
$120 million July-August 2017
page 46

Name Description Amount Deadline
Safety Research and
Demonstration
Program
The Safety Research and Demonstration
(SRD) Program is part of a larger safety
research effort at the U.S. Department of
Transportation that provides technical
and financial support for transit agencies
to pursue innovative approaches to
eliminate or mitigate safety hazards. The
SRD program focuses on demonstration
of technologies and safer designs.
$7 million October 14, 2016
Community
Development Block
Grant Program,
Economic
Development
The Community Development Block
Grant, Economic Development Program
(CDBG ED) is administered by the North
Carolina Department of Commerce; it
provides grants to local governments for
public infrastructure development.
$45 million Unknown
North Carolina’s
Utility Account
Grants are awarded to local governments
for infrastructure improvements that are
publicly owned and maintained. The
applicant must demonstrate that the
project is expected to lead to job creation
in the near future.
The grant amount
depends on the number
of new, full-time jobs
created and cannot
exceed $10,000 per job
created or $500,000 per
project.
No deadline
(applications are
always accepted)
FASTLANE The Fixing America’s Surface
Transportation Act (FAST Act)
established the Nationally Significant
Freight and Highway Projects (NSFHP)
program to provide Federal financial
assistance to projects of national or
regional significance and authorized the
program at $4.5 billion for fiscal years
(FY) 2016 through 2020, including $850
million for FY 2017 to be awarded by the
Secretary of Transportation
$850,000 Dec 15, 2016
Coca-Cola The Coca-Cola Company partner with
governments, NGOs and other
organizations to support community
improvement in four main areas: water
stewardship, healthy and active
lifestyles, community recycling and
education
$76 million Rolling deadline
Pepsi Through our Global Citizenship
initiatives, PepsiCo supports programs
that:
encourage healthy lifestyles;
improve availability of affordable
nutrition;
expand access to clean water;
enhance sustainable agriculture
capability;
enable job readiness; and
empower women and girls.
$37 million No information online,
must approach
directly.
page 47
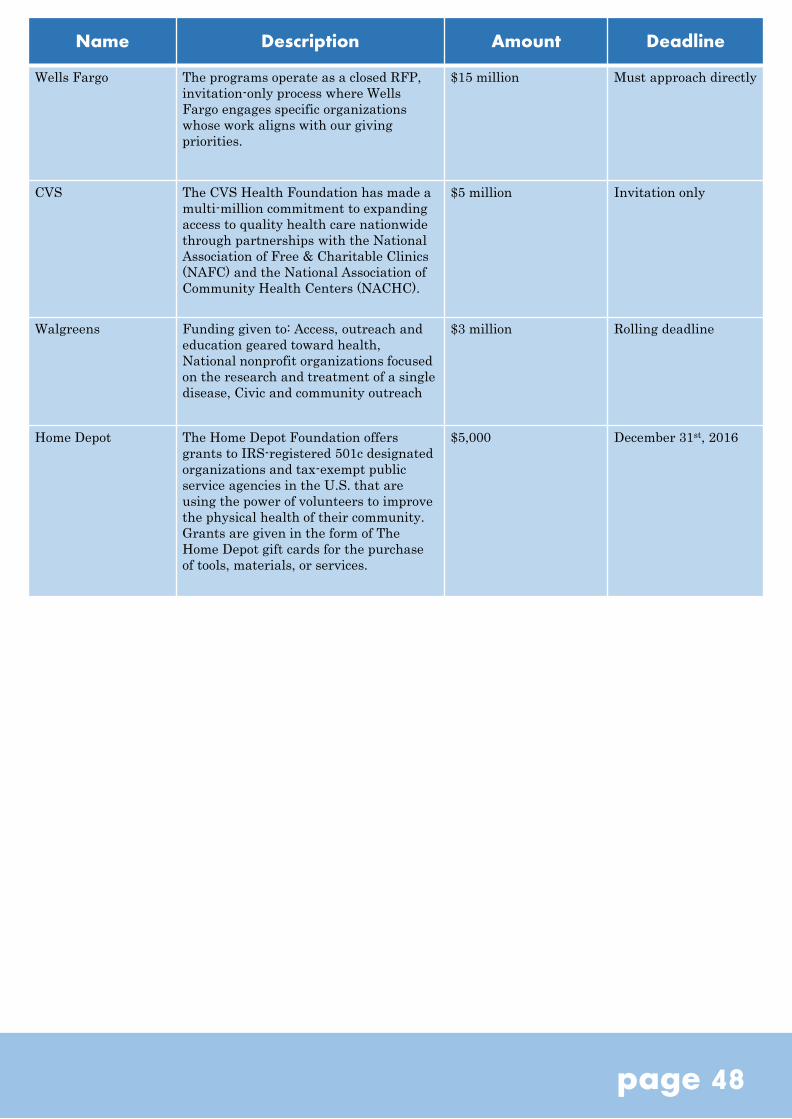
Name Description Amount Deadline
Wells Fargo The programs operate as a closed RFP,
invitation-only process where Wells
Fargo engages specific organizations
whose work aligns with our giving
priorities.
$15 million Must approach directly
CVS The CVS Health Foundation has made a
multi-million commitment to expanding
access to quality health care nationwide
through partnerships with the National
Association of Free & Charitable Clinics
(NAFC) and the National Association of
Community Health Centers (NACHC).
$5 million Invitation only
Walgreens Funding given to: Access, outreach and
education geared toward health,
National nonprofit organizations focused
on the research and treatment of a single
disease, Civic and community outreach
$3 million Rolling deadline
Home Depot The Home Depot Foundation offers
grants to IRS-registered 501c designated
organizations and tax-exempt public
service agencies in the U.S. that are
using the power of volunteers to improve
the physical health of their community.
Grants are given in the form of The
Home Depot gift cards for the purchase
of tools, materials, or services.
$5,000 December 31st, 2016
page 48
Appendix

ReferencesIntroduction
“Air Emission Sources.” EPA. Environmental Protection Agency, n.d. Web. 12 Dec. 2016. https://www3.epa.gov/cgi-
bin/broker?_service=data&_debug=0&_program=dataprog.state_1.sas&pol=PM25_PRI&stfips=37
“Air Quality Index Report.” EPA. Environmental Protection Agency, n.d. Web. 12 Dec. 2016. https://www.epa.gov/outdoor-air-
quality-data/air-quality-index-report
Health Impacts
Australia. Department of the Environment and Energy. Air Pollutants. N.p.: n.p., n.d. Print. "Vehicles, Air Pollution, and Human
Health." UCSUSA.org. Union of Concerned Scientists, n.d. Web.
Australia. Department of the Environment and Energy. Carbon Monoxide (CO). N.p.: n.p., 2005. Print.
Australia. Department of the Environment and Energy. Ground-level Ozone (O3). N.p.: n.p., 2005. Print.
Australia. Department of the Environment and Energy. Nitrogen Dioxide (NO2). N.p.: n.p., 2005. Print.
Australia. Department of the Environment and Energy. Particles. N.p.: n.p., 2005. Print.
Australia. Department of the Environment and Energy. Sulfur Dioxide (SO2). N.p.: n.p., 2005. Print.
Chan, C. C., K. J. Chuang, G. M. Shiao, L. Y. Lin. “Personal exposure to submicro-meter particles and heart rate variability in
human subjects.” Environmental Health Perspectives 112 (2004): 1063-1067. Web.
Chan, C. C., K. J. Chuang, L. C. Chien, W. J. Chen, and W. T. Chang. “Urban air pollution and emergency admissions for
cerebrovascular diseases in Taipei, Taiwan.” European Heart Journal 27 (2006): 1238-1244. Web.
Chuang, K. J., C. C. Chan, N. T. Chen, T. C. Su, L. Y. Lin. “Effects of particle size fractions on reducing heart rate variability in
cardiac and hypertensive patients.” Environmental Health Perspectives 113 (2005): 1693-1697. Web.
Health Effects of Particulate Matter. Copenhagen: World Health Organization, 2013.
Hwang, J. S., T. H. Hu, and C. C. Chan. "Air Pollution Mix and Emergency Room Visits for Respiratory and Cardiac Diseases in
Taipei." Journal of Data Science 2 (2004): 311-27. Web.
Kim, J. H., and R. Copes. Case Study: Health Effects of Traffic-related Air Pollution in a Small Community. Toronto: Queen’s
Printer for Ontario, Apr. 2015.
United States. U.S. Environmental Protection Agency. Office of Air Quality Planning and Standards (OAQPS). Air Quality Index
Report Chapel Hill. Raleigh: n.p., 2015. Print.
US Census Bureau. Profile of General Population and Housing Characteristics: 2010 Demographic Profile Data (Chapel Hill, NC).
2010. Raw data. N.p.
Zheng, Mei. Source Apportionment of PM2.5 in North Carolina. Georgia Institute of Technology: School of Earth and Atmospheric
Sciences. (2004).
Improving Traffic Flow
Barry, Keith. “The traffic lights of tomorrow will actively manage congestion.” CityLab, Sep. 11, 2014. Web.
http://www.citylab.com/commute/2014/09/the-traffic-lights-of-tomorrow-will-actively-manage-congestion/379950/
Damra. “Scalable Urban Traffic Control - SUCRAP.” SUCRAP. N.p., 01 May 2016. Web. 12 Dec. 2016.
http://sucrap.com/2016/05/01/scalable-urban-traffic-control/.
Doctor, Mark. “Top Ten Roundabout Myths and Misunderstandings.” Federal Highway Administration. PDF.
http://www.ltrc.lsu.edu/ltc_09/pdf/Doctor,%20Mark.pdf
Fabusuyi, Tayo, Robert Hampshire, and Victoria Hill. "Evaluation of a Smart Parking System." Transportation Research Record:
Journal of the Transportation Research Board (2013): 10-16. Web.
Frost, and Sullivan. "Strategic Analysis of Smart Parking Market in Europe and North America." Frost & Sullivan. N.p., 9 Apr.
2015. Web.
page 50
ReferencesGalligan, Sarah Delekta, and Annika Jensen-Lamka. "IBM and Streetline Address One of the Great Unsolved City Problems:
Parking." IBM. N.p., 28 Sept. 2011. Web.
INRIX On-Street Parking. Infographic. N.p.: INRIX, n.d. Web.
“Intersection Cost Comparison Spreadsheet User Manual.” Virginia Department of Transportation. PDF.
http://www.virginiadot.org/business/resources/2-Roundabout_Cost_Comparison_Tool_Manual_v2.5.pdf
“Intersection Safety.” Federal Highway Administration Office of Safety. Web.
http://safety.fhwa.dot.gov/intersection/innovative/roundabouts/case_studies/fhwasa09018/
Mustafa, S., A. Mohammed, and S. Vougias. Analysis of Pollutant emissions and Concentrations at Urban Intersections. Institute
of Transportation Engineers Compendium of Technical Papers. Institute of Transportation Engineers, 1993.)
“Next Generation Smart Traffic Signals.” Federal Highway Administration. PDF.
https://www.fhwa.dot.gov/advancedresearch/pubs/SmartTrafficSignal.pdf
“No Two Ways About It: One way streets are better than two-way.” Independence Institute, 2005. PDF.
https://www.i2i.org/articles/2-2005.pdf
Okonkwo and Gong. “SURTRAC Smart Traffic Light project report.” Department of Engineering and Public Policy, Carnegie
Mellon University. PDF. https://www.cmu.edu/epp/people/faculty/course-reports/SURTRAC%20Final%20Report.pdf
Parking Garage Data Guide. San Francisco: San Francisco Municipal Transportation Authority, 26 Sept. 2013.
“Roundabout Benefits.” Washington State Department of Transportation. Web.
http://www.wsdot.wa.gov/safety/roundabouts/benefits.htm
“Should Cities Convert One-way Streets to Two-way?” Thoreau Institute. Web. http://www.ti.org/vaupdate30.html
Shoup, Donald C.. The High Cost of Free Parking. Chicago: American Planning Association Planners, 2011. Print.
Spahr, Chris. “One way or two way streets more efficient?” State Smart Transportation Initiative, Feb. 11, 2013. Web.
http://www.ssti.us/2013/02/one-way-or-two-way-streets-more-efficient-it-depends-on-what-you-measure/
Traffic Signals.” Washington State Department of Transportation. Web. http://wsdot.wa.gov/Operations/Traffic/signals.htm
"The Specifics." SmartParking.com. Smart Parking Ltd, n.d. Web.
Varhelyi, Andras. “The effects of small roundabouts on emissions and fuel consumption.” Transportation Research Part D:
Transport and Environment, Volume 7, Issue 1, Jan. 2002, p. 65-71.
http://www.sciencedirect.com/science/article/pii/S1361920901000116
“Your Guide to Understanding Roundabouts.” North Carolina Department of Transportation, 2010. PDF.
https://www.ncdot.gov/projects/PoplarTentRoad/download/Roundabout_QA_Brochure.pdf
Reducing Sources of Pollution
“Alternative Fuel Implementation Tool Kit - Case Study on Electric Vehicles: City of Durham and Durham County, North
Carolina.” NC State University, Mar. 2014.
“Alternative Fuel Tool Kit - How To Implement: Electric Vehicles.” NC State University, May 2014.
“Alternatively Fueled Vehicles.” Charlottesville.org, City of Charlottesville Virginia.
"Apps – SFpark." Apps. SFpark, n.d. Web. 15 Dec. 2016. <http://sfpark.org/how-it-works/applications/>.
Atkinson, Chessa, Maura Baldiga, Torrey Beek, Patrick Boleman, Ginny Crothers, Catherine Stovers, and Jordan Williams. Idling
Gets You Nowhere: Turn off Your Engine. UNC Chapel Hill.: n.p., 2010.
Barkenbus, Jack N. Eco-driving: An overlooked climate change initiative. 2009. Climate Change Research Network, Vanderbilt
University
Ben-Akiva, Moshe, and Terry J. Atherton. "Methodology for Short-Range Travel Demand Predictions: Analysis of Carpooling
Incentives." Journal of Transport Economics and Policy 11.3 (1977): 224-61. JSTOR. Web.
page 51

ReferencesBolduc, Jean. "Carrboro to Explore Bike Sharing." The News & Observer. N.p., 18 May 2015. Web.
Brown, Emma. "Cash Incentives for Carpooling to Get a Trial Run in D.C. Area." The Washington Post. The Washington Post
Company, 8 July 2009. Web.
"Bull City Connector." Duke Parking and Transportation. Duke University, n.d. Web.
"Carpool." UNC - Transportation Parking. UNC Chapel Hill, n.d. Web.
“CAT Introduces Hybrid Buses to Charlottesville.” Charlottesville.org, City of Charlottesville Virginia. 18 Jan. 2011.
Chapel Hill Transit Facts and Figures. Chapel Hill: Town of Chapel Hill, n.d.
“City Receives $3.7M for Hybrid Buses, Transit Projects.” CBS 19 Newsplex.com, 5 Mar. 2010.
Electric Vehicle Charging Long Range Plan for the Greater Houston Area. N.p.: City of Houston, n.d.
Gauthier, Aimee, Colin Hughes, Christopher Kost, Shanshan Li, Clarisse Linke, Stephanie Lotshaw, Jacob Mason, Carlosfelipe
Pardo, Clara Rasore, Bradley Schroeder, and Xavier Treviño. The Bike-Share Planning Guide. New York: Institute
for Transportation and Development Policy, n.d.
Hamilton, Timothy L., and Casey J. Wichman. Bicycle Infrastructure and Traffic Congestion. Washington D.C.: Resources for the
Future, Aug. 2015.
Horton, W. Calvin. "Proposed Town of Chapel Hill Green Fleets Policy." Letter to Mayor and Town Council (Chapel Hill). 15 June
2005. Town of Chapel Hill. N.p., n.d. Web.
Kille, Leighton Walter. "Bikeshare Systems: Recent Research on Their Growth, Users' Demographics and Their Health and
Societal Impacts - Journalist's Resource." Journalists Resource. Harvard University’s Kennedy School of
Government, 6 May 2015. Web.
Kille, Leighton Walter. "Health Risks and Benefits of Urban Cycling Compared with Car Use - Journalist's Resource." Journalists
Resource. Harvard University’s Kennedy School of Government, 24 Aug. 2011. Web.
Kisner, Corinne. Integrating Bike Share Programs into a Sustainable Transportation System. Washington D.C.: National League
of Cities, 2011.
Power2Charlotte. Charlotte: City of Charlotte, n.d.
Ramfos, Nicholas. "Carpooling Incentives Program - Update?" Message to the author. 12 Oct. 2016. E-mail.
Rogers, Jonathan, Nicholas Ramfos, and Daivamani Sivasailam. National Capital Region Transportation Planning Board (TPB)
Commuter Connections Carpool Incentive Demonstration Project Study. Washington D.C.: Metropolitan
Washington Council of Governments, 27 Jan. 2009.
Ryan, Patrick H. “The Impact of an Anti-Idling Campaign on Outdoor Air Quality at Four Urban Schools”. Environmental Impact
Process Impacts. 16 July 2013. Web
"Scangauge E." Scangauge. Linear Logic, LLC, n.d. Web.
Snapshot of the Town of Chapel Hill. Chapel Hill: Town of Chapel Hill, Feb. 2012.
Specht, Paul A. "Raleigh Council Adopts Bike Sharing Program." The News & Observer. The News & Observer, 15 Mar. 2016.
Web.
The Chapel Hill Bike Plan. Chapel Hill: Town of Chapel Hill, 4 June 2014.
"The Proterra Catalyst 40-Foot Transit Vehicle." Proterra. N.p., n.d. Web.
Thoms, Paul, Layna Jansen, Devon Robinson, and Jessica Kidd. "CAT Making Switch to Hybrid Buses in Charlottesville."
Charlottesville Tomorrow. Charlottesville Tomorrow, 14 Jan. 2014. Web.
Tonachel, Luke. "Study: Electric Vehicles Can Dramatically Reduce Carbon Pollution from Transportation, and Improve Air
Quality." NRDC. National Resource Defense Council, 17 Sept. 2015. Web.
page 52

References"Town of Cary Awarded Grant to Test No-Idling Technologies in Fleet." Town of Cary. Town of Cary, n.d. Web.
Tweed, Katherine. "All-Electric School Bus Hits the Road." Green Tech Media. Green Tech Media, 4 Mar. 2014. Web.
United States. United States Environmental Protection Agency. Office of Transportation and Air Quality. Sample Calculation of
Emission Reductions and Fuel Savings from a Carpool Program. United States Environmental Protection Agency,
Sept. 2008. Web.
United States. US Department of Energy. In-Use Performance Comparison of Hybrid Electric, CNG, and Diesel Buses at New
York City Transit. National Renewable Energy Laboratory. By Robb A. Barnitt. N.p., 2008. Web.
United States. US Department of Energy. Office of Energy Efficiency and Renewable Energy. Challenges and Experiences with
Electric Propulsion Transit Buses in the United States. National Renewable Energy Laboratory. By Leslie Eudy
and Matthew Gifford. N.p., Nov. 2003. Web.
United States. US Department of Energy. Photovoltaic System Pricing Trends: Historical, Recent, and Near-Term Projections.
National Renewable Energy Laboratory. By David Feldman, Galen Barbose, Robert Margolis, Ted James,
Samantha Weaver, Naim Darghouth, Ran Fu, Carolyn Davidson, Sam Booth, and Ryan Wiser. N.p., 22 Sept. 2014.
Web.
United States. US Department of Transportation Federal Highway Administration. Office of Planning, Environment, & Realty
(HEP). Feasibility and Implications of Electric Vehicle (EV) Deployment and Infrastructure Development. N.p.:
n.p., n.d. Print.
United States. US Department of Transportation. Research, Demonstration, and Innovation. Analysis of Electric Drive
Technologies For Transit Applications: Battery-Electric, Hybrid-Electric, and Fuel Cells. Federal Transit
Administration. By Lisa Callaghan and Shella Lynch. US Department of Transportation, Aug. 2005. Web.
“Vanpool." UNC - Transportation Parking. UNC Chapel Hill, n.d. Web.
Vehicle Occupancy Rate. Fayetteville: Fayetteville Area Metropolitan Planning Association, 22 July 2015.
Watts, Richard, comp. Increasing Carpooling in Vermont: Opportunities and Obstacles. Rep. Transportation Research Center,
University of Vermont. University of Vermont, June 2010. Web.
Wengraf, Ivo. Easy on the Gas: The Effectiveness of Eco-Driving. 2012. RAC Foundation, London.
Absorbing Existing Pollution
Chen, Jiquan, et al. "Do Green Spaces Affect the Spatiotemporal Changes of PM2.5 in Nanjing?" Ecological Processes Ecol Process
5.1 (2016): n. pag. Web.
Meinhold, Bridgette. "North America's Largest Living Wall Installation by PNC." Inhabitat Green Design Innovation Architecture
Green Building. Inhabitat, 23 Sept. 2009. Web. 14 Dec. 2016.
United States of America. Department of Agriculture. Natural Resources Conservation Service. Ginkgo Species Plant Guide. N.p.:
National Plant Data Center, n.d. 1-2. Print.
Selmi, Wissal, et al. "Air Pollution Removal by Trees in Public Green Spaces in Strasbourg City, France." Urban Forestry & Urban
Greening 17 (2016): 192-201. Web.
Sherer, Paul M. The Benefits of Parks: Why America Needs More City Parks and Open Space.2003. The Trust for Public Land,
San Francisco.
State of North Carolina. Division of Forest Resources. Recommended Street Trees for North Carolina. North Carolina: Publisher
Not Identified, 1978. Print.
“Creating Mini-Parks for Increased Physical Activity”. Ashburn, VA: National Recreation and Parks Association, 2012. Print.
Stigsdotter, U. K., et al. "Health Promoting Outdoor Environments - Associations between Green Space, and Health, Health-
related Quality of Life and Stress Based on a Danish National Representative Survey." Scandinavian Journal of
Public Health 38.4 (2010): 411-17. Web.
Kozloff, Howard. "The Payoff from Parks." Urbanland. Urban Land Institute, 29 Aug. 2012. Web.
page 53

ReferencesGreen Roofs for Healthy Cities. 2015 Annual Green Wall Industry Survey. N.p.: Green Roofs for Healthy Cities, 2016. Print.
Feng, Haibo, and Kasun Hewage. "Lifecycle Assessment of Living Walls: Air Purification and Energy Performance." Journal of
Cleaner Production 69 (2014): 91-99. Web.
Sharp, Randy, Sable James, Flavia Bertram, Eva Mohan, and Steven Peck. Introduction to Green Walls. Publication. N.p.: Green
Roofs for Healthy Cities, 2008. 3-34. Print.
Pugh, Thomas A. M., A. Robert Mackenzie, J. Duncan Whyatt, and C. Nicholas Hewitt. "Effectiveness of Green Infrastructure for
Improvement of Air Quality in Urban Street Canyons." Environmental Science & Technology 46.14 (2012): 7692-699. Web.
"Green Walls Benefits - GRHC WEBSITE." GRHC WEBSITE. Green Roofs for Healthy Cities, n.d. Web. 30 Nov. 2016.
Mathew, Jaime, and Aromi Salot. Feasibility Study of Green Walls. Rep. CEE, University of Illinois. N.p.: n.p., n.d. 1-23. Print.
Project Finance
"Buses and Bus Facilities Grants Program - 5339." FTA. US DOT, n.d. Web. 15 Dec. 2016.
<https://www.transit.dot.gov/funding/grants/buses-and-bus-facilities-grants-program-5339>.
"Clean Fuels Grant Program (5308)." FTA. US DOT, n.d. Web. 15 Dec. 2016. <https://www.transit.dot.gov/funding/grants/clean-
fuels-grant-program-5308>.
"The Coca-Cola Foundation." The Coca-Cola Company. N.p., n.d. Web. 15 Dec. 2016. <http://www.coca-colacompany.com/our-
company/the-coca-cola-foundation>.
"Congestion Mitigation & Air Quality in North Carolina." CMAQ Project Website. NC DOT, n.d. Web. 15 Dec. 2016.
<https://connect.ncdot.gov/projects/planning/Pages/CongestionMitigationAirQualityNC.aspx>.
Downey, John. "Duke Energy Makes $300,000 Contribution for Solar in Schools as Part of EPA Settlement." Charlotte Business
Journal. N.p., 20 Sept. 2016. Web. 15 Dec. 2016. <http://www.bizjournals.com/charlotte/news/2016/09/20/duke-
energy-makes-300-000-contribution-for-solar.html>.
"Environmental Grant Programs." Wells Fargo. N.p., n.d. Web. 15 Dec. 2016. <https://www.wellsfargo.com/about/corporate-
responsibility/community-giving/environmental-grant-program/>.
"Flexible Funding Programs - Congestion Mitigation and Air Quality Program - 23 USC 149." FTA. US DOT, n.d. Web. 15 Dec.
2016. <https://www.transit.dot.gov/funding/grants/grant-programs/flexible-funding-programs-congestion-
mitigation-and-air-quality>.
Gates, Angela. "U.S. Department of Transportation Announces $55 Million in Grants To Put More Zero-Emission Buses Into
Service Across America." FTA. US DOT, n.d. Web. 15 Dec. 2016. <https://www.transit.dot.gov/about/news/us-
department-transportation-announces-55-million-grants-put-more-zero-emission-buses>.
"Giving Back." Walgreens. N.p., n.d. Web. 15 Dec. 2016. <https://www.walgreens.com/topic/sr/sr_giving_back_contribution.jsp>.
"Grant Programs." FTA. US DOT, n.d. Web. 15 Dec. 2016. <https://www.transit.dot.gov/funding/grants/grant-programs>.
"Grants for Buses and Bus Facilities Formula Program - 5339(a)." FTA. US DOT, n.d. Web. 15 Dec. 2016.
<https://www.transit.dot.gov/funding/grants/busprogram>.
"Innovations in Community Health Grants." CVS Health. N.p., n.d. Web. 15 Dec. 2016. <https://cvshealth.com/social-
responsibility/our-giving/foundation-giving/community-health-grants>.
"Low and No-Emission Component Assessment Program (LoNo-CAP)." FTA. US DOT, n.d. Web. 15 Dec. 2016.
<https://www.transit.dot.gov/funding/grants/low-and-no-emission-component-assessment-program-lono-cap>.
"Low or No Emission Vehicle Program - 5339(c)." FTA. US DOT, n.d. Web. 15 Dec. 2016.
<https://www.transit.dot.gov/funding/grants/low-or-no-emission-vehicle-program-5339c>.
Overton, Thomas. "Duke Fined $102.2 Million for Mishandling Coal Ash." POWER Magazine. N.p., 24 Feb. 2015. Web. 15 Dec.
2016. <http://www.powermag.com/duke-fined-102-2-million-for-mishandling-coal-ash/?printmode=1>.
page 54

ReferencesPatel, Sonal. "Duke Energy Agrees to Pay $6 Million for Dan River Coal Ash Spill." POWER Magazine. N.p., 29 Sept. 2016. Web.
15 Dec. 2016. <http://www.powermag.com/duke-energy-agrees-to-pay-6-million-for-dan-river-coal-ash-spill/>.
"Product Donation." The Home Depot Foundation. N.p., n.d. Web. 15 Dec. 2016.
<http://mail.homedepotfoundation.org/page/product-donation>.
"Public Transportation Innovation - 5312." FTA. US DOT, n.d. Web. 15 Dec. 2016.
<https://www.transit.dot.gov/funding/grants/public-transportation-innovation-5312>.
"Safety Research and Demonstration Program." FTA. US DOT, n.d. Web. 15 Dec. 2016. <https://www.transit.dot.gov/research-
innovation/safety-research-and-demonstration-program>.
"Strategic Grants." PepsiCo. N.p., n.d. Web. 15 Dec. 2016. <http://www.pepsico.com/Purpose/Global-Citizenship/Strategic-Grants>.
"TIGER (USDOT)." FTA. US DOT, n.d. Web. 15 Dec. 2016. <https://www.transit.dot.gov/funding/grants/tiger-usdot>.
2016 North Carolina Incentives. N.p.: De Gruyter, 2016. The Economic Development Partnership of North Carolina. Web.
<http://files.www.joednc.com/resources/incentives/Incentives_Brochure.pdf>.
page 55

Methodology: C-LINE
As a major part of analysis for the project, the web-based modeling tool C-LINE, developed by the UNC Institute for the
Environment with funding from the US EPA, was used to model concentrations of air pollution from roadways in
downtown Chapel Hill. C-LINE uses the Highway Performance Monitoring System (HPMS) road network by default, but
allows the user to upload their own network, as well. The HPMS roads in C-LINE were deemed inaccurate in their speed
and Average Annual Daily Traffic (AADT) values based on information gathered from the Town of Chapel Hill and from
personal experiences with driving through downtown in heavy traffic. ESRI’s ArcGIS software was utilized to construct a
grid of roads through downtown that are more representative of the Franklin Street corridor, export that information
from ArcMap to Excel, and finally import it into C-LINE.
Figure 1 Morning traffic in Chapel Hill The process began by opening ArcMap, loading a basemap of
streets, and zooming the layout to Franklin St. Then, using the
editor tool, line features were created for each segment of road
where it is believed speed would change, creating a network of
roads comprised of segments with different speeds that simulate
what driving through downtown is like in reality. Figure 1, a
screenshot of morning traffic in Chapel Hill from Google Maps,
illustrates the traffic environment. Thus, the closer a segment is to
a stoplight or intersection, the slower the speed becomes, ultimately
with 5 mph being the minimum speed attributed to any segment.
These segments were established for Franklin St., Rosemary St.,
Columbia St., Church St., Henderson St., Raleigh Rd, and Martin
Luther King Jr. Blvd. Once the features were created, the
Calculate Geometry tool allowed the generation of latitude and
longitude coordinates for the endpoints of each segment. This
provides C-LINE with the spatial reference it needs to ensure
accurate placement of the network on the map. The overall study
area can be seen in Figure 2.
Once the roads were imported to C-LINE, their attributes (speed,
AADT) were verified to be correct and the fleet mix on all road
segments was adjusted based on information from the Town.
Figure 3 illustrates the road editing interface of the tool. C-LINE
uses a default fleet mix for each county and road type but allows
Figure 2 C-LINE Study Area
the user to apply multipliers to adjust the fleet mix as needed. Using a spreadsheet and data representing C-LINE fleet mix
defaults, this study calculated the appropriate multipliers for all four vehicle types (gas cars, gas trucks, diesel cars, and
diesel trucks).
The first analysis was of the base case scenario for Chapel Hill, so C-LINE was run for the project’s custom road network
using the adjusted fleet mix for neutral Winter and convective Summer meteorological conditions to get baseline
concentrations for each season. In order to monitor changes in pollution made by various changes to the road network, three
page 56

points on the map were chosen to take PM2.5 concentration values
for each scenario run - in front of University Methodist church, the
bus stop at Columbia & Rosemary, and the playground behind
TRU deli.
Now that the base scenarios had been calculated, the AADT and
speed values of the road segments could be changed to simulate
the effects of this project’s flow improvement proposals:
roundabouts and one-way streets. For the roundabout scenarios,
speeds were made more even on the approach and slightly higher
through the intersection. This models the fact that roundabouts
reduce the number of cars stopping at intersections, as well as
reduces the delay per car through an intersection. AADT remained
the same for each road in each roundabout case, as it is not
Figure 3 C-LINE Road Editing Interface
expected to change. One roundabout scenario involved placing the roundabout at the intersection of Franklin St. and
Columbia St., and adjusting the speeds on those roads as such, while the other involved placing four mini roundabouts on
the flanks of the main intersection. These mini roundabouts are located on Franklin St. and Rosemary St. at their
intersections with Church St. and Henderson St.
The final scenario run was the one-way scenario, in which Franklin St. and Rosemary St. become a one-way couplet, with
Franklin St. flowing eastbound and Rosemary St. flowing westbound. Each was given a speed of 25 mph (with 15 at the
intersections) and the AADTs were summed together and then distributed 60%/40%, with Franklin St. retaining the
higher percentage due to more traffic heading east. This is representative of what this study believes will occur in this
case, as the one way streets will create more even, slightly faster speeds for almost the whole length of the line.
The last requirement for the study was to extract a rate from C-LINE so PM2.5 concentrations could be estimated given
any AADT and speed input. In order to do this, all the road features were removed from the map and created a single road
feature to extract the rate from. A point on the map was chosen for reference so the same location’s value would be selected
on each run, preventing outside influences from affecting the pollution value obtained. The effects of increasing AADT
were measured first, followed by speed, and finally adjusting the fleet mix.
C-LINE was first run with an AADT of 7,000, a speed of 20mph, and the base fleet mix, and then the AADT was increased
in steps of 1,000 up to a max of 12,000. The PM2.5 concentration from each run was collected and placed in a spreadsheet,
then a graph was created from the values. The slope of the line is the rate of change, which came to be an increase in PM2.5
of 0.1166 𝞵g (about 10%) per 1,000 increase in AADT. Similarly, C-LINE was tested with AADT increases in steps of 100,
from 10,000 to 10,500, and found PM2.5 increased at a rate of 0.0115 𝞵g (about 1%) per 100 increase in AADT. This is
comforting knowing that when the AADT change was decreased by a factor of 10, the PM concentration changed by a
factor of 10 as well. A rate was derived from increasing the speed in steps of 5 mph as well, though it was slightly different
since the relationship between speed and emissions is exponential. The largest drop is seen between the first three speeds:
5, 10, and 15 mph. From 5 to 10 mph, PM emissions drop 31% and from 10 to 15 mph, they drop 16%. From then on, with
each 5 mph increase, PM emissions drop at an average rate of about 13-14%.
page 57
Methodology: C-LINE

Deriving a rate from the fleet mix was a bit more tricky than simple AADT and speed adjustments. This project was
interested in modeling real-world situations, such as a mass replacement of gasoline cars with electric vehicles (EVs). It
also wanted to account for the situation in which the AADTs in Chapel Hill grow over the next few years as population
increases. In order to model the replacement of cars with EVs, it was decided to simply remove a certain number of cars
from the road. However since the AADT includes all vehicles, the number that were actually gasoline cars needed to be
separated out. Using the fleet mix ratio for Chapel Hill of 90.7% gas cars, the proportional number of cars were found from
total AADTs of 10,000-12,000 vehicles in intervals of 500. Next, the study was interested in what the new gas car AADT
would be if EVs were to replace 10%, 15%, 20%, 25%, and 50% of cars on the road, so each calculated AADT was multiplied
by each percent reduction, resulting in 25 new car AADT values. To apply this back to C-LINE, the difference between the
original and new gas car AADTs had to be subtracted from the total AADT. For example, if the car AADT changed from
9,000 to 8,000, the total AADT would need to decrease by 1,000. There are now 25 AADT values, each representing a
percent change in cars from a base AADT. Each of these 25 AADT values was plugged into C-LINE, and from them a PM
concentration value was obtained at the same location. From these, it was determined that with each 5% decrease in cars
on the road, PM decreases by 0.053 𝞵g (and with each 500 AADT increase, the rate increases by 0.003). At the same time,
each 500 AADT increase results in a 0.053 𝞵g increase in PM (and for each 5% decrease in cars, the rate decreases by
0.003).
page 58
Methodology: C-LINE

Recommended Species
Using the i-Tree Specie Selector tool (see Figure 1), The proper
location information for Chapel Hill in Orange County North
Carolina, USA was entered. Then all of the air pollution
benefits were given the highest ranking of 10. Air temperature
reduction, carbon storage, and stream flow reduction were
ranked with a number 9. The report produced was then saved
as a PDF.
Tree Street Survey
On October 13th, data was collected on every street tree on
Franklin Street from Crook’s Corner to Henderson Street.
Measuring tape was used to find the circumference at breast
height (approximately 4.5 feet off the ground) in inches of each
page 59
Methodology: i-Tree
Figure 3 i-Tree Interface
tree. Additional information of trees species and estimated percent crown missing were also collected. Diameter at breast
height in inches was later calculated from circumference. First, a new project was created in the Eco Tool by selecting a
complete inventory rather than a sample inventory in Project Configuration. The population in Chapel Hill was entered
as 59,635. The following specifications about the study area were made during Project Configuration: selecting urban
area and choosing the pollution and weather year to be the most recent available in i-Tree (they must be the same year).
The weather station that was closest to the study area on the map provided by i-Tree in the location tab of Project
Definition was chosen. Under the Data Collection Options Tab the following data types were selected; Species, DBH,
Land Use, Street Tree/Non Street Tree, Public/Private, and condition & percent dieback. This tool can be run with many
more data categories, however DBH and species are required. Then, in the Land Use tab Commercial was selected as the
land use category as that description best fit the specific section of Franklin Street studied. The data was uploaded as an
excel file into the Eco Tool that was formatted using the import button under the Data tab. Two tree species that
identified were not recognized by the software, and had to be changed to similar tree species. Pin oaks were then
entered as northern red oaks and sawtooth oaks as willow oaks (with the assumption that these species have similar LAI
or leaf area indices) . The data was then analyzed by the software for a few hours before returning a full report.
Future Projection for Franklin Street
To predict the effect of trees being planted in front of Carolina Square and in replacement of trees with poor condition
quality a separate project in the iTree Eco Tool was started. The same background information as previous selected was
specified in Project Configuration. In order to model the replacement of trees, the ones determined in the lowest
condition percent provided by the Eco tool were removed from the data set. Then a random number generator was used
to select the species from the list of seven recommended species to add to the excel file that was later uploaded to the

page 60
Methodology: i-Tree
project. All new trees were added with the media DBH of the existing tree population (12 inches). It was determined that
21 trees could be planted outside of Carolina Square when construction was completed and the same process indicated
early was used to add these trees to the data set. Instead of following this procedure, it is recommended that the town
look into the forecast tab in order to project the model into the future. Information as to the year when these trees could
be planted was unavailable (when Carolina Square construction will be complete), therefore this function of the Eco Tool
wasn’t used.
140 W Pocket Park Modeling
First, the Street Address of interest, for this situation 140 W Franklin Street, Chapel Hill, 27514, USA was entered in
the i-Tree Design tool. A polygon was drawn around a portion of the building which holds Crepe Traditions in order to
find out energy efficiency data and the most desirable places to plant the trees in the park. Using this icon on the top of
the map display screen, click on every corner of the building to draw the polygon and double-clicked to finish drawing.
Moving onto the second drop down menu on the left hand side labeled 2. Place Trees. The species “Ginkgo” and the
median tree diameter for Franklin street (12 inches) was entered along with “Excellent” tree condition and changing
“Tree exposure to sunlight” as necessary for its placement. 10 trees were placed as seen earlier in the report. Then move
on to 3. Estimate Benefits where 10 was entered for years in order to track tree growth and benefits. iTree then
produced a comprehensive report in which the value of the trees planted can be seen in reference to air quality, energy
efficiency of the building, carbon sequestration, and storm water retention.

In order to evaluate the benefits related to public health and the
economic feasibility of the potential policy recommendations, this
study applied a health and environmental assessment model
developed by the US EPA known as the Environmental Benefits
Mapping and Analysis Program — Community Edition (BenMAP-
CE). Figure 1 shows the mechanism of the BenMAP model
(Davidson)
A standard concentration-response function that relates changes
in air pollution exposure to health impacts by quantifying the
incidence of pollution-related adverse health events was a key
factor to determine variation in health impact:
where Δy is the change in the health events, y0 is the baseline
incidence rate for the health impact, the unitless coefficient
Methodology: BenMAP
Figure 1 BenMAP Mechanism
fraction beta (β) is a coefficient derived from the relative risk (RR) associated with a change in exposure, ΔPM is the
estimated change in PM exposure concentration, and POP is the exposed population (Ding et al). Since this study aimed to
evaluate health and economic benefit within a local area, Chapel Hill, all the inputs were specific to Orange County. In this
study, all-cause mortality was chosen as the health endpoint representing the health effect of policy recommendations.
Similarly, for the aforementioned concentration-response function, a beta value for all-cause mortality related to change in
PM2.5 concentration was chosen (Krewski). Table 1 on the next page describes all the data input in this study.
Mortality rates were collected from Center of Disease Controls and Protection for the year 2014. The baseline PM2.5
concentration was generated from US EPA air quality statistics. Both modeled decrease in PM2.5 from C-LINE and
estimated decreases from the literature were input as ΔPM. Since most of the impact on PM2.5 from policy evaluation was
available as a percentage, a percentage rollback was performed. Due to the fact that this study was performed on a very
small local scale, aggregation of results was not conducted. Mortality change as well as economic benefit were specified to
Orange County. In order to evaluate economic benefit brought by the change in mortality, a Unit Value of Statistical Life of
$5.5 million per death case, developed the US EPA, was applied (Dockins et al).
page 61
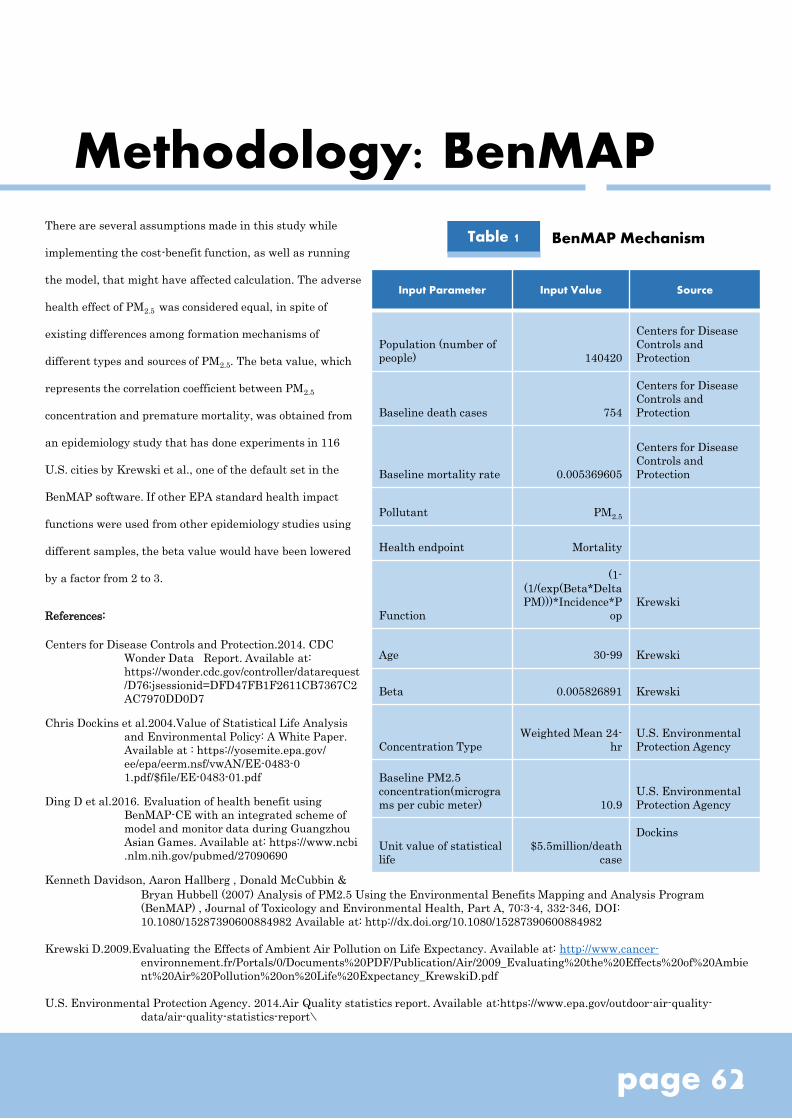
There are several assumptions made in this study while
implementing the cost-benefit function, as well as running
the model, that might have affected calculation. The adverse
health effect of PM2.5 was considered equal, in spite of
existing differences among formation mechanisms of
different types and sources of PM2.5. The beta value, which
represents the correlation coefficient between PM2.5
concentration and premature mortality, was obtained from
an epidemiology study that has done experiments in 116
U.S. cities by Krewski et al., one of the default set in the
BenMAP software. If other EPA standard health impact
functions were used from other epidemiology studies using
different samples, the beta value would have been lowered
by a factor from 2 to 3.
References:
Centers for Disease Controls and Protection.2014. CDC
Wonder Data Report. Available at:
https://wonder.cdc.gov/controller/datarequest
/D76;jsessionid=DFD47FB1F2611CB7367C2
AC7970DD0D7
Chris Dockins et al.2004.Value of Statistical Life Analysis
and Environmental Policy: A White Paper.
Available at : https://yosemite.epa.gov/
ee/epa/eerm.nsf/vwAN/EE-0483-0
1.pdf/$file/EE-0483-01.pdf
Ding D et al.2016. Evaluation of health benefit using
BenMAP-CE with an integrated scheme of
model and monitor data during Guangzhou
Asian Games. Available at: https://www.ncbi
.nlm.nih.gov/pubmed/27090690
Kenneth Davidson, Aaron Hallberg , Donald McCubbin &
Methodology: BenMAP
Table 1 BenMAP Mechanism
Input Parameter Input Value Source
Population (number of
people) 140420
Centers for Disease
Controls and
Protection
Baseline death cases 754
Centers for Disease
Controls and
Protection
Baseline mortality rate 0.005369605
Centers for Disease
Controls and
Protection
Pollutant PM2.5
Health endpoint Mortality
Function
(1-
(1/(exp(Beta*Delta
PM)))*Incidence*P
op
Krewski
Age 30-99 Krewski
Beta 0.005826891 Krewski
Concentration Type
Weighted Mean 24-
hr
U.S. Environmental
Protection Agency
Baseline PM2.5
concentration(microgra
ms per cubic meter) 10.9
U.S. Environmental
Protection Agency
Unit value of statistical
life
$5.5million/death
case
Dockins
Bryan Hubbell (2007) Analysis of PM2.5 Using the Environmental Benefits Mapping and Analysis Program
(BenMAP) , Journal of Toxicology and Environmental Health, Part A, 70:3-4, 332-346, DOI:
10.1080/15287390600884982 Available at: http://dx.doi.org/10.1080/15287390600884982
Krewski D.2009.Evaluating the Effects of Ambient Air Pollution on Life Expectancy. Available at: http://www.cancer-
environnement.fr/Portals/0/Documents%20PDF/Publication/Air/2009_Evaluating%20the%20Effects%20of%20Ambie
nt%20Air%20Pollution%20on%20Life%20Expectancy_KrewskiD.pdf
U.S. Environmental Protection Agency. 2014.Air Quality statistics report. Available at:https://www.epa.gov/outdoor-air-quality-
data/air-quality-statistics-report\
page 62