air pollution in cities ae 1999
DESCRIPTION
inventarisasi emisiTRANSCRIPT

Atmospheric Environment 33 (1999) 4029}4037
Air pollution in cities
Helmut Mayer
Meteorological Institute, University of Freiburg, D-79085 Freiburg, Germany
Abstract
Air quality in cities is the result of a complex interaction between natural and anthropogenic environmentalconditions. Air pollution in cities is a serious environmental problem } especially in the developing countries. The airpollution path of the urban atmosphere consists of emission and transmission of air pollutants resulting in the ambientair pollution. Each part of the path is in#uenced by di!erent factors. Emissions from motor tra$c are a very importantsource group throughout the world. During transmission, air pollutants are dispersed, diluted and subjected tophotochemical reactions. Ambient air pollution shows temporal and spatial variability. As an example of the temporalvariability of urban air pollutants caused by motor tra$c, typical average annual, weekly and diurnal cycles of NO, NO2,O
3and O
xare presented for an o$cial urban air-quality station in Stuttgart, southern Germany. They are supplemented
by weekly and diurnal cycles of selected percentile values of NO, NO2, and O3. Time series of these air pollutants giveinformation on their trends. Results are discussed with regard to air pollution conditions in other cities. Possibilities forthe assessment of air pollution in cities are shown. In addition, a qualitative overview of the air quality of the world'smegacities is given. ( 1999 Elsevier Science Ltd. All rights reserved.
Keywords: Emissions for urban air pollution; Cycles and trends of urban air pollutants; Assessment of air pollution
1. Introduction
Most cities world-wide su!er from serious air-qualityproblems, which have received increasing attention in thepast decade. A major probable reason for the air-qualityproblems is urban population growth, combined withchange in land use due to increasing urban areas. Theurban population growth is caused by (1) drift to thecities and (2) excess of births over deaths in the citiesthemselves } especially due to high birthrates in thedeveloping countries.
Mainly responsible for the migration to the cities isa deep structural change, especially in non-industrialisedcountries. This structural change is the consequence of (1)economic opening-up, (2) new trading partners, and (3)change of political conditions, e.g. democratisation.
Structural change takes a rapid course in some coun-tries, dubbed `tigersa. It is not surprising that the ex-pected urban population growth from 1992 until 2010 ismuch higher for Lagos, Bombay or Dhaka than forTokyo or New York (Table 1). Urban population growthhas many consequences. One of them is higher emissionof air pollutants. Even though for most air pollutants,
the emission rate per inhabitant is at present higher inindustrialised countries, the tendency is obvious that thisrate will in future be higher in the so-called developingcountries.
2. Air pollution path in the atmosphere
Emission of air pollutants is caused by di!erent an-thropogenic processes which can be categorised into thesource groups motor tra$c, industry, power plants,trade, and domestic fuel. In industrialised countries likeGermany, emissions of `classica air pollutants are de-creasing (Fig. 1). This trend is pronounced for carbonmonoxide (CO), sulphur dioxide (SO
2) and total
suspended particulate (TSP), and is weakly evident fornitrogen oxides (NO
x) and non-methane volatile organic
compounds (NMVOC). In Germany, emissions of COand NO
xcaused by motor tra$c amount to more than
half the total emissions of these pollutants, and NMVOCemissions of motor tra$c are just under half the totalemission of NMVOC.
Hence, it follows that motor vehicle tra$c seems to bethe most important source group for air pollution,
1352-2310/99/$ - see front matter ( 1999 Elsevier Science Ltd. All rights reserved.PII: S 1 3 5 2 - 2 3 1 0 ( 9 9 ) 0 0 1 4 4 - 2

Fig. 1. Emissions (all sources) of nitrogen oxides (NOx), sulphur dioxide (SO
2), carbon monoxide (CO), total suspended particulate
(TSP), and non-methane volatile organic compounds (NMVOC) in Germany from 1975 until 1996 (after UBA, 1998).
Table 1Estimated population (in millions) of selected megacities in 1992,projected population (in millions) in 2010, and projected popula-tion increase after UN, 1993
Megacity 1992 2010 2010}1992
Lagos 8.7 21.1 12.4Bombay 13.3 24.4 11.1Dhaka 7.4 17.6 10.2Delhi 8.0 15.6 7.6Jakarta 10.0 17.2 7.2Beijing 11.4 18.0 6.6Sao Paulo 19.2 25.0 5.8Teheran 7.0 11.9 4.9Cairo 9.0 13.4 4.4Tokyo 25.8 28.9 3.1Mexico City 15.3 18.0 2.7Los Angeles 11.9 13.9 2.0Rio de Janeiro 11.3 13.3 2.0Buenos Aires 11.8 13.7 1.9New York 16.2 17.2 1.0
especially in cities. The investigation by Mage et al.(1996) indicates that motor tra$c is a major source of airpollution in megacities (cities with a projected popula-tion of over 10 million by the year 2000). In half of them itis the single most important source. Since 1950, theglobal vehicle #eet has grown tenfold, and is estimated todouble again within the next 20}30 years. Much of the
expected growth in vehicle numbers is likely to occur indeveloping countries and in eastern Europe. As citiesexpand, more people will drive more vehicles over greaterdistances and for longer time. Emissions of air pollutantsby motor tra$c depends on di!erent factors such astra$c density, driving habits or ratio of automobiles totrucks (Fig. 2). In contrast to the trend in the indus-trialised countries of decreasing emissions of air pollu-tants, emissions are presently increasing in some cities ofnon-industrialised countries (UNEP/WHO, 1993).
Emitted air pollutants are dispersed and diluted in theatmosphere (Lyons and Scott, 1990). Chemical reactionsproducing, for example, photochemical ozone occurfrequently during this transmission process (Allowayand Ayres, 1993; Bloom"eld et al., 1996). Dispersion anddilution of air pollutants are strongly in#uenced by me-teorological conditions, especially by wind direction,wind speed, turbulence, and atmospheric stability. Topo-graphical siting and urban structures like street canyons,for example, have a great e!ect on these meteorologicalparameters. Chemical reactions also depend on ambientweather conditions because they are in#uenced by short-wave radiation, air temperature, and air humidity.
Along with chemical reactions, dispersion and dilutionprocesses result in ambient air pollution which showsconcentrations of di!erent substances varying with re-gard to time and space. Either measurements or model-ling may be used to quantify these processes. `Classica airpollutants like SO
2, NO, NO
2and ozone (O
3) are
4030 H. Mayer / Atmospheric Environment 33 (1999) 4029}4037

Fig. 2. Schematic illustration of the air pollution path in theatmosphere.
monitored routinely at most o$cial air-quality stations.`Speciala air pollutants like VOC, Pb, soot or othercarcinogenic compounds are usually measured only dur-ing particular investigations over a limited period. Mod-elling of air pollutants enables the illustration of theirspatial dispersion on di!erent urban scales (Williams etal., 1995), the forecasting of changes in air-quality condi-tions in#uenced by increasing built-up areas, new build-ings such as skyscrapers, or industrial plants, and theforecasting of peak NO
2or O
3concentrations (Ziomas et
al., 1995).The temporal variability of air pollutants can be gener-
ally characterised by time courses (annual, weekly, anddiurnal cycles) and by trends. The spatial variability ofair pollutants is pronounced if they are emitted or pro-duced near the ground level, i.e. especially for emissionsfrom motor tra$c. Hence it follows that the spatialvariability of air pollutants primarily caused by motortra$c is marked in cities, with their di!erent built-up andgreen spaces (Mayer and Haustein, 1994).
This paper gives some basic information on the tem-poral variability of NO, NO
2, and O
3which are typical
air pollutants from motor tra$c. The base is veri"ed
long-term air pollution data from the o$cial urban air-quality station `Stuttgart-Bad Cannstatta which isstrongly in#uenced by motor tra$c. Stuttgart is a big cityin southern Germany with about 500,000 residents.
3. Temporal variability of air pollutants
Fig. 3 presents the average annual cycles of NO, NO2,
O3
and Ox
at the station `Stuttgart-Bad Cannstatta inthe period 1981}1993. O
xis a measure of the O
3concen-
tration contained in an air mass. It is de"ned as the sumof NO
2and O
3and is more suitable for the assessment of
the photochemical O3
budget than O3
alone because ittakes account of reversible chemical processes (Guicherit,1988).
The annual cycle of the primary air pollutant NOshows the greatest values at the end of November andJanuary. The concentration of NO depends not only onemission, but also on weather conditions, which werevery stable at that time. The average annual cycle of NOhas the lowest values in summer (June and July) dueto favourable atmospheric air mass exchange. In contrastto NO, the annual cycle of NO
2shows only slight vari-
ation, because this secondary substance is producedmainly by chemical reactions. O
3is an air pollutant that
originates from di!erent sources (Heidorn and Yap, 1986).Ozone is partly produced in the lower troposphere by theaction of short-wave radiation on anthropogenically re-leased precursor substances. Therefore, the average an-nual cycle of O
3} as well as O
x} has the greatest values
in summer (July). The low O3and O
xminimum in June is
a consequence of local weather conditions with increasedcloudiness and less incoming short-wave radiation.
The diurnal cycles of NO and NO2
(Fig. 4) have theshape of a double wave which is more pronounced forNO than for NO
2. Due to the tra$c density, the NO
level is comparatively higher on weekdays than on week-ends. This e!ect can also be seen for the secondarysubstance NO
2. The average diurnal variations on week-
days are greater for NO than for NO2, because NO
2has
a longer lifespan than the more reactive NO. The NOconcentrations are noticeably higher in the morning thanin the evening. This is because, in the morning, therushhour is shorter and the atmosphere near the groundis more stable than in the evening. The low NO concen-trations in the early afternoon result mainly from thereduction of O
3by NO.
The diurnal cycles of O3
are typical for stations thatare strongly in#uenced by motor tra$c. They show a dis-tinct maximum in the afternoon caused by photochemi-cal O
3formation and a comparatively low secondary
maximum in the early morning which seems to be theresult of downward transport of O
3from higher level
containing more O3. The secondary O
3maximum
is more distinct the more the air quality station is
H. Mayer / Atmospheric Environment 33 (1999) 4029}4037 4031

Fig. 3. Average annual cycles of NO, NO2, O
3and O
xat the urban air-quality station `Stuttgart-Bad Cannstatta for the period
1981}1993.
Fig. 4. Average weekly and diurnal cycles of NO, NO2, O
3and O
xat the urban air-quality station `Stuttgart-Bad Cannstatta for the
period 1981}1993.
4032 H. Mayer / Atmospheric Environment 33 (1999) 4029}4037
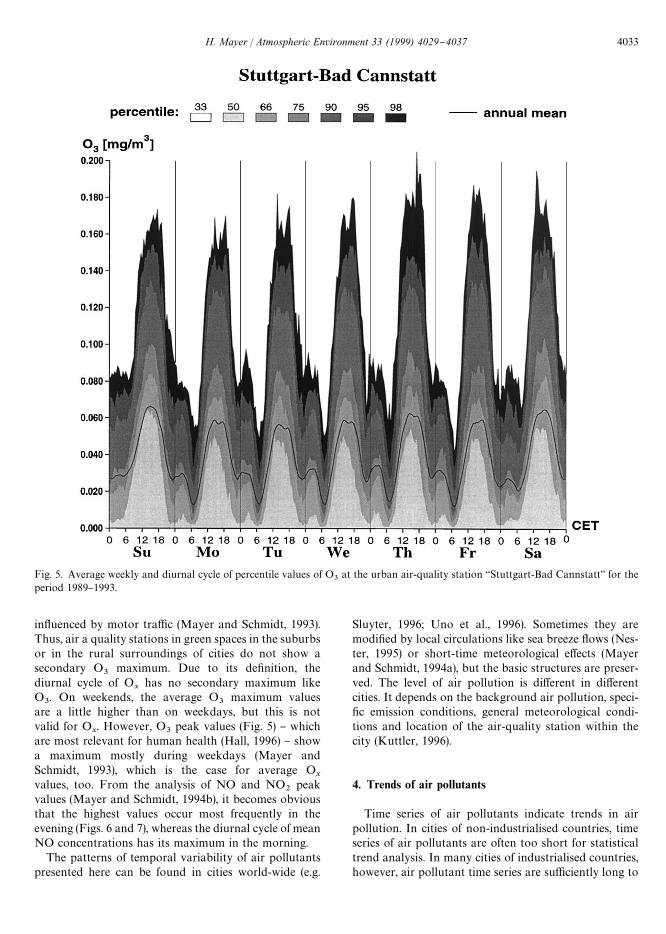
Fig. 5. Average weekly and diurnal cycle of percentile values of O3
at the urban air-quality station `Stuttgart-Bad Cannstatta for theperiod 1989}1993.
in#uenced by motor tra$c (Mayer and Schmidt, 1993).Thus, air a quality stations in green spaces in the suburbsor in the rural surroundings of cities do not show asecondary O
3maximum. Due to its de"nition, the
diurnal cycle of Ox
has no secondary maximum likeO
3. On weekends, the average O
3maximum values
are a little higher than on weekdays, but this is notvalid for O
x. However, O
3peak values (Fig. 5) } which
are most relevant for human health (Hall, 1996) } showa maximum mostly during weekdays (Mayer andSchmidt, 1993), which is the case for average O
xvalues, too. From the analysis of NO and NO
2peak
values (Mayer and Schmidt, 1994b), it becomes obviousthat the highest values occur most frequently in theevening (Figs. 6 and 7), whereas the diurnal cycle of meanNO concentrations has its maximum in the morning.
The patterns of temporal variability of air pollutantspresented here can be found in cities world-wide (e.g.
Sluyter, 1996; Uno et al., 1996). Sometimes they aremodi"ed by local circulations like sea breeze #ows (Nes-ter, 1995) or short-time meteorological e!ects (Mayerand Schmidt, 1994a), but the basic structures are preser-ved. The level of air pollution is di!erent in di!erentcities. It depends on the background air pollution, speci-"c emission conditions, general meteorological condi-tions and location of the air-quality station within thecity (Kuttler, 1996).
4. Trends of air pollutants
Time series of air pollutants indicate trends in airpollution. In cities of non-industrialised countries, timeseries of air pollutants are often too short for statisticaltrend analysis. In many cities of industrialised countries,however, air pollutant time series are su$ciently long to
H. Mayer / Atmospheric Environment 33 (1999) 4029}4037 4033

Fig. 6. Average weekly and diurnal cycle of percentile values of NO at the urban air-quality station `Stuttgart-Bad Cannstatta for theperiod 1989}1993.
permit trend analysis. As an example for a city in centralEurope, Fig. 8 contains average monthly concentrationsof NO, NO
2, O
3and O
xat the urban air-quality station
`Stuttgart-Bad Cannstatta.Trend analysis of these time series shows that NO and
NO2
concentrations were tending to decrease slightly at`Stuttgart-Bad Cannstatta, whereas for O
3and O
xno
statistically signi"cant trend could be determined } indic-ating that O
3concentrations did not change during the
investigation period. These results are typical of manycities in industrialised countries world-wide. Modi"ca-tions are possible, if only selected seasons, speci"c urbanstructures or speci"c emission conditions are analysed(Uno et al., 1996; Wakamatsu et al., 1966. For example,Bezuglaya (1996) reports that emissions and concentra-tions of CO and NO
2have risen by more than 10% in the
last ten years in selected cities in the Russian Federation,as a result of the increasing number of defective motorvehicles on urban motorways.
Seen on a global scale, there exist more and longer timeseries for SO
2, TSP and smoke than for air pollutants
that are typical of motor tra$c. They show varyingtrends depending on substance, country features, station,location and general meteorological exchange conditionsof the city (UNEP/WHO 1993).
5. Assessment of air pollution
Exposure to elevated concentrations of ambient airpollutants causes adverse human health e!ects. A criticalquestion in many urban environments is not whether theair in cities is unhealthy, but, given that air quality ispoor, how severely is health a!ected (Hall, 1996). Ans-wering this question is a di$cult task, because (1) as-sembling and analysing the air-quality data necessary forthis problem is to a large degree location-speci"c and (2)appropriate indexes for the assessment of the air-quality
4034 H. Mayer / Atmospheric Environment 33 (1999) 4029}4037

Fig. 7. Average weekly and diurnal cycle of percentile values of NO2
at the urban air-quality station `Stuttgart-Bad Cannstatta for theperiod 1989}1993.
component of the urban climate have yet to be developedand rigorously tested.
Nearly every country has standards to assess single airpollutants, e.g. EU-standards in Europe, NAAQS (Na-tional Ambient Air Quality Standards) in USA orWHO-AQGs (World Health Organization Air QualityGuidelines). But these standards are not su$cient, espe-cially for urban air quality management or urban plan-ning, because human beings in cities are exposed not toa single air pollutant alone, but to a mixture of di!erentsubstances. The problem is to develop an index based onair pollutants that are typical of di!erent emission sourcegroups and for which data are easily available, i.e. theymust be routinely recorded at o$cial air-quality stations.Meanwhile some indexes do exist for the assessment ofthe air pollution conditions in cities, e.g. Pollutant Stan-dards Index PSI in USA or air quality stress index (LBI)in Germany (Mayer, 1993, 1996). One major challenge in
the development of an integral assessment index for airpollution in cities is to make it su$ciently relevant inenvironmental medical terms. On the other hand, if thisindex is too complicated, it is nearly impossible to use itin di!erent applied questions, e.g. in urban planning. Thisproblem is currently under discussion with regard toLBI, which is an index for average and short-term airpollution loads and considers SO
2, NO
2and TSP, i.e. air
pollutants from o$cial air-quality stations, for whichdata are easily available.
The investigation on air pollution (SO2, suspended
particulate matter (SPM), lead (Pb), CO, NO2and O
3) in
megacities by Mage et al. (1996) shows that air pollutionis widespread across the megacities and is often mostsevere in cities in the developing countries. But even inothers, health norms are exceeded, although to a smallerdegree. Each of the 20 megacities has at least one majorair pollutant which occurs at levels that exceed WHO
H. Mayer / Atmospheric Environment 33 (1999) 4029}4037 4035

Fig. 8. Average monthly concentrations of NO, NO2, O
3and O
xat the urban air-quality station `Stuttgart-Bad Cannstatta for the
period 1981}1993.
health protection guidelines. Fourteen of these megaci-ties have two such pollutants and seven (Beijing, Cairo,Jakarta, Los Angeles, Mexico City, Moscow and SaoPaulo) have three or more. The major problem a!ectingmegacities as a group is their high level of SPM. Itpresents a very serious problem in 12 of the megacitiessurveyed by Mage et al. (1996), the majority of which arelocated in the Paci"c Basin. The concentrations of SPMin these cities are persistently above the WHO guidelinesby a factor as much as two or three.
6. Conclusions
Air quality in cities is getting worse as the population,tra$c, industrialisation and energy use increase. Urbanair pollutants show typical annual, weekly and diurnalcycles. Some air pollutants are present in high concentra-tions, often above WHO guidelines, especially in cities ofnon-industrialised countries. Available time series of airpollutants in cities are often too short, especially in non-industrialised countries, precluding meaningful statistical
4036 H. Mayer / Atmospheric Environment 33 (1999) 4029}4037

trend analysis of urban air pollutants. Where long-termtrends can be calculated, they are decreasing for most`classica air pollutants other than O
3, especially in indus-
trialised countries. Time series of O3show no statistically
signi"cant trend in most cities world-wide.From a review of trends in air quality in di!erent cities
made by Mage et al. (1996), it is quite evident that`history repeats itselfa. The experience of the currentmegacities in the developed countries is being repeated inthe developing countries. Before rapid industrial devel-opment takes place, air pollution arises mainly fromdomestic sources and light industry. Concentrations ofair pollutants are generally low and increase slowly aspopulation increases. As industrial development and en-ergy use grow, air pollution levels begin to rise rapidly.Then urban air pollution becomes a serious public healthconcern, and emission controls are introduced. Due tothe complexity of the situation, an immediate improve-ment in air quality cannot usually be achieved. At best,the situation is stabilised, and serious air pollution per-sists for some time.
Several megacities studied by Mage et al. (1996) arenow in the state where additional controls must be imple-mented without delay. Experience has shown that theintroduction of emission controls is followed by a stagedreduction of air pollution as controls take e!ect. Theearlier the integrated enforceable air-quality manage-ment plans are enacted, the lower the maximum pollu-tion levels that will occur. This is important for thosecities, especially in developing countries, that are not ofthe size and complexity of present-day megacities.
Air-quality management should, therefore, be imple-mented in those cities where strategic planning is weak ornon-existent, i.e. in half of all megacities. Due to theinsu$ciency of air-quality information in many cities ofthe world, there is an immediate world-wide need toimprove the monitoring and evaluation systems for ur-ban air pollution.
References
Alloway, B.J., Ayres, D.C., 1993. Chemical Principles of Environ-mental Pollution. Blackie Academic & Professional, London.
Bezuglaya, E.Y., 1996. Air quality in the Russian Federation.WMO Bulletin 45, 132}135.
Bloom"eld, P., Royle, J.A., Steiberg, L.J., Yang, Q., 1996. Ac-counting for meteorological e!ects in measuring urbanozone levels and trends. Atmospheric Environment 30,3067}3077.
Guicherit, R., 1988. Ozone on an urban and regional scale }withspecial reference to the situation in the Netherlands. In:
Isaksen, I.S.A. (Ed.), Tropospheric Ozone. Reidel Publ.Comp, Dordrecht, pp. 49}62.
Hall, J.V., 1996. Assessing health e!ects of air pollution. Atmo-spheric Environment 30, 743}746.
Heidorn, K.C., Yap, D., 1986. A synoptic climatology for surfaceozone concentrations in Southern Ontario, 1976}1981.Atmospheric Environment 20, 695}703.
Kuttler, W., 1996. Aspekte der Angewandten Stadtklimatologie.Geowissenschaften 14, 221}228.
Lyons, T.J., Scott, W.D., 1990. Principles of Air Pollution Met-eorology. Belhaven Press, London.
Mage, D., Ozolins, G., Peterson, P., Webster, A., Orthofer, R.,Vandeveerd, V., Gwynne, M., 1996. Urban air pollution inmegacities of the world. Atmospheric Environment 30,681}686.
Mayer, H., 1993. Urban bioclimatology. Experientia 49,957}963.
Mayer, H., 1996. Human-biometeorologische Probleme desStadtklimas. Geowissenschaften 14, 233}239.
Mayer, H., Haustein, Ch., 1994. Air pollution caused by motor-tra$c in urban spaces. Meteorol. Zeitschrift, N.F. 3,138}142.
Mayer, H., Schmidt, J., 1993. Analyse der Ozonkonzentrationenan Sonn-und Werktagen. Res. Rep., Meteorol. Inst. Univ.Freiburg.
Mayer, H., Schmidt, J., 1994a. Trendanalyse von Immissions-zeitreihen in Baden-WuK rttemberg und Bayern. Meteorol.Zeitschrift, N.F. 3, 116}121.
Mayer, H., Schmidt, J., 1994b. Methoden zur Regionalisierungder NO
2-Immissionsdaten. Res. Rep., Meteorol. Inst.
Univ. Freiburg.Nester, K., 1995. In#uence of sea breeze #ows on air pollution
over the Attica peninsula. Atmospheric Environment 29,3655}3670.
Sluyter, R., 1996. Overview of air pollution in European cities.WMO Bulletin 45, 123}128.
UBA, 1998. Umweltdaten Deutschland 1998. Umweltbun-desamt. Erich Schmidt Verlag, Berlin .
UN, 1993. World Urabanization Prospects. The 1992 Revision.United Nations.
UNEP/WHO, 1993. City air quality trends } Vol. 2. WHOPEP/93 26, UNE93 26P GEMS 93.A.2, Genf.
Uno, I., Ohara, T., Wakamatsu, S., 1996. Analysis of the winter-time NO
2pollution in the Tokyo Metropolitan area. At-
mospheric Environment 30, 703}713.Wakamatsu, S., Ohara, T., Uno, I., 1996. Recent trends in
precursor concentrations and oxidant distributions in theTokyo and Osaka areas. Atmospheric Environment 30,715}721.
Williams, M.D., Brown, M.J., Cruz, X., Sosa, G., Streit, G., 1995.Development and testing of meteorology and air disper-sion models for Mexico City. Atmospheric Environment29, 2929}2960.
Ziomas, I.C., Melas, D., Zerefos, Ch.S., Bais, A.F., 1995. Fore-casting peak pollutant levels from meteorological vari-ables. Atmospheric Environment 29, 3703}3711.
H. Mayer / Atmospheric Environment 33 (1999) 4029}4037 4037