air pollution knowledge, attitude and practice (kap
TRANSCRIPT


Air Pollution Knowledge, Attitude and Practice (KAP) Survey in Delhi-NCR
1
www.shan.org.in
Air Pollution Knowledge, Attitude and Practice (K.A.P.) Survey in Delhi-NCR
Copyright © 2020 Lung Care Foundation. All rights reserved.
This report may be circulated, reproduced, or distributed in any form by any organization with
due credit to Lung Care Foundation.
Publications of the Lung Care Foundation are available at www.LCF.org.in and www.shan.org.in.
An Initiative by Lung Care Foundation
Supported by Public Affairs Section, U.S. Embassy, New Delhi, India
Survey Partner Morsel Research and Development Pvt. Ltd.
CONTRIBUTORS AND PARTNERS
Lung Care Foundation:
Dr. Arvind Kumar, Mr. Rajiv Khurana, Mr. Abhishek Kumar, Ms. Matrushri Shetty, Dr. Mitali Raja,
Mr. Siddharth Balyan, Mr. Hamid Rehman, Ms. Judith Johnson, Ms. Neha Kashyap.
Public Affairs Section (Advisory Team), U.S. Embassy, New Delhi:
Mr. Conrad W. Turner, Ms. Mandeep Kaur
Morsel Research & Development (Survey Team):
Mr. Bhartendu Trivedi, Mr. Atulesh Shukla, Mr. Yashashvi Singh, Mr. Shailendra Kumar, Ms.
Farah Zehra, Ms. Noori Khan, Mr. Nitin Rathour, Ms. Anshu Agarwal, Mr. Vinay, Mr. Dharmendra,
Mr. Shashi, Ms. Gazala, Ms. Sahyogita, Ms. Anjali, Mr. Aadil, Mr. Kunal
Energy Policy Institute of University of Chicago, India (Advisory Team):
Mr. Vaibhav Chowdhary, Mr. Ashirbad Raha, Ms. Arshpreet Kalsi, Ms. Aishwarya Kumar.
Disclaimer: All reasonable steps and precautions have been taken by Lung Care Foundation to ensure
the correctness of the information contained in this publication. However, the published material is being
distributed without warranty of any kind, either expressed or implied. The responsibility for the interpretation
and use of the material lies with the reader. In no event shall the Lung Care Foundation be liable for any
damages arising from the interpretation of this report.

Air Pollution Knowledge, Attitude and Practice (KAP) Survey in Delhi-NCR
2
www.shan.org.in
PREFACE
ir pollution is increasing worldwide. According to IQAir's recent report, India ranks
5th among the world's top polluted countries. The cities with the highest pollution
include Delhi-NCR.
Researches have reported, with evidence, that air pollution leads to death and impairment
due to various diseases that affect the eyes, brain, lung, heart, skin, and kidneys.
Though many organizations are working to combat air pollution, there is still a lack of
awareness among people regarding air quality. Those who are aware, don't have an
attitude to practice air pollution control measures.
Air pollution continues to be a challenge in Delhi-NCR, affecting public health and
prosperity. To work towards improving air quality and health of residents of Delhi-NCR,
Lung Care Foundation has started work on a 2-year project, Project Saaf Hawa Aur
Naagrik (S.H.A.N) supported by the Public Affairs Section at the U.S. Embassy, New
Delhi.
As part of the project, to understand the current awareness on air quality-related issues
among residents of Delhi-NCR, Lung Care Foundation in collaboration with Morsel
Research and Development Pvt. Ltd. surveyed 1757 respondents across the Delhi-NCR
(Delhi, Ghaziabad, Noida, Gurgaon, Faridabad) region, especially in areas with
vulnerable populations including urban slums. We divided Delhi into seven regions as per
Delhi Parliamentary Constituencies. Eleven metro stations were selected from seven
constituencies and four metro stations, one each from Ghaziabad, Noida, Gurgaon, and
Faridabad. The selection criteria for the metro stations was that they were to be busy
metro stations. The data was collected within the 500 meters to 1km vicinity from all metro
stations, urban slums as well as from schools.
This survey has helped to obtain information on the extent of respondents' knowledge,
attitude, and practices about air pollution. Based on the findings, an attempt will be made
to sensitize the common citizen about air pollution and its harmful effects on health and
quality of life. This project will equip citizens with the information they need to understand
the problem and take reasonable steps to reduce it or minimize its effects, leading to a
better quality of health and life.
A

Air Pollution Knowledge, Attitude and Practice (KAP) Survey in Delhi-NCR
3
www.shan.org.in
About the Project SHAN
Project Saaf Hawa Aur Naagrik is an endeavor to sensitize the common man about air
pollution and its harmful effects on health and quality of life. By increasing awareness
among the citizens, we wish to improve their participation and engagement in
Government and citizen-driven initiatives to clean the air and thus positively impact their
health and wellbeing.
Through project SHAN, by using a multi-pronged communication strategy, we aim to
reach out to schools, colleges, RWAs, and urban slums in Delhi-NCR. We will be
sensitizing the local community through multi-lingual outreach material and in-person
workshops.
SHAN in Urdu signifies prestige and honor. This name will help add to the responsibility
of the target audience to work towards clean air with pride and commitment. While the
project attempts to create awareness about the need for Clean Air (Saaf Hawa), it is
essential to emphasize the need for active participation and the responsibility and
dedication of each citizen (Naagrik) to work towards clean air.
Lung Care Foundation (LCF) is a social impact trust working towards "Care & Cure of
2.6 Billion Lungs in India" by developing lung health services and programs and
advocating for clean air by highlighting the health ill-effects of Air Pollution, Dust, Smoking
and Poor Lifestyles. LCF has organized health camps for over 2000 individuals,
addressed 15000+ individuals in-person, reached millions of individuals through videos,
created a network of passionate Doctors across India advocating for Clean Air, and
created another network of B.E.S.T. School Clubs across India engaging thousands of
school students and families to achieve clean air and better lung health.
Public Affairs Section, US Embassy, New Delhi effectively communicate U.S. foreign policy priorities and engages the Indian public to enhance their understanding of and support for the values and policies of the United States. It also increases mutual understanding between the people of the United States and the people of India through educational and cultural exchange that assist in the development of peaceful relations.

Air Pollution Knowledge, Attitude and Practice (KAP) Survey in Delhi-NCR
4
www.shan.org.in
CONTENTS
1 PREFACE 2
2 KEY FINDINGS 5
BACKGROUND
Objectives
6
4 METHODOLOGY 9
Setting and plan of action 9
Survey duration 12
Respondents 13
Sample size 13
Training of surveyors 13
Data collection and analysis 13
On ground audit 13
Ethical consideration and confidentiality
13
5 RESULTS 15
Socio-demographic 15
Knowledge related 17
Attitude related 25
Practice related
39
6 DISCUSSION
47
7 CHALLENGES
49
8 CONCLUSION AND WAY FORWARD
49
9 REFERENCES 50

Air Pollution Knowledge, Attitude and Practice (KAP) Survey in Delhi-NCR
5
www.shan.org.in
KEY FINDINGS
Out of the 1757 Respondents Surveyed:
57.7% rated the air quality to be "Bad" or "Very Bad."
83.6% did not know about Air Quality Index or AQI.
92.2% were not aware of the difference between PM2.5 & PM10.
82.2% knew that air pollution has an impact on their health.
The most common organs affected by air pollution according to respondents were
Lungs 76.5%, Eyes 57.3%, Skin 18.7%, Heart 14.7%, Brain 9.2%, Kidney 7.1%,
Reproductive system 1.7%.
92.2% did not know the closest air quality monitor in their area.
77.3% did not check the air quality regularly.
63.2% discuss air pollution at home/with friends.
60.6% did not use masks to protect themselves from air pollution.
42.6% thought that air quality had worsened in their city over the last 3-4 year
78.7%
agreed to support the steps taken by the Government to reduce
air pollution even though the action might cause inconvenience.

Air Pollution Knowledge, Attitude and Practice (KAP) Survey in Delhi-NCR
6
www.shan.org.in
BACKGROUND
ir pollution consistently ranks among the top risk factors for death and disability
worldwide. In 2017, air pollution was the fifth-highest mortality risk factor
globally and was associated with about 4.9 million deaths and 147 million years
of healthy life lost.1
Air pollution accounts for 41% of global deaths from chronic obstructive pulmonary
disease (C.O.P.D.), 20% of deaths from type 2 diabetes, 19% of deaths from lung cancer,
16% of deaths from ischemic heart disease, and 11% of deaths from stroke. Air pollution
also contributes to communicable diseases (e.g., 35% of deaths from lower-respiratory
infection).1
Air pollution was the second leading risk factor as per Disability Adjusted Life Years
(D.A.L.Y.s) attributable to risk factors in India, 2016. This risk factor encompasses both
outdoor air pollution from a variety of sources as well as household air pollution that
mainly results from burning solid fuels in the home for cooking and heat. Outdoor air
pollution caused 6.4% of India's total D.A.L.Y.s in 2016, while household air pollution
caused 4.8%. 2
According to the Global Burden of Disease Study 2017 - Of the total 480·7 million
D.A.L.Y.s in India in 2017, 38·7 million or 8·1% were attributable to air pollution. Of the
total D.A.L.Y.s attributable to air pollution in India in 2017, the largest proportions were
from lower respiratory infections (29·3%), chronic obstructive pulmonary disease
(29·2%), and ischaemic heart disease (23·8%), followed by stroke (7·5%), diabetes
(6·9%), lung cancer (1·8%), and cataract (1·5%).3
A study funded by the World Bank Development Research Group was carried out in 1991-
1994 to study the effects of air pollution. During the study period, the average total
suspended particulate (T.S.P.) level in Delhi was approximately five-times the World
Health Organization's annual average standard. Furthermore, the total suspended
particulate levels in Delhi during this period exceeded the World Health Organization's
24-h standard on 97% of all days on which readings were taken.4
According to the World Air Quality Report by IQAir, 2019, based on Region & City
PM2.5 Ranking. Of the world's top 30 most polluted cities during 2019, 21 are located in
India. India (58.1 PM2.5 µg/m³) ranked fifth on the list of 98 countries in PM2.5
concentration behind Bangladesh and Pakistan. Delhi (98.6 PM2.5 µg/m³) is the top
polluted capital city in the world, with its annual PM2.5 level nearly ten times the WHO
target. Ghaziabad (110.2 PM2.5 µg/m³) topped the list of most polluted regional cities in
Central and South Asia while Delhi ranks 4th, Noida 5th, and Gurgaon ranks 6th. 5
A

Air Pollution Knowledge, Attitude and Practice (KAP) Survey in Delhi-NCR
7
www.shan.org.in
As per Comprehensive Study on Air Pollution and Green House Gases (GHGs) in Delhi
by I.I.T. Kanpur, the top four contributors to PM2.5 emissions are road dust (38 %),
vehicles (20 %), domestic fuel burning (12 %) and industrial point sources (11%). The top
four contributors to PM10 emissions are road dust (56%), concrete batching (10%),
industrial point sources (10%) and vehicles (9%).6
Figure 1: Emissions inventory – PM2.5 and NOx 6, 7
Air pollution is a major threat all over. There are studies and pieces of evidence on
knowledge attitudes and practices related to air pollution. This survey was conducted so
that we can get an insight into the awareness level of the respondents based on which
we can formulate the steps for preventive measures by adopting various methods,
including training, workshop, etc.
Despite efforts by government, private, not-for-profit, and educational entities to address
the problem of poor air quality and reduce its impact on health, the problem continues.
An informed populace is necessary for change; however, information regarding even the
most basic efforts, effects, and solutions often does not reach critical sectors of the
population. For information to filter to every section of the community, a well-structured
and coordinated public education campaign is essential. 8
This project will equip citizens with the information they need to understand the problem
and take reasonable steps to reduce it or minimize its effects, leading to a better quality
of health and life. This, in turn, will increase India's capacity to improve the health of its
population, including the most vulnerable.8

Air Pollution Knowledge, Attitude and Practice (KAP) Survey in Delhi-NCR
8
www.shan.org.in
OBJECTIVES
The objective of the survey was to gauge public awareness, perceptions/attitudes, and
practices towards air quality in Delhi-NCR. Further, based on the findings to develop a
comprehensive and innovative multi-pronged public education campaign to increase
knowledge about air pollution among the target groups, leading to greater engagement
by them in discussion related to air quality.
Morsel team conducting the survey
Morsel team conducting the survey

Air Pollution Knowledge, Attitude and Practice (KAP) Survey in Delhi-NCR
9
www.shan.org.in
METHODOLOGY
Setting and Plan of Action: Survey was conducted in and around metro stations, bus stops, urban slums, schools.
The data was collected within the 500 meters to 1km vicinity from all metro stations. 4
Delhi was divided into 7 zones as per Delhi Parliamentary Constituencies.
1
11 Busy metro stations were taken from 7 Parliamentary Constituencies. 2
4 Busy metro stations from Ghaziabad, Noida, Gurgaon, and Faridabad (One
from each).
3
The data was collected within the 500 meters to 1km vicinity from all metro stations. 4
Data from Seelampur (slum area), Samaypur Badli (slum area), Kirti Nagar (slum area) and area was also collected. 5
Data collection from 2 Schools.
6
1158 surveys were collected from Delhi while 599 surveys were conducted from Ghaziabad, Noida, Gurgaon, and Faridabad. 7
Total of 1757 surveys collected. 8

Air Pollution Knowledge, Attitude and Practice (KAP) Survey in Delhi-NCR
10
www.shan.org.in
Table 1: Delhi and N.C.R. metro stations and the corresponding areas where the
survey was conducted 9
AREA METRO STATIONS
Chandni Chowk Chandni Chowk + near Jama Masjid for Urdu speaking community
North East Delhi Seelampur + urban slum
East Delhi Laxmi Nagar
Okhla N.S.I.C.
New Delhi Rajiv Chowk
Kirti Nagar + few Punjabi speaking populations + urban slum
North West Delhi Mundka
Samaypur Badli + urban slum
West Delhi Janakpuri West + few Punjabi speaking populations
South Delhi Chhattarpur
Dwarka sector 21
Ghaziabad Mohan Nagar
Noida Botanical Garden
Gurgaon Huda City Centre
Faridabad Neelam Chowk Ajronda
Morsel team conducting the survey

Air Pollution Knowledge, Attitude and Practice (KAP) Survey in Delhi-NCR
11
www.shan.org.in
Figure 2: Delhi-NCR map 10

Air Pollution Knowledge, Attitude and Practice (KAP) Survey in Delhi-NCR
12
www.shan.org.in
Survey Duration
Around three months were taken to plan and conduct the survey.

Air Pollution Knowledge, Attitude and Practice (KAP) Survey in Delhi-NCR
13
www.shan.org.in
Respondents: We covered Students, youth, elderly, women, and men of all age groups
ranging from 12 years to 93 years from Delhi, Ghaziabad, Noida, Gurgaon, and
Faridabad.
Sample Size: 1828 respondents agreed to be part of the survey. Out of 1828, 71 did not
complete the survey. The data was finally collected from 1757 respondents
Training of Surveyors/Enumerators: Lung Care Foundation organized a full-day
training of the surveyors.
Data collection and analysis: Data collection was done using the English and Hindi
questionnaire on an app designed by Morsel Research and Development Pvt. Ltd.
The pilot testing of both the questionnaires was done to check the operational feasibility,
the questions were then modified and changes were incorporated as per the objectives
of the survey and understanding of the respondents. The corrected questionnaire was
then used to collect data. The data on Socio-demographic characteristics, Knowledge,
Attitude, and Practices related to air pollution was collected. Data was cleaned and
analysis was done using Microsoft Excel and S.T.A.T.A. 14.
Ethical consideration and Confidentiality:
During data collection, the details of the survey were explained to the respondents. They
were informed before giving consent for the survey. They were made aware of their rights
to refuse and withdraw from the survey during any part of the interview. Consent was
taken from respondents who were 18 years or above to conduct a survey as well as to
click photographs that were taken during the survey so that it can be used in the survey
report. In the case of school students, consent was taken from the Principal. All the
respondents were informed that the Lung Care foundation will use the data or results that
arise from this survey to create the report which will be shared in the public domain.
They were assured that the name of the respondent, name of the students, the name of
school responding to the questionnaire will not be used in the data analysis or final report
published as an outcome of the survey.

Air Pollution Knowledge, Attitude and Practice (KAP) Survey in Delhi-NCR
14
www.shan.org.in
Training of Surveyors by Lung Care Foundation’s Team
On ground Audit by Lung Care Foundation’s Team

Air Pollution Knowledge, Attitude and Practice (KAP) Survey in Delhi-NCR
15
www.shan.org.in
RESULTS
Socio-demographic characteristics.
1828 respondents agreed to be part of the survey. Out of 1828, 71 did not complete the
survey. The data was finally collected from 1757 respondents
Out of 1757 respondents who were surveyed, 1208 (68.8%) were males, and 549 (31.2%)
were female. 42.6%, 47%, and 10.4% belonged to the age groups of less than 25 years,
25 to 49 years, and greater than 49 years, respectively. The range of respondents' age
was from 12 to 93 years. The mean age of respondents was 29.97, while the mean age
of males was 30.51, and that of females was 28.77.
The most common language used by a participant in regular communication was Hindi
(92.1%), followed by Punjabi (2.7%), others (2.4%), Urdu (1.4%), and English (1.4%).
20.7% of respondents have never been to school or been for very little time. Maximum respondents 698 (39.7%) out of 1757 have acquired education between 9th to 12th. The question on the family's monthly income was optional. Based on the responses, more than half of the respondents (52.2%) had a monthly income of less than ₹25,000 while (36%) did not share the income.
749, 42.6%
825,47.0%
183, 10.4%
Age Group
< 25 years 25 - 49 years > 49 years
1208, 68.8%
549,31.2%
Gender
Male Female

Air Pollution Knowledge, Attitude and Practice (KAP) Survey in Delhi-NCR
16
www.shan.org.in
363, 20.7%
457,26.0%
698, 39.7%
23, 1.3%
171, 9.7%
42,2.4%
3,0.2%
Educational Status
Never Been To School Upto VIII
IX TO XII Diploma
Graduation Post Graduation
1618, 92.1%
25,1.4%
48, 2.7%
24, 1.4% 42,
2.4%
Languages Used For Communication
Hindi Urdu Punjabi
English Others
917, 52.2%
142,8.1%
24, 1.4%
24, 1.4%
17, 1.0%
633, 36.0%
Monthly Family Income
< 25,000 25,000 to 50,000
50001 to 75,000 75,001 to 1 lakh
> 1 Lakh Don't want to share

Air Pollution Knowledge, Attitude and Practice (KAP) Survey in Delhi-NCR
17
www.shan.org.in
How will you rate your city's air quality?
Very Good, 22, 1.3%
Good, 179, 10.2%
Fair, 467, 26.6%Bad, 636,
36.2%
Very Bad, 377,
21.5%
Not Sure, 76, 4.3%
Very Good Good Fair
Bad Very Bad Not Sure
More than half (57.7%) of the
respondents rated the air quality in
their city as bad (36.2%) or very bad
(21.5%).
105
3038
1018
300
41
42
35
49
413
43
40
77
63
29029
23 2312
0%
10%
20%
30%
40%
50%
60%
70%
80%
90%
100%
Delhi (1158) Noida (150) Gurgoan (150) Ghaziabad (150) Faridabad (149)
City Wise Response
Good Fair Bad Very Bad
Knowledge Related

Air Pollution Knowledge, Attitude and Practice (KAP) Survey in Delhi-NCR
18
www.shan.org.in
Are you aware of the Air Quality Index (AQI)?
170100 18
579725 165
0%
20%
40%
60%
80%
100%
< 25 years(749)
25-49 years(825)
> 49 years(183)
Age Wise Response
Yes No
Yes, 288, 16.4%
No, 1469, 83.6%
Overeall Response
Yes No
228 2613 11 10
930 124137 139 139
0%
10%
20%
30%
40%
50%
60%
70%
80%
90%
100%
Delhi(1158)
Noida(150)
Gurgoan(150)
Ghaziabad(150)
Faridabad(149)
City Wise Response
Yes No
226 62
982 487
0%
20%
40%
60%
80%
100%
Male (1208) Female (549)
Gender Wise Response
Yes No
Response Highlights:
• 83.6% of total respondents were unaware about AQI.
• 93% of respondents in Faridabad & Ghaziabad, 91% of respondents in Gurgaon,
83% of respondents in Noida and 80% of respondents in Delhi were unaware of AQI.
• 89% Females and 81% Males were unaware about AQI.
• 90% of respondents above 50 Years, 88% of respondents between 25 – 49 Years
and 77% of respondents less than 25 Years were unaware of AQI.

Air Pollution Knowledge, Attitude and Practice (KAP) Survey in Delhi-NCR
19
www.shan.org.in
How frequently do you check air quality?
64, 3.6%
66,3.8% 75,
4.3%
193,11.0%
1359, 77.3%
Overall Response
Daily WeeklyOften RarelyDon’t check
169 13 8 11 4
15410
14 7 8
835127 128 132 137
0%
10%
20%
30%
40%
50%
60%
70%
80%
90%
100%
Delhi(1158)
Noida(150)
Gurgoan(150)
Ghaziabad(150)
Faridabad(149)
City Wise Response
Daily, Weekly or Often Rarely Don't check
14054 11
135
49 9
474
722 163
0%
20%
40%
60%
80%
100%
< 25 years(749)
25-49 years(825)
> 49 years(183)
Age Wise Response
Daily, Weekly or Often Rarely Don't Check
138 67
136 57
934425
0%
20%
40%
60%
80%
100%
Male (1208) Female (549)
Gender Wise Response
Don't Check Rarely Daily, Weekly or Often
Response Highlights:
• 91.9% of respondents in Faridabad, 85.3% in Gurgaon, 84.6% in Noida, 88% in
Ghaziabad and 72.1% of respondents in Delhi did not check air quality.
• 77.4% Females and 77.3% Males did not check air quality.
• 89% of respondents above 50 Years, 87.5% of respondents between 25 – 49 Years
and 63.3% of respondents less than 25 Years didn’t check air quality.
Air Pollution Knowledge, Attitude and Practice (KAP) Survey in Delhi-NCR
20
www.shan.org.in
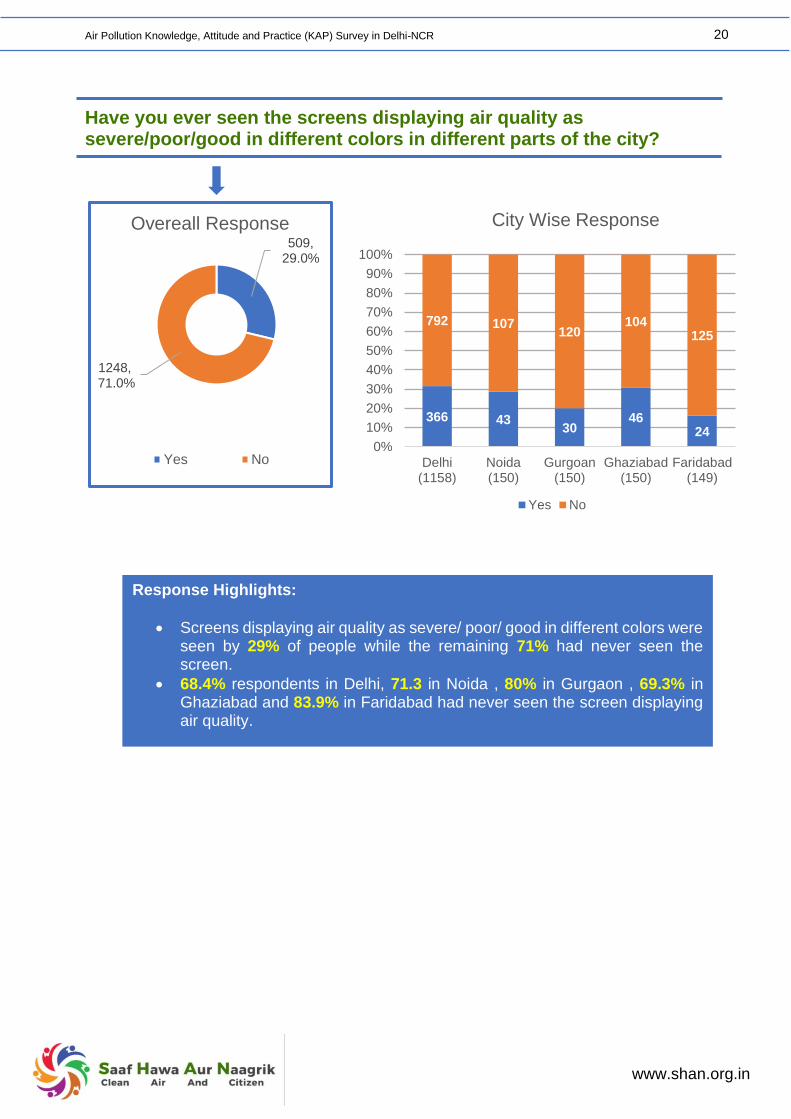
Have you ever seen the screens displaying air quality as severe/poor/good in different colors in different parts of the city?
509, 29.0%
1248,71.0%
Overeall Response
Yes No
Response Highlights:
• Screens displaying air quality as severe/ poor/ good in different colors were seen by 29% of people while the remaining 71% had never seen the screen.
• 68.4% respondents in Delhi, 71.3 in Noida , 80% in Gurgaon , 69.3% in Ghaziabad and 83.9% in Faridabad had never seen the screen displaying air quality.
366 4330
4624
792 107120
104125
0%
10%
20%
30%
40%
50%
60%
70%
80%
90%
100%
Delhi(1158)
Noida(150)
Gurgoan(150)
Ghaziabad(150)
Faridabad(149)
City Wise Response
Yes No

Air Pollution Knowledge, Attitude and Practice (KAP) Survey in Delhi-NCR
21
www.shan.org.in
Do you know the meaning of severe/ poor/good air quality?
If the AQI is red, what does that mean?
Around one-third of the respondents (32.7%) i.e. 575 knew the meaning of severe/ poor/good air quality. While 67.3% i.e. 1182 respondents were not aware of the meaning of severe/ poor/good air quality.
276 242 57
473 583 126
0%
20%
40%
60%
80%
100%
< 25 years(749)
25-49 years(825)
> 49 years(183)
Age Wise Response
Yes No
Yes, 575, 32.7%
No, 1182, 67.3%
Overeall Response
Yes No
411 5031
58
25
747 100119
92
124
0%
10%
20%
30%
40%
50%
60%
70%
80%
90%
100%
Delhi(1158)
Noida(150)
Gurgoan(150)
Ghaziabad(150)
Faridabad(149)
City Wise Response
Yes No
424 151
784 398
0%
20%
40%
60%
80%
100%
Male (1208) Female (549)
Gender Wise Response
Yes No
Out of 575 respondents who were aware of the meaning of severe/ poor/good air
quality, only 155 (27%) respondents gave the correct answer to the question as very
poor when AQI is red.

Air Pollution Knowledge, Attitude and Practice (KAP) Survey in Delhi-NCR
22
www.shan.org.in
Do you know the difference between PM2.5 and PM10?
82 49 6
667 776 177
0%
20%
40%
60%
80%
100%
< 25 years(749)
25-49 years(825)
> 49 years(183)
Age Wise Response
Yes No
Yes, 137, 7.8%
No, 1620, 92.2%
Overeall Response
Yes No
110 8 8 8 3
1048 142 142 142 146
0%
10%
20%
30%
40%
50%
60%
70%
80%
90%
100%
Delhi(1158)
Noida(150)
Gurgoan(150)
Ghaziabad(150)
Faridabad(149)
City Wise Response
Yes No
110 27
1098 522
0%
20%
40%
60%
80%
100%
Male (1208) Female (549)
Gender Wise Response
Yes No
Response Highlights:
• 92.2% of total respondents didn’t know the difference between PM2.5 and PM10.
• 98% of respondents in Faridabad, 95% of respondents in Gurgaon, Noida and
Ghaziabad and 91% of respondents in Delhi didn’t know the difference between PM2.5
and PM10.
• 95% Females and 91% Males didn’t know the difference between PM2.5 and PM10.
• 97% of respondents above 50 Years, 94% of respondents between 25 – 49 Years and
89% of respondents less than 25 Years didn’t know the difference between PM2.5 and
PM10.
• Out of 137 people who said they know the difference between PM2.5 and PM10, 21% said PM10 is harmful than PM2.5 and thus don’t have the right knowledge.
•
Air Pollution Knowledge, Attitude and Practice (KAP) Survey in Delhi-NCR
23
www.shan.org.in
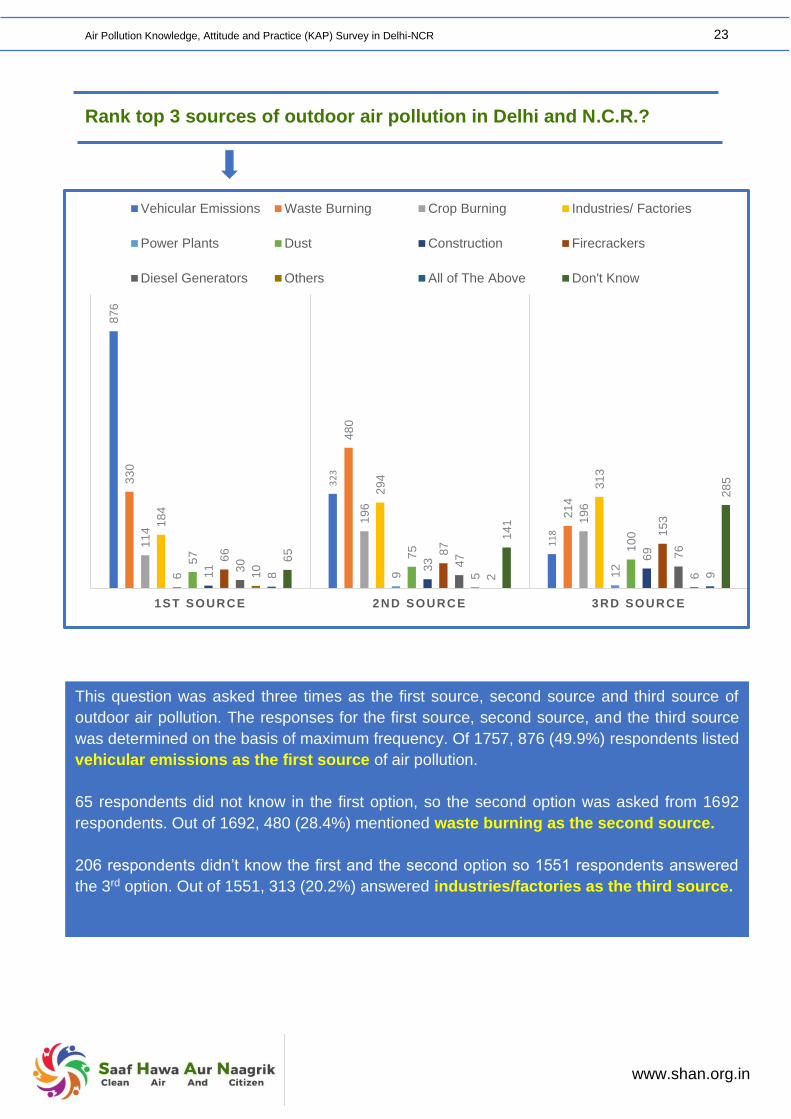
Rank top 3 sources of outdoor air pollution in Delhi and N.C.R.?
This question was asked three times as the first source, second source and third source of
outdoor air pollution. The responses for the first source, second source, and the third source
was determined on the basis of maximum frequency. Of 1757, 876 (49.9%) respondents listed
vehicular emissions as the first source of air pollution.
65 respondents did not know in the first option, so the second option was asked from 1692
respondents. Out of 1692, 480 (28.4%) mentioned waste burning as the second source.
206 respondents didn’t know the first and the second option so 1551 respondents answered
the 3rd option. Out of 1551, 313 (20.2%) answered industries/factories as the third source.
87
6
32
3
11
8
33
0
48
0
21
4
11
4
19
6
19
6
18
4
29
4
31
3
6 9 12
57 75 1
00
11 33 6
9
66 87
15
3
30 47 7
6
10
5 68 2 9
65
14
1
28
5
1ST SOURCE 2ND SOURCE 3RD SOURCE
Vehicular Emissions Waste Burning Crop Burning Industries/ Factories
Power Plants Dust Construction Firecrackers
Diesel Generators Others All of The Above Don't Know

Air Pollution Knowledge, Attitude and Practice (KAP) Survey in Delhi-NCR
24
www.shan.org.in
Does your or your family member's workplace give regular updates
about air pollution?
Have you or your family members had to miss work/school/ college
due to poor air quality in the last year?
Yes, 596, 33.9%
No, 1028, 58.5%
Not Sure, 133, 7.6%
Yes No Not Sure
This highlights that Air Pollution is regularly talked about at work. However as highlighted above, most respondents are unaware about AQI. Thus, it can be inferred that air pollution levels are not discussed at workplace.
228 2613 11 10
930 124137 139 139
0%
10%
20%
30%
40%
50%
60%
70%
80%
90%
100%
Delhi(1158)
Noida(150)
Gurgoan(150)
Ghaziabad(150)
Faridabad(149)
City Wise Response
Yes No
46.6% respondents said that they and their family members had missed work/school/ college due to poor air quality in the last one year while 53.4% respondents and their family members never missed their work or school or college.
Yes, 818, 46.6%
No, 939, 53.4%
Overeall Response
Yes No

Air Pollution Knowledge, Attitude and Practice (KAP) Survey in Delhi-NCR
25
www.shan.org.in
Do you think air pollution has an impact on your health?
1445, 82.2%
248,14.1%
64,3.6%
Overeall Response
Yes No Not Sure
Majority of the respondents (82.2%) i.e. 1445 respondents mentioned that air pollution has an impact on their health. Out of 1445, 473 (32.7%) were females and 972 (67.3%) were males.
972 473
181 6755 9
0%
20%
40%
60%
80%
100%
Male (1208) Female (549)
Gender Wise Response
Yes No Not Sure
619 669 157
98 129 2132 27 5
0%
20%
40%
60%
80%
100%
< 25 years(749)
25-49 years(825)
> 49 years(183)
Age Wise Response
Yes No Not Sure
961124
111126 123
147 2332
23 23
50 3 7 1 3
0%
10%
20%
30%
40%
50%
60%
70%
80%
90%
100%
Delhi(1158)
Noida(150)
Gurgoan(150)
Ghaziabad(150)
Faridabad(149)
City Wise Response
Yes No Not Sure

Air Pollution Knowledge, Attitude and Practice (KAP) Survey in Delhi-NCR
26
www.shan.org.in
Which organs do you think are affected by air pollution? (Multiple
choices)
1344
1007
328258
161 12529 7
133
0
200
400
600
800
1000
1200
1400
1600

Air Pollution Knowledge, Attitude and Practice (KAP) Survey in Delhi-NCR
27
www.shan.org.in
Has your doctor ever talked to you regarding air pollution?
Have you or any of your relatives visited the hospital due to respiratory
discomfort (asthma/ cough) in the last one year?
394, 22.4%
1042,59.3%
321,18.3%
Overeall Response
Yes No Not visited a Doctor recently
Only 394 respondents (22.4%) told that their doctor has talked to them regarding air pollution while 1,042 (59.3%) respondents said that their doctor never talked to them regarding air pollution and 321 (18.3%) respondents had not visited any doctor recently.
681, 38.8%
1011,57.5%
65,3.7%
Overeall Response
Yes No Not Sure
38.8% of respondents have visited the hospital due to respiratory discomfort in the last one year.

Air Pollution Knowledge, Attitude and Practice (KAP) Survey in Delhi-NCR
28
www.shan.org.in
Have you/your relatives ever been diagnosed with a disease due to air
pollution?
Do you know of any program or initiative undertaken by the local
Government to tackle air pollution in your city?
1301, 74.0%
425,24.2%
31,1.8%
Overeall Response
No Yes Not Applicable
Around three-fourth of the respondents i.e. 1301 (74%) or their relatives were never diagnosed with a disease due to air pollution. Around 24.2% i.e. 425 respondents or their relatives were diagnosed with a disease due to air pollution.
385, 21.9%
1372,78.1%
Overeall Response
Yes No
When asked about the Local Government’s initiatives undertaken to reduce air pollution, more than three-fourth of the respondents (78.1%) were not aware of it. Only 385 (21.9%) respondents were aware of the initiatives.

Air Pollution Knowledge, Attitude and Practice (KAP) Survey in Delhi-NCR
29
www.shan.org.in
Are you aware of the health warning being given by the State or Central
Government in winter when air pollution increases?
Are you aware of any public health emergencies issued by the
Government of Delhi on account of extremely poor air quality in the last
two years?
910, 51.8%
847,48.2%
Overeall Response
Yes No
According to the survey more than half of the respondents 51.8% i.e. 910 respondents were aware of the health warning being given by the State or Central Government in winter when air pollution increases.
552, 31.4%
1205,68.6%
Overeall Response
Yes No
Only 552 (31.4%) respondents were aware of any public health emergencies issued by the Government of Delhi on account of extremely poor air quality in the last two years while 1205 (68.6%) were unaware of any public health emergencies.

Air Pollution Knowledge, Attitude and Practice (KAP) Survey in Delhi-NCR
30
www.shan.org.in
Are you aware of the National Clean Air Programme?
Morsel team conducting the survey
370, 21.1%
1387,78.9%
Overeall Response
Yes No
Many people 1387 (78.9%) had no
idea about the National Clean Air
Programme. Very few respondents
370 (21.1%) knew about the National
Clean Air Programme.

Air Pollution Knowledge, Attitude and Practice (KAP) Survey in Delhi-NCR
31
www.shan.org.in
How polluted do you think is the area where you stay when compared
to the rest of Delhi-NCR?
Attitude Related
572, 32.6%786,
44.7%
269, 15.3%
130, 7.4%
Overeall Response
More polluted
Less polluted
377 41 4163
50
488 81 7966
72
20522
1613
13
88 6 14 8 14
0%
10%
20%
30%
40%
50%
60%
70%
80%
90%
100%
Delhi(1158)
Noida(150)
Gurgoan(150)
Ghaziabad(150)
Faridabad(149)
City Wise Response
More Polluted Less Polluted
Equally Polluted Don't Know
5549 83
49 76
17
48
62
105139
3354
52
43
26
59 63
1717
19
48 20 40
1 312
4
0%
10%
20%
30%
40%
50%
60%
70%
80%
90%
100%
ChandniChowk(151)
EastDelhi(233)
NewDelhi(325)
NorthEastDelhi(100)
NorthWestDelhi(150)
SouthDelhi(100)
WestDelhi (99)
Area Wise Response - Delhi
More Polluted Less Polluted
Equally Polluted Don't Know
Around 50% population in North
East Delhi, North West Delhi and
West Delhi think that the area
where they reside is more
polluted than rest of the areas in
Delhi

Air Pollution Knowledge, Attitude and Practice (KAP) Survey in Delhi-NCR
32
www.shan.org.in
How would you rank the air pollution level in the following quarters?
Who should be most responsible for reducing air pollution in your city?
91 221 36260
935 799
772
300
514454 298
1273
217 283 325124
0%
10%
20%
30%
40%
50%
60%
70%
80%
90%
100%
Jan - March April- June July -September
October -December
Overall Response
No Pollution Moderate Pollution
High Pollution Not sure
Majority of the respondents
72.4% ranked high pollution in
October-December quarter.
53.2% of the respondents
ranked January-March as a
moderate pollution quarter.
332, 18.9%
412,23.4%
149,8.5%
704, 40.1%
26, 1.5%
134, 7.6%
Overeall Response
Central Government State Government
Municipal Corporation Citizens
Industries Don’t know
40.1% of the respondents
mentioned that the citizens should
be responsible for reducing air
pollution followed by State
Government 23.4% and Central
Government 18.9%.

Air Pollution Knowledge, Attitude and Practice (KAP) Survey in Delhi-NCR
33
www.shan.org.in
Do you think that exposure to a high level of air pollution can reduce
your life?
1327, 75.5%247,
14.1%
183,10.4%
Overeall Response
Yes No Not Sure
75.5% of the respondents were aware that exposure to a high level of air pollution could reduce their life. 63.2% of females and 81.1% of males and were aware that exposure to a high level of air pollution could reduce their life.
980
347
123
124
10578
0%
10%
20%
30%
40%
50%
60%
70%
80%
90%
100%
Male (1208) Female (549)
Gender Wise Response
Yes No Not Sure
532655 140
127100 20
90 70 23
0%
20%
40%
60%
80%
100%
< 25 years(749)
25-49 years(825)
> 49 years(183)
Age Wise Response
Yes No Not Sure

Air Pollution Knowledge, Attitude and Practice (KAP) Survey in Delhi-NCR
34
www.shan.org.in
Do you talk about air pollution at home/with friends?
1111, 63.2%
646,36.8%
Overeall Response
Yes No
738 373
470 176
0%
20%
40%
60%
80%
100%
Male (1208) Female (549)
Gender Wise Response
Yes No
511 498 102
238 327 81
0%
20%
40%
60%
80%
100%
< 25 years(749)
25-49 years(825)
> 49 years(183)
Age Wise Response
Yes No
749 9681
9887
409 54 69 5272
0%
20%
40%
60%
80%
100%
Delhi(1158)
Noida(150)
Gurgoan(150)
Ghaziabad(150)
Faridabad(149)
City Wise Response
Yes No
63.2% of respondents talked about air pollution at home while 36.8% of respondents did
not talk about it.

Air Pollution Knowledge, Attitude and Practice (KAP) Survey in Delhi-NCR
35
www.shan.org.in
What are your thoughts on the change in air quality in your city over
the last 3-4 years?
What can be done to industries that cause a lot of air pollution?
490, 27.9%
749,42.6%
411,23.4%
107, 6.1%
Overeall Response
Air quality has improved
Air quality has worsened
No change
Don’t know
42.6% of the respondents thought that
air quality has worsened. Though 27.9%
respondents claimed that air quality had
improved.
303, 17.2%
233,13.3%
295,16.8%
204, 11.6%
649, 36.9%
73, 4.2%
Overeall Response
Educate them
Counsel them
Warn them
Fine them
Take strict action against them
Leave them
Majority of the population (36.9%) were
in favour of taking strict action against
the industries that cause a lot of air
pollution followed by educating them
(17.2%), warning them (16.8%), counsel
them (13.3%), fine them (11.6%) and
leave them (4.2%).
.

Air Pollution Knowledge, Attitude and Practice (KAP) Survey in Delhi-NCR
36
www.shan.org.in
Do you think air pollution affects you financially?
1120, 63.7%
446,25.4%
191,10.9%
Overeall Response
Yes No Can't Say
63.7% of the respondents thought
that they get financially affected by
air pollution.
56.8% of females and 66.9% of
males thought they get financially
affected by air pollution.
808312
290
156
11081
0%
10%
20%
30%
40%
50%
60%
70%
80%
90%
100%
Male (1208) Female (549)
Gender Wise Response
Yes No Can't Say
387
598 135
224
178 44138
49 4
0%
10%
20%
30%
40%
50%
60%
70%
80%
90%
100%
< 25 years(749)
25-49 years(825)
> 49 years(183)
Age Wise Response
Yes No Can't Say
Air Pollution Knowledge, Attitude and Practice (KAP) Survey in Delhi-NCR
37
www.shan.org.in
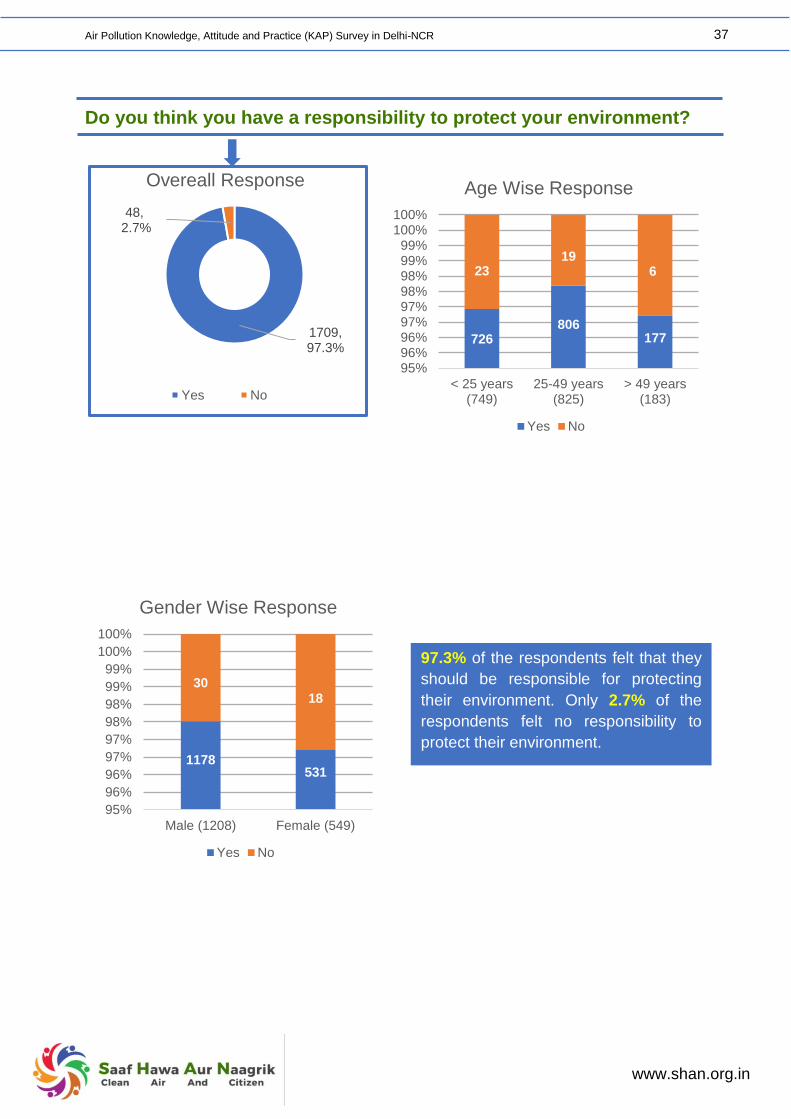
Do you think you have a responsibility to protect your environment?
1709, 97.3%
48,2.7%
Overeall Response
Yes No
97.3% of the respondents felt that they
should be responsible for protecting
their environment. Only 2.7% of the
respondents felt no responsibility to
protect their environment.
1178531
3018
95%
96%
96%
97%
97%
98%
98%
99%
99%
100%
100%
Male (1208) Female (549)
Gender Wise Response
Yes No
726806
177
2319
6
95%96%96%97%97%98%98%99%99%
100%100%
< 25 years(749)
25-49 years(825)
> 49 years(183)
Age Wise Response
Yes No

Air Pollution Knowledge, Attitude and Practice (KAP) Survey in Delhi-NCR
38
www.shan.org.in
Do you think the Central Government and State Government are taking
adequate steps to improve air quality in your city?
913, 52.0%
378,21.5%
345, 19.6%
121, 6.9%
Overeall Response
YesSomewhat, but more can be doneNoDon’t know
554
101
79
90 89
309
12
2319
15
216 3136 29 33
79 6 12 12 12
0%
10%
20%
30%
40%
50%
60%
70%
80%
90%
100%
Delhi(1158)
Noida(150)
Gurgoan(150)
Ghaziabad(150)
Faridabad(149)
City Wise Response
Don't Know
No
Somewhat, but more can be done
Yes
73.5% of the respondents considered that the Central Government and Government of the State were taking or somewhat taking adequate steps to improve air quality in their city. 47.8% of the respondents from Delhi, 67.3% from Noida, 52.7% from Gurgaon, 60% from Ghaziabad, 59.3% from Faridabad considered that the Central Government and Government of the State were taking or somewhat taking adequate steps to improve air quality in their city.

Air Pollution Knowledge, Attitude and Practice (KAP) Survey in Delhi-NCR
39
www.shan.org.in
Do you use public transport in your daily life?
Practice Related
676, 38.5%
977,55.6%
104, 5.9%
Overeall Response
Always Sometimes Never
38.5% of the respondents always used the public transport while 55.6% used it sometimes. 17.67% females and 47.9% males always used the public transport
579
97
550
427
79 25
0%
10%
20%
30%
40%
50%
60%
70%
80%
90%
100%
Male (1208) Female (549)
Gender Wise Response
Always Sometimes Never
282 327 67
415457 105
52 41 11
0%
10%
20%
30%
40%
50%
60%
70%
80%
90%
100%
< 25 years(749)
25-49 years(825)
> 49 years(183)
Age Wise Response
Always Sometimes Never

Air Pollution Knowledge, Attitude and Practice (KAP) Survey in Delhi-NCR
40
www.shan.org.in
What is/are your main mode(s) of transport for your everyday life?
Do you walk to or use a bicycle for nearby destinations?
350
95
433
24
313
65
246223
8
0
50
100
150
200
250
300
350
400
450
500
Overeall Response
The main mode of transport used by 24.6% of the respondents was the bus, 19.9%
preferred walking, 17.8% respondents used three-wheeler, 14% used motorcycle and
12.7% preferred the metro/local train.
The main mode of transport used by 31.9% females was walking while in the case of
males the most common mode used was a bus (25.5%).
1653, 94.1%
104,5.9%
Overeall Response
Yes No
94.1% of the respondents walk or make use of bicycle for nearby destinations.
175175
88
7308
125
204
10942
23185
61182
41
0%
10%
20%
30%
40%
50%
60%
70%
80%
90%
100%
Male (1208) Female (549)
Gender Wise Response
Walk Bicycle Bus
Cabs Three-wheeler Private car
Motorcycle Metro/local train

Air Pollution Knowledge, Attitude and Practice (KAP) Survey in Delhi-NCR
41
www.shan.org.in
Do you or your family members burn firecrackers?
Do you burn waste?
490, 27.9%
1267,72.1%
Overeall Response
Yes No
72.1% of the respondents said that they do not burn firecrackers whereas 27.9% still follow this practice. 34.4% of the respondents in the age group <25 years , 23.8% in age group 25-49 years and 19.8% in the age group >49 years said that they burn firecrackers.
1605, 91.3%
124,7.1%
28, 1.6%
Overeall Response
Never Sometimes Yes
91.3% of the respondents said that they
never burn waste while there were only a
few respondents 8.6% who burn waste
always or sometimes.
258 196 36
491 629 147
0%
10%
20%
30%
40%
50%
60%
70%
80%
90%
100%
< 25 years(749)
25-49 years(825)
> 49 years(183)
Age Wise Response
Yes No

Air Pollution Knowledge, Attitude and Practice (KAP) Survey in Delhi-NCR
42
www.shan.org.in
Do you use agarbatti/ incense sticks/ room freshener at home?
Do you use chula/kerosene stove/ burn wood/ coal for cooking or
heating purpose?
Incense sticks/ room fresheners were always
or sometimes used at home by 82.9% of the
respondents. There were very few
respondents (17.1%) who never used them.
943, 53.7%
513,29.2%
301, 17.1%
Overeall Response
Always Sometimes Never
297, 16.9%
1460,
83.1%
Overeall Response
Yes No
• Only 16.9% of the respondents were using chula/ kerosene stove/ burn wood/ coal for
cooking or heating purpose. While 83.1% of the respondents were not using them.
• Faridabad with 25.5% of the respondents saying they were still using chula/ kerosene stove/
burn wood/ coal for cooking or heating purpose was at the top of the list followed by
Ghaziabad 22%, Noida 18.7% , Gurgaon 14.7% and Delhi 15.2%.
17628
22
33 38
982 122 128117 111
0%
10%
20%
30%
40%
50%
60%
70%
80%
90%
100%
Delhi(1158)
Noida(150)
Gurgoan(150)
Ghaziabad(150)
Faridabad(149)
City Wise Response
Yes NO

Air Pollution Knowledge, Attitude and Practice (KAP) Survey in Delhi-NCR
43
www.shan.org.in
Do you exercise to improve your health? If so, do you plan exercise
activities according to air pollution?
Have you reduced times of opening windows to air the room, due to air
pollution?
435, 24.8%
424,
24.1%
898, 51.1%
Overeall Response
Always Sometimes Never
48.9% of the respondents said that they never
exercise while 24.8% said they always did and
24.1% said they exercise sometimes to
improve their health.
Out of 859 respondents who exercise 528
(61.5%) did not plan their exercise activities
according to air pollution. Only 331 (38.5%)
planned exercise activities accordingly.
820, 46.7%
684,38.9%
253, 14.4%
Overeall Response
Yes No Not Applicable
Nearly half of the respondents (46.7%) had
reduced times of opening windows to air the
room, due to air pollution. 38.9% of the
respondents had not reduced times of
opening windows, they still open the windows
in the same way as they used to do
previously.

Air Pollution Knowledge, Attitude and Practice (KAP) Survey in Delhi-NCR
44
www.shan.org.in
Do you regularly use a mask to protect yourself? If Yes, what type of
mask do you use?
692, 39.4%
1065,60.6%
Overeall Response
Yes No
Air pollution has increased all over still
people lack awareness regarding what
protective/ preventive measures to be
taken. Only 39.4% of the respondents
were regularly using a mask to protect
themselves while the majority of them
(60.6%) did not use a mask.
Only 0.8% of the total respondents used
a N99 mask , 1.5% used a N95 mask to
protect themselves. Most of the
respondents 31.7% used cloth/cotton
masks to protect themselves.
508 184
700365
0%
20%
40%
60%
80%
100%
Male (1208) Female (549)
Gender Wise Response
Yes No
305 334 53
444 491130
0%
20%
40%
60%
80%
100%
< 25 years(749)
25-49 years(825)
> 49 years(183)
Age Wise Response
Yes No
466 59 61 70
36
692 91 89 80
113
0%
20%
40%
60%
80%
100%
Delhi(1158)
Noida(150)
Gurgoan(150)
Ghaziabad(150)
Faridabad(149)
City Wise Response
Yes No
558
62 26 15
0
100
200
300
400
500
600
Cloth/Cottonmask
Surgical mask N95 mask N99 mask
Type of mask used by respondents

Air Pollution Knowledge, Attitude and Practice (KAP) Survey in Delhi-NCR
45
www.shan.org.in
Have you, at any point, considered any of the following individual
behavioral changes to reduce air pollution?
1368
579
525
510
482
427
0 200 400 600 800 1000 1200 1400 1600
Use of public transport
Car sharing/pooling
Reduced burning of waste
Restricted use of plastic
Never considered
Switching off the engine ofyour vehicle when not in…
Overeall Response
On an individual level as an effort to reduce air pollution, respondents highlighted that
they had considered major behavioral changes such as the use of public transport (1368),
car-sharing/pooling (579), reduced burning of waste (525), restricted use of plastics
(510), switching off the engine of your vehicle when not in use or at the red-light signal
(427).

Air Pollution Knowledge, Attitude and Practice (KAP) Survey in Delhi-NCR
46
www.shan.org.in
Would you support or oppose the steps taken by the Government to
reduce air pollution? If the steps cause you inconvenience.
On what aspects related to air pollution do you wish to have more
information? (Multiple Choices)
690
952
453
4
275
Air quality index in mylocality
Air pollution and itshealth impacts
Air pollution & its sources
Any other
Nothing
0 200 400 600 800 1000
Overeall Response
More than three fourth respondents
(78.7%) 1383 out of 1757 would support
the Government to reduce air pollution
though the step might cause them
inconvenience. While 13.9% opposed
the steps.
It was found that 54.2% of the respondents wanted information on air
pollution and its health impacts, 39.3% wanted information on air quality
index in their locality, 25.8% on air pollution and its sources and 15.6%
did not want any information.
1383, 78.7%
245,13.9%
129, 7.3%
Overeall Response
Support Oppose Can't say

Air Pollution Knowledge, Attitude and Practice (KAP) Survey in Delhi-NCR
47
www.shan.org.in
DISCUSSION
he study was conducted in Delhi-NCR among 1757 individuals to check their
knowledge, attitude and perception level regarding air pollution. The majority
of the respondents were males (68.8%) while 31.2% were females.
Predominantly, Hindi was spoken by most of the people.
The study conducted by Xujun Qian et al in 2016 found that 5.80 % of the total
respondents were satisfied with the air quality.11 In another study, the majority
(57%) of respondents rate the air quality in their city as acceptable or better.12 One
study showed that 3.0 percent of respondents in the total sample felt that the air
quality in their cities is very good. Around 10.6 percent of the respondents believed
that the air quality was toxic/hazardous.13
• In correspondence to other studies, our survey showed that the majority of
respondents rate their city's air quality as bad (36.2%) and very bad (21.5%). Only
1.2% of respondents felt that air quality is very good and 10.2% rated as good and
26.6% rated fair while 4.3% were not sure. This depicts people's understand about
the poor air quality in Delhi-NCR, as can be seen from the result that most of them
consider air quality to be bad and very bad.
• Study by C.M.S.R. Consultants and ASAR Social Impact Advisors Pvt. Ltd. showed
that around 54.0 percent of the survey respondents had heard about the "Air quality
index.13 while other study found that two-thirds of the respondents said they
understand the concept of AQI.12 Findings of the present survey are contrary to the
studies mentioned above. Very few respondents were aware of the Air Quality Index
(AQI). Less than one fourth (16.4%) respondents were aware of the AQI. The
explanation may be as the current survey focused mainly on vulnerable populations
who have a lack of information and understanding of air pollution.
• One study had also shown that awareness about the terms "PM2.5" and "PM10" was
affirmed by 30.0 percent and 18.0 percent of the respondents respectively.13 In the
present survey, 92.2% of respondents were not aware of the difference between
PM2.5 and PM10.
• The major sources of air pollution were motor vehicles, industries, burning of waste,
cutting of trees, construction, and air conditioner.12, 13, 14, 15 Similarly in the current
survey the three major sources were vehicular emissions, waste burning, and
industries/ factories.
• Newspapers, T.V., Radio, social media, mobile and Internet 12, 13 were preferred
mediums as per studies. The study conducted by Xujun Qian et al in 2016 found that
television and internet resources have replaced books and newspapers as the primary
sources for obtaining knowledge about haze and related protective measures.11 In
the current survey respondents rely mainly on television, newspaper and internet
to get information regarding air pollution.
T

Air Pollution Knowledge, Attitude and Practice (KAP) Survey in Delhi-NCR
48
www.shan.org.in
• According to one study, 89% of the respondents were not aware of the Air Pollution
Monitors installed in their area while 88% of the total respondents had not seen any
L.E.D. screens showing the air quality as severe/good/bad.14 Similarly in the present
survey 92.2% participant were unaware of the closest air quality monitor in their
area and 71% respondents had never seen the screen displaying severe/ poor/
good air quality. This shows people don't know how, when and where to check about
air quality.
• More than 50% of respondents adjudged that air pollution led to detrimental health.15
Similarly in the present survey 82.2% of respondents said that air pollution has an
impact on their health.
• Studies showed that around 37% to 48.5% percent 11, 14 of the respondents reported
wearing masks while going out. As per the study by Envecologic -Twenty-six percent
of respondents indicated that they use masks or air purifiers regularly.16 In the current
survey 39.4% (692) respondents use a mask regularly and 60.6% (1065) did not
use a mask. This shows that people are not taking preventive measures to protect
themselves from the adverse effects of air pollution.
• The study by Shakti Sustainable Energy Foundation and Edelman India states that
out of 1102 respondents, 2% of respondents do not seek any kind of information. 70%
of the respondents are seeking information on air pollution frequently.12 While in the
present survey more than half of the respondents were willing to acquire more
information on air pollution and its health impacts followed by information on air
quality index in their locality (39.3%), air pollution and its sources (25.8%). This depicts
people who are willing to acquire information on various aspects of air pollution.
The survey has given an insight into understanding the perceptions of the general public
concerning air pollution and future studies can be done to understand the association of
various diseases with air pollution.
Morsel team conducting the survey

Air Pollution Knowledge, Attitude and Practice (KAP) Survey in Delhi-NCR
49
www.shan.org.in
CHALLENGES
e were aiming to have 50 percent of females respondents, but because of
many factors we were unable to do so. Many females' refused to engage in
a survey as they were reluctant, most of the women remain at their homes
and they didn't come out were the few reasons we couldn't reach a target of
50 percent for females. We were able to collect 31.2% of data from females.
We initially decided to cover 250-meter vicinity in and around metro stations but we were
not able to capture the data within this limited radius so we increased our coverage to
500 m to 1km.
We were able to collect data from 2 schools since the survey was conducted in January-
February the students were busy with their exams at that time. It was difficult to get the
date from other schools for conducting a survey.
CONCLUSION AND WAY FORWARD
• The survey was conducted among 1757 respondents.
• The survey showed that there was a massive lack of awareness among the public.
• This report will guide other organizations to establish an effective communication
strategy to raise awareness and understanding among people about air pollution.
• This survey helped in understanding the awareness level of the respondents as
well as in generating the evidence on the public's perception towards air pollution
across all age groups in Delhi- N.C.R. Based on that, we can create a plan of
action to combat air pollution and find an appropriate solution for it by changing
the knowledge attitude and practice levels among the public.
• This project aims to develop a comprehensive, innovative and multi-pronged public
education campaign to combat air pollution in the Delhi-National Capital Region
(N.C.R.), based on U.S. and Indian expertise, experiences, and best practices in
minimizing the adverse impact of air pollution on the health of citizens, especially
the most vulnerable.
• This project will be a building block in ongoing mission programs and initiatives to
address air pollution and likely increase India's capacity to improve the health of
its vulnerable population.
• Air- Pollution Common-Actions for tomorrow (A.C.T.).
W

Air Pollution Knowledge, Attitude and Practice (KAP) Survey in Delhi-NCR
50
www.shan.org.in
REFERENCES
1. Health Effects Institute. 2019. State of Global Air 2019. Special Report. Boston,
MA: Health Effects Institute. Available from:
https://www.stateofglobalair.org/sites/default/files/soga_2019_report.pdf
2. https://www.healthdata.org/sites/default/files/files/policy_report/2017/India_Healt
h_of_the_Nation%27s_States_Report_2017.pdf
3. Balakrishnan K, Dey S, Gupta T, Dhaliwal RS, Brauer M, Cohen AJ, et al. The
impact of air pollution on deaths, disease burden, and life expectancy across the
states of India: the Global Burden of Disease Study 2017. The Lancet Planetary
Health. 2019 Jan; 3(1):e26–39. Available from:
https://www.thelancet.com/action/showPdf?pii=S2542-5196%2818%2930261-4
4. Rizwan SA, Nongkynrih B, Gupta SK. "Air pollution in Delhi: Its Magnitude and
effects on health". Indian J Community Med 2013; 38:4-8. Available from:
https://www.researchgate.net/publication/256481805_Air_pollution_in_Delhi_Its_
Magnitude_and_Effects_on_Health/link/02e7e52300bb65af0a000000/download
5. https://www.iqair.com/world-most-polluted-cities
6. https://cerca.iitd.ac.in/uploads/Reports/1576211826iitk.pdf
7. http://epca.org.in/state-air-winter-2017-18.pdf
8. ND NOFO
9. https://www.mapsofindia.com/parliamentaryconstituencies/delhi/
10. https://www.uber.com/en-IN/blog/new-delhi/power-hours-in-delhi/ 11. Qian, X., Xu, G., Li, L. et al. Knowledge and perceptions of air pollution in Ningbo,
China. B.M.C. Public Health (2016) 16:1138. Available from:
https://bmcpublichealth.biomedcentral.com/track/pdf/10.1186/s12889-016-3788-
0
12. https://shaktifoundation.in/wp-content/uploads/2017/12/A-Hazy-View.pdf
13. http://www.indiaenvironmentportal.org.in/files/file/Detailed-Report-AQ-perception-
survey.pdf
14. https://www.indiaspend.com/wp-content/uploads/2019/01/RTI-Survey-Report-on-
Delhis-GRAP-URJA.pdf
15. https://cleanairasia.org/wp-content/uploads/2018/04/Public-Perception-Survey-
Report.pdf
16. http://envecologic.com/wp-content/uploads/2020/01/State-of-Delhis-
Air_Envecologic_Summary-Report-Jan-2020.pdf
