air quality - europarl.europa.eu · emissions decreased by 23%. emissions of particulate matter...
TRANSCRIPT

STUDYEPRS | European Parliamentary Research Service
Author: Didier BourguignonMembers' Research Service
PE 625.114 – July 2018 EN
AirqualityPollutionsourcesandimpacts,EUlegislationandinternationalagreements

EPRS | European Parliamentary Research Service
Air quality
Pollution sources and impacts, EU legislation and international agreements
Outdoor air pollution is caused by the emission of harmful substances from natural sources and human activities. It has a number of adverse effects on human health and the environment, and subsequently on society and the economy. Air pollution can be transported or formed over long distances and can affect large areas. Effective air quality policies require action and cooperation beyond the local and national levels, on a European and global scale. This publication presents key air pollutants, lists natural sources of air pollution, and details emissions from human activities by sector. It describes adverse effects on human health, the environment and the climate, as well as socioeconomic impacts. In addition, it provides an overview of international agreements and European Union legislation setting air quality standards, decreasing national emissions of pollutants, and reducing emissions of pollutants at specific sources. Furthermore, this publication briefly describes the state of implementation of key European Union legislation related to air quality. Finally, it reflects the position of the European Parliament and stakeholders on the policy area.

AUTHOR
Didier Bourguignon, Members' Research Service, Economic Policies Unit
This paper has been drawn up by the Economic Policies Unit of the Members' Research Service Directorate, within the Directorate-General for Parliamentary Research Services (EPRS) of the Secretariat of the European Parliament.
To contact the authors, please email: [email protected]
LINGUISTIC VERSIONS
Original: EN
Translations: DE, FR
Manuscript completed in June 2018.
DISCLAIMER AND COPYRIGHT
This document is prepared for, and addressed to, the Members and staff of the European Parliament as background material to assist them in their parliamentary work. The content of the document is the sole responsibility of its author(s) and any opinions expressed herein should not be taken to represent an official position of the Parliament.
Reproduction and translation for non-commercial purposes are authorised, provided the source is acknowledged and the European Parliament is given prior notice and sent a copy.
Brussels © European Union, 2018.
Photo credits: © soleg / Fotolia.
PE 625.114 ISBN: 978-92-846-3477-4 DOI:10.2861/864239 QA-04-18-636-EN-N
[email protected] http://www.eprs.ep.parl.union.eu (intranet) http://www.europarl.europa.eu/thinktank (internet) http://epthinktank.eu (blog)

Air quality
I
Executive summary
Outdoor air pollution is caused by the emission of harmful substances from natural sources and human activities. Pollutants are either emitted directly in the atmosphere or formed through chemical reactions in the atmosphere. Air pollution can be transported or formed over long distances and can affect large areas. The main air pollutants include (fine) particulate matter, ground-level ozone, nitrogen oxides, sulphur dioxide, ammonia, non-methane organic volatile compounds, carbon monoxide, methane, toxic metals, and also persistent organic pollutants. Air pollutants can be released through combustion, volatilisation, mechanical processes or other natural processes.
Air pollutants are emitted from natural sources (such as volcanos, vegetation, soils and oceans) as well as from human activity-related sources, also known as 'anthropogenic' sources (from a variety of sectors across the economy). Particulate matter is emitted mainly by heating, industry and transport; nitrogen oxides are mainly released by the transport sector; the bulk of sulphur oxides emissions come from energy production and non-road transport; almost all ammonia emissions come from agriculture; volatile organic compounds are mainly emitted from paints and chemicals used in manufacture and maintenance; carbon monoxide emissions come from heating and transport; and most methane emissions come from the agriculture, waste and energy sectors.
In the European Union (EU), outdoor air pollution has decreased considerably in recent decades, while gross domestic product (GDP) and the population have grown. Between 1990 and 2015, sulphur oxides emissions fell by 89 %; the emissions of the three air pollutants primarily responsible for the formation of ground-level ozone were substantially reduced: carbon monoxide (-68 %), non-methane volatile organic compounds (-61 %) and nitrogen oxides (-56 %); emissions of the main toxic metals (lead, cadmium, mercury) also decreased substantially (by at least -67 %); and ammonia emissions decreased by 23 %. Emissions of particulate matter fell by 25 % between 2000 and 2015. The smallest recorded reduction in emissions was for benzo(a)pyrene (-3 %).
Air pollution has a number of adverse effects, starting with impacts on human health. According to the World Health Organisation (WHO), air pollution poses the biggest environmental risk to human health. In the EU, it is estimated that about 450 000 persons die prematurely each year as a result of exposure to particulate matter, nitrogen dioxide and ozone. Health effects are not distributed equally across Member States: central and eastern Europe and Italy are affected more than northern and north-western Europe for instance.
Impacts on the environment include eutrophication (an excess of nutrients ultimately leading to a depletion of the oxygen supply), acidification (reduced pH level of soil and water) and damage to vegetation from ground-level ozone. In 2010, eutrophication and acidification were damaging 7 % and 63 % of the ecosystem area of the European Union respectively, down from significantly higher levels a few decades earlier. In 2014, 85 % of Europe's agricultural area was exposed to ozone levels exceeding the EU long-term objective. Interactions between air pollution and climate change are complex: air pollution may have both warming and cooling effects on the climate.
By impacting human health, the environment and the climate, air pollution also induces adverse effects on the economy. The Organisation for Economic Cooperation and Development (OECD) estimates that in 2015 the cost of air pollution in its member countries amounted to US$1 640 billion, which represents US$1 280 per person and 5.3 % of income. Costs vary significantly among EU Member States.
In its seventh environment action programme, adopted in 2013, the European Union committed to significant improvements in outdoor air quality by 2020, moving closer to WHO reference levels, and to further reductions in the impacts of air pollution on ecosystems and biodiversity.

EPRS | European Parliamentary Research Service
II
The fact that air pollution is highly mobile means that norms seeking to ensure air quality have astrong cross-border dimension. International agreements and EU legislation on air quality can begrouped into three broad categories, based on their objective. The first group sets air qualitystandards: ambient air quality directives set binding limits and non-binding targets for theconcentration of selected pollutants in the atmosphere, with a view to protecting human health andthe environment. The second group sets reduction targets for national emissions of air pollutants:targets set at international level, under the Convention on long-range transboundary air pollutionand its relevant protocols as well as under the Paris Agreement, are implemented and expanded inEU legislation. The third group aims to reduce emission of pollutants at specific sources: about 80norms of varying legal nature (international agreements, international guidance, EU regulations, EUdirectives, Commission legal acts) regulate emissions from a wide range of sectors (industry,electricity and heat production; road, sea and air transport including fuels; agriculture; waste; andchemicals). They also cover emissions of specific pollutants (toxic metals and persistent organicpollutants).
Implementing key pieces of EU legislation has proved difficult. One of the reasons for this is thecomplexity underlying this policy area. A multiplicity of air pollutants, sources, economic sectors andgovernance levels are involved.
In 2017, 23 out of 28 Member States did not comply fully with air quality limit values. The EuropeanCommission has been pursuing infringement procedures against a number of Member States forpersistently exceeding particulate matter, nitrogen dioxide and sulphur dioxide limit values. Inaddition, limits currently set in EU legislation leave a significant share of urban residents exposed toair pollution above WHO reference levels. Progress in meeting the 2010 national emission ceilingshas been slow. In 2016, although ceilings for the four relevant pollutants were met when aggregatedat EU level, six Member States exceeded their 2010 ceilings for one or more pollutants. As regardspollution sources, EU legislation, such as standards on fuels, has had some success. However, thereremains room to improve the implementation of EU law. Weaknesses regarding motor vehicleemissions, highlighted by the 2015 Volkswagen case, are being addressed.
The European Parliament has consistently advocated action to improve air quality, implementexisting EU legislation and enact effective rules on pollution sources.
In recent years, air quality has moved higher on the political agenda, in part as a result of concernsfrom citizens exposed to poor air quality. This policy area could see some developments in thecoming years, with the fitness check of the ambient air quality directives expected to be completedby the end of 2019.
To improve air quality, action needs to be taken across governance levels (including the local andregional level) and across all sectors, including less well known sources such as agriculture anddomestic heating. An integrated approach between climate change and air quality policies wouldalso enable advantage to be taken of existing synergies.
Air quality
III
Contents 1. Introduction ___________________________________________________________________________________ 3
2. Sources of air pollution __________________________________________________________________________ 3
2.1. Main air pollutants ___________________________________________________________________________ 3
2.2. Natural sources______________________________________________________________________________ 5
2.3. Anthropogenic sources by sector _______________________________________________________________ 7
3. Impacts of air pollution _________________________________________________________________________ 10
3.1. Impacts on human health ____________________________________________________________________ 10
3.2. Impacts on the environment and the climate _____________________________________________________ 12
3.3. Socioeconomic impacts ______________________________________________________________________ 15
4. EU policy ____________________________________________________________________________________ 16
5. International agreements and EU legislation ________________________________________________________ 17
5.1. Setting air quality standards __________________________________________________________________ 18
5.2. Reducing national emissions of air pollutants ____________________________________________________ 21
5.2.1. International agreements __________________________________________________________________ 21
5.2.2. EU legislation ___________________________________________________________________________ 22
5.3. Reducing emissions of air pollutants at specific sources ____________________________________________ 24
5.3.1. General ________________________________________________________________________________ 26
5.3.2. Industry, electricity and heat _______________________________________________________________ 27
5.3.3. Transport _______________________________________________________________________________ 28
5.3.4. Agriculture _____________________________________________________________________________ 30
5.3.5. Waste _________________________________________________________________________________ 30
5.3.6. Chemicals ______________________________________________________________________________ 30
5.3.7. Specific pollutants _______________________________________________________________________ 30
6. Implementation of EU legislation _________________________________________________________________ 31
7. European Parliament position ___________________________________________________________________ 42
8. Stakeholders' views ____________________________________________________________________________ 43
9. Outlook _____________________________________________________________________________________ 44

EPRS | European Parliamentary Research Service
IV
Table of figures
Figure 1 – Global emissions of selected air pollutants from natural and anthropogenic sources (in million tonnes per year) __________________________________________________________ 6
Figure 2 – GDP, population and pollution index in the EU, 2000 = 100 % (2000-2015) ________ 7
Figure 3 – Sources of selected air pollutants in EU28, in thousand tonnes (2000 and 2015) ____ 8
Figure 4 – Premature deaths attributable to fine particulate matter, nitrogen dioxide and ozone exposure in the EU28 (2014) _____________________________________________________ 11
Figure 5 – Premature deaths attributable to fine particulate matter per million population (2014)12
Figure 6 – Exposure of ecosystems to eutrophication, acidification and ground-level ozone __ 14
Figure 7 – Main costs associated with air pollution ___________________________________ 15
Figure 8 – Estimated costs of air pollution in OECD member countries (2015 and 2060) ______ 15
Figure 9 – Estimated cost of air pollution expressed as % of GDP in selected countries (2010) _ 16
Figure 10 – National reduction commitments aggregated at EU level, compared with 2005 __ 23
Figure 11 – Spatial and sectoral origin of fine particulate matter in Brussels and Milan _______ 32
Figure 12 – Concentrations of selected air pollutants measured in the EU (2015) ___________ 34
Figure 13 – Percentage of EU28 urban population exposed to air pollutant concentrations above certain EU and WHO air quality standards (2015) _____________________________________ 35
Figure 14 – Member State progress in meeting 2010 national emission ceilings (2015) ______ 37
Figure 15 – Actions to implement EU air quality legislation, as suggested by the Commission 39
Figure 16 – Synergies and trade-offs from climate and air policies _______________________ 41
Table of tables
Table 1 – Brief description of selected outdoor air pollutants ____________________________ 3
Table 2 – Air quality standards aimed at protecting human health, as applicable in 2018 ____ 20
Table 3 – Air quality standards aimed at protecting vegetation, as applicable in 2018 _______ 21
Table 4 – Overview of norms on air pollution sources at EU and international level, 2018 ____ 25
Air quality
1
Glossary
Acidification: reduced pH level of soil and water as a result of the deposition of (nitric and sulphuric) acids on land and in water.
Alert threshold: in EU legislation on air quality standards, air pollutant concentration beyond which brief exposure is deemed to pose health risks.
Ammonia (NH3): air pollutant contributing to the formation of particulate matter. More information in Table 1.
Average exposure indicator: in EU legislation on air quality standards, average level of exposure to fine particulate matter reflecting population exposure at Member State level; used as a basis to calculate the exposure reduction target.
Benzene (C6H6): air pollutant belonging to volatile organic compounds, contributing to the formation of ground-level ozone. More information in Table 1.
Benzo(a)pyrene (BaP): air pollutant belonging to polycyclic aromatic hydrocarbons. More information in Table 1.
Best available techniques (BAT): under the Industrial Emissions Directive, techniques aiming to achieve a high level of environmental protection while taking into account costs and benefits.
Best available techniques conclusions (BAT conclusions): main elements of best available techniques reference documents adopted as Commission implementing decisions following approval by Member States' representatives in a standing committee.
Best available techniques reference document (BREF): document detailing best available techniques for a given sector, drawn up and reviewed through an exchange of information between Member States, the industries concerned, environmental non-governmental organisations and the European Commission.
Black carbon (BC): particulate matter emitted through combustion, composed of carbon and organic substances; its colour is black.
Carbon monoxide (CO): air pollutant contributing to the formation of ground-level ozone. More information in Table 1.
Critical level: in EU legislation on air quality standards, level above which pollutants (sulphur dioxide and nitrogen oxides) are deemed to cause direct adverse effects on the environment.
Critical load: upper limit of one or more pollutants deposited on the Earth's surface that an ecosystem can tolerate without being damaged in its function or its structure.
Emission control areas: under the International convention for the prevention of pollution from ships (MARPOL convention), sea regions where ships have to meet stricter emission standards. Two emission control areas are located near Europe: in the Baltic Sea, and in the North Sea and English Channel.
Eutrophication: a form of water pollution that involves the enrichment of a freshwater body with nutrients, such as nitrates and phosphates.
Exposure concentration obligation: in EU legislation on air quality standards, reference value for exposure of the population to fine particulate matter at national level.
Exposure reduction target: in EU legislation on air quality standards, reduction (expressed in percentage) of the average exposure of the population of a Member State to fine particulate matter.
Information threshold: in EU legislation on air quality standards, air pollutant concentration beyond which brief exposure is deemed to pose health risks for specific segments of the population, such as
EPRS | European Parliamentary Research Service
2
children.
Limit value: in EU legislation on air quality standards, binding standard set regarding (fine) particulate matter, sulphur dioxide, nitrogen dioxide, lead, carbon monoxide and benzene with a view to protecting human health.
Methane (CH4): greenhouse gas contributing to the formation of ground-level ozone. More information in Table 1.
National emission reduction commitment: under EU legislation on national emission ceilings, obligation for Member States to reduce emissions of an air pollutant in a given calendar year.
Nitrogen dioxide (NO2): air pollutant contributing to the formation of ground-level ozone and particulate matter. More information in Table 1.
Nitrogen oxides (NOx): nitrogen monoxide (NO) and nitrogen dioxide (NO2).
Non-methane volatile organic compounds (NMVOCs): group of substances, made of certain volatile organic compounds except methane, which contribute to the formation of ground-level ozone and particulate matter. More information in Table 1.
Ozone (O3): air pollutant not emitted directly in the atmosphere, but formed on the basis of other pollutants. In the context of air quality, ozone refers to ground-level (or tropospheric) ozone, and does not refer to the ozone layer found in the stratosphere. More information in Table 1.
Particulate matter (PM): air pollutant made of particles of varying sizes and chemical composition. PM10 are 10 micrometres or smaller; PM2.5 (also called 'fine particulate matter') are 2.5 micrometres or smaller. More information in Table 1.
Persistent organic pollutants (POPs): wide group of substances which persist in the environment and can cause adverse effects to human health and the environment. More information in Table 1.
Polycyclic aromatic hydrocarbons (PAH): group of persistent organic pollutants including benzo(a)pyrene (BaP) and other substances.
Primary pollutant: pollutant emitted directly in the atmosphere, which may act as a precursor to form secondary pollutants. More information in Table 1.
Real driving emissions (RDE): procedure complementing laboratory tests for measuring nitrogen oxides and particulate number emitted from motor vehicles.
Secondary pollutant: pollutant not emitted directly in the atmosphere but formed as a result of interactions between primary pollutants (and atmospheric conditions). Ground-level ozone is always a secondary pollutant; particulate matter can be either primary or secondary.
Sulphur dioxide (SO2): air pollutant contributing to the formation of particulate matter. More information in Table 1.
Sulphur oxides (SOx): chemical compounds containing sulphur and oxygen; this includes sulphur dioxide (SO2).
Target value: in EU legislation on air quality standards, standard to be attained where possible, set regarding ozone, arsenic, cadmium, nickel and benzo(a)pyrene with a view to protecting human health.
Toxic metals: in the context of air pollution, lead (Pb), cadmium (Cd), mercury (Hg) as well as arsenic (As), chromium (Cr), copper (Cu), nickel (Ni), selenium (Se) and zinc (Zc). More information in Table 1.
Volatile organic compounds (VOCs): wide group of substances which can easily evaporate at room temperature.
Air quality
3
1. Introduction Outdoor air pollution is caused by the emission of harmful substances from natural sources and from human activities (also known as 'anthropogenic' sources). It has a number of adverse effects on human health and the environment, and consequently on society and the economy. Air pollution can be transported or formed over long distances and can affect large areas. Effective air quality policies require action and cooperation beyond the local and national levels, at European and global scale. They relate to most economic sectors as well as to private citizens.
Information on air quality in the European Union is readily available online. The European air quality index provides real-time information on concentrations of five key pollutants1 based on measurements from over 2 000 air quality monitoring stations across Europe. It also provides, for each monitoring station, information about concentrations in the past days and months.2
According to a Eurobarometer survey published in October 2017, close to half of Europeans think air pollution is a major environmental issue (second only to climate change).3
In Europe, air quality policies focus mainly on outdoor (or ambient) air. However, in less affluent parts of the world, indoor air quality is a very serious issue.4 This publication reflects the EU policy focus, and deals only with outdoor air quality.
2. Sources of air pollution 2.1. Main air pollutants Air pollutants can be emitted directly in the atmosphere; such substances are called 'primary' pollutants. Pollutants can also be formed through chemical reactions on the basis of 'precursor' substances; such substances are called 'secondary' pollutants.
The table below presents an overview of outdoor air pollutants, their main sources, their impacts and how they interact.
Table 1 – Brief description of selected outdoor air pollutants Pollutant Description and sources Adverse impacts
on * Precursor to
Particulate matter (PM)
Solid or liquid particles of varying sizes and chemical composition. PM10 (PM2.5) are 10 (2.5) micrometres or smaller.5 Primary PM is emitted directly from natural sources (sea salt, naturally suspended dust, pollen and volcanic ash) and anthropogenic sources (from combustion, heating, transport, industry, agriculture, as well as tyres and road wear). Secondary PM is formed from emissions of SO2, NOx, NH3 and NMVOCs, mainly from anthropogenic sources.
Health Climate
–
1 Particulate matter, fine particulate matter, ground-level ozone, nitrogen dioxide and sulphur dioxide. 2 Air quality index, European Environment Agency. 3 Attitudes of European citizens towards the environment, Special Eurobarometer 468, European Commission, October
2017. 4 9 out of 10 people worldwide breathe polluted air, but more countries are taking action, press release, World Health
Organization, May 2018. 5 For comparison, a human hair has a diameter of 50 to 70 micrometres.

EPRS | European Parliamentary Research Service
4
Pollutant Description and sources Adverse impacts on *
Precursor to
Ozone (O3) Not emitted directly in the atmosphere. Ground-level ozone forms on the basis of complex chemical interactions involving sunlight and precursor pollutants, mainly NOx, CO, NMVOCs and CH4.
Health Environment Climate
–
Nitrogen oxides (NOx)
Nitrogen monoxide (NO) and nitrogen dioxide (NO2). They are emitted during fuel combustion, for instance from industrial facilities and the transport sector (mainly from diesel vehicles).
Health Environment
ozone PM
Sulphur dioxide (SO2)
Emitted mainly through the combustion of fuels containing sulphur.
Health Environment
PM
Ammonia (NH3) Emitted mainly from the use of manure and nitrogenous fertilisers in agriculture.
Health Environment
PM
Non-methane volatile organic
compounds (NMVOCs)
Emitted from anthropogenic sources (mainly paints, solvents, dry-cleaning, road transport) and natural sources (mainly vegetation).
Health ozone PM
Benzene (C6H6) Volatile organic compound emitted from the combustion of fossil fuels and from industrial processes.
Health ozone
Carbon monoxide (CO)
Emitted due to incomplete combustion (mainly from road transport, businesses, households and industry).
Health ozone
Methane (CH4) Produced by both anthropogenic sources (mainly from agriculture, waste, coal mining and gas) and natural sources.
Climate ozone
Lead (Pb) Emitted from the combustion of fossil fuels, the incineration of waste and the production of non-ferrous metal, iron, steel and cement.
Health Environment
Cadmium (Cd) Emitted from non-ferrous metal production, stationary fossil-fuel combustion, waste incineration, and the production of iron, steel and cement.
Health Environment
Mercury (Hg) Mainly emitted from the combustion of coal and other fossil fuels, as well as metal and cement production, waste disposal and cremation.
Health Environment
Arsenic (As) Mainly emitted from metal smelters and fuel combustion. Health Environment
Nickel (Ni) Emitted from oil and coal combustion, mining, incineration of waste and sewage sludge, and steel production.
Health Environment
Persistent organic
pollutants (POPs)
Chemicals used as pesticides or emitted through combustion and mechanical processes. POPs persist in the environment and may bioaccumulate through the food web.
Health Environment
Benzo(a)pyrene (BaP)
Persistent organic pollutant belonging to polycyclic aromatic hydrocarbons; mainly emitted from domestic heating (in particular wood and coal burning), waste burning, coke production and steel production.
Health Environment
Note: high impacts are indicated in bold. Sources: Air pollution fact sheet 2014, European Environment Agency, 2014; Air quality in Europe 2017, European Environment Agency, 2017; Information on chemicals, European Chemical Agency, 2018.
Air quality
5
Processes triggering the release of air pollutants may be grouped in four broad categories:
1 combustion, from both human activities (such as transport, power generation, heating or waste incineration) and natural processes (such as forest fires), resulting – through chemical reactions with oxygen and nitrogen in the atmosphere6 – in the formation of nitrogen oxides, carbon dioxide and water vapour. Because combustion is usually not complete, it also releases substances such as carbon monoxide, volatile organic compounds, particulate matter, polycyclic aromatic hydrocarbons, dioxins and furans;
2 volatilisation of volatile or semi-volatile compounds, for instance from fossil fuels during storage or from paints and solvents during use;
3 mechanical processes from both human activities (for example building, tilling, certain industrial processes or transport) and natural activities (such as the release of dust and sea salt by the wind);
4 other natural processes, such as vegetation metabolism releasing organic volatile compounds, ruminant digestion producing methane, or volcanic eruptions.
2.2. Natural sources Natural sources of emissions for the main air pollutants can be summarised as follows:
natural emissions of sulphur dioxide come mainly from volcanos (and therefore vary considerably from one year to the next);
natural emissions of nitrogen oxides come in equal parts from lightning and soils; natural emissions of ammonia and carbon monoxide come from oceans and natural
vegetation; natural emissions of volatile organic compounds come from vegetation; natural emissions of particulate matter come from wind erosion (mainly in deserts) and
the release of sea salts through waves.
Figure 1 shows estimated global emissions of key air pollutants and their origin (natural or anthropogenic). Natural sources outweigh anthropogenic sources as regards emissions of volatile organic compounds and particulate matter. However, other elements besides emitted volumes also come into play when assessing possible impacts from natural and anthropogenic sources. First, the weight-based measurement unit used does not take into account the chemical composition (and hence the reactivity and toxicity) of these two broad groups of air pollutants. Second, natural sources are usually spread over the Earth's surface, unlike anthropogenic sources, which are usually concentrated and close to (densely) populated areas.
6 The Earth's atmosphere is made up among other things of about 78 % nitrogen (N2), 21 % oxygen (O2), 1 % water vapour (in highly variable concentration) and 0.04 % carbon dioxide (CO2).

EPRS | European Parliamentary Research Service
6
Figure 1 – Global emissions of selected air pollutants from natural and anthropogenic sources (in million tonnes per year)
Note: wood fires exclude residential fires; they are mostly anthropogenic, but may also be of natural origin. Data source: C. Seigneur, Pollution atmosphérique: concepts, théorie et applications, Éditions Belin, 2018.
103
3
19
SO2112
25
53
NO2
54
6
16
NH3
629413
140
CO
4336
460
PM2.5
136
251
1000
VOCs
65 49
1690
PM10

Air quality
7
2.3. Anthropogenic sources by sector
Air pollutants are emitted by a variety of sectors across the economy. Particulate matter is emitted mainly by heating, industry and transport; nitrogen oxides are mainly released by transport; the bulk of sulphur oxides emissions come from energy production and non-road transport; almost all ammonia emissions come from agriculture; volatile organic compounds are mainly emitted from 'solvent and product use' (paints and chemicals used in manufacture and maintenance); carbon monoxide emissions come from heating and transport; and most methane emissions come from the agriculture, waste and energy sectors.7 For a comparison of the emissions of main pollutants by sector in 2000 and 2015 see Figure 3.
7 Air quality in Europe 2014, European Environment Agency, 2014, pp. 20-27.
Significant decrease in emissions of most air pollutants in the EU Outdoor air pollution has decreased considerably in recent decades, while gross domestic product (GDP) and population have grown, as shown below.
Figure 2 – GDP, population and pollution index in the EU, 2000 = 100 % (2000-2015)
Note: the pollution index is based on PM, NOx, SOx, NH3 and NMVOC emissions. Data source: Eurostat (GDP; population; air pollution), 2018.
Data compiled by the European Environment Agency shows a decrease in anthropogenic emissions of most pollutants in recent decades in the European Union. Between 1990 and 2015, sulphur oxide emissions fell by 89 %; the emissions of three air pollutants primarily responsible for the formation of ground-level ozone were substantially reduced: carbon monoxide (-68 %), non-methane volatile organic compounds (-61 %) and nitrogen oxides (-56 %); emissions of the main heavy metals (lead, cadmium, mercury) also decreased substantially (at least -67 %); and ammonia emissions decreased by 23 %. Emissions of primary particulate matter fell by 25 % between 2000 and 2015. The smallest recorded reduction in emissions was for benzo(a)pyrene (-3 %).
Sources: Air quality in Europe 2017, European Environment Agency, 2017, pp. 17-18; European Union emission inventory report 1990–2015, European Environment Agency, 2017, pp. 11-13.
0
20
40
60
80
100
120
140
160
2000 2005 2010 2015
air pollution
population
GDP

EPRS | European Parliamentary Research Service
8
Figure 3 – Sources of selected air pollutants in EU28, in thousand tonnes (2000 and 2015)
Data source: Eurostat (air pollution), 2018.
The contributions of various sectors to the emissions of air pollutants in the European Union can be summarised as follows:
Fuel combustion in the commercial, institutional and households sector was the largest contributor to total primary particulate matter (42 %), fine particulate matter (57 %), black carbon (44 %), carbon monoxide (47 %) and benzo(a)pyrene (75 %) emissions in 2015. Emissions of particulate matter in this sector remained relatively constant between 2000 and 2015, although sulphur oxides emissions dropped by 49 %. Residential combustion of wood has been shown to contribute 5 % to 40 % of particulate matter emissions during winter. However, the use of modern and well maintained stoves as well as appropriate firewood can mitigate these emissions.8
The road transport sector was the largest contributor to nitrogen oxide emissions (39 %) and the second largest emitter of black carbon (29 %) in 2015. It also emitted 11 % of particulate matter. Emissions of most pollutants from road transport have fallen by over 25 % since 2000, not least on account of vehicle emission standards.9
The non-road transport sector (mainly aviation, shipping and railways) contributes relatively little to total emissions of air pollutants. Since 2000, emissions for this sector have fallen by over 30 % for most pollutants.
8 For more information on emissions from residential combustion, see Air quality in Europe 2016, European Environment Agency, 2016, pp. 22-26.
9 However, the Volkswagen case in 2015 highlighted the gap between on-road and type-approval emissions. More details in Section 6 'Implementation of EU legislation'.
0
2000
4000
6000
8000
10000
12000
14000
NH3 NMVOC SOx NOx PM
2000
0
2000
4000
6000
8000
10000
12000
14000
NH3 NMVOC SOx NOx PM
2015

Air quality
9
In the industry sector, industrial processes and product uses were the largest emitter of non-methane volatile organic compounds (50 %) and were responsible for 20 % of arsenic, 20 % of cadmium, 20 % of mercury and 26 % of lead emissions to the air in 2015.10 Energy use in industry was the largest contributor of arsenic (43 %), cadmium (35 %) and lead (35 %) emissions in 2015. It also contributed 23 % of mercury and nickel emissions. The industry sector considerably reduced its emissions of air pollutants between 2000 and 2015, especially as regards sulphur oxides emissions from energy use, thanks to changes in fuels used and the use of improved abatement techniques (such as filters) in facilities. However, the emissions of two pollutants increased during the period: benzo(a)pyrene emissions from industrial processes and product uses increased by 86 %, while ammonia emissions from energy use increased by 52 %.
Energy production and distribution was the largest emitter of sulphur oxides (59 %), nickel (37 %) and mercury (39 %) to the air in 2015. Between 2000 and 2015, emissions from this sector fell, in particular thanks to changes in fuels used and the use of improved abatement techniques in facilities.
Agriculture was the largest contributor of ammonia (94 %) and methane (53 %) emissions in 2015. Between 2000 and 2015, ammonia and methane from agriculture decreased by 7 %, while emissions of non-methane volatile organic compounds increased by 6 %.11
The waste sector contributes relatively little to total emissions of air pollutants, although it contributed 27 % of methane emissions in 2015. Between 2000 and 2015, methane emissions from the waste sector decreased by 42 %.
A 2017 publication from the European Commission's Joint Research Centre provides a detailed analysis of the geographical and sectorial origins of fine particulate matter in 150 cities in the European Union.12 The tool used to map out emissions also provides information about particulate matter and nitrogen oxide emissions across the EU.13
10 As regards emissions of heavy metals by industry, the European Environment Agency notes that in 2016 just 18 out of 978 industrial facilities were responsible for more than half the heavy metal releases from large industry in Europe. See Environmental pressures of heavy metal releases from Europe's industry, European Environment Agency, May 2018.
11 In addition to being a source of air pollution, the agricultural sector is also adversely impacted by some pollutants. More information in Section 3.2 'Impacts on the environment and the climate'.
12 P. Thunis et al., Urban PM2.5 atlas: Air quality in European cities, Joint Research Centre, European Commission, 2017. 13 The tool offers particulate matter data with spatial resolution of 7x7 km². SHERPA: Screening for High Emission
Reduction Potential on Air, Joint Research Centre.
EPRS | European Parliamentary Research Service
10
3. Impacts of air pollution 3.1. Impacts on human health The World Health Organisation identifies ambient air pollution as the biggest environmental risk to human health.14 Exposure to air pollution is known to increase the incidence of respiratory and cardiovascular diseases. Recent research suggests that rapid increases in pollution in places where air quality is generally good may increase the risk of heart attacks.15 The International Agency for Research on Cancer, a branch of the WHO, has classified as carcinogenic both outdoor air pollution in general and particulate matter found in air pollution mixtures.16 Air pollution is associated with health impacts on pregnancy and new-borns, including adverse effects on brain development and cognitive capacities.17 There is also emerging evidence that exposure to air pollution may be linked with conditions such as type 2 diabetes in adults, obesity, Alzheimer's disease and dementia.18
14 Ambient air pollution: A global assessment of exposure and burden of disease, World Health Organisation, 2016. 15 M. Rasche et al, Rapid increases in nitrogen oxides are associated with acute myocardial infarction: A case-crossover
study, European Journal of Preventive Cardiology, 2018. 16 Outdoor Air Pollution, International Agency for Research on Cancer, IARC monographs on the evaluation of
carcinogenic risks to humans, Volume 109, 2013. 17 Review of evidence on health aspects of air pollution – REVIHAAP project: final technical report, World Health
Organisation Regional Office for Europe, 2013. 18 WHO expert consultation: Available evidence for the future update of the WHO Global Air Quality Guidelines (AQGs),
World Health Organisation Regional Office for Europe, 2016.
How are emissions calculated? The most common approach used to estimate emissions is to combine information on a human activity (activity data) with coefficients quantifying emissions per unit of activity (emission factors), using the following basic equation: emissions = activity data x emission factors. In the energy sector for instance, activity data would be based on fuel consumption, while the emission factor would be set according to the mass of a pollutant (say sulphur dioxide) emitted per unit of fuel. Typically, methods used depend on the source considered.
Methods may be classified into three broad groups according to their sophistication: Tier 1 methods apply a simple linear relation between activity data (derived from available statistical information, for instance on energy, production, traffic or population size) and emission factors (which are generally technology independent and set to reflect averaged process conditions); Tier 2 methods use similar activity data to Tier 1 methods, but apply emission factors which are country-specific, and in some cases, process-specific; and Tier 3 methods use sophisticated models (such as COPERT for road transport emissions) and/or facility level data (such as data compiled in 'pollutant release and transfer registers').
Sources can also be mapped. Spatial mapping is carried out in different ways: based on point sources, for emission sources at a known location (for instance industrial plants and power stations); based on area sources, for diffuse emissions (such as residential fuel combustion or agricultural and natural emissions); or based on line sources, for emissions occurring along a line (such as a road, railway, pipeline or shipping lane).
At EU level, emission factors and methodologies used are harmonised through processes steered by the European Environment Agency. Established procedures aim to ensure emission inventories meet quality criteria for transparency, consistency, completeness, comparability and accuracy.
Source: EMEP/EEA air pollutant emission inventory guidebook 2016, European Environment Agency, September 2016.
Air quality
11
The three air pollutants mainly responsible for adverse effects on human health are particulate matter, nitrogen dioxide and ground-level ozone. The adverse effects of particulate matter are especially well documented: there is evidence of effects from both short-term and long-term exposure; evidence for cardiovascular effects is established; and links with other conditions may be emerging. There is no evidence of a safe level of exposure to particulate matter below which there are no adverse effects. Exposure to nitrogen dioxide is associated with respiratory effects. As regards ground-level ozone, there is evidence of adverse cardiovascular and respiratory effects from short-term exposure; evidence of respiratory effects from long-term exposure; and possible links with effects on cognitive development and reproductive health.19
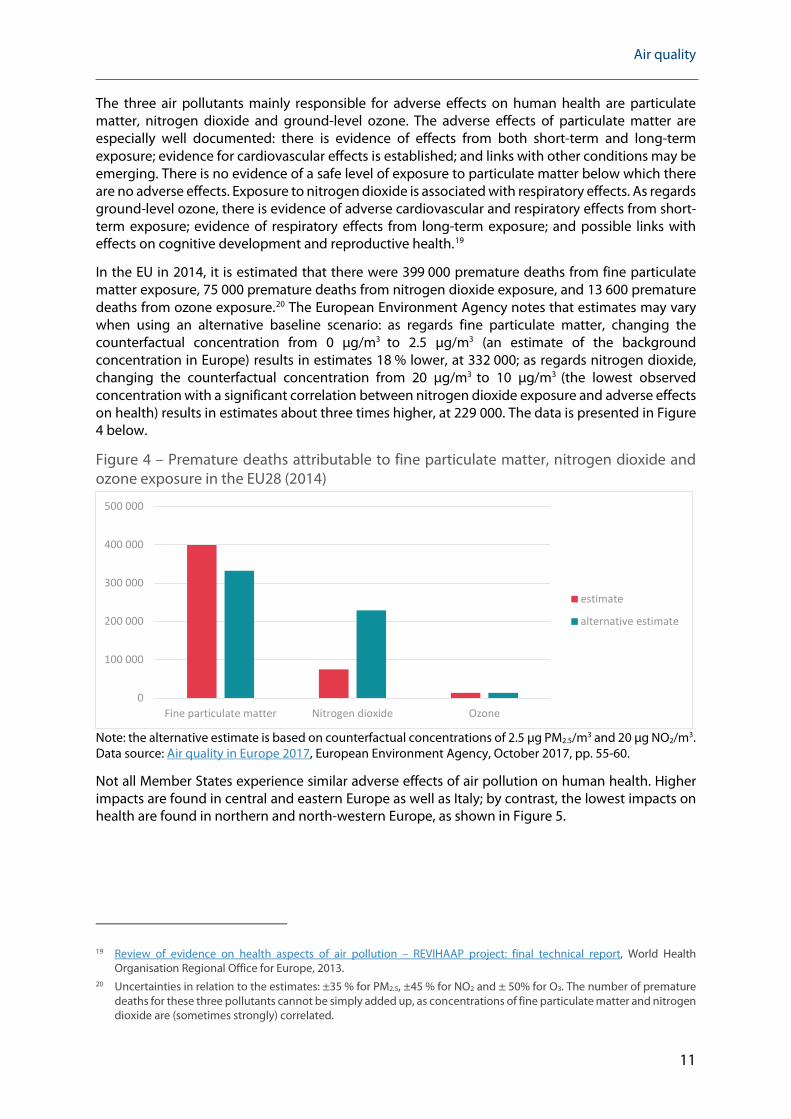
In the EU in 2014, it is estimated that there were 399 000 premature deaths from fine particulate matter exposure, 75 000 premature deaths from nitrogen dioxide exposure, and 13 600 premature deaths from ozone exposure.20 The European Environment Agency notes that estimates may vary when using an alternative baseline scenario: as regards fine particulate matter, changing the counterfactual concentration from 0 µg/m3 to 2.5 µg/m3 (an estimate of the background concentration in Europe) results in estimates 18 % lower, at 332 000; as regards nitrogen dioxide, changing the counterfactual concentration from 20 µg/m3 to 10 µg/m3 (the lowest observed concentration with a significant correlation between nitrogen dioxide exposure and adverse effects on health) results in estimates about three times higher, at 229 000. The data is presented in Figure 4 below.
Figure 4 – Premature deaths attributable to fine particulate matter, nitrogen dioxide and ozone exposure in the EU28 (2014)
Note: the alternative estimate is based on counterfactual concentrations of 2.5 µg PM2.5/m3 and 20 µg NO2/m3. Data source: Air quality in Europe 2017, European Environment Agency, October 2017, pp. 55-60.
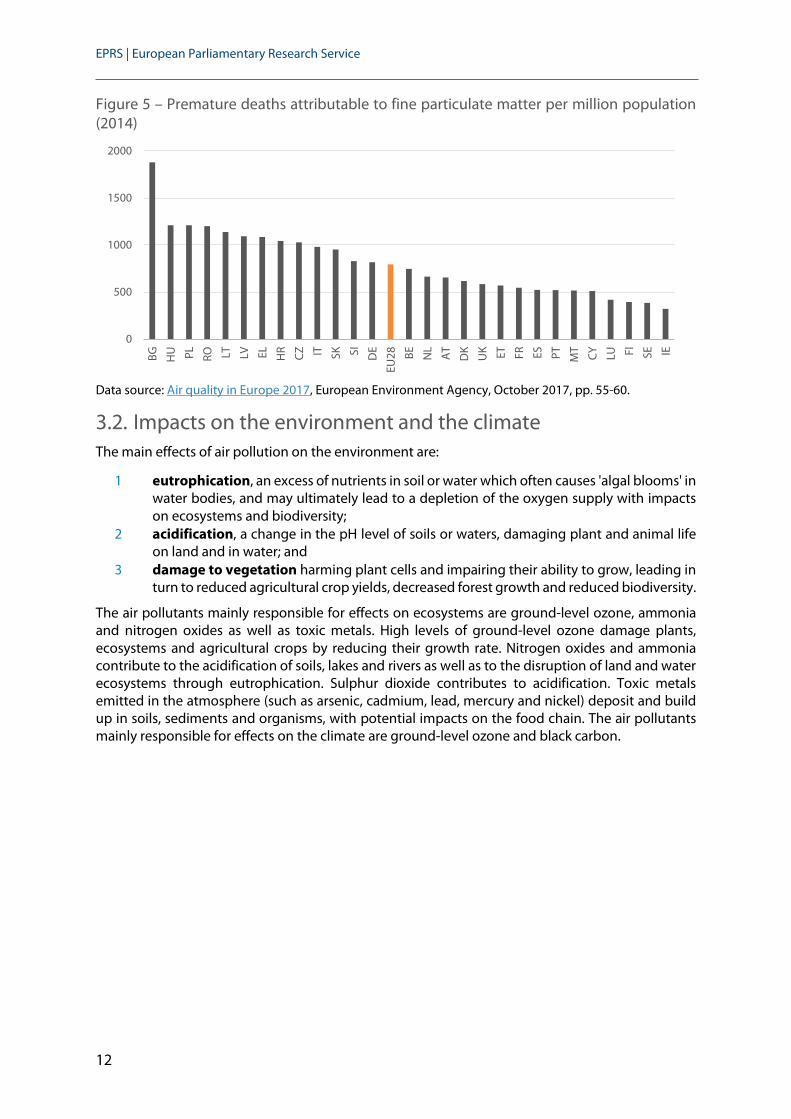
Not all Member States experience similar adverse effects of air pollution on human health. Higher impacts are found in central and eastern Europe as well as Italy; by contrast, the lowest impacts on health are found in northern and north-western Europe, as shown in Figure 5.
19 Review of evidence on health aspects of air pollution – REVIHAAP project: final technical report, World Health Organisation Regional Office for Europe, 2013.
20 Uncertainties in relation to the estimates: ±35 % for PM2.5, ±45 % for NO2 and ± 50% for O3. The number of premature deaths for these three pollutants cannot be simply added up, as concentrations of fine particulate matter and nitrogen dioxide are (sometimes strongly) correlated.
0
100 000
200 000
300 000
400 000
500 000
Fine particulate matter Nitrogen dioxide Ozone
estimate
alternative estimate
EPRS | European Parliamentary Research Service
12
Figure 5 – Premature deaths attributable to fine particulate matter per million population (2014)
Data source: Air quality in Europe 2017, European Environment Agency, October 2017, pp. 55-60.
3.2. Impacts on the environment and the climate The main effects of air pollution on the environment are:
1 eutrophication, an excess of nutrients in soil or water which often causes 'algal blooms' in water bodies, and may ultimately lead to a depletion of the oxygen supply with impacts on ecosystems and biodiversity;
2 acidification, a change in the pH level of soils or waters, damaging plant and animal life on land and in water; and
3 damage to vegetation harming plant cells and impairing their ability to grow, leading in turn to reduced agricultural crop yields, decreased forest growth and reduced biodiversity.
The air pollutants mainly responsible for effects on ecosystems are ground-level ozone, ammonia and nitrogen oxides as well as toxic metals. High levels of ground-level ozone damage plants, ecosystems and agricultural crops by reducing their growth rate. Nitrogen oxides and ammonia contribute to the acidification of soils, lakes and rivers as well as to the disruption of land and water ecosystems through eutrophication. Sulphur dioxide contributes to acidification. Toxic metals emitted in the atmosphere (such as arsenic, cadmium, lead, mercury and nickel) deposit and build up in soils, sediments and organisms, with potential impacts on the food chain. The air pollutants mainly responsible for effects on the climate are ground-level ozone and black carbon.
0
500
1000
1500
2000BG H
U PL RO LT LV EL HR CZ IT SK SI DE
EU28 BE N
L
AT
DK
UK ET FR ES PT MT
CY LU FI SE IE
Air quality
13
Effects on ecosystems have decreased significantly in recent decades in the EU, although they remain a concern. Critical load estimates carried out by the European Environment Agency show the following picture: in 2010, 7 % of the ecosystem area in the European Union was being damaged by acidification, down from 43 % in 1980, with a further reduction expected in the future. In 2010, 63 % of the EU ecosystem area was being damaged by eutrophication, down from 84 % in 1980; the magnitude of the critical load exceedance is also projected to decline considerably, except for a few areas in western France, in border areas between Belgium, Germany and the Netherlands, and in northern Italy. As regards ozone, levels have been decreasing since 2006. However, in 2014, 18 % of Europe's agricultural area was still exposed to levels above the threshold set in EU legislation, while 85 % was exposed to ozone levels exceeding the long-term objective specified in EU legislation. During the past six years, around two-thirds of the forest area in Europe was exposed to ozone concentrations above the internationally agreed critical level.21
21 Level set in the Gothenburg Protocol to abate acidification, eutrophication and ground-level ozone (see Section 5.1 for more details).
Air pollution and climate change: a complex relationship Climate change is caused by greenhouse gases, which can have very long life spans and spread almost evenly across the atmosphere. In contrast, air pollution varies highly in space and time, with shorter time spans between the moment pollutants are emitted and the moment where significant concentrations can be measured. However, the two phenomena are linked because some substances are relevant in both processes, and because combustion is a major source of both air pollutants and carbon dioxide, the main greenhouse gas.
Air pollutants have mixed effects on the climate. On one hand, some air pollutants, such as methane (an ozone precursor), ground-level ozone and black carbon (a component of particulate matter), contribute directly to global warming. On the other hand, other components of particulate matter, such as organic carbon, ammonium (NH4
+), sulphate (SO42-) and nitrate (NO3
-) have a cooling effect.
In addition, climate change also impacts air pollution: changes in weather patterns can change the formation, dispersion and transport of air pollutants; while higher temperatures increase emissions of some volatile organic compounds.
EPRS | European Parliamentary Research Service
14
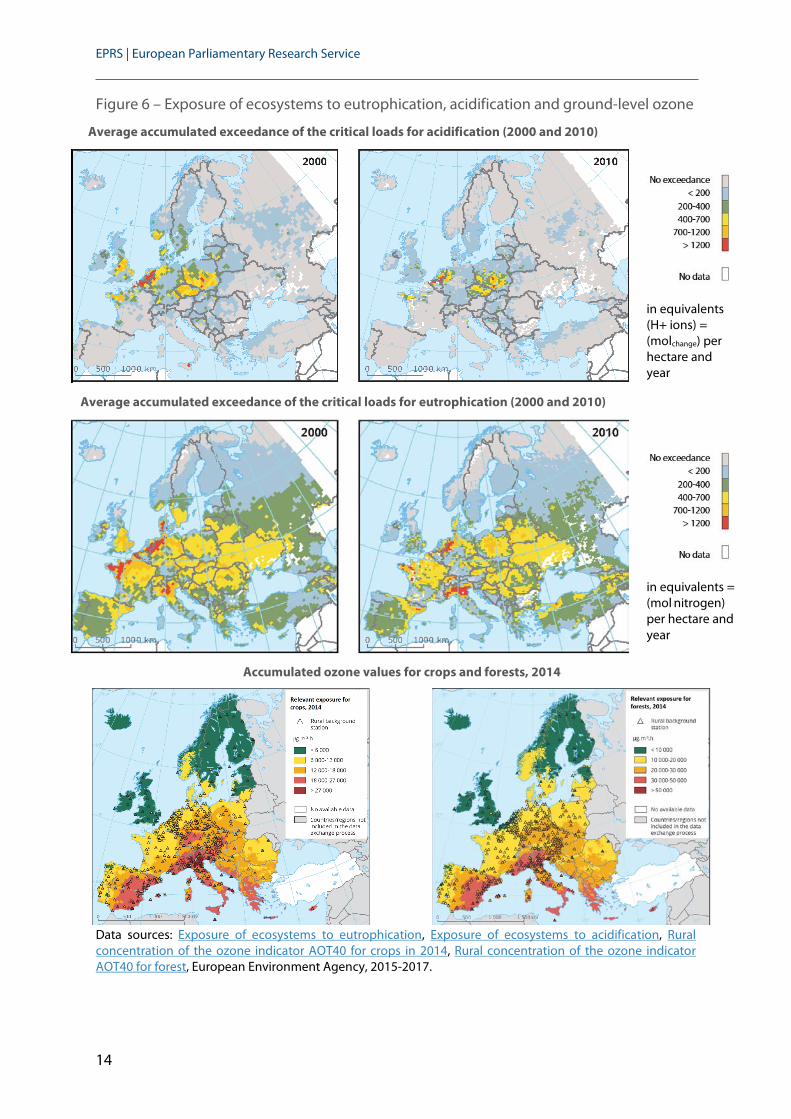
Figure 6 – Exposure of ecosystems to eutrophication, acidification and ground-level ozone
Average accumulated exceedance of the critical loads for acidification (2000 and 2010)
in equivalents (H+ ions) = (molchange) per hectare and year
Average accumulated exceedance of the critical loads for eutrophication (2000 and 2010)
in equivalents = (mol nitrogen) per hectare and year
Accumulated ozone values for crops and forests, 2014
Data sources: Exposure of ecosystems to eutrophication, Exposure of ecosystems to acidification, Rural concentration of the ozone indicator AOT40 for crops in 2014, Rural concentration of the ozone indicator AOT40 for forest, European Environment Agency, 2015-2017.

Air quality
15
3.3. Socioeconomic impacts By impacting human health, the environment and the climate, air pollution also induces adverse effects on the economy. Figure 7 provides an overview of the main costs associated with air pollution.
Figure 7 – Main costs associated with air pollution
Non-market impacts Market impacts Increased mortality (premature deaths) Reduced labour productivity
Increased morbidity (illnesses) Additional health expenditure
Degraded ecosystems and biodiversity Reduced crop and forests yields
Climate change Impacts on tourism sector
Degraded cultural heritage Source: The economic consequences of outdoor air pollution, OECD, June 2016, p. 22.
The economic consequences of air pollution are significant. In a report published in 2016,22 the Organisation for Economic Cooperation and Development (OECD) estimates that in 2015 costs of air pollution in its member countries23 amounted to US$1 640 billion, which represents US$1 280 per person and 5.3 % of income.24 It also estimates costs of air pollution in 2060 if public policies were to remain unchanged. For OECD member countries, annual costs would amount to US$4 140 – 4 240 billion, which represents US$2 280 – 2 350 per person and 5.5 % of income. For the European Union, annual costs would amount to US$1 366 billion.
Figure 8 – Estimated costs of air pollution in OECD member countries (2015 and 2060)
2015 (total US$1 640 billion) 2060 (total US$4 140 – 4 240 billion)
Note: Market impacts include direct costs and indirect economic effects related to reduced labour productivity, additional health expenditure and reduced crop yields. Data source: The economic consequences of outdoor air pollution, OECD, June 2016, p. 95.
22 The economic consequences of outdoor air pollution, OECD, June 2016. 23 The OECD has 35 member countries, of which 22 are also Member States of the European Union. 24 Estimated costs are based on the following impacts: mortality from PM2.5 and ozone, morbidity from PM2.5 and ozone,
and damages to crop yields from ozone. The following impacts are not covered in the estimates: other health impacts (for instance from nitrogen oxides or low birth weight), impacts on tourism, degraded ecosystems and biodiversity, climate change, degraded cultural heritage. While the market impacts represent an actual cost to the economy, the cost of non-market impacts are estimated based on people's expressed willingness to pay to reduce health risks and do not represent an actual cost to the economy.
Market impacts 90 bnMorbidity
130 bn
Mortality1420 bn
USD
Market impacts 390 bn
Morbidity310 bn
Mortality3440-3540 bn

EPRS | European Parliamentary Research Service
16
In another report from 2015,25 the OECD published estimated costs of air pollution compared to gross domestic product (GDP), which show wide differences between EU Member States.
Figure 9 – Estimated cost of air pollution expressed as % of GDP in selected countries (2010)
Note: Data are only available for EU countries that were members of the OECD at the time. Data are not available for Bulgaria, Croatia, Cyprus, Latvia, Lithuania, Malta and Romania. Data source: OECD, Economic Policy Reforms 2015: Going for Growth, 2015, p.95.
Air pollution can increase inequalities. A 2013 report by the WHO notes that air pollution combines with other aspects of the social and physical environment to create a disproportionate disease burden in less affluent parts of society.26 This may be because deprived populations are more exposed to air pollution (for instance as they may live closer to busy roads), because deprived populations are more sensitive to the effects of air pollution (for instance as a result of existing long-term health conditions or less healthy lifestyles), or because more affluent populations can afford better protection (for instance as a result of access to better healthcare and lifestyle goods).27
4. EU policy The overarching goal of EU environmental policy, as stated in Article 191 of the Treaty on the Functioning of the European Union,28 is to establish a 'high level of protection'. In addition, the Treaty establishes four principles underpinning EU environmental policy (the principle that preventive action should be taken, the principle that environmental damage should as a priority be rectified at source, the polluter-pays principle and the precautionary principle), which are relevant as regards air quality policy.
In the sixth environment action programme, adopted in 2002,29 the European Union aimed at 'achieving levels of air quality that do not give rise to significant negative impacts on and risks to
25 Economic Policy Reforms 2015: Going for Growth, OECD, February 2015. 26 Review of evidence on health aspects of air pollution – REVIHAAP project: final technical report, World Health
Organisation Regional Office for Europe, 2013. 27 Science for Environment Policy, Links between noise and air pollution and socioeconomic status, In-depth Report 13,
produced for the European Commission, 2016. 28 Consolidated versions of the Treaty on European Union and the Treaty on the Functioning of the European Union, OJ
C 202, 7.6.2016. 29 Decision No 1600/2002/EC of the European Parliament and of the Council of 22 July 2002 laying down the Sixth
Community Environment Action Programme, OJ L 242, 10.9.2002.
0
2
4
6
8
10
12

Air quality
17
human health and the environment', based on WHO reference levels. In the seventh environment action programme, adopted in 2013,30 the European Union committed to ensuring that, by 2020, 'air pollution and its impacts on ecosystems and biodiversity are further reduced with the long-term aim of not exceeding critical loads and levels' and that outdoor air quality has significantly improved, moving closer to WHO reference levels. To reach these goals, the action programme highlights the need to strengthen efforts to reach full compliance with Union air quality legislation and implement an updated air quality policy.
Building on the 2005 thematic strategy on air pollution,31 the Clean Air Programme for Europe,32 published in 2013 is aimed at implementing the long-term objectives set in the sixth and seventh environment action programmes. Noting widespread non-compliance with EU legislation on air quality, the strategy lays down measures to deliver compliance, including ensuring on-road emissions from diesel cars and vans reflect legal standards; making EU funding available to help Member States; and promoting the uptake of very low emissions technologies. In addition, it sets two main objectives for 2030 (reducing premature deaths from particulate matter and ozone by 52 %; and shrinking the ecosystem area exceeding eutrophication limits to 35 %) to be met through a mix of regulatory and non-regulatory measures. In May 2018, the European Commission published a communication on clean air for all highlighting in particular expected actions to implement and enforce EU legislation on air quality.33 In June 2018, the European Commission published its first Clean Air Outlook putting in perspective the state of air quality in Europe today and its expected state in 2030, provided relevant legislation is fully implemented.34
At national and local level, the Urban Agenda for the EU supports measures to improve air quality in cities.35 At global level, European Union policy on air quality contributes directly and indirectly to the achievement of a number of sustainable development goals set in the United Nations' 2030 Agenda for Sustainable Development.36
5. International agreements and EU legislation Because air pollution is highly mobile, norms seeking to ensure air quality have a strong cross-border dimension. Some rules are agreed at international level, then implemented through EU legislation. Other legislation is initiated at EU level.
International agreements and EU legislation on air quality can be grouped into three broad groups, based on their objective: setting air quality standards; reducing national emissions of pollutants; and reducing emissions of pollutants at specific sources.
30 Decision No 1386/2013/EU of the European Parliament and of the Council of 20 November 2013 on a General Union Environment Action Programme to 2020 'Living well, within the limits of our planet', OJ L 354, 28.12.2013.
31 Communication on a thematic strategy on air pollution, COM(2005) 446, European Commission, September 2005. 32 Communication on a Clean Air Programme for Europe, COM(2013) 918, European Commission, December 2013. 33 Communication on a Europe that protects: Clean air for all, COM(2018) 330, European Commission, May 2018. 34 Report from the Commission to the European Parliament, the Council, the European Economic and Social Committee
and the Committee of the Regions: the first Clean Air Outlook, COM(2018)446, June 2018. 35 Urban agenda for the EU: Air quality, European Commission. 36 For more details, see Air quality in Europe 2017, European Environment Agency, October 2017, p. 15.

EPRS | European Parliamentary Research Service
18
5.1. Setting air quality standards The first pieces of European legislation setting standards for the concentration of various air pollutants were adopted in the 1980s.37 Today, two legislative acts (jointly referred to as the ambient air quality directives) set air quality standards: the 2008 Ambient Air Quality Directive38 (which replaced four directives adopted approximately a decade earlier and added air quality standards for fine particulate matter),39 and the 2004 directive on arsenic, cadmium, mercury, nickel and polycyclic aromatic hydrocarbons in ambient air (sometimes known as the Fourth Daughter Directive).40 By setting standards for air quality, the directives aim to avoid, prevent or reduce harmful effects on human health and the environment. In contrast, air quality guidelines41 defined by the World Health Organisation are not enforceable air quality standards.
The directives require Member States to establish air quality zones42 throughout their territory and to assess the concentration of air pollutants in all zones and agglomerations. Three assessment regimes are specified according to concentrations recorded in past years: high quality data are required if concentrations were above certain levels, while lower quality data are sufficient if concentrations were below certain levels.43 In addition, Member States are required to measure air quality at rural background locations. Requirements on the number and location of air quality measuring stations are harmonised. Member States are required to use reference measurement methods based on international standards or equivalent methods.
37 The Council Directive on air quality limit values and guide values for sulphur dioxide and suspended particulates (80/779/EEC) and the Council Directive on air quality standards for nitrogen dioxide (85/203/EEC).
38 Directive 2008/50/EC of the European Parliament and of the Council of 21 May 2008 on ambient air quality and cleaner air for Europe, OJ L 152, 11.6.2008 (see also consolidated version).
39 Council Directive on ambient air quality assessment and management (96/62/EC, known as the 'Air quality framework Directive'); Council Directive relating to limit values for sulphur dioxide, nitrogen dioxide and oxides of nitrogen, particulate matter and lead in ambient air (1999/30/EC, known as the 'First Daughter Directive'); Directive on limit values for benzene and carbon monoxide in ambient air (2000/69/EC, known as the 'Second Daughter Directive'); and Directive on ozone in ambient air (2002/3/EC, known as the 'Third Daughter Directive').
40 Directive 2004/107/EC of the European Parliament and of the Council of 15 December 2004 relating to arsenic, cadmium, mercury, nickel and polycyclic aromatic hydrocarbons in ambient air, OJ L 23, 26.1.2005 (see also consolidated version).
41 Air quality guidelines – global update 2005, World Health Organisation, 2006. 42 For an interactive map of air quality zones, see Air quality zones, European Environment Agency. 43 For more details see Guidance on assessment under EU air quality directives, European Commission, p.10.
WHO air quality guidelines The air quality reference values for a number of pollutants, defined by the World Health Organisation in 2005, are intended as policy guidance. They are based solely on health considerations and do not consider the technical feasibility or the economic, political and social aspects of achieving these levels. However, health risks may still exist at or below recommended concentrations. The WHO air quality guidelines are currently being updated.

Air quality
19
When limit or target values are exceeded in a given zone, Member States are required to draw up air quality plans setting out appropriate measures intended to keep the exceedance period as short as possible.
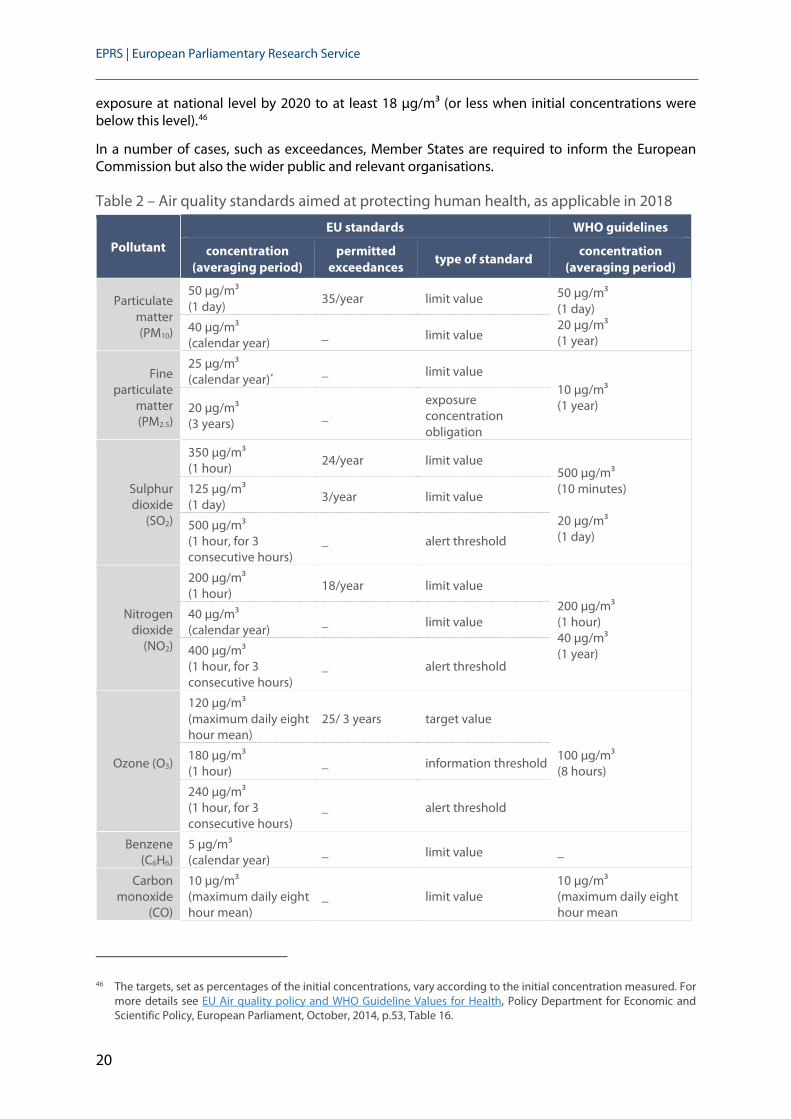
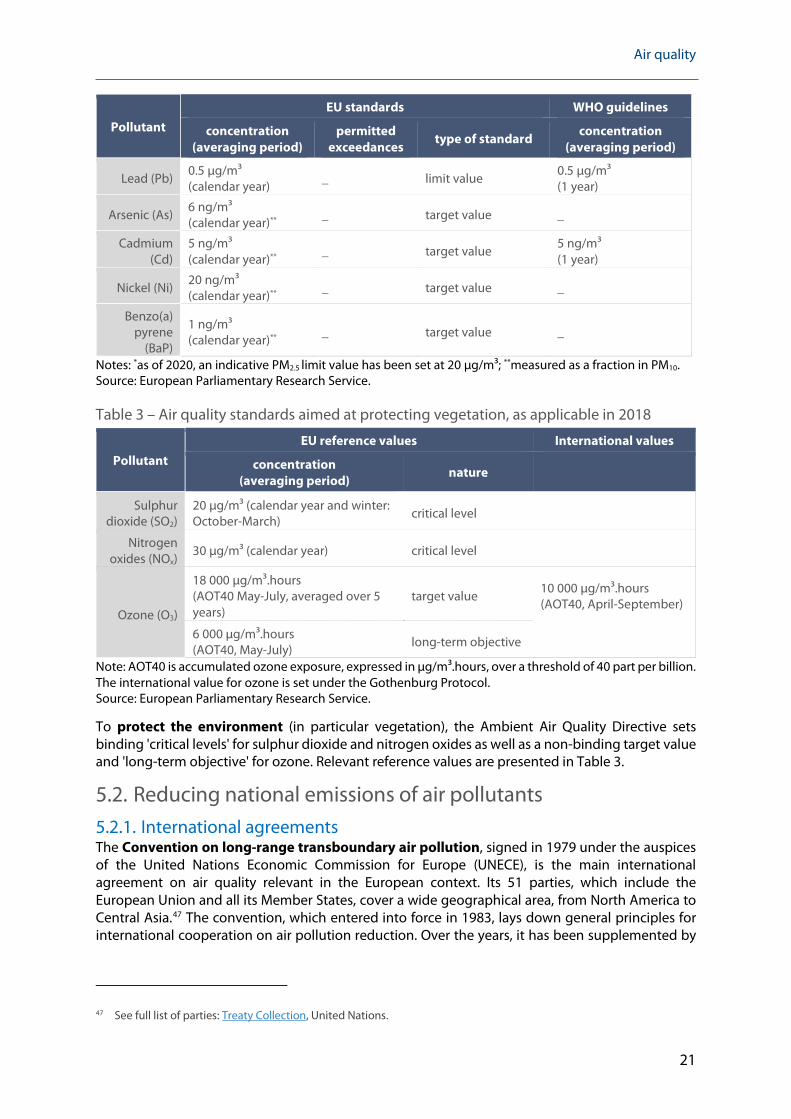
With a view to protecting human health, the ambient air quality directives set a number of reference values, which are presented in Table 2 and can be summarised as follows:
limit values: binding standards, defined as the concentration of a pollutant over an averaging period; limit values exist for particulate matter, sulphur dioxide, nitrogen dioxide, lead, carbon monoxide and benzene;
target values: standards to be attained where possible, defined as the concentration of a pollutant over an averaging period; target values exist for ozone, arsenic, cadmium, nickel and benzo(a)pyrene;44
information threshold: pollutant concentration beyond which brief exposure is deemed to pose health risks for specific segments of the population; if such a threshold has been reached, authorities are required to inform the public; there is an information threshold for ozone;
alert threshold: pollutant concentration beyond which brief exposure is deemed to pose health risks for the population as a whole; if such a threshold has been reached, authorities are required to inform the public and draw up short-term action plans; there are alert thresholds for sulphur dioxide, nitrogen dioxide and ozone;
exposure concentration obligation: binding standard reflecting human exposure to fine particulate matter at national level (in contrast, limit and target values apply at the level of air quality zones).
For some of these reference values, a number of exceedances may be permitted over a given period. Contributions from natural sources may be deducted from measured concentrations when assessing compliance.45
In addition to the reference values, an exposure reduction target for fine particulate matter requires Member States to take all necessary measures not entailing disproportionate costs to reduce
44 Although the directive on arsenic, cadmium, mercury, nickel and polycyclic aromatic hydrocarbons in ambient air requires Member States to measure concentrations of mercury, it does not set a target value (or any other reference value) for mercury concentration in ambient air.
45 Under the directive, natural sources are emissions of pollutants not caused directly or indirectly by human activities, including natural events such as volcanic eruptions, seismic activities, geothermal activities, wild-land fires, high-wind events, sea sprays or the atmospheric re-suspension or transport of natural particles from dry regions.
Key aspects for regulating concentrations of pollutants Six aspects are important when regulating air pollutant concentrations:
1 the pollutant, either a single substance or a group of substances among which one may be used as an indicator (for instance benzo(a)pyrene for polycyclic aromatic hydrocarbons);
2 the averaging period, generally set according to possible impacts on health from chronic and/or acute exposure;
3 permitted exceedances, allowing for high values caused by extreme weather events or other specific circumstances;
4 concentration limits (or air quality standards), which need to be understood in conjunction with the other key aspects;
5 the location of measuring stations, enabling concentrations to be measured in a range of different settings, including rural areas, urban background locations and the immediate vicinity of busy roads or industries;
6 the measurement method, based on a reference method or one established to be equivalent.
EPRS | European Parliamentary Research Service
20
exposure at national level by 2020 to at least 18 µg/m³ (or less when initial concentrations were below this level).46
In a number of cases, such as exceedances, Member States are required to inform the European Commission but also the wider public and relevant organisations.
Table 2 – Air quality standards aimed at protecting human health, as applicable in 2018
Pollutant EU standards WHO guidelines
concentration (averaging period)
permitted exceedances
type of standard concentration (averaging period)
Particulate matter (PM10)
50 µg/m³ (1 day)
35/year limit value 50 µg/m³ (1 day) 20 µg/m³ (1 year)
40 µg/m³ (calendar year)
_ limit value
Fine particulate
matter (PM2.5)
25 µg/m³ (calendar year)*
_ limit value 10 µg/m³ (1 year) 20 µg/m³
(3 years) _
exposure concentration obligation
Sulphur dioxide
(SO2)
350 µg/m³ (1 hour)
24/year limit value 500 µg/m³ (10 minutes) 20 µg/m³ (1 day)
125 µg/m³ (1 day)
3/year limit value
500 µg/m³ (1 hour, for 3 consecutive hours)
_ alert threshold
Nitrogen dioxide
(NO2)
200 µg/m³ (1 hour)
18/year limit value
200 µg/m³ (1 hour) 40 µg/m³ (1 year)
40 µg/m³ (calendar year)
_ limit value
400 µg/m³ (1 hour, for 3 consecutive hours)
_ alert threshold
Ozone (O3)
120 µg/m³ (maximum daily eight hour mean)
25/ 3 years target value
100 µg/m³ (8 hours)
180 µg/m³ (1 hour)
_ information threshold
240 µg/m³ (1 hour, for 3 consecutive hours)
_ alert threshold
Benzene (C6H6)
5 µg/m³ (calendar year)
_ limit value _
Carbon monoxide
(CO)
10 µg/m³ (maximum daily eight hour mean)
_ limit value 10 µg/m³ (maximum daily eight hour mean
46 The targets, set as percentages of the initial concentrations, vary according to the initial concentration measured. For more details see EU Air quality policy and WHO Guideline Values for Health, Policy Department for Economic and Scientific Policy, European Parliament, October, 2014, p.53, Table 16.
Air quality
21
Pollutant EU standards WHO guidelines
concentration (averaging period)
permitted exceedances
type of standard concentration (averaging period)
Lead (Pb) 0.5 µg/m³ (calendar year)
_ limit value 0.5 µg/m³ (1 year)
Arsenic (As) 6 ng/m³ (calendar year)**
_ target value _
Cadmium (Cd)
5 ng/m³ (calendar year)**
_ target value 5 ng/m³ (1 year)
Nickel (Ni) 20 ng/m³ (calendar year)**
_ target value _
Benzo(a) pyrene
(BaP)
1 ng/m³ (calendar year)**
_ target value _
Notes: *as of 2020, an indicative PM2.5 limit value has been set at 20 µg/m³; **measured as a fraction in PM10. Source: European Parliamentary Research Service.
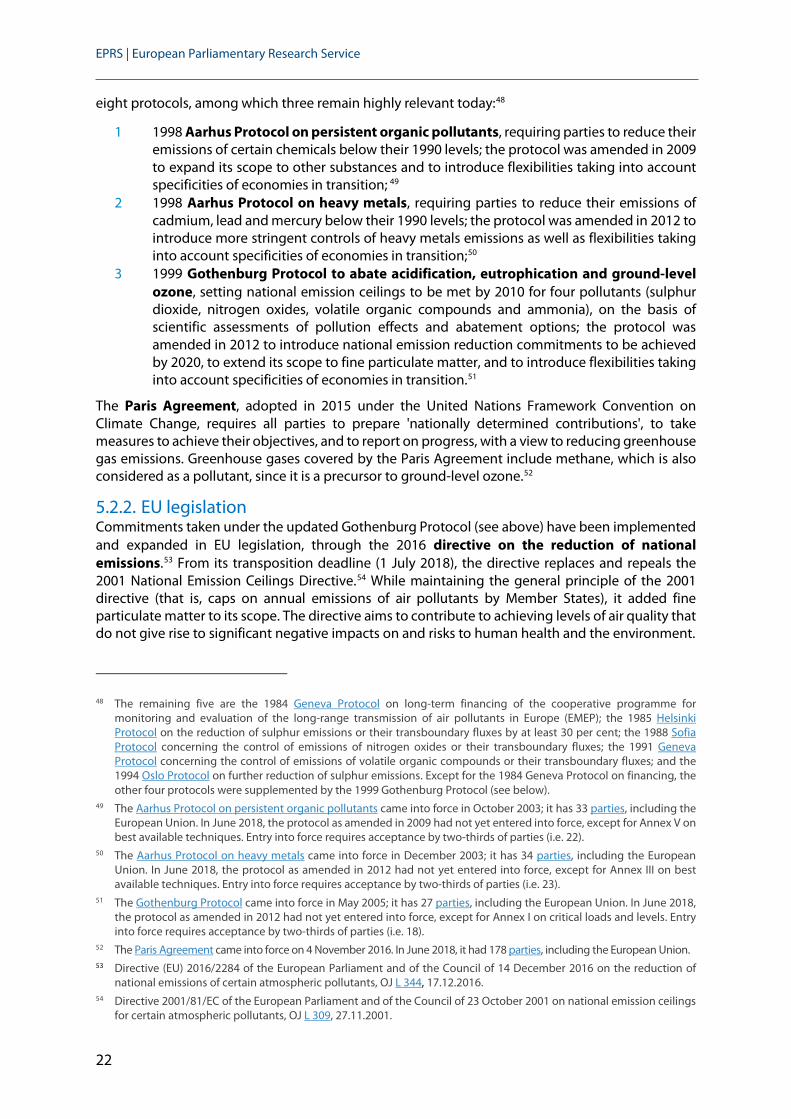
Table 3 – Air quality standards aimed at protecting vegetation, as applicable in 2018
Pollutant EU reference values International values
concentration (averaging period)
nature
Sulphur dioxide (SO2)
20 µg/m³ (calendar year and winter: October-March) critical level
Nitrogen oxides (NOx)
30 µg/m³ (calendar year) critical level
Ozone (O3)
18 000 µg/m³.hours (AOT40 May-July, averaged over 5 years)
target value 10 000 µg/m³.hours (AOT40, April-September)
6 000 µg/m³.hours (AOT40, May-July) long-term objective
Note: AOT40 is accumulated ozone exposure, expressed in μg/m³.hours, over a threshold of 40 part per billion. The international value for ozone is set under the Gothenburg Protocol. Source: European Parliamentary Research Service.
To protect the environment (in particular vegetation), the Ambient Air Quality Directive sets binding 'critical levels' for sulphur dioxide and nitrogen oxides as well as a non-binding target value and 'long-term objective' for ozone. Relevant reference values are presented in Table 3.
5.2. Reducing national emissions of air pollutants 5.2.1. International agreements The Convention on long-range transboundary air pollution, signed in 1979 under the auspices of the United Nations Economic Commission for Europe (UNECE), is the main international agreement on air quality relevant in the European context. Its 51 parties, which include the European Union and all its Member States, cover a wide geographical area, from North America to Central Asia.47 The convention, which entered into force in 1983, lays down general principles for international cooperation on air pollution reduction. Over the years, it has been supplemented by
47 See full list of parties: Treaty Collection, United Nations.
EPRS | European Parliamentary Research Service
22
eight protocols, among which three remain highly relevant today:48
1 1998 Aarhus Protocol on persistent organic pollutants, requiring parties to reduce their emissions of certain chemicals below their 1990 levels; the protocol was amended in 2009 to expand its scope to other substances and to introduce flexibilities taking into account specificities of economies in transition; 49
2 1998 Aarhus Protocol on heavy metals, requiring parties to reduce their emissions of cadmium, lead and mercury below their 1990 levels; the protocol was amended in 2012 to introduce more stringent controls of heavy metals emissions as well as flexibilities taking into account specificities of economies in transition;50
3 1999 Gothenburg Protocol to abate acidification, eutrophication and ground-level ozone, setting national emission ceilings to be met by 2010 for four pollutants (sulphur dioxide, nitrogen oxides, volatile organic compounds and ammonia), on the basis of scientific assessments of pollution effects and abatement options; the protocol was amended in 2012 to introduce national emission reduction commitments to be achieved by 2020, to extend its scope to fine particulate matter, and to introduce flexibilities taking into account specificities of economies in transition.51
The Paris Agreement, adopted in 2015 under the United Nations Framework Convention on Climate Change, requires all parties to prepare 'nationally determined contributions', to take measures to achieve their objectives, and to report on progress, with a view to reducing greenhouse gas emissions. Greenhouse gases covered by the Paris Agreement include methane, which is also considered as a pollutant, since it is a precursor to ground-level ozone.52
5.2.2. EU legislation Commitments taken under the updated Gothenburg Protocol (see above) have been implemented and expanded in EU legislation, through the 2016 directive on the reduction of national emissions.53 From its transposition deadline (1 July 2018), the directive replaces and repeals the 2001 National Emission Ceilings Directive.54 While maintaining the general principle of the 2001 directive (that is, caps on annual emissions of air pollutants by Member States), it added fine particulate matter to its scope. The directive aims to contribute to achieving levels of air quality that do not give rise to significant negative impacts on and risks to human health and the environment.
48 The remaining five are the 1984 Geneva Protocol on long-term financing of the cooperative programme for monitoring and evaluation of the long-range transmission of air pollutants in Europe (EMEP); the 1985 Helsinki Protocol on the reduction of sulphur emissions or their transboundary fluxes by at least 30 per cent; the 1988 Sofia Protocol concerning the control of emissions of nitrogen oxides or their transboundary fluxes; the 1991 Geneva Protocol concerning the control of emissions of volatile organic compounds or their transboundary fluxes; and the 1994 Oslo Protocol on further reduction of sulphur emissions. Except for the 1984 Geneva Protocol on financing, the other four protocols were supplemented by the 1999 Gothenburg Protocol (see below).
49 The Aarhus Protocol on persistent organic pollutants came into force in October 2003; it has 33 parties, including the European Union. In June 2018, the protocol as amended in 2009 had not yet entered into force, except for Annex V on best available techniques. Entry into force requires acceptance by two-thirds of parties (i.e. 22).
50 The Aarhus Protocol on heavy metals came into force in December 2003; it has 34 parties, including the European Union. In June 2018, the protocol as amended in 2012 had not yet entered into force, except for Annex III on best available techniques. Entry into force requires acceptance by two-thirds of parties (i.e. 23).
51 The Gothenburg Protocol came into force in May 2005; it has 27 parties, including the European Union. In June 2018, the protocol as amended in 2012 had not yet entered into force, except for Annex I on critical loads and levels. Entry into force requires acceptance by two-thirds of parties (i.e. 18).
52 The Paris Agreement came into force on 4 November 2016. In June 2018, it had 178 parties, including the European Union. 53 Directive (EU) 2016/2284 of the European Parliament and of the Council of 14 December 2016 on the reduction of
national emissions of certain atmospheric pollutants, OJ L 344, 17.12.2016. 54 Directive 2001/81/EC of the European Parliament and of the Council of 23 October 2001 on national emission ceilings
for certain atmospheric pollutants, OJ L 309, 27.11.2001.

Air quality
23
To do so, the directive sets national reduction commitments for anthropogenic emissions of five pollutants (sulphur dioxide, nitrogen oxides, non-methane volatile organic compounds, ammonia and fine particulate matter) to be met by 2020 and 2030.55 The reduction commitments, expressed as percentage compared with annual emissions in 2005, cover almost all anthropogenic emissions of the relevant pollutants.56 The directive allows Member States a number of flexibilities in the implementation of these commitments57 and gives the Commission the power to review and oppose their use.
In addition, the directive requires Member States to draw up and adopt, by 1 April 2019, a national air pollution control programme detailing policy options to meet national reduction commitments and ensuring coherence with other relevant plans, in particular on air quality standards. The programmes, to be drawn up in consultation with the public and relevant competent authorities, are to be updated at least every four years as well as in cases of non-compliance (or risk of non-compliance) with national reduction commitments.
The directive requires other actions from Member States, including drawing up annual national emission inventories covering the five pollutants subject to reduction commitments; preparing, every two years, national emission projections; monitoring impacts of air pollution on ecosystems; and actively disseminating information on control programmes and inventories among the public.
Figure 10 – National reduction commitments aggregated at EU level, compared with 2005
Source: European Parliamentary Research Service.
55 2020 and 2030 national reduction commitments are specified in Annex II of Directive (EU) 2016/2284. 2020 reduction commitments are based on the targets agreed at international level in 2012, in the amended Gothenburg Protocol.
56 A number of sources are excluded from the scope of the directive: aircraft emissions beyond take-off and landing; emissions from the Canary Islands, the French overseas departments, Madeira and the Azores (including national maritime traffic to and from these territories); emissions from international maritime traffic; and NOx and NMVOC emissions from manure management and agricultural soils.
57 Flexibilities include: adjusting national inventories to apply improved methodology; averaging emissions over three years in the event of an exceptionally cold winter or dry summer; compensating, in a limited number of cases, for non-compliance by an equivalent emission reduction for another pollutant covered by the directive; exemption from the commitment for a maximum of three years in the event of a sudden disruption in the power supply system under certain conditions.
-59%
-42%
-28%
-6%
-22%
-79%
-63%
-40%
-19%
-49%
-80%
-70%
-60%
-50%
-40%
-30%
-20%
-10%
0%
Sulphurdioxide
Nitrogenoxides
Non-methaneorganic volatile
compounds AmmoniaFine particulate
matter
2020 2030

EPRS | European Parliamentary Research Service
24
A review clause requires the Commission to review the directive by 2025, with a special focus on ammonia and mercury emissions. In addition, the Commission states its intention to further assess the impact of methane emissions on achieving the objectives of the directive.
Commitments taken under the Paris Agreement are implemented in part through the 2018 Effort Sharing Regulation setting national limits for emissions of greenhouse gases in sectors not covered by the EU emissions trading system (which include transport, buildings and agriculture) for the 2021 to 2030 period.58 Greenhouse gases covered include methane, which is also relevant in the context of air pollution.
5.3. Reducing emissions of air pollutants at specific sources Pursuant to the principle, enshrined in the Treaty on the Functioning of the European Union, that environmental damage should as a priority be rectified at source, a large number of pieces of law regulate emissions of air pollutants from specific sources. These norms have been enacted at international or European Union level. Some can be considered 'hard law' (for instance international agreements, EU regulations, EU directives or Commission regulations) while other fall within the realm of 'soft law' (for instance guidance under international agreements). Table 4 provides an overview of about 80 norms, displayed by sector, level of enactment and type of norm.
58 Regulation (EU) 2018/842 of the European Parliament and of the Council of 30 May 2018 on binding annual greenhouse gas emission reductions by Member States from 2021 to 2030 contributing to climate action to meet commitments under the Paris Agreement, OJ L 156, 19.6.2018.

Air quality
25
Table 4 – Overview of norms on air pollution sources at EU and international level, 2018
General Transport
Gothenburg protocol Fuels
Guidance on economic instruments to reduce emissions Fuel Quality Directive
Guidance on control techniques for stationary sources Sulphur Directive
Guidance on control techniques for mobile sources Stage I Petrol Vapour Recovery Directive
Kiev protocol Stage II Petrol Vapour Recovery Directive
E-PRTR Regulation Road
Regulation on the type-approval of motor vehicles
Industry, electricity and heat Regulation on cars and vans standards (Euro 5 and 6)
Industrial emissions Regulation on trucks and buses standards (Euro VI)
Industrial Emissions Directive Regulation on the approval of motorcycles
Large combustion plants* Regulation implementing Euro 5 and 6
Iron and steel production* Regulation implementing Euro VI
Ferrous metals processing * Regulation supplementing regulation on motorcycles
Non-ferrous metal industries* Sea
Refining mineral oil and gas* Convention for the prevention of pollution from ships
Emissions from storage* Technical code on NOx emissions
Tanning of hides and skins* Guidelines on convention and NOx technical code
Textiles industry* Directive on recreational craft
Glass manufacturing* Air
Production of wood-based panels* Convention on international civil aviation
Production of pulp, paper and board* Airport air quality manual
Production of cement, lime and magnesium oxide* Regulation on common rules for civil aviation
Ceramic manufacturing* Other
Food, milk and drink industries* Regulation on non-road mobile machinery
Other combustion processes Regulation on agriculture and forestry vehicles
Medium Combustion Plants Directive Regulation on environmental requirements for agriculture and forestry vehicles
Ecodesign Directive
Ecodesign for local space heaters Agriculture
Ecodesign for solid fuel boilers Directive on the reduction of national emissions
Ecodesign for solid fuel local space heaters Code for good practice regarding ammonia emissions
Ecodesign for space heaters and combination heaters Guidance on national nitrogen budgets
Energy Efficiency Directive Guidance on ammonia emissions from agriculture
Regulation on the use of animal by-products as fuel CAP regulation
Intensive rearing of poultry or pigs*
Waste
Waste Framework Directive
Waste incineration*
EU Regulation International agreement
EU Directive International guidance
European Commission legal act

EPRS | European Parliamentary Research Service
26
Note: * Best available techniques (BAT) under the Industrial Emissions Directive. 'European Commission legal act' may refer to a Commission Regulation, a Commission Implementing Decision, or a Commission Delegated Regulation. References and hyperlinks to these norms are further specified in the annex to this publication. Source: European Parliamentary Research Service.
The most relevant norms can be categorised as follows: 59
5.3.1. General The Gothenburg Protocol as amended in 201260 sets limit values for emissions of sulphur dioxide, nitrogen oxides, volatile organic compounds and fine particulate matter from stationary sources; limit values for fuels and mobile sources; and limit values for the content of volatile organic compounds in products. It also specifies measures to control ammonia emissions from agricultural sources. Relevant guidance relates to economic instruments for reducing air pollutant emissions61 as well as control techniques for stationary and mobile sources identifying best abatement options.
The 2003 Kiev Protocol on pollutant release and transfer registers requires parties to establish a pollutant release and transfer register covering 86 pollutants with a view to granting public access to the information compiled.62 It covers emissions from major point sources (for instance certain types of industries and power plants). It is implemented at EU level through the regulation on a European pollutant release and transfer register (also known as E-PRTR Regulation). The European register is published and maintained by the European Environment Agency.63
59 Full titles and hyperlinks to these norms are further specified in the annex to this publication. Norms have been grouped in broad categories according to their main relevance. When a norm is relevant for several categories, its main features are described in the category where it is deemed most relevant.
60 In June 2018, the amended version of the protocol was not yet in force. 61 The guidance identifies four categories of economic instrument: tradable permits and quotas; emission and process
taxes/charges; product charges and tax differentiation; subsidies and fiscal facilities. 62 The Kiev Protocol to the Aarhus Convention on access to information, public participation in decision-making and
access to justice in environmental matters, which came into force in 2009, has 36 parties, including the European Union.
63 European pollutant release and transfer register (E-PRTR), European Environment Agency.
Chemicals Specific pollutants
Paints Directive Toxic metals
Common waste water and waste gas management* Aarhus Protocol on heavy metals
Large volume inorganic chemicals* Guidance on control techniques for heavy metals
Large volume organic chemicals* Minamata Convention on mercury
Manufacture of organic fine chemicals* Mercury Regulation
Production of polymers* Persistent organic pollutants
Production of speciality inorganic chemical* Aarhus Protocol on persistent organic pollutants
Smitheries and foundries industry* Guidance on control techniques for POPs
Surface treatment of metals and plastics* Stockholm Convention
Surface treatment using organic solvents* Guidance on best environmental practices on POPs
Regulation on persistent organic pollutants
EU Regulation International agreement
EU Directive International guidance
European Commission legal act

Air quality
27
5.3.2. Industry, electricity and heat
Industrial emissions The main piece of EU legislation controlling sources of air pollutants is the 2010 Industrial Emissions Directive, which replaced the 2008 directive on integrated pollution prevention and control. It sets out the main principles for the permitting and control of installations based on an integrated approach64 and the application of best available techniques (see below). It also sets emission limit values for a number of installations, including large combustion plants (over 50 megawatts), waste incineration plants and installations using organic solvents. A 2014 study for the European Commission estimated that activities falling under the Industrial Emissions Directive account for 23 % by mass of emissions to air.65
A number of other installations and activities are regulated under the directive through best available techniques, which are detailed in 'Best available techniques reference documents' (also known under the 'BREF' acronym). These reference documents are drawn up and reviewed through an exchange of information between Member States, the industries concerned, environmental non-governmental organisations and the Commission, in a unique, fact-based exercise known as the 'Sevilla process'.66 Their purpose is to inform regulators about what may be technically and economically available to industry in order to improve environmental performance. The main elements of best available techniques reference documents, known as 'best available techniques conclusions' (or 'BAT conclusions') are adopted as Commission implementing decisions following approval by Member States representatives in a standing committee.67 They contain binding 'associated emission levels' linked with implemented best available techniques. They serve as a reference for setting permit conditions to installations covered by the Industrial Emissions Directive. Best available techniques decisions covering relevant sectors are listed in Table 4 above, under 'Industry, electricity and heat' (as well as under 'Waste', 'Agriculture' and 'Chemicals').
Other combustion processes The 2015 Medium Combustion Plants Directive regulates emissions of air pollutants (sulphur dioxide, nitrogen oxides and dust) from the combustion of fuels in plants with a rated thermal input between 1 and 50 megawatts.68 Emissions from combustion in smaller appliances (under 1 megawatt) are regulated under the 2009 Ecodesign Directive and the product-specific requirements established for various kinds of heaters and boilers.69 The use of unprocessed poultry manure in combustion plants under five megawatts on farms is also regulated. The Sulphur Directive (see 'Transport' below) also regulates the quality of fuels used in combustion plants. The 2012 Energy Efficiency Directive requires Member States to use energy more efficiently at all stages of the energy chain, from production to final consumption.
64 In this context, 'integrated approach' means an approach taking into account pollution of air, water and land. 65 AMEC Environment & Infrastructure UK et al., Contribution of industry to pollutant emissions to air and water,
European Commission, September 2014. 66 The Sevilla process is steered by the European Integrated Pollution Prevention and Control Bureau (EIPPCB), a branch
of the Commission's Joint Research Centre based in Seville, Spain. The process is described in detail in Commission Implementing Decision 2012/119/EU. Producing a best available techniques reference document typically takes two to three years and involves 100 to 200 experts working together in a technical working group.
67 For best available techniques established under the previous legal framework that have not yet been reviewed under the Industrial Emissions Directive, there are no BAT conclusions. BREFs are the only documents available.
68 The emission limit values set in the directive are applicable from 20 December 2018 for new plants and as of 2025 or 2030 for existing plants, depending on their size.
69 The entry into force of these requirements is scheduled as follows: local space heaters, space heaters and combination heaters, as of 2018; solid fuel boilers, as of 2020; solid fuel local space heaters, as of 2022.

EPRS | European Parliamentary Research Service
28
5.3.3. Transport
Fuels The 1998 Fuel Quality Directive (amended a number of times) sets standards for petrol and diesel used in vehicles and machinery.70 The 2016 Sulphur Directive, which replaced a 1999 directive, sets maximum sulphur content in liquid fuels used in other installations, such as combustion plants and ships.71 Two directives on the recovery of petrol vapour require measures to prevent the emissions of volatile organic compounds from petroleum derivatives (including petrol and diesel fuels). Rules relate to installations used for storing petroleum derivatives at terminals and distributing them to service stations (the so-called 'Stage I Directive') and for refuelling vehicles at service stations (the so called 'Stage II Directive').
Road72 The 2018 regulation on the type-approval of motor vehicles sets the general framework for approving and checking new vehicles types, including as regards emissions.73 Since the early 1990s, the EU has adopted successive (and increasingly stringent) 'Euro' standards on the emission of air pollutants by motor vehicles.74 Current standards are set in the 2007 regulation on standards for cars and vans (known as 'Euro 5 and 6 Regulation'), the 2009 regulation on standards for trucks and buses (known as 'Euro VI Regulation'), and the 2013 regulation on the approval of motorcycles. Standards relate to several pollutants, including particulate matter, nitrogen oxides and carbon monoxide. For nitrogen oxides, the Euro 5 and 6 Regulation differentiates between petrol and diesel vehicles.75
Three Commission regulations implement these provisions in detail, including as regards testing. To address the gap highlighted by the Volkswagen case in 2015 between emissions measured in laboratory tests and on the road, new methods for measuring vehicle emissions were introduced in 2017: a 'real driving emissions' (RDE) procedure complements laboratory tests for measuring nitrogen oxides and particulate number. The regulation implementing the Euro 5 and 6 Regulation establishes 'not-to-exceed limits' for nitrogen oxides on the basis of Euro 6 emission limits (80 mg/km) multiplied by a 'conformity factor', with a view to gradually reducing the gap between type-approval and on-road emissions.76 In addition, since September 2017, the driving cycle used as a basis for laboratory tests, the outdated 'New European driving cycle' (NECD), has been replaced with
70 The Fuel Quality Directive sets maximum sulphur content in petrol and diesel at 10 mg/kg; maximum lead content in petrol at 0.05 g/l; and maximum polycyclic aromatic hydrocarbons content in diesel at 8 % by mass.
71 The Sulphur Directive sets a maximum sulphur content of 1 % by mass in heavy fuel oils and 0.1 % by mass in gas oil. As regards marine fuels, the directive sets limits reflecting the values agreed at international level: 3.5 % by mass (0.5 % by mass as of 2020) in marine fuels used in territorial seas, exclusive economic zones and pollution control zones of Member States; and 0.1 % by mass in 'emission control areas' (see below for more details).
72 Provisions related to emissions of carbon dioxide, which is not an air pollutant but a greenhouse gas, are not mentioned here.
73 The Type-Approval Regulation requires national market surveillance authorities to check 1 in 40 000 vehicles registered in the country the previous year, with at least 20 % of tests to be emissions-related.
74 For instance, the limit for particulate matter emissions from cars has shrunk from 140 mg/km to 5 mg/km, while the limit for nitrogen oxides has dropped from 970 mg/km to 80 and 60 mg/km (for diesel and petrol cars respectively).
75 For more details on Euro 6/VI standards currently in place, see M. Williams and R. Minjares, A technical summary of Euro 6/VI vehicle emission standards, The International Council on Clean Transportation, 2016.
76 Since 2017, the conformity factor is set at 2.1 (i.e. allowing 168 mg/km). From 2020 onwards, it is set at 1.43 (i.e. allowing 114 mg/km), leaving a margin for measurement errors. The Commission intends to review the conformity factor with the aim of bringing it down to 1 (i.e. allowing 80 mg/km) at the latest by 2023.

Air quality
29
the 'world harmonised light vehicle test procedure' (WLTP), a driving cycle developed at UNECE level that provides a better reflection of real emissions.77
Sea The International convention for the prevention of pollution from ships, widely known as the MARPOL convention,78 limits in its Annex VI emissions of air pollutants from ships, including sulphur oxides, particulate matter and nitrogen oxides.79 It also regulates shipboard incineration and emissions of volatile organic compounds from tankers. The convention establishes several emission control areas where requirements are stricter. Currently, there are two emission control areas in European waters: one in the Baltic Sea, and the other in the North Sea and English Channel.80 Provisions on nitrogen oxides are further detailed in the 2008 NOx technical code. Several guidance documents address the application and implementation of the revised MARPOL Annex VI and NOx technical code. The Sulphur Directive (mentioned above) implements some provisions from the MARPOL convention in EU law.
The 2013 directive on recreational craft, which replaces a 1994 directive, sets exhaust emission limits for several air pollutants (including nitrogen oxides, particulate matter, carbon monoxide and hydrocarbons) depending on engine type.
Air The Convention on international civil aviation, known as the Chicago Convention,81 sets (in its Annex 16 on environmental protection) aircraft engine emissions standards. They establish limits for emissions of nitrogen oxides, carbon monoxide and hydrocarbons,82 as well as provisions regarding smoke and vented fuel. A standard for non-volatile particulate matter applies to engines manufactured as of 2020. In addition, the 2011 Airport Air Quality Manual provides guidelines for the convention's parties on best practices with respect to airport-related air quality. The 2018 regulation on common rules for civil aviation translates the environmental requirements set out in the Chicago Convention into EU law.
77 The Commission recommendation of 31 May 2017 on the use of fuel consumption and CO2 emission values type-approved and measured in accordance with the World Harmonised Light Vehicles Test Procedure when making information available for consumers pursuant to Directive 1999/94/EC of the European Parliament and of the Council, C(2017) 3525, European Commission, May 2017.
78 The MARPOL convention was adopted in 1973 under the auspices of the International Maritime Organisation (IMO), a specialised agency of the United Nations; it came into force in 1983. Annex VI on the prevention of air pollution from ships, first adopted in 1997, entered into force in 2005. A revised version of MARPOL Annex VI was adopted in 2008 and entered into force in 2010.
79 The MARPOL convention limits the sulphur content in marine fuels to 3.5 % by mass since 2012. As of 2020, the limit will be brought down to 0.5 % by mass, as decided by the Marine Environment Protection Committee in October 2016 (MEPC.280(70)). Ships equipped with an approved equivalent arrangement (an exhaust gas cleaning system, also known as a 'scrubber') may still use fuels with higher sulphur content. As regards emissions of nitrogen oxides, the convention sets different levels of control according to the ship construction date and the engine's power.
80 In emission control areas, the sulphur content in marine fuels is limited to 0.1 % by weight since 2015, unless the ship is fitted with an approved exhaust gas cleaning system. In the future, requirements related to nitrogen oxides will also apply in the two European emission control areas: ships built as of 2021 will have to meet stricter standards (known as Tier III) to sail in the Baltic and North Seas.
81 The Chicago Convention was adopted in 1944 and has been in effect since 1947. It is managed by the International Civil Aviation Organisation (ICAO), a specialised agency of the United Nations. Annex 16, Volume II on aircraft engine emissions was first adopted in 1981 and updated in 1993, 2008 and 2017.
82 As aircraft engine emission standards are primarily designed to respond to concerns regarding air quality in the vicinity of airports, they apply for a reference landing and take-off cycle below 915 metres of altitude (3000 feet).
EPRS | European Parliamentary Research Service
30
Other The 2016 regulation on non-road mobile machinery, which replaces a 1997 directive, sets emission limits for carbon monoxide, hydrocarbons, nitrogen oxides and particulate matter emitted by machinery powered by combustion engines.83 The 2013 regulation on the approval of agriculture and forestry vehicles lays down the general framework for approving these vehicles, while a 2015 Commission regulation sets requirements for their environmental performance.
5.3.4. Agriculture The 2016 directive on the reduction of national emissions sets mandatory and optional measures to reduce ammonia emissions, aligned with Gothenburg Protocol requirements and guidance (code for good practice regarding ammonia emissions, as well as guidance documents on national nitrogen budgets and on ammonia emissions from agriculture). The 2013 regulation on the common agricultural policy creates financial incentives for farmers not to burn agricultural wastes.84 The intensive rearing of poultry or pigs is regulated by best available techniques under the Industrial Emissions Directive.
5.3.5. Waste The 2008 Waste Framework Directive (last updated in 2018) lays down the general principles of waste management, in particular the polluter pays principle and the waste hierarchy, with some implications as regards emissions of air pollutants from waste treatment. Waste incineration is subject to a best available techniques reference document under the Industrial Emissions Directive.
5.3.6. Chemicals Emissions of volatile organic compounds from paints are regulated under the 2004 Paints Directive, which sets maximum allowed content of volatile organic compounds in paints and varnishes. Specific production and treatment processes (listed in Table 4 above) are subject to best available techniques reference documents under the Industrial Emissions Directive.
5.3.7. Specific pollutants
Toxic metals The Aarhus Protocol on heavy metals sets limit values and lists best available techniques for emissions of cadmium, lead and mercury from stationary sources; it also introduces measures to lower heavy metal emissions from other products. The protocol is further supported by guidance on best available techniques. On mercury, the Minamata Convention requires among other things parties to phase out or reduce mercury use in a number of products and processes, and control emissions to air.85 The 2017 regulation on mercury translates the convention into EU law and sets out further requirements, in particular as regards the permanent storage of mercury waste.
83 The regulation on non-road mobile machinery applies to small handheld equipment (such as chainsaws, hedge-trimmers and leaf-blowers), construction machinery, generator sets, railcars, locomotives and inland waterway vessels. Agriculture and forestry vehicles are covered by separate legislation.
84 Under the cross-compliance system, payments to farmers are partially linked to compliance with certain rules. One of them, Good Agricultural and Environmental Conditions 6 (GAEC 6) relates to 'maintenance of soil organic matter level through appropriate practices including ban on burning arable stubbles, except for plant health reasons'.
85 The Minamata Convention on mercury was signed in 2013 under the auspices of the United Nations Environment Programme; it came into force in August 2017. In June 2018, it had 94 parties, including the European Union.

Air quality
31
Persistent organic pollutants The Aarhus Protocol on persistent organic pollutants aims to eliminate any discharges, emissions and losses of certain substances86 by banning some of them, planning to phase out others, and laying down specific limit values for the incineration of municipal, hazardous and medical waste. Guidance on best available techniques to control emissions of persistent organic pollutants further supports the protocol. Building on the Aarhus Protocol, the Stockholm Convention on persistent organic pollutants applies at global level.87 The convention requires parties to identify and manage stockpiles and wastes containing persistent organic pollutants so as to reduce emissions of these substances. It also promotes the use of best available techniques and best environmental practices for preventing emissions. The 2004 regulation on persistent organic pollutants implements these international agreements in the EU. It contains provisions regarding production, placing on the market and use of chemicals, management of stockpiles and waste, and measures to reduce unintentional releases of persistent organic pollutants.
6. Implementation of EU legislation Implementing key pieces of EU legislation on air quality has proved difficult. One of the reasons for this is the complexity underlying this policy area. There is a multiplicity of sources of air pollutants and economic sectors involved. There are also many air pollutants, which may combine to create secondary pollutants. In addition, air quality is influenced by elements that are beyond control, such as geography, weather conditions (including sunlight), natural sources of emissions and anthropogenic sources outside Europe. As a result, emission reductions do not necessarily produce a corresponding drop in atmospheric concentrations, especially for secondary pollutants such as ozone and particulate matter. The European Environment Agency notes that although reducing emissions is key to reducing concentrations, one cannot expect particulate matter concentrations
86 The Aarhus Protocol initially identified 16 substances as persistent organic pollutants (POPs) and added seven new substances in 2009 (ratification still pending). The substances comprise pesticides, industrial chemicals and by-products/contaminants.
87 The Stockholm Convention was adopted in 2001 under the auspices of the United Nations Environment Programme; it came into force in May 2004. In June 2018, it had 182 parties worldwide, including the European Union. To its initial list of 12 POPs, the Stockholm Convention has added 14 new substances over the years (ratification still pending for three of them).
European Union funding for air quality The European Court of Auditors estimates that for the 2014 to 2020 period, the European structural and investment funds made available €1.6 billion (0.45 % of funds) for measures contributing directly or indirectly to better air quality. In addition, the framework programme for research and innovation, Horizon 2020, awarded up to €13 billion (16 % of funds) to projects dealing directly or indirectly with air quality. Under the LIFE programme for environment and climate action, €1.1 billion (a third of funds available over the 2014 to 2020 period) were allocated between 2014 and 2017 to environmental aspects, which includes among other things projects related to air quality. On example is the 'Małopolska in a healthy atmosphere' project helping implement the Małopolska region's air quality plan. In addition, the Commission proposed to invest €1 billion in 39 clean transport projects related to rail and alternative fuel infrastructure.
Sources: Audit brief: Air quality in the EU, European Court of Auditors, September 2017; Communication on a Europe that protects: Clean air for all, COM(2018) 330, European Commission, May 2018.
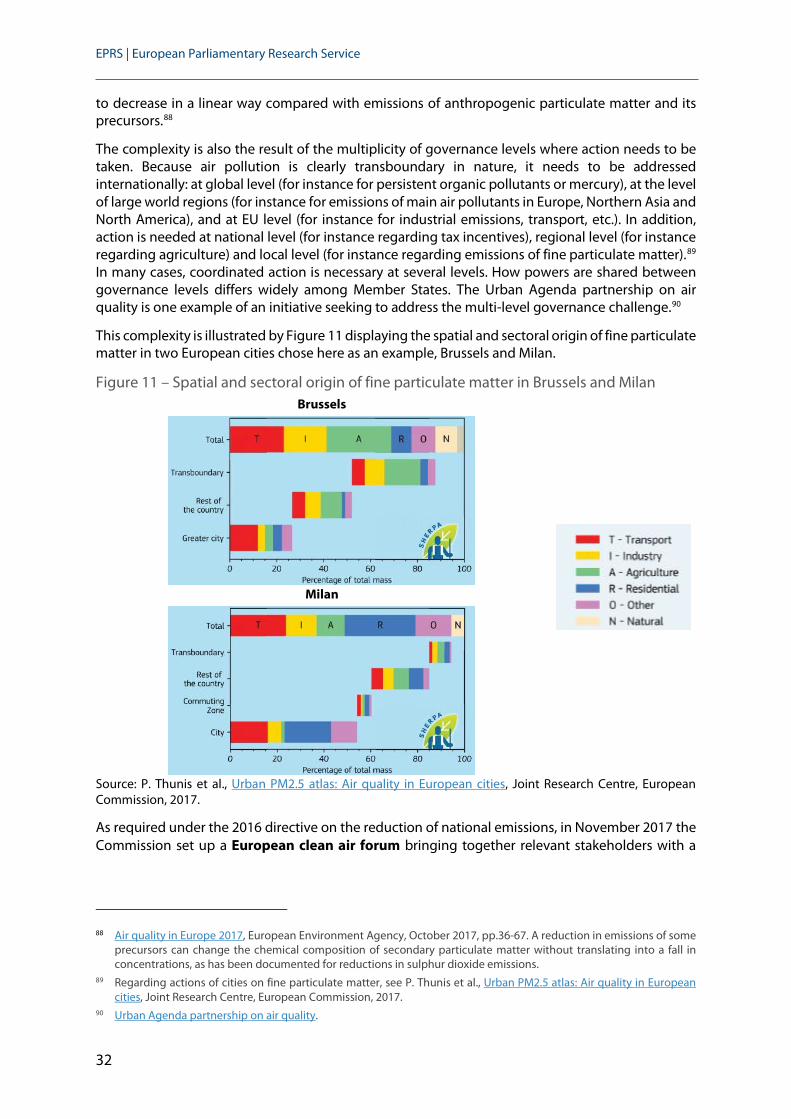
EPRS | European Parliamentary Research Service
32
to decrease in a linear way compared with emissions of anthropogenic particulate matter and its precursors.88
The complexity is also the result of the multiplicity of governance levels where action needs to be taken. Because air pollution is clearly transboundary in nature, it needs to be addressed internationally: at global level (for instance for persistent organic pollutants or mercury), at the level of large world regions (for instance for emissions of main air pollutants in Europe, Northern Asia and North America), and at EU level (for instance for industrial emissions, transport, etc.). In addition, action is needed at national level (for instance regarding tax incentives), regional level (for instance regarding agriculture) and local level (for instance regarding emissions of fine particulate matter).89 In many cases, coordinated action is necessary at several levels. How powers are shared between governance levels differs widely among Member States. The Urban Agenda partnership on air quality is one example of an initiative seeking to address the multi-level governance challenge.90
This complexity is illustrated by Figure 11 displaying the spatial and sectoral origin of fine particulate matter in two European cities chose here as an example, Brussels and Milan.
Figure 11 – Spatial and sectoral origin of fine particulate matter in Brussels and Milan Brussels
Milan
Source: P. Thunis et al., Urban PM2.5 atlas: Air quality in European cities, Joint Research Centre, European Commission, 2017.
As required under the 2016 directive on the reduction of national emissions, in November 2017 the Commission set up a European clean air forum bringing together relevant stakeholders with a
88 Air quality in Europe 2017, European Environment Agency, October 2017, pp.36-67. A reduction in emissions of some
precursors can change the chemical composition of secondary particulate matter without translating into a fall in concentrations, as has been documented for reductions in sulphur dioxide emissions.
89 Regarding actions of cities on fine particulate matter, see P. Thunis et al., Urban PM2.5 atlas: Air quality in European cities, Joint Research Centre, European Commission, 2017.
90 Urban Agenda partnership on air quality.

Air quality
33
view to improving the implementation of EU air quality legislation.91 In addition, the Commission is holding 'clean air dialogues' with Member States to support their implementation efforts.
Air quality standards Data collected by Member States and published by the European Environment Agency provide a picture of the compliance with limit values and the attainment of target values in 2015, the last year for which data is available (see also Figure 12):
Particulate matter concentrations were, as in previous years, above the relevant limit values in large parts of Europe; 19 % of measuring stations (primarily located in urban or suburban areas) in 20 Member States reported concentrations above the daily limit.
Fine particulate matter concentrations were higher than the annual limit value in some air quality zones in three Member States. Exceedances occurred primarily in urban and suburban areas. Four Member States (Bulgaria, Croatia, Hungary and Poland) were deemed to have not met the PM2.5 exposure concentration obligation. Thirteen Member States have already met their exposure reduction targets.
Nitrogen dioxide concentrations above the annual limit value were recorded in 10.5 % of measuring stations in 22 Member States, while concentrations above the daily limit value were reported in 0.9 % of stations in six Member States. Exceedances occurred primarily at traffic measuring stations.
Ozone concentrations above the target value and above the 25 permitted exceedances were registered in 18 Member States. Only 13 % of all stations met the long-term objective set for the protection of vegetation.92
Benzo(a)pyrene concentrations above the target value were reported at 32 % of measurement stations in 14 Member States, mostly in central and eastern Europe.93
Concentrations of sulphur dioxide, carbon monoxide and benzene were generally well below limit values. Concentrations of toxic metals above target values are highly localised and typically related to specific industrial plants.
91 The European clean air forum was launched at an event held in Paris. For more information see Clean Air Forum: Summary Report, European Commission, 2018.
92 In contrast to other pollutants, ozone concentrations are generally highest in rural locations and lowest in traffic locations, where ozone is depleted by deposition and reaction with freshly emitted NOx.
93 This is primarily attributed to the domestic combustion of coal and wood in this region.
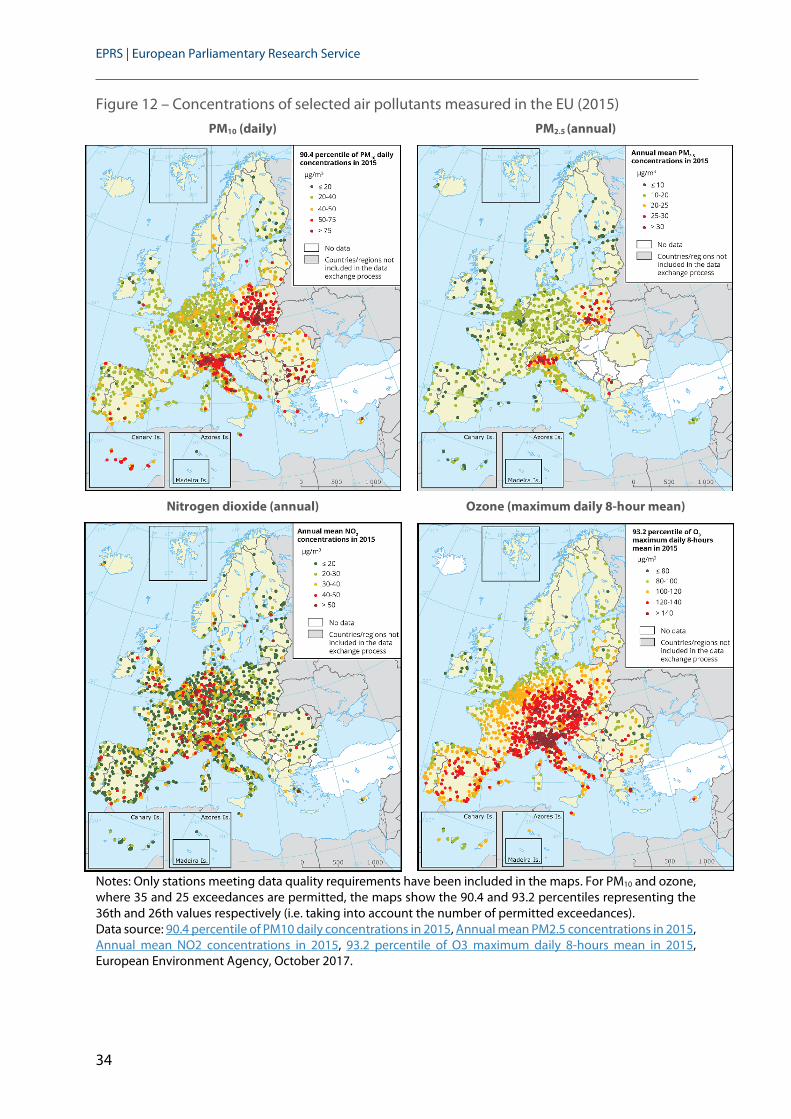
EPRS | European Parliamentary Research Service
34
Figure 12 – Concentrations of selected air pollutants measured in the EU (2015)
Notes: Only stations meeting data quality requirements have been included in the maps. For PM10 and ozone, where 35 and 25 exceedances are permitted, the maps show the 90.4 and 93.2 percentiles representing the 36th and 26th values respectively (i.e. taking into account the number of permitted exceedances). Data source: 90.4 percentile of PM10 daily concentrations in 2015, Annual mean PM2.5 concentrations in 2015, Annual mean NO2 concentrations in 2015, 93.2 percentile of O3 maximum daily 8-hours mean in 2015, European Environment Agency, October 2017.
PM10 (daily) PM2.5 (annual)
Nitrogen dioxide (annual) Ozone (maximum daily 8-hour mean)

Air quality
35
In a review of the implementation of EU environmental legislation published in 2017,94 the European Commission noted that 23 out of 28 Member States did not fully comply with air quality limit values, with adverse impacts on health, environment and the economy.95 A 2016 study on the implementation of the Ambient Air Quality Directive notes that particulate matter exceedances are mainly caused by the combustion of solid fuels (such as coal and wood) for domestic heating, traffic, industry, and contributions from secondary (transboundary) particles, while nitrogen dioxide exceedances are primarily caused by diesel vehicles.96
In addition, a number of weaknesses may be identified in the current legal framework. EU standards are considerably weaker than WHO reference values, especially for sulphur dioxide but also for (fine) particulate matter (see Table 2 above for more details). As a result, as illustrated in Figure 13, the share of the urban population exposed to levels above WHO reference values remains high. In addition, although the Ambient Air Quality Directive requires Member States to draw up air quality plans in the event of exceedances, these may not be always acted upon. Finally, although provisions regulate the location of monitoring stations, a margin of manoeuvre remains, which may have impacts on measurements.
Figure 13 – Percentage of EU28 urban population exposed to air pollutant concentrations above certain EU and WHO air quality standards (2015)
Source: Air quality in Europe 2017, European Environment Agency, October 2017.
In some cases, citizens are actively contributing to the implementation of the Ambient Air Quality Directives. An example of grassroots initiative is the 'Polish smog alert' network of associations active in over 20 Polish cities,97 which has raised awareness about air pollution, contributing to the enactment of a ban on wood and coal burning in domestic low power boilers in Kraków as of 2019. Citizens are also being involved in data collection, which may complement official data.98 One
94 The EU Environmental Implementation Review: Common challenges and how to combine efforts to deliver better results, European Commission, COM (2017)63, February 2017. Country-specific reports are also available. For more details, see also A. Altmayer, Environmental implementation review: Initial findings, EPRS, European Parliament, March 2017.
95 Member States fully compliant with air quality limit values were Cyprus, Estonia, Ireland, Latvia and Malta. 96 C. Nagl et al., Implementation of the Ambient Air Quality Directive, Policy Department A, European Parliament,
April 2016. 97 Polish smog alert. 98 On this aspect, the European Commission's Joint Research Centre notes however that low-cost sensors provide
unreliable data. See Measuring air pollution with low-cost sensors, Joint Research Centre, 2017.
0
20
40
60
80
100
PM2.5 PM10 ozone nitrogen dioxide BaP sulphur dixide
EU reference value WHO air quality guideline

EPRS | European Parliamentary Research Service
36
example is the CurieuzeNeuzen initiative in Flanders (Belgium), in which 20 000 citizens measure the air quality near their home.99
The European Commission has been pursuing infringement procedures against 16 Member States for persistently exceeding particulate matter limit values.100 In recent rulings, the Court of Justice of the European Union found that some Member States had failed to fulfil their obligations under the Ambient Air Quality Directive: in April 2017, the Court found that Bulgaria had 'systematically and continuously' exceeded the daily and annual limit values for particulate matter concentrations from 2007 until 2014;101 in February 2018, the Court found that from 2007 until 2015, Poland had exceeded the daily and annual limit values in 35 and 9 air quality zones, respectively.102 In judgments issued in 2011 and 2012, the Court also found that Italy, Portugal, Slovenia and Sweden had failed to meet their obligations as regards particulate matter concentrations under the earlier 1999 directive.103
The European Commission has been pursuing infringement procedures against 13 Member States for persistently exceeding nitrogen dioxide limit values,104 as well as one infringement procedure against Bulgaria for exceeding sulphur dioxide limit values.
In May 2018, the European Commission referred six new cases to the Court of Justice of the EU: Hungary, Italy, and Romania over persistently high levels of particulate matter, and France, Germany, and the United Kingdom over concentrations of nitrogen dioxide.105
National emissions Progress in meeting the 2010 emission ceilings set in the 2001 National Emission Ceilings Directive has been slow. Data published by the European Environment Agency106 indicates that in 2016, although ceilings for the four pollutants covered by the directive (nitrogen oxides, non-methane volatile organic compounds, sulphur dioxide and ammonia) were met when aggregated at EU level, six Member States exceeded their 2010 ceilings for one or more pollutants,107 as shown in Figure 14.
99 CurieuzeNeuzen Vlaanderen. 100 Belgium, Bulgaria, Czech Republic, Germany, Greece, France, Hungary, Italy, Latvia, Poland, Portugal, Romania,
Slovakia, Slovenia, Spain, and Sweden. 101 Judgment of 5 April 2017 in case C-488/15 (European Commission v. Republic of Bulgaria). 102 Judgment of 22 February 2018 in case C-336/16 (European Commission v. Republic of Poland). 103 Judgment of 19 December 2012 in case C-68/11 (European Commission v. Italian Republic); judgment of 15 November
2012 in case C-34/11 (European Commission v. Portuguese Republic); judgment of 24 March 2011 in case C-365/10 (European Commission v. Republic of Slovenia); judgment of 10 May 2011 in case C-479/10 (European Commission v. Kingdom of Sweden).
104 Austria, Belgium, Czech Republic, Germany, Denmark, France, Hungary, Italy, Luxembourg, Poland, Portugal, Spain and United Kingdom.
105 This followed a high-profile air quality ministerial summit convened by the European Commissioner for environment, Karmenu Vella, in January 2018, as a final effort to find solutions to address the exceedances in nine Member States. The Commission estimated that these six Member States did not present credible, effective and timely measures to reduce pollution; in contrast, it found that the Czech Republic, Slovakia and Spain had put in place or planned measures able to appropriately tackle the identified gaps, if correctly implemented.
106 NEC Directive reporting status 2018, European Environment Agency, July 2018. 107 For all years from 2010 to 2015, six Member States have persistently exceeded their respective emission ceilings for
nitrogen oxides (Austria, Belgium, France, Germany, Ireland and Luxembourg), three for non-methane volatile organic compounds (Denmark, Germany and Ireland) and six for ammonia (Austria, Denmark, Finland, Germany, Spain and Sweden). No Member State exceeded its sulphur dioxide ceiling. Adjustment applications were submitted by nine Member States in 2017 (Austria, Belgium, Denmark, Finland, France, Germany, Ireland, Luxembourg and Spain) and four Member States in 2018 (Austria, Hungary, Ireland and the United Kingdom). These applications are being reviewed by the European Commission. If the adjustments are approved, the number of Member States exceeding one or more emission ceilings in 2016 is expected to decrease from six to four, with emissions from Hungary and Ireland falling below all of their respective ceilings.
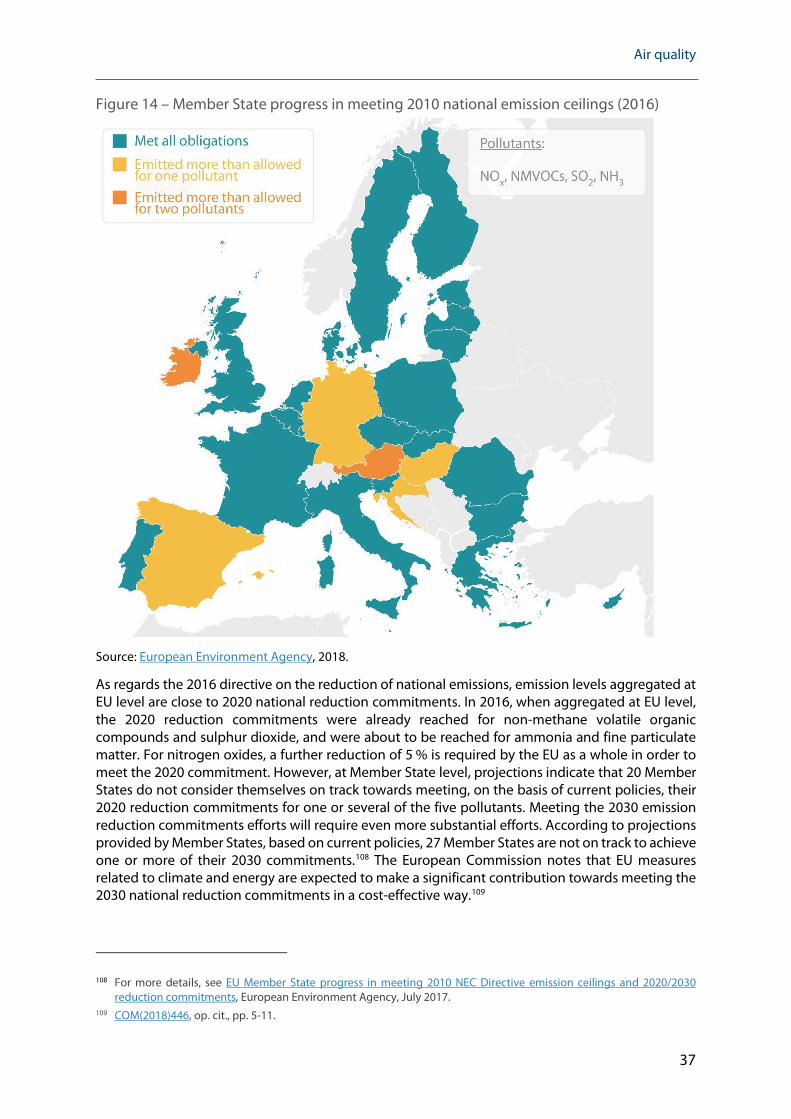
Air quality
37
Figure 14 – Member State progress in meeting 2010 national emission ceilings (2016)
Source: European Environment Agency, 2018.
As regards the 2016 directive on the reduction of national emissions, emission levels aggregated at EU level are close to 2020 national reduction commitments. In 2016, when aggregated at EU level, the 2020 reduction commitments were already reached for non-methane volatile organic compounds and sulphur dioxide, and were about to be reached for ammonia and fine particulate matter. For nitrogen oxides, a further reduction of 5 % is required by the EU as a whole in order to meet the 2020 commitment. However, at Member State level, projections indicate that 20 Member States do not consider themselves on track towards meeting, on the basis of current policies, their 2020 reduction commitments for one or several of the five pollutants. Meeting the 2030 emission reduction commitments efforts will require even more substantial efforts. According to projections provided by Member States, based on current policies, 27 Member States are not on track to achieve one or more of their 2030 commitments.108 The European Commission notes that EU measures related to climate and energy are expected to make a significant contribution towards meeting the 2030 national reduction commitments in a cost-effective way.109
108 For more details, see EU Member State progress in meeting 2010 NEC Directive emission ceilings and 2020/2030 reduction commitments, European Environment Agency, July 2017.
109 COM(2018)446, op. cit., pp. 5-11.

EPRS | European Parliamentary Research Service
38
In March 2017, Poland brought legal action to the Court of Justice of the European Union against the co-legislators – European Parliament and Council – seeking annulment of the 2016 directive on the reduction of national emissions. It argues among other things that the process of setting national reduction levels was unfair, lacked transparency and was not sufficiently substantiated.110
Sources of emissions European legislation on sources of air pollution has been a key driver behind the significant fall in emissions of air pollutants recorded in recent decades.111
In its review of the implementation of EU environmental legislation, the European Commission suggested a number of actions on pollution sources to implement EU air quality legislation: addressing solid fuel burning by domestic users and agricultural waste burning in order to reduce particulate matter emissions, issuing industrial permits going beyond best available techniques requirements, implementing strategic urban mobility plans, taking specific measures related to diesel vehicles (for instance introducing progressively stringent low emission zones in inner city areas or phasing out preferential tax treatment) in order to achieve compliance as regards nitrogen dioxide, and removing environmentally harmful subsidies such as tax advantages for privately used company cars.112 Measures suggested by the Commission for each Member State are displayed in Figure 15. The 2016 study on the implementation of the Ambient Air Quality Directive suggests a few additional actions: coordinating measures on solid fuel burning with renovation schemes to improve energy efficiency; carrying out inspections of industrial facilities more frequently; and possibly banning diesel vehicles from inner city areas.113
110 Action brought on 10 March 2017 in case C-128/17 (Republic of Poland v. European Parliament and Council of the European Union).
111 As described in Section 2.3 'Anthropogenic sources by sector'. 112 COM (2017)63, op. cit. 113 C. Nagl et al., op. cit.
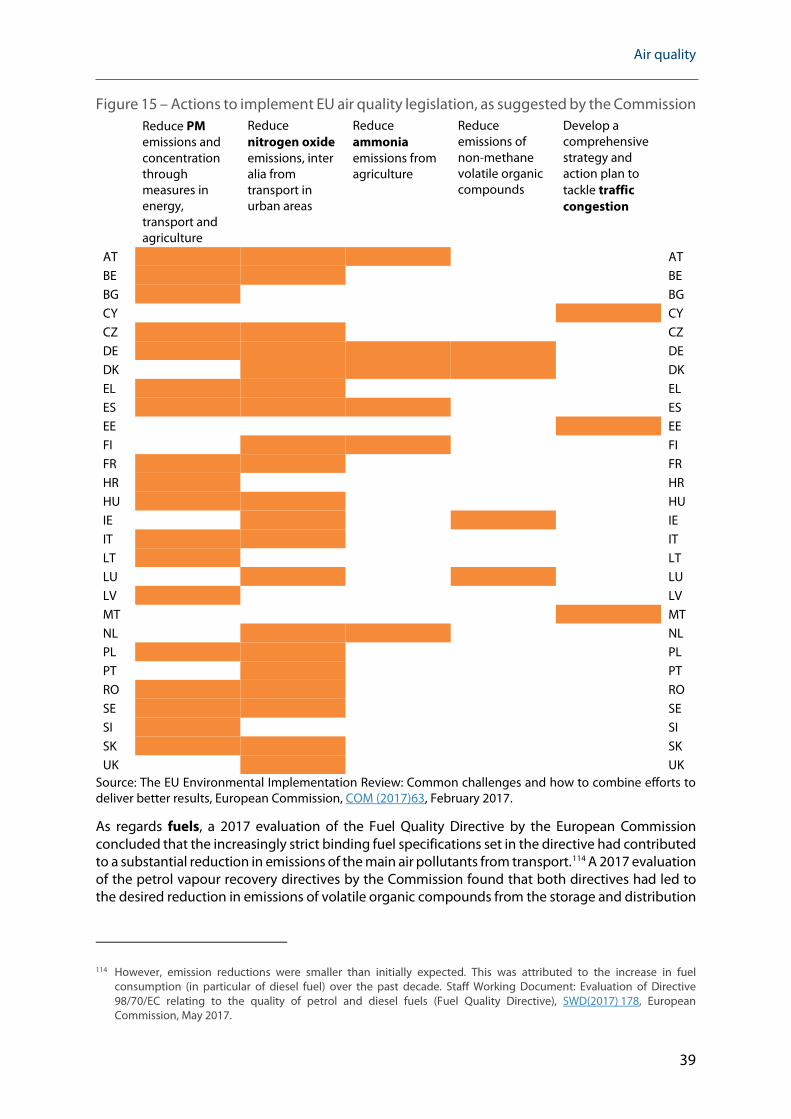
Air quality
39
Figure 15 – Actions to implement EU air quality legislation, as suggested by the Commission
Reduce PM emissions and concentration through measures in energy, transport and agriculture
Reduce nitrogen oxide emissions, inter alia from transport in urban areas
Reduce ammonia emissions from agriculture
Reduce emissions of non-methane volatile organic compounds
Develop a comprehensive strategy and action plan to tackle traffic congestion
AT x x x AT BE x x BE BG x BG CY x CY CZ x x CZ DE x x x x DE DK x x x DK EL x x EL ES x x x ES EE x EE FI x x FI FR x x FR HR x HR HU x x HU IE x x IE IT x x IT LT x LT LU x x LU LV x LV MT x MT NL x x NL PL x x PL PT x PT RO x x RO SE x x SE SI x SI SK x x SK UK x UK
Source: The EU Environmental Implementation Review: Common challenges and how to combine efforts to deliver better results, European Commission, COM (2017)63, February 2017.
As regards fuels, a 2017 evaluation of the Fuel Quality Directive by the European Commission concluded that the increasingly strict binding fuel specifications set in the directive had contributed to a substantial reduction in emissions of the main air pollutants from transport.114 A 2017 evaluation of the petrol vapour recovery directives by the Commission found that both directives had led to the desired reduction in emissions of volatile organic compounds from the storage and distribution
114 However, emission reductions were smaller than initially expected. This was attributed to the increase in fuel consumption (in particular of diesel fuel) over the past decade. Staff Working Document: Evaluation of Directive 98/70/EC relating to the quality of petrol and diesel fuels (Fuel Quality Directive), SWD(2017) 178, European Commission, May 2017.
EPRS | European Parliamentary Research Service
40
of petroleum derivatives, which now account for only 0.7 % of all anthropogenic emissions of volatile organic compounds in the EU.115
As regards emissions of motor vehicles, the follow-up to the Volkswagen case116 publicly highlighted an established fact: on-road nitrogen oxide emissions from Euro 6 diesel cars were approximately two to five times higher than their type-approval standards.117 A number of studies subsequently confirmed exceedances in on-road emissions (at varying levels) for a significant number of Euro 6 diesel vehicle types and brands.118 Technologies to control nitrogen oxide emissions from diesel engines exist, although their cost and efficiency vary.119 According to a 2016 report by the European Environment Agency, the gap between emissions in the laboratory and on the road is mainly due to three factors: 1) an outdated test procedure, the 'new European driving cycle' (NEDC), which did not reflect real driving emissions; 2) flexibilities in the procedure allowing manufacturers to optimise performance (for example, by reducing vehicle mass, adjusting brakes, over-inflating tyres or using standard values); and 3) in-use factors depending on the driver (such as driving style) or other aspects (such as temperature).120
Meanwhile, laboratory tests are based on a new driving cycle (the 'world harmonised light vehicle test procedure' or WLTP). They have also been complemented by 'real driving emissions' (RDE) tests, with a view to closing the gap between laboratory and on-road emissions, especially as regards nitrogen oxide emissions from Euro 6 diesel vehicles. However, research suggests that the WLTP driving cycle may not adequately represent real-world driving emissions121 and that a number of special but not necessarily uncommon situations fall outside the conditions specified in EU legislation on real driving emissions tests.122 As a result, a gap between type-approval emissions and real-world emissions could persist.
To ensure compliance with vehicle emission standards, the European Commission has asked Member States to conduct vehicle recalls. It has also launched infringement procedures against eight Member States regarding the absence of penalty systems or the non-application of penalties.123
115 Staff working document: REFIT evaluation of Directive 94/63/EC on the control of volatile organic compound (VOC) emissions resulting from the storage of petrol and its distribution from terminals to service stations and Directive 2009/126/EC on Stage II petrol vapour recovery during refuelling of motor vehicles at service stations, SWD(2017) 65, European Commission, February 2017.
116 In September 2015, Volkswagen was found to have been cheating emission tests on its diesel cars in the United States, by using so-called 'defeat devices'. For more details, see D. Bourguignon, Vehicle emission tests: beyond the VW case, EPRS, European Parliament, October 2015.
117 In contrast, petrol vehicles broadly met Euro standards under real driving conditions. See M. Weis et al., A complementary emissions test for light-duty vehicles: Assessing the technical feasibility of candidate procedures, European Commission Joint research Centre, 2013; and N. Ligterink et al., Investigations and real world emission performance of Euro 6 light-duty vehicles, TNO for Dutch ministry of infrastructure and the environment, December 2013.
118 See for instance Rapport final de la commission indépendante mise en place par la Ministre Ségolène Royal après la révélation de l'affaire Volkswagen, French ministry for the environment, energy and the sea, July 2016.
119 The three main technologies are: inner-engine modifications coupled with exhaust gas recirculation (EGR); lean-burn NOX adsorbers (also called lean NOx traps, or LNTs); and selective catalytic reduction (SCR). For more details, see L. Yang et al., NOx control technologies for Euro 6 diesel passenger cars: Market penetration and experimental performance assessment, International Council on Clean Transportation, September 2015.
120 Explaining road transport emissions: a non-technical guide, European Environment Agency, January 2016. 121 New emissions certification test for cars could be improved, study concludes, Science for Environment Policy,
European Commission, February 2015. 122 P. van Mensch et al., Assessment of risks for elevated NOx emissions of diesel vehicles outside the boundaries of RDE,
TNO for Dutch ministry of infrastructure and the environment, July 2017. 123 Czech Republic, Germany, Greece, Italy, Lithuania, Luxembourg, Spain and United Kingdom.

Air quality
41
In May 2018, the cities of Paris, Brussels and Madrid brought legal action before the Court of Justice of the European Union against the European Commission over the 2016 Real Driving Emissions Regulation124 setting conformity factors and implementation deadlines related to emission test from motor vehicles (for more details, see section 5.3.3. Transport).125 The Court of Justice is expected to decide on the admissibility of the action.
As regards maritime transport, a 2018 report by the European Commission indicated that the 0.1 % limit on the sulphur content of marine fuels used in emission control areas was widely complied with and had led to a significant reduction of sulphur dioxide concentrations in ambient air in coastal regions bordering the emission control areas.126 However, the use of high sulphur fuels and exhaust gas cleaning systems (scrubbers), allowed under the directive and the MARPOL convention,
124 Commission Regulation (EU) 2016/646 of 20 April 2016 amending Regulation (EC) No 692/2008 as regards emissions from light passenger and commercial vehicles (Euro 6), OJ L 109, 26.4.2016.
125 Pollution automobile : des villes attaquent la Commission européenne en justice, La Tribune, 15.5.2018. 126 Report on implementation and compliance with the sulphur standards for marine fuels set out in
Directive (EU) 2016/802 relating to a reduction in the sulphur content of certain liquid fuels, COM(2018) 188, European Commission, April 2018. The compliance rate was 93 % of inspected ships. Reductions in SO2 concentrations were recorded as follows: -60 % in Denmark, -50 % at the German North Sea island 'Neuwerk', the Swedish islands of Öland (Ottenby) and Gotland (Hoburgen), and over -20 % in the Rotterdam-Rijnmond region.
Climate and air policies: synergies and trade-offs A series of synergies exist between the two policy areas. Because climate and energy efficiency policies are aimed not least at reducing the consumption of fossil fuels, they also lower emissions of air pollutants. In addition, reducing emissions of black carbon and methane brings benefits in terms of air quality, but also co-benefits as regards climate mitigation.
However, there are also potential trade-offs between the two policy areas. Because aerosols (a component of particulate matter) have cooling effects, a reduction in particulate matter concentrations may increase climate warming. And while the domestic combustion of sustainable biomass is beneficial from a climate perspective, it can also lead to increased emissions of air pollutants such as particulate matter and benzo(a)pyrene. As regards fuels used in motor vehicles, diesel engines are generally considered more climate-friendly than petrol ones (because they have lower carbon dioxide emissions), but in their current configuration they tend to emit more air pollutants.
Figure 16 – Synergies and trade-offs from climate and air policies Beneficial for climate
Det
rim
enta
l to
air
qual
ity
Biomass
Diesel
Energy efficiency
Wind and solar energy
Beneficial for air quality Uncontrolled fossil fuel use
Treatment at exhaust
(filters, catalysts, etc.)
Detrimental to climate Data source: adapted from E. von Schneidemesser et al., Chemistry and the Linkages between Air Quality and Climate Change, Chemical Reviews, 115 (10), 2015, p. 3881.
Sources: Interactions between EU air quality policy and climate and energy policy, Complementary impact assessment, EPRS, European Parliament, 2014; Coordinated policies can benefit both air quality and climate change, Science for Environment Policy, European Commission, July 2016, Research findings in support of the EU Air Quality review, European Commission, 2013, pp.71-83.

EPRS | European Parliamentary Research Service
42
must not damage coastal waters through discharge of wash water.127 The Commission noted that a reduction of sulphur dioxide concentrations in other coastal regions is expected once the 0.5 % maximum sulphur content requirement takes effect in 2020.128 At global level, this limit could pose serious implementation and enforcement challenges.129
7. European Parliament position In its 2017 resolution on EU action for sustainability, the European Parliament underlined that the EU is still far from achieving the air quality levels prescribed in EU legislation. It urged the Commission to ensure that new and existing legislation is enforced; to speed up legal action against Member States failing to comply with air pollution laws; and to propose new, effective legislation to tackle poor ambient air quality and pollution sources while also addressing methane emissions.130
In its 2017 recommendation based on the work of its Committee of inquiry into emission measurements in the automotive sector (EMIS), the European Parliament called for a more integrated approach to improve the environmental performance of cars, in order to ensure progress on both the decarbonisation and air quality objectives, for instance by fostering the electrification or transition to alternative motorisation of the car fleet. It also noted that, in order for RDE tests to be effective in reducing the discrepancies between the emissions measured in the laboratory and on the road, the specifications for the tests and evaluation procedures should be set out very carefully and should cover a wide range of driving conditions.131
In its 2015 resolution on sustainable urban mobility, the European Parliament stressed that air pollution has local, regional, national and cross-border dimensions and requires action at all levels of governance; and called for the multi-level governance approach to be strengthened.132
127 Note to the attention of the members of the European Sustainable Shipping Forum, ARES(2016)254855, European Commission, January 2016.
128 COM(2018) 188, op. cit. 129 For more details, see R. Grimmer, IMO 2020 Rule: Enforcement, Ship & Bunker, April 2018. 130 Resolution of 6 July 2017 on EU action for sustainability, European Parliament. 131 Recommendation of 4 April 2017 to the Council and the Commission following the inquiry into emission
measurements in the automotive sector, European Parliament. 132 Resolution of 2 December 2015 on sustainable urban mobility, European Parliament.

Air quality
43
8. Stakeholders' views FuelsEurope, representing the European refining sector, indicated on the 2013 EU air policy package that it supports the principle of seeking cost-effective solutions to improve air quality. It underlines the need for legislation to be designed on the basis of sound science, including cost-benefit and sensitivity analysis.133 It supports the Industrial Emissions Directive as a policy tool to deliver continuing improvements in environmental performance but warns that implementation must take competitiveness into account.134 On urban mobility, the European Automobile Manufacturers Association (ACEA) highlights the importance of transport to urban social and economic structure. It warns that measures to restrict traffic, such as low emission zones, must avoid disrupting businesses and increasing inequalities.135
In a joint statement, Eurocities, representing major European cities, and Polis, a network of cities working for innovation in local transport, called for ambitious national reduction targets. They also underlined the need for further exchanges between local, regional and national authorities, and for a better coordination of air policy and other policies, in particular energy and climate policies, for example as regards diesel engines or biomass burning.136
A coalition of environmental NGOs (AirClim, ClientEarth and the European Environmental Bureau) called on Member States to quickly implement the 2016 directive on the reduction of national emissions, put in place rigorous surveillance systems and address the most harmful sources of air pollution, including fuel combustion, intensive farming, transport and domestic heating. In addition, they urged the European Commission to speed up legal action against Member States, reject requests for flexibilities in national emission inventories, propose new sector-specific legislation, address methane emissions and align EU air quality standards with WHO reference values.137 Transport & Environment called for effective low emission zones in cities allowing only vehicles that are clean in real-world driving, using remote sensing and number plate recognition to ensure compliance. It also highlighted the need for high quality public transport as well as infrastructure for active, shared and zero emission transport modes.138 The World Health Organisation and the Health and Environment Alliance (HEAL) underlined that improving air quality offers a huge environmental health opportunity in Europe.139
133 Air policy package, FuelsEurope, undated. 134 Industrial emissions Directive (IED), FuelsEurope, undated. 135 Position paper: Low emission zones, European Automobile Manufacturers Association, May 2015. 136 EUROCITIES & Polis joint letter on the air policy review, EUROCITIES, June 2015. 137 Clearing the air: a critical guide to the new national emission ceilings directive, European Environmental Bureau, 2017. 138 How to get rid of dirty diesels on city roads – analysis, Transport & Environment, March 2018. 139 Health community demands new urgency on air pollution, Health and Environment Alliance, February 2018.

EPRS | European Parliamentary Research Service
44
9. Outlook In recent years, air quality has moved higher up the political agenda, in part as a result of concerns from the public exposed to poor air quality. In its 2018 communication on air quality, the European Commission pointed out that poor air quality reduces quality of life and is a burden for the economy. It also noted that there is an urgent need to improve air quality by fully implementing the air quality standards set in legislation.140
The following developments are expected in the policy area over the next years:
The ongoing fitness check of the ambient air quality directives is expected to be completed by the end of 2019.
As announced in the Clean Air Outlook, the European Commission intends to focus its efforts inter alia on emissions of ammonia and methane, two pollutants that are less covered by EU legislation.
The Commission is expected to publish its next Clean Air Outlook, presenting among other things an analysis of the 2019 national air pollution control programmes, in 2020.
The World Health Organisation is currently updating its air quality guidelines, with a view to reflecting the expanded evidence base gathered since 2005.
Updated legislation on sources of air pollution will enter into force in the coming years. This includes ecodesign requirements for solid fuel boilers and solid fuel local space heaters, requirements for new medium-sized combustion plants, real driving emission tests for motor vehicles, type-approval of motor vehicles, and sulphur content of marine fuels.
Methods used to monitor air quality could change as a result of technological developments in measuring equipment, inputs from citizen science and the use of satellite data.
To improve air quality, action needs to be taken across governance levels, including the local and regional levels, and across all sectors, including less well known sources such as agriculture and domestic heating. An integrated approach between climate change and air quality policies would also make it possible to take advantage of existing synergies.
140 COM(2018) 330, op.cit., p.13.
Air quality
45
REFERENCES
von Schneidemesser E. et al., Chemistry and the Linkages between Air Quality and Climate Change, Chemical Reviews, 115 (10), 2015, pp. 3856–3897. Seigneur C., Pollution atmosphérique: concepts, théorie et applications, Éditions Belin, 2018. Thunis P. et al., Urban PM2.5 atlas: Air quality in European cities, Joint Research Centre, European Commission, 2017. Air quality in Europe 2017, European Environment Agency, October 2017. Air quality index, European Environment Agency, information provided in real time. European Union emission inventory report 1990–2015 under the UNECE Convention on long-range transboundary air pollution (LRTAP), European Environment Agency, 2017.

EPRS | European Parliamentary Research Service
46
ANNEX – NORMS ON AIR POLLUTION SOURCES AT EU AND INTERNATIONAL LEVEL
General Gothenburg Protocol to abate acidification, eutrophication and ground-level ozone to the Convention on long-range transboundary air pollution, as amended on 4 May 2012, United Nations Economic Commission for Europe, May 2013.
Guidance document on economic instruments to reduce emissions of regional air pollutants, ECE/EB.AIR/118, United Nations Economic Commission for Europe, July 2013.
Guidance document on control techniques for emissions of sulphur, NOx, VOC, and particulate matter (including PM10, PM2.5 and black carbon) from stationary sources, ECE/EB.AIR/117, United Nations Economic Commission for Europe, January 2015.
Guidance document on emission control techniques for mobile sources, ECE/EB.AIR/138, United Nations Economic Commission for Europe, November 2016.
Kiev Protocol on pollutant release and transfer registers to the UNECE Convention on access to information, public participation in decision-making and access to justice in environmental matters, United Nations Economic Commission for Europe, May 2003.
Regulation (EC) No 166/2006 of the European Parliament and of the Council of 18 January 2006 concerning the establishment of a European Pollutant Release and Transfer Register, OJ L 33, 4.2.2006.
Industry, electricity and heat Industrial emissions
Directive 2010/75/EU of the European Parliament and of the Council of 24 November 2010 on industrial emissions (integrated pollution prevention and control), OJ L 334, 17.12.2010.
Commission Implementing Decision (EU) 2017/1442 of 31 July 2017 establishing best available techniques (BAT) conclusions, under Directive 2010/75/EU, for large combustion plants, OJ L 212, 17.8.2017.
Commission Implementing Decision 2012/135/EU of 28 February 2012 establishing best available techniques (BAT) conclusions, under Directive 2010/75/EU, on industrial emissions for iron and steel production, OJ L 70, 8.3.2012.
Reference document on best available techniques in the ferrous metals processing industry, European Commission, December 2001.
Commission Implementing Decision (EU) 2016/1032 of 13 June 2016 establishing best available techniques (BAT) conclusions, under Directive 2010/75/EU, for the non-ferrous metals industries, OJ L 174, 30.6.2016.
Commission Implementing Decision 2014/738/EU of 9 October 2014 establishing best available techniques (BAT) conclusions, under Directive 2010/75/EU, for the refining of mineral oil and gas, OJ L 307, 28.10.2014.
Reference document on best available techniques on emissions from storage, European Commission, July 2006.
Commission Implementing Decision 2013/84/EU of 11 February 2013 establishing best available techniques (BAT) conclusions, under Directive 2010/75/EU, for the tanning of hides and skins, OJ L 45, 16.2.2013.
Reference document on best available techniques for the textiles industry, European Commission, July 2003.
Commission Implementing Decision 2012/134/EU of 28 February 2012 establishing best available techniques (BAT) conclusions, under Directive 2010/75/EU, for the manufacture of glass, OJ L 70, 8.3.2012.
Commission Implementing Decision (EU) 2015/2119 of 20 November 2015 establishing best available techniques (BAT) conclusions, under Directive 2010/75/EU, for the production of wood-based panels, OJ L 306, 24.11.2015.
Commission Implementing Decision 2014/687/EU of 26 September 2014 establishing best available techniques (BAT) conclusions, under Directive 2010/75/EU, for the production of pulp, paper and board, OJ L 284, 30.9.2014.
Commission Implementing Decision 2013/163/EU of 26 March 2013 establishing best available techniques (BAT) conclusions, under Directive 2010/75/EU, for the production of cement, lime and magnesium oxide, OJ L 100, 9.4.2013.
Air quality
47
Reference document on best available techniques for the ceramic manufacturing industry, European Commission, August 2007.
Reference document on best available techniques for the food, drink and milk industries, European Commission, August 2006.
Other combustion processes
Directive (EU) 2015/2193 of the European Parliament and of the Council of 25 November 2015 on the limitation of emissions of certain pollutants into the air from medium combustion plants, OJ L 313, 28.11.2015.
Directive 2009/125/EC of the European Parliament and of the Council of 21 October 2009 establishing a framework for the setting of ecodesign requirements for energy-related products, OJ L 285, 31.10.2009 (see also consolidated version).
Commission Regulation (EU) 2015/1188 of 28 April 2015 implementing Directive 2009/125/EC of the European Parliament and of the Council with regard to ecodesign requirements for local space heaters, OJ L 193, 21.7.2015.
Commission Regulation (EU) 2015/1189 of 28 April 2015 implementing Directive 2009/125/EC of the European Parliament and of the Council with regard to ecodesign requirements for solid fuel boilers, OJ L 193, 21.7.2015.
Commission Regulation (EU) 2015/1185 of 24 April 2015 implementing Directive 2009/125/EC of the European Parliament and of the Council with regard to ecodesign requirements for solid fuel local space heaters, OJ L 193, 21.7.2015.
Commission Regulation (EU) No 813/2013 of 2 August 2013 implementing Directive 2009/125/EC of the European Parliament and of the Council with regard to ecodesign requirements for space heaters and combination heaters, OJ L 239, 6.9.2013.
Directive 2012/27/EU of the European Parliament and of the Council of 25 October 2012 on energy efficiency, OJ L 315, 14.11.2012 (see also consolidated version).
Commission Regulation (EU) No 592/2014 of 3 June 2014 amending Regulation (EU) No 142/2011 as regards the use of animal by-products and derived products as a fuel in combustion plants, OJ L 165, 4.6.2014.
Transport Fuels
Directive 98/70/EC of the European Parliament and of the Council of 13 October 1998 relating to the quality of petrol and diesel fuels, OJ L 350, 28.12.1998 (see also consolidated version).
Directive (EU) 2016/802 of the European Parliament and of the Council of 11 May 2016 relating to a reduction in the sulphur content of certain liquid fuels, OJ L 132, 21.5.2016.
European Parliament and Council Directive 94/63/EC of 20 December 1994 on the control of volatile organic compound (VOC) emissions resulting from the storage of petrol and its distribution from terminals to service stations, OJ L 365, 31.12.1994 (see also consolidated version).
Directive 2009/126/EC of the European Parliament and of the Council of 21 October 2009 on Stage II petrol vapour recovery during refuelling of motor vehicles at service stations, OJ L 285, 31.10.2009 (see also consolidated version).
Road
Regulation (EU) 2018/858 of the European Parliament and of the Council of 30 May 2018 on the approval and market surveillance of motor vehicles and their trailers, and of systems, components and separate technical units intended for such vehicles, OJ L 151, 14.6.2018.
Regulation (EC) No 715/2007 of the European Parliament and of the Council of 20 June 2007 on type approval of motor vehicles with respect to emissions from light passenger and commercial vehicles (Euro 5 and Euro 6) and on access to vehicle repair and maintenance information, OJ L 171, 29.6.2007 (see also consolidated version).
Regulation (EC) No 595/2009 of the European Parliament and of the Council of 18 June 2009 on type-approval of motor vehicles and engines with respect to emissions from heavy duty vehicles (Euro VI) and on access to vehicle repair and maintenance information, OJ L 188, 18.7.2009 (see also consolidated version).
Regulation (EU) No 168/2013 of the European Parliament and of the Council of 15 January 2013 on the approval and market surveillance of two- or three-wheel vehicles and quadricycles, OJ L 60, 2.3.2013 (see also consolidated version).
EPRS | European Parliamentary Research Service
48
Commission Regulation (EC) No 692/2008 of 18 July 2008 implementing and amending Regulation (EC) No 715/2007 of the European Parliament and of the Council on type-approval of motor vehicles with respect to emissions from light passenger and commercial vehicles (Euro 5 and Euro 6) and on access to vehicle repair and maintenance information, OJ L 199, 28.7.2008 (see also consolidated version).
Commission Regulation (EU) No 582/2011 of 25 May 2011 implementing and amending Regulation (EC) No 595/2009 of the European Parliament and of the Council with respect to emissions from heavy duty vehicles (Euro VI), OJ L 167, 25.6.2011 (see also consolidated version).
Commission Delegated Regulation (EU) No 134/2014 of 16 December 2013 supplementing Regulation (EU) No 168/2013 of the European Parliament and of the Council with regard to environmental and propulsion unit performance requirements, OJ L 53, 21.2.2014 (see also consolidated version).
Sea
Revised MARPOL annex VI: Regulations for the prevention of air pollution from ships, MEPC.176(58), Marine Environment Protection Committee, International Maritime Organization, 10 October 2018.
Designation of the Baltic Sea and the North Sea Emission Control Areas for NOx Tier III control, MEPC.286(71), Marine Environment Protection Committee, International Maritime Organization, 7 July 2017.
NOx technical code 2008, MEPC.177(58), Marine Environment Protection Committee, International Maritime Organization, 10 October 2018.
Guidelines related to air pollution from ships, Marine Environment Protection Committee, International Maritime Organisation.
Directive 2013/53/EU of the European Parliament and of the Council of 20 November 2013 on recreational craft and personal watercraft, OJ L 354, 28.12.2013.
Air
Annex 16 to the Convention on international civil aviation, Environmental Protection Volume II – Aircraft engine emissions, International Civil Aviation Organization, 4th edition, 2017.
Airport air quality manual, doc 9889, International Civil Aviation Organisation, 2011.
Regulation (EC) No 216/2008 of the European Parliament and of the Council of 20 February 2008 on common rules in the field of civil aviation and establishing a European Aviation Safety Agency, OJ L 79, 19.3.2008 (see also consolidated version).
Other
Regulation (EU) 2016/1628 of the European Parliament and of the Council of 14 September 2016 on requirements relating to gaseous and particulate pollutant emission limits and type-approval for internal combustion engines for non-road mobile machinery, OJ L 252, 16.9.2016.
Regulation (EU) No 167/2013 of the European Parliament and of the Council of 5 February 2013 on the approval and market surveillance of agricultural and forestry vehicles, OJ L 60, 2.3.2013 (see also consolidated version).
Commission Delegated Regulation (EU) 2015/96 of 1 October 2014 supplementing Regulation (EU) No 167/2013 of the European Parliament and of the Council as regards environmental and propulsion unit performance requirements of agricultural and forestry vehicles, OJ L 16, 23.1.2015 (see also consolidated version).

Air quality
49
Agriculture Directive (EU) 2016/2284 of the European Parliament and of the Council of 14 December 2016 on the reduction of national emissions of certain atmospheric pollutants, OJ L 344, 17.12.2016.
Framework code for good agricultural practice for reducing ammonia emissions, ECE/EB.AIR/129, United Nations Economic Commission for Europe, March 2015.
Guidance document on national nitrogen budgets, ECE/EB.AIR/119, United Nations Economic Commission for Europe, June 2013.
Guidance document for preventing and abating ammonia emissions from agricultural sources, ECE/EB.AIR/120, United Nations Economic Commission for Europe, February 2014.
Regulation (EU) No 1306/2013 of the European Parliament and of the Council of 17 December 2013 on the financing, management and monitoring of the common agricultural policy, OJ L 347, 20.12.2013 (see also consolidated version).
Commission Implementing Decision (EU) 2017/302 of 15 February 2017 establishing best available techniques (BAT) conclusions, under Directive 2010/75/EU, for the intensive rearing of poultry or pigs, OJ L 43, 21.2.2017.
Waste Directive 2008/98/EC of the European Parliament and of the Council of 19 November 2008 on waste, OJ L 312, 22.11.2008 (see also consolidated version).
Reference document on best available techniques for waste incineration, European Commission, August 2006.
Chemicals Directive 2004/42/CE of the European Parliament and of the Council of 21 April 2004 on the limitation of emissions of volatile organic compounds due to the use of organic solvents in certain paints and varnishes and vehicle refinishing products, OJ L 143, 30.4.2004 (see also consolidated version).
Commission Implementing Decision (EU) 2016/902 of 30 May 2016 establishing best available techniques (BAT) conclusions, under Directive 2010/75/EU, for common waste water and waste gas treatment/management systems in the chemical sector, OJ L 152, 9.6.2016.
Reference document on best available techniques for the manufacture of large volume inorganic chemicals (ammonia, acids and fertilisers), European Commission, August 2007.
Reference document on best available techniques for the manufacture of large volume inorganic chemicals (solids and others industry), European Commission, August 2007.
Commission Implementing Decision (EU) 2017/2117 of 21 November 2017 establishing best available techniques (BAT) conclusions, under Directive 2010/75/EU, for the production of large volume organic chemicals, OJ L 323, 7.12.2017.
Reference document on best available techniques for the manufacture of organic fine chemicals, European Commission, August 2006.
Reference document on best available techniques for the production of polymers, European Commission, August 2007.
Reference document on best available techniques for the production of specialty inorganic chemicals, European Commission, August 2007.
Reference document on best available techniques in the smitheries and foundries industry, European Commission, May 2005.
Reference document on best available techniques for the surface treatment of metals and plastics, European Commission, August 2006.
Reference document on best available techniques for the surface treatment using organic solvents, European Commission, August 2007.
EPRS | European Parliamentary Research Service
50
Specific pollutants Toxic metals
Aarhus Protocol on heavy metals to the Convention on long-range transboundary air pollution, as amended on 13 December 2012, United Nations Economic Commission for Europe, October 2014.
Guidance document on best available techniques for controlling emissions of heavy metals and their compounds from the source categories listed in annex II to the Protocol on heavy metals, ECE/EB.AIR/16, United Nations Economic Commission for Europe, July 2013.
Minamata Convention on Mercury, United Nations Environment Programme, October 2013.
Regulation (EU) 2017/852 of the European Parliament and of the Council of 17 May 2017 on mercury, OJ L 137, 24.5.2017.
Persistent organic pollutants
Aarhus Protocol on persistent organic pollutants to the Convention on long-range transboundary air pollution, as amended on 18 December 2009, United Nations Economic Commission for Europe, April 2010.
Guidance document on best available techniques to control emissions of persistent organic pollutants from major stationary sources, ECE/EB.AIR/2009/14, United Nations Economic Commission for Europe, October 2009.
Stockholm Convention on persistent organic pollutants, United Nations Environment Programme, May 2001.
Guidance on best available techniques and best environmental practices under the Stockholm Convention on persistent organic pollutants, United Nations Environment Programme.
Regulation (EC) No 850/2004 of the European Parliament and of the Council of 29 April 2004 on persistent organic pollutants, OJ L 158, 30.4.2004 (see also consolidated version).


Outdoor air pollution is caused by the emission ofharmful substances from natural sources and humanactivities. It has a number of adverse effects on humanhealth and the environment, and subsequently onsociety and the economy. Air pollution can betransported or formed over long distances and canaffect large areas. Effective air quality policies requireaction and cooperation beyond the local and nationallevels, on a European and global scale. This publicationpresents key air pollutants, lists natural sources of airpollution, and details emissions from human activitiesby sector. It describes adverse effects on human health,the environment and the climate, as well as socio-economic impacts. In addition, it provides an overviewof international agreements and European Unionlegislation setting air quality standards, loweringnational emissions of pollutants, and reducingemissions of pollutants at specific sources. Furthermore,this publication briefly describes the state ofimplementation of key EU legislation related to airquality. Finally, it reflects the position of the EuropeanParliament and stakeholders on the policy area.
This is a publication of the Members' Research ServiceEPRS | European Parliamentary Research Service
This document is prepared for, and addressed to, the Members and staff of the EuropeanParliament as background material to assist them in their parliamentary work. The content of
the document is the sole responsibility of its author(s) and any opinions expressed herein shouldnot be taken to represent an official position of the Parliament.
PE 625.114ISBN 978-92-846-3477-4doi:10.2861/864239
QA
-04-18-636-EN-N