air quality feasibility study financial caseaq... · tyneside air quality feasibility study outline...
TRANSCRIPT

AIR QUALITY FEASIBILITY STUDY FINANCIAL CASE

Tyneside Air Quality Feasibility Study Outline Business Case
FINANCIAL CASE 15/02/2019 Page 2/14
TABLE OF CONTENTS
3. FINANCIAL CASE 3
3.1 INTRODUCTION 3
3.2 COST 3
3.3 REVENUE 7
3.4 FINANCIAL PROFILE 10
3.5 FUNDING 11
LIST OF TABLES
Table 3-1 Charging CAZ Capital Expenditure Summary 4 Table 3-2 Charging CAZ Operating Expenditure Summary- Fixed 5 Table 3-3 Charging CAZ Operating Expenditure Summary- Variable Costs 5 Table 3-3 Mitigation Measures Capital Expenditure Summary 6 Table 3-5 Non-compliant unique vehicles by class and year 8 Table 3-6 Charge CAZ D Revenue by year £(000s) 9 Table 3-7 Charge CAZ D Sensitivity Test 1 (Half) Revenue by year £(000s) 10 Table 3-8 Charge CAZ D Sensitivity Test 2 (Third) Revenue by year £(000s) 10 Table 3-9 Charge CAZ D Sensitivity Test 3 - Trip reduction for goods vehicles and greater fleet replacement Revenue by year £(000s) 10 Table 3-9 Financial Profile Charging Clean Air Zone Implementation £(000s) 11 Table 3-10 Financial Profile - Mitigation £(000s) 11 Table 3-11 Financial Profile – Implementation and Mitigation (£000s) 11 Table 3-12 Resource Requirements for the Tyneside Clean Air Zone Monitoring and Evaluation (£) 12 Table 3-13 Funding Profile (£000s) 12
Tyneside Air Quality Feasibility Study Outline Business Case
FINANCIAL CASE 15/02/2019 Page 3/14
3. FINANCIAL CASE
Please refer to the summary position provided by the Tyneside Authorities within the Strategic Case regarding the current modelled option that achieves compliance in the shortest time.
3.1 Introduction
3.1.1 The purpose of the financial case is to determine the cost of measures within the constraints of the JAQU guidance and time available. It sets out the funding arrangements and technical accounting issues, presenting the financial profile of the Proposed Option.
3.1.2 The financial case provides detail on how much the project will cost, who is paying for it, what types of costs are expected, what the financial risks or dependencies are and what the accounting implications are.
3.1.3 There will be financial impacts for the Tyneside Authorities for designs, installing, operating, monitoring and decommissioning the Proposed Option. This section sets out what those impacts are and how they will be mitigated and managed.
3.1.4 The Proposed Option is split into:
- Delivery of a Charging CAZ; and - Supporting mitigation measures.
3.2 Cost
3.2.1 The costs for ‘goods’ and ‘works’ are mostly calculated with a per item cost applied to an estimated required quantity. Per item costs are taken from similar schemes and optimism bias is applied. ‘Services’ costs are estimated based on professional judgement and market testing.
3.2.2 These costs are indicative and will be refined through market testing and procurement (outlined in our Commercial Case) as the scheme progresses towards FBC.
3.2.3 Some costs are calculated from traffic model outputs. The actual responses to the implementation of a charged CAZ may differ from the forecast values.
3.2.4 A summary of total capital and operating costs for the charging CAZ is summarised in Table 3-1 and Table 3-2. Appendix A3.1 details the assumptions which underpin the CAZ capital and operating costs.

Tyneside Air Quality Feasibility Study Outline Business Case
FINANCIAL CASE 15/02/2019 Page 4/14
Table 3-1 Charging CAZ Capital Expenditure Summary
COSTS COST (£) OPTIMISM BIAS (%)
OPTIMISM BIAS (£)
TOTAL
Charge CAZ – Implementation Costs
Design / Support
500,000 44% 220,000 720,000
Integration / Management
CAZ systems IT and communications
System Integration to other systems
Internal / external resource
Cameras and installation 946,000 44% 416,240 1,362,240
Local databases 80,000 44% 35,200 115,200
Enforcement / PCN processing
20,000 44% 8,800 28,800
Signs 102,000 13% 13,260 115,260
Marketing, communications & behaviour change
1,000,000 13% 130,000 1,130,000
Charge CAZ - decommissioning
209,066 44% 91,989 301,055
Total 2,857,066 3,772,555

Tyneside Air Quality Feasibility Study Outline Business Case
FINANCIAL CASE 15/02/2019 Page 5/14
Table 3-2 Charging CAZ Operating Expenditure Summary- Fixed
COSTS COST (£) OPTIMISM BIAS (%)
OPTIMISM BIAS (£)
TOTAL
Charge CAZ - Operation & Monitoring (annual costs)
Sign maintenance 10,200 13% 1,326 11,526
Camera maintenance 88,688 13% 11,529 100,217
IT Support & Maintenance 5,000 200% 20,000 25,000
Internal resourcing – Year 1
962,500 13% 125,125 1,087,625
Internal resourcing – Years 2 -5
862,500 13% 112,125 974,625
Office accommodation 72,000 13% 9,360 81,360
Governance & Compliance 80,000 13% 10,400 90,400
Depreciation 209,600 13% 27,248 236,848
Lifecycle replacement costs
£0 N/A N/A
Sinking Fund 157,200 44% 69,168 226,368
Annual Total Year 1 1,859,344
Annual Total Years 2-5 1,746,344
Table 3-3 Charging CAZ Operating Expenditure Summary- Variable Costs
2021 2022 2023 2024 2025 TOTAL
Additional staff at launch
100,000 0 0 0 0 100,000
Digital Portal - Card Payment Transaction Fees
745,701 623,641 501,580 379,520 257,459 2,507,901
Digital Portal - Collection Fees
1,491,402 1,247,281 1,003,160 759,040 514,919 5,015,802

Tyneside Air Quality Feasibility Study Outline Business Case
FINANCIAL CASE 15/02/2019 Page 6/14
2021 2022 2023 2024 2025 TOTAL
DVLA Lookup Fees 1,455,079 727,539 727,539 727,538 727,538 4,365,232
Delinquent Payments - DVLA Look Up
49,780 41,721 33,661 25,602 17,543 168,307
Delinquent Payments - Other Enforcement Costs
4,525,462 3,792,798 3,060,134 2,327,470 1,594,806 15,300,669
Totals £9,852,611 £7,918,167 £6,811,261 £5,704,358 £4,597,452 £34,883,849
This uses the following assumptions:
Digital Portal - Card Payment Transaction Fees-Assume 1% based on a daily charge Digital Portal - Collection Fees-Assumed to be 2% of transaction value DVLA Lookup Fees (for class & emissions)-Reduced DVLA Look-up charge due to JAQU
solution Delinquent Payments - DVLA Look Up (for keeper details)-Assume 8% of non-compliant
vehicles will be delinquent payments. DVLA charge 11p per look-up Delinquent Payments - Other Enforcement Costs-Assume 8% of non-compliant vehicles will
be delinquent payments. Assume £10 as cost of enforcing each delinquent payment (printing letters, legal costs etc.)
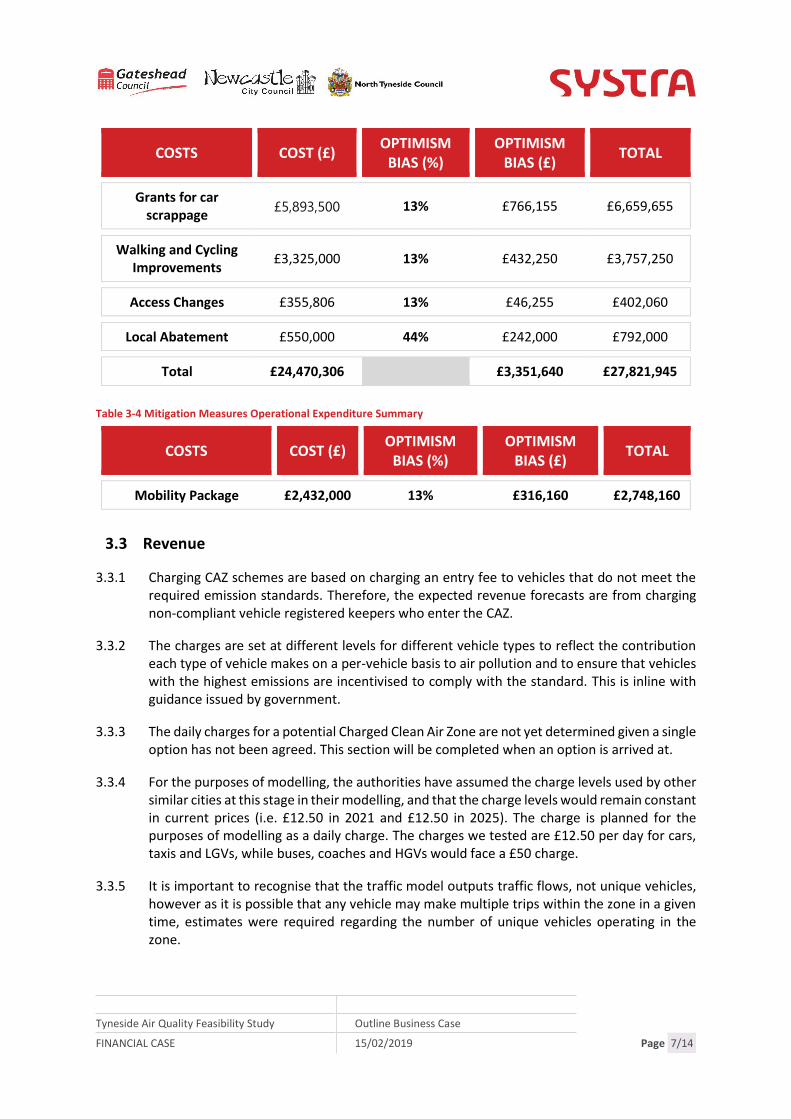
3.2.5 A summary of total capital and operating costs for the mitigation measures is summarised in Table 3-3 and Table 3-4 and each measure is discussed in greater detail within the Strategic Case. These all have the appropriate level of optimism bias applied. In all cases barring local abatement, this is 13%. For Local Abatement, a greater level of optimism bias has been applied due to the fact that the technology is relatively untested.
Table 3-3 Mitigation Measures Capital Expenditure Summary
COSTS COST (£) OPTIMISM
BIAS (%) OPTIMISM
BIAS (£) TOTAL
Grants for HGVs retrofit
£4,096,000 13% £532,480 £4,628,480
Grants for LGV upgrade
£4,650,000 13% £604,500 £5,254,500
Grants for taxis / PHVs upgrade
£5,600,000 13% £728,000 £6,328,000
Tyneside Air Quality Feasibility Study Outline Business Case
FINANCIAL CASE 15/02/2019 Page 7/14
COSTS COST (£) OPTIMISM
BIAS (%) OPTIMISM
BIAS (£) TOTAL
Grants for car scrappage
£5,893,500 13% £766,155 £6,659,655
Walking and Cycling Improvements
£3,325,000 13% £432,250 £3,757,250
Access Changes £355,806 13% £46,255 £402,060
Local Abatement £550,000 44% £242,000 £792,000
Total £24,470,306 £3,351,640 £27,821,945
Table 3-4 Mitigation Measures Operational Expenditure Summary
COSTS COST (£) OPTIMISM
BIAS (%) OPTIMISM
BIAS (£) TOTAL
Mobility Package £2,432,000 13% £316,160 £2,748,160
3.3 Revenue
3.3.1 Charging CAZ schemes are based on charging an entry fee to vehicles that do not meet the required emission standards. Therefore, the expected revenue forecasts are from charging non-compliant vehicle registered keepers who enter the CAZ.
3.3.2 The charges are set at different levels for different vehicle types to reflect the contribution each type of vehicle makes on a per-vehicle basis to air pollution and to ensure that vehicles with the highest emissions are incentivised to comply with the standard. This is inline with guidance issued by government.
3.3.3 The daily charges for a potential Charged Clean Air Zone are not yet determined given a single option has not been agreed. This section will be completed when an option is arrived at.
3.3.4 For the purposes of modelling, the authorities have assumed the charge levels used by other similar cities at this stage in their modelling, and that the charge levels would remain constant in current prices (i.e. £12.50 in 2021 and £12.50 in 2025). The charge is planned for the purposes of modelling as a daily charge. The charges we tested are £12.50 per day for cars, taxis and LGVs, while buses, coaches and HGVs would face a £50 charge.
3.3.5 It is important to recognise that the traffic model outputs traffic flows, not unique vehicles, however as it is possible that any vehicle may make multiple trips within the zone in a given time, estimates were required regarding the number of unique vehicles operating in the zone.

Tyneside Air Quality Feasibility Study Outline Business Case
FINANCIAL CASE 15/02/2019 Page 8/14
3.3.6 To generate the unique vehicles the road assignment model has been analysed using a standard modelling technique called sub-area analysis. This analysis uses the same CAZ cordon as used in the CAZ option test to extract demand to / from each charged link and zone within the cordon.
3.3.7 This process outputs demand matrices for each vehicle type, for each time period of the transport models. This is then converted to all vehicles using the following formula:
Daily All Vehicles = 3 * AM Vehicles + 6 * Inter Peak Vehicles + 3 * PM Vehicles + 12 * Off Peak Vehicles
3.3.8 The assumption applied is that each vehicle makes two journeys per day and hence the above ‘Daily All Vehicles’ is divided by two to yield the unique vehicles.
3.3.9 Traffic estimates do not include any provision for exemptions, discounts and/or sunset periods at this point in time i.e. it is assumed that all non-compliant vehicles within a class are subject to the full charge from day one though based on further modelling and the consultation these matters could be subject to change.
3.3.10 The split of compliant versus non-compliant vehicles has been calculated by taking the baseline figure and estimating percentage improvements per class per year of scheme operation.
3.3.11 In the absence of buses and coaches from our traffic model as specific vehicles, it has been agreed to assume that buses would all be compliant by 2021 while data on coach traffic will be gathered during the FBC.
3.3.12 It is also assumed that all locally-registered taxis (by this we are referring to hackney carriages and Private Hire Vehicles) will be compliant by 2021 therefore are exempt from the charge for the purposes of the modelling. Data on non-local PHVs (which may be subject to the charge) will be incorporated as part of the FBC. Due to the underlying modelling assumptions, these figures are not an accurate forecast of traffic and any resultant cost/revenue calculations are purely high-level indicative totals.
3.3.13 Table 3-5 displays the number of non-compliant unique vehicles operating in the charge CAZ.
Table 3-5 Non-compliant unique vehicles by class and year
2021 2022 2023 2024 2025
Buses & Coaches 0 0 0 0 0
HGVs 343 276 208 141 74
Taxis & PHVs 0 0 0 0 0
Large van / Minibus
4,154 3,453 2,752 2,051 1,350
Tyneside Air Quality Feasibility Study Outline Business Case
FINANCIAL CASE 15/02/2019 Page 9/14
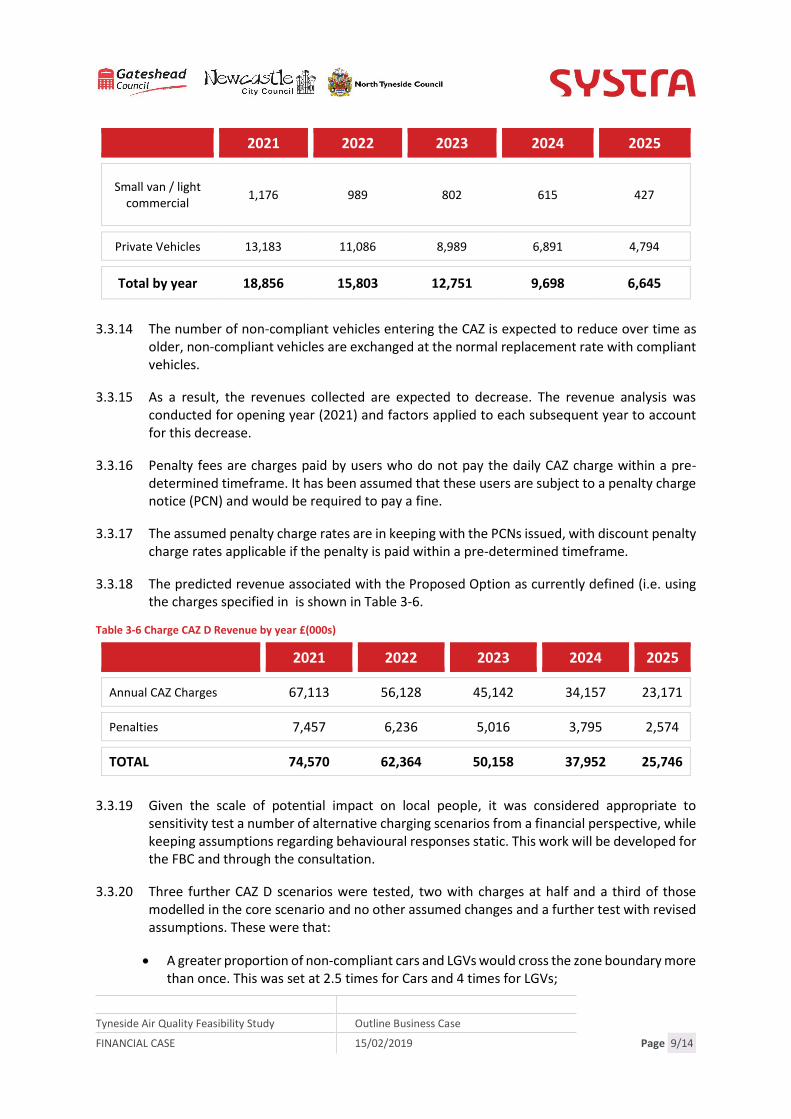
2021 2022 2023 2024 2025
Small van / light commercial
1,176 989 802 615 427
Private Vehicles 13,183 11,086 8,989 6,891 4,794
Total by year 18,856 15,803 12,751 9,698 6,645
3.3.14 The number of non-compliant vehicles entering the CAZ is expected to reduce over time as older, non-compliant vehicles are exchanged at the normal replacement rate with compliant vehicles.
3.3.15 As a result, the revenues collected are expected to decrease. The revenue analysis was conducted for opening year (2021) and factors applied to each subsequent year to account for this decrease.
3.3.16 Penalty fees are charges paid by users who do not pay the daily CAZ charge within a pre-determined timeframe. It has been assumed that these users are subject to a penalty charge notice (PCN) and would be required to pay a fine.
3.3.17 The assumed penalty charge rates are in keeping with the PCNs issued, with discount penalty charge rates applicable if the penalty is paid within a pre-determined timeframe.
3.3.18 The predicted revenue associated with the Proposed Option as currently defined (i.e. using the charges specified in is shown in Table 3-6.
Table 3-6 Charge CAZ D Revenue by year £(000s)
2021 2022 2023 2024 2025
Annual CAZ Charges 67,113 56,128 45,142 34,157 23,171
Penalties 7,457 6,236 5,016 3,795 2,574
TOTAL 74,570 62,364 50,158 37,952 25,746
3.3.19 Given the scale of potential impact on local people, it was considered appropriate to sensitivity test a number of alternative charging scenarios from a financial perspective, while keeping assumptions regarding behavioural responses static. This work will be developed for the FBC and through the consultation.
3.3.20 Three further CAZ D scenarios were tested, two with charges at half and a third of those modelled in the core scenario and no other assumed changes and a further test with revised assumptions. These were that:
• A greater proportion of non-compliant cars and LGVs would cross the zone boundary more than once. This was set at 2.5 times for Cars and 4 times for LGVs;
Tyneside Air Quality Feasibility Study Outline Business Case
FINANCIAL CASE 15/02/2019 Page 10/14
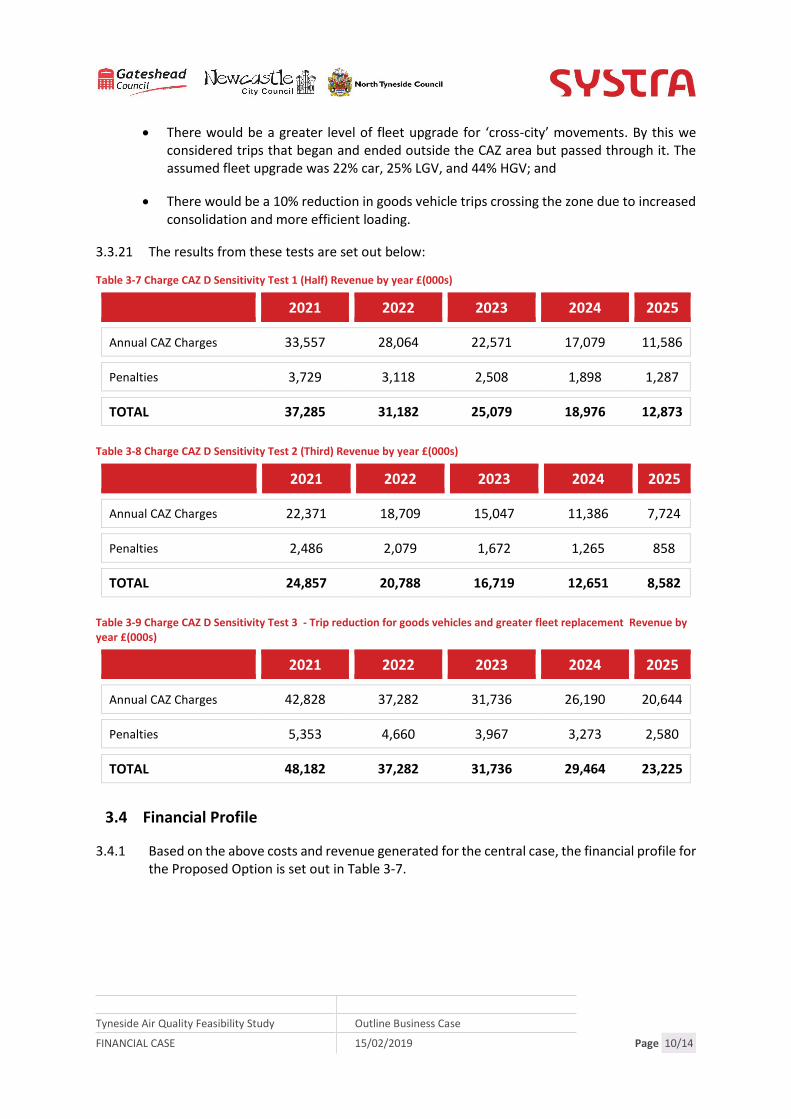
• There would be a greater level of fleet upgrade for ‘cross-city’ movements. By this we considered trips that began and ended outside the CAZ area but passed through it. The assumed fleet upgrade was 22% car, 25% LGV, and 44% HGV; and
• There would be a 10% reduction in goods vehicle trips crossing the zone due to increased consolidation and more efficient loading.
3.3.21 The results from these tests are set out below:
Table 3-7 Charge CAZ D Sensitivity Test 1 (Half) Revenue by year £(000s)
2021 2022 2023 2024 2025
Annual CAZ Charges 33,557 28,064 22,571 17,079 11,586
Penalties 3,729 3,118 2,508 1,898 1,287
TOTAL 37,285 31,182 25,079 18,976 12,873
Table 3-8 Charge CAZ D Sensitivity Test 2 (Third) Revenue by year £(000s)
2021 2022 2023 2024 2025
Annual CAZ Charges 22,371 18,709 15,047 11,386 7,724
Penalties 2,486 2,079 1,672 1,265 858
TOTAL 24,857 20,788 16,719 12,651 8,582
Table 3-9 Charge CAZ D Sensitivity Test 3 - Trip reduction for goods vehicles and greater fleet replacement Revenue by year £(000s)
2021 2022 2023 2024 2025
Annual CAZ Charges 42,828 37,282 31,736 26,190 20,644
Penalties 5,353 4,660 3,967 3,273 2,580
TOTAL 48,182 37,282 31,736 29,464 23,225
3.4 Financial Profile
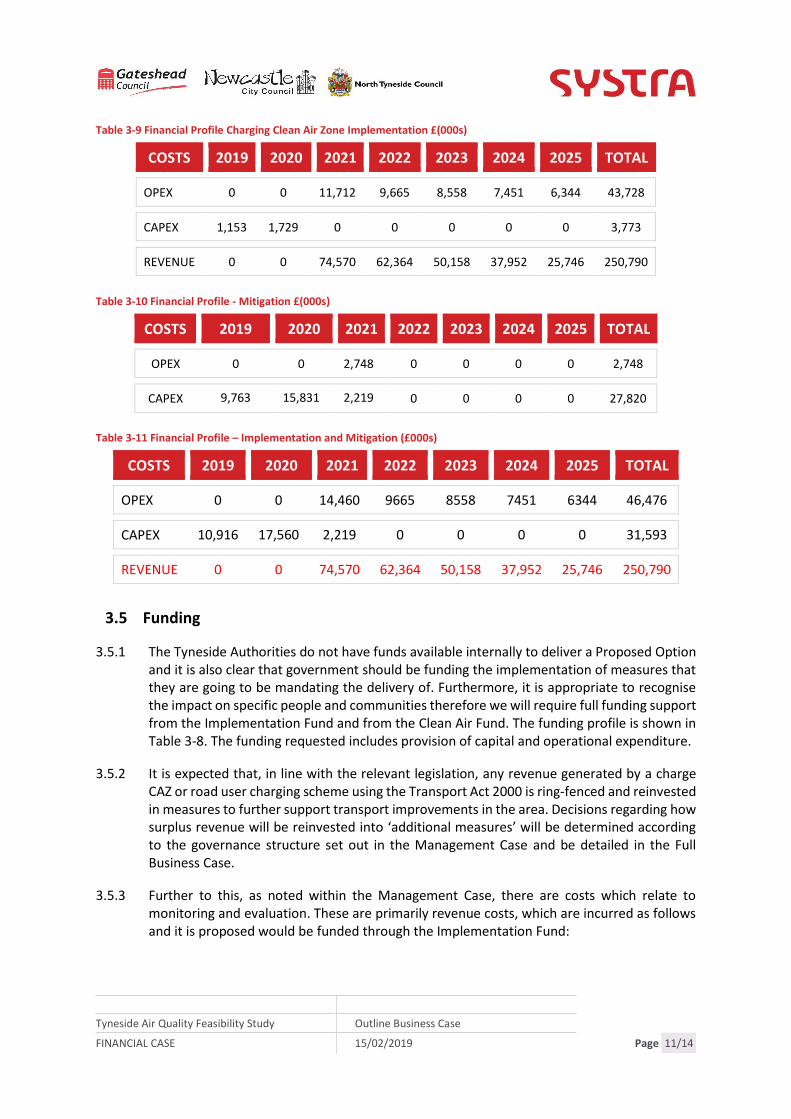
3.4.1 Based on the above costs and revenue generated for the central case, the financial profile for the Proposed Option is set out in Table 3-7.
Tyneside Air Quality Feasibility Study Outline Business Case
FINANCIAL CASE 15/02/2019 Page 11/14
Table 3-9 Financial Profile Charging Clean Air Zone Implementation £(000s)
COSTS 2019 2020 2021 2022 2023 2024 2025 TOTAL
OPEX 0 0 11,712 9,665 8,558 7,451 6,344 43,728
CAPEX 1,153 1,729 0 0 0 0 0 3,773
REVENUE 0 0 74,570 62,364 50,158 37,952 25,746 250,790
Table 3-10 Financial Profile - Mitigation £(000s)
COSTS 2019 2020 2021 2022 2023 2024 2025 TOTAL
OPEX 0 0 2,748 0 0 0 0 2,748
CAPEX 9,763 15,831 2,219 0 0 0 0 27,820
Table 3-11 Financial Profile – Implementation and Mitigation (£000s)
COSTS 2019 2020 2021 2022 2023 2024 2025 TOTAL
OPEX 0 0 14,460 9665 8558 7451 6344 46,476
CAPEX 10,916 17,560 2,219 0 0 0 0 31,593
REVENUE 0 0 74,570 62,364 50,158 37,952 25,746 250,790
3.5 Funding
3.5.1 The Tyneside Authorities do not have funds available internally to deliver a Proposed Option and it is also clear that government should be funding the implementation of measures that they are going to be mandating the delivery of. Furthermore, it is appropriate to recognise the impact on specific people and communities therefore we will require full funding support from the Implementation Fund and from the Clean Air Fund. The funding profile is shown in Table 3-8. The funding requested includes provision of capital and operational expenditure.
3.5.2 It is expected that, in line with the relevant legislation, any revenue generated by a charge CAZ or road user charging scheme using the Transport Act 2000 is ring-fenced and reinvested in measures to further support transport improvements in the area. Decisions regarding how surplus revenue will be reinvested into ‘additional measures’ will be determined according to the governance structure set out in the Management Case and be detailed in the Full Business Case.
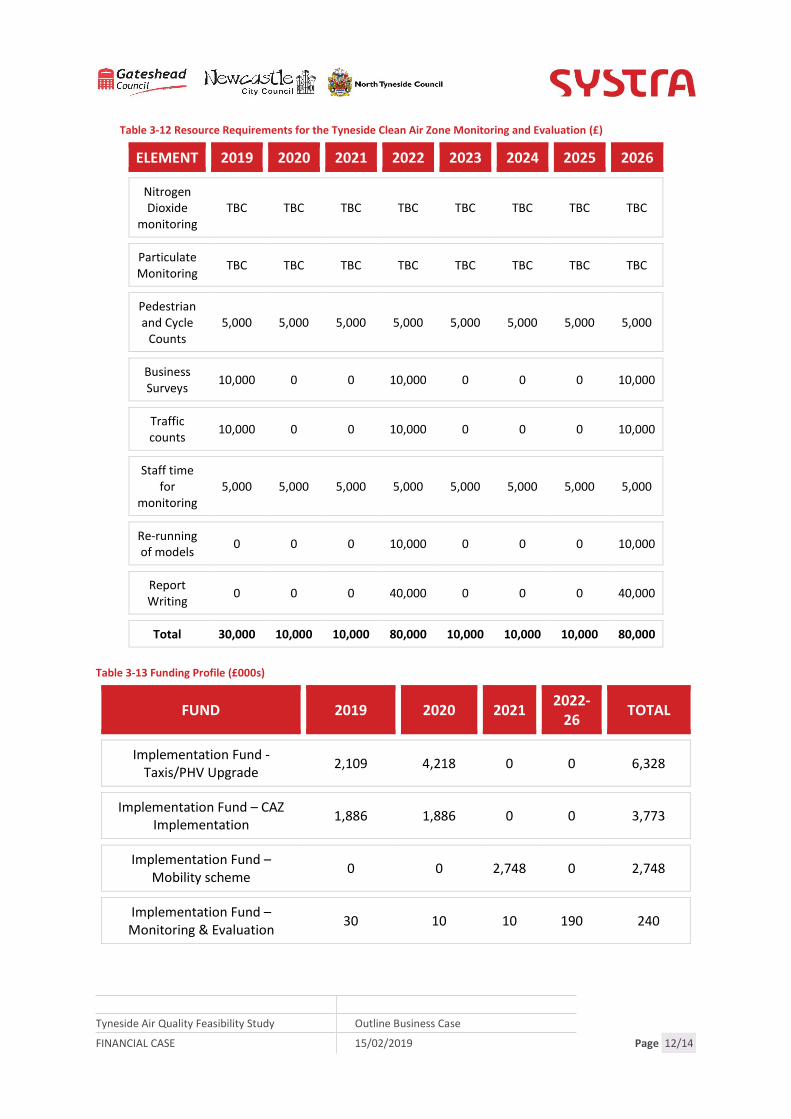
3.5.3 Further to this, as noted within the Management Case, there are costs which relate to monitoring and evaluation. These are primarily revenue costs, which are incurred as follows and it is proposed would be funded through the Implementation Fund:
Tyneside Air Quality Feasibility Study Outline Business Case
FINANCIAL CASE 15/02/2019 Page 12/14
Table 3-12 Resource Requirements for the Tyneside Clean Air Zone Monitoring and Evaluation (£)
ELEMENT 2019 2020 2021 2022 2023 2024 2025 2026
Nitrogen Dioxide
monitoring TBC TBC TBC TBC TBC TBC TBC TBC
Particulate Monitoring
TBC TBC TBC TBC TBC TBC TBC TBC
Pedestrian and Cycle
Counts 5,000 5,000 5,000 5,000 5,000 5,000 5,000 5,000
Business Surveys
10,000 0 0 10,000 0 0 0 10,000
Traffic counts
10,000 0 0 10,000 0 0 0 10,000
Staff time for
monitoring 5,000 5,000 5,000 5,000 5,000 5,000 5,000 5,000
Re-running of models
0 0 0 10,000 0 0 0 10,000
Report Writing
0 0 0 40,000 0 0 0 40,000
Total 30,000 10,000 10,000 80,000 10,000 10,000 10,000 80,000
Table 3-13 Funding Profile (£000s)
FUND 2019 2020 2021 2022-
26 TOTAL
Implementation Fund -Taxis/PHV Upgrade
2,109 4,218 0 0 6,328
Implementation Fund – CAZ Implementation
1,886 1,886 0 0 3,773
Implementation Fund – Mobility scheme
0 0 2,748 0 2,748
Implementation Fund – Monitoring & Evaluation
30 10 10 190 240

Tyneside Air Quality Feasibility Study Outline Business Case
FINANCIAL CASE 15/02/2019 Page 13/14
FUND 2019 2020 2021 2022-
26 TOTAL
Implementation Fund – Access Changes
0 402 0 0 402
Implementation Fund Total 4,025 6,516 2,758 190 13,491
Clean Air Fund- HGV Upgrade 1,542 3,084 0 0 4,628
Clean Air Fund- LGV Upgrade 1,751 3,502 0 0 5,254
Clean Air Fund – Car Upgrade 2,219 2,219 2,219 0 6,659
Clean Air Fund – Walking and Cycling
1,878 1,878 0 0 3,757
Clean Air Fund – Local Abatement
264 528 0 0 792
Clean Air Fund Total 7,654 11,211 2,219 0 21,090
TOTAL 11,679 17,727 4,977 190 34,581

Tyneside Air Quality Feasibility Study Outline Business Case
FINANCIAL CASE 15/02/2019 Page 14/14