air quality gradients in western oregon and washington indicated by lichen communities and chemical...
TRANSCRIPT
Air Quality Gradients in Western Oregon and Washington Indicated by Lichen Communities and Chemical Analysis of Lichen Tissue
Linda Geiser, USDA-Forest Service Pacific Northwest Region Air Program
Peter Neitlich, USDA-Forest Inventory Assessment/Forest Health Monitoring, Lichen Indicator
4 March 2003
Introduction
Lichens are used by the USFS to:
Monitor air quality
Help air managers make decisions regarding management of air resources
Support recommendations regarding PSD permits that affect forest resources, especially Wilderness

AQ Regulation
ORDEQ and WADOE:
Measure air pollutants
Plan and implement air pollution reduction strategies
Issue and enforce air pollution control permits for industry
Enforce other regulations
Inform, educate, and involve the public
AQ Regulation
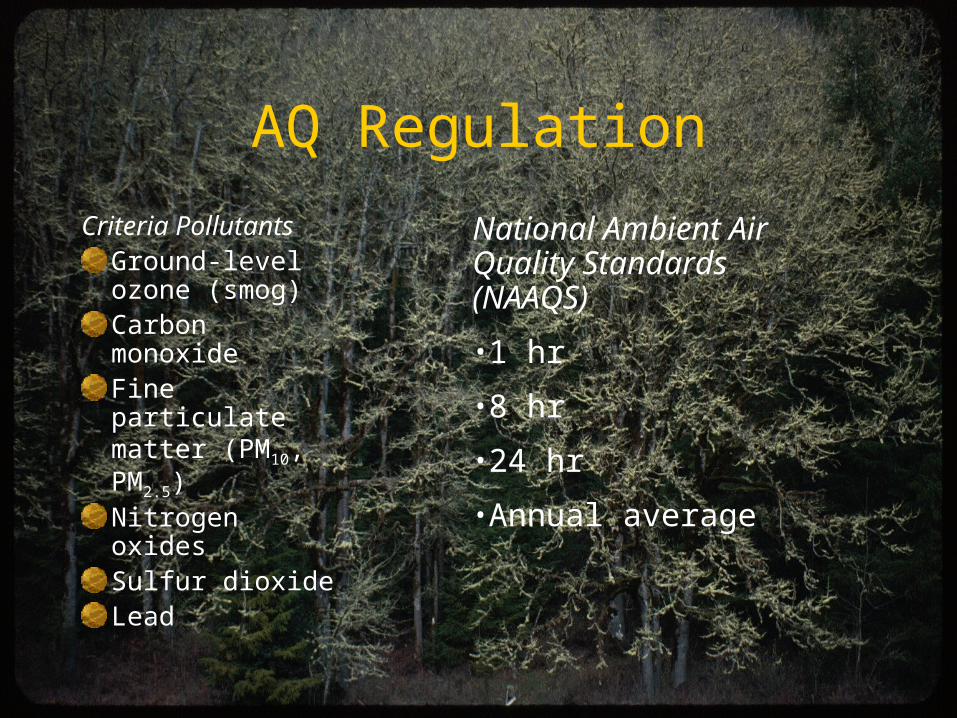
Criteria PollutantsGround-level ozone (smog)Carbon monoxide Fine particulate matter (PM10, PM2.5)Nitrogen oxidesSulfur dioxideLead
National Ambient Air Quality Standards (NAAQS)
•1 hr
•8 hr
•24 hr
•Annual average
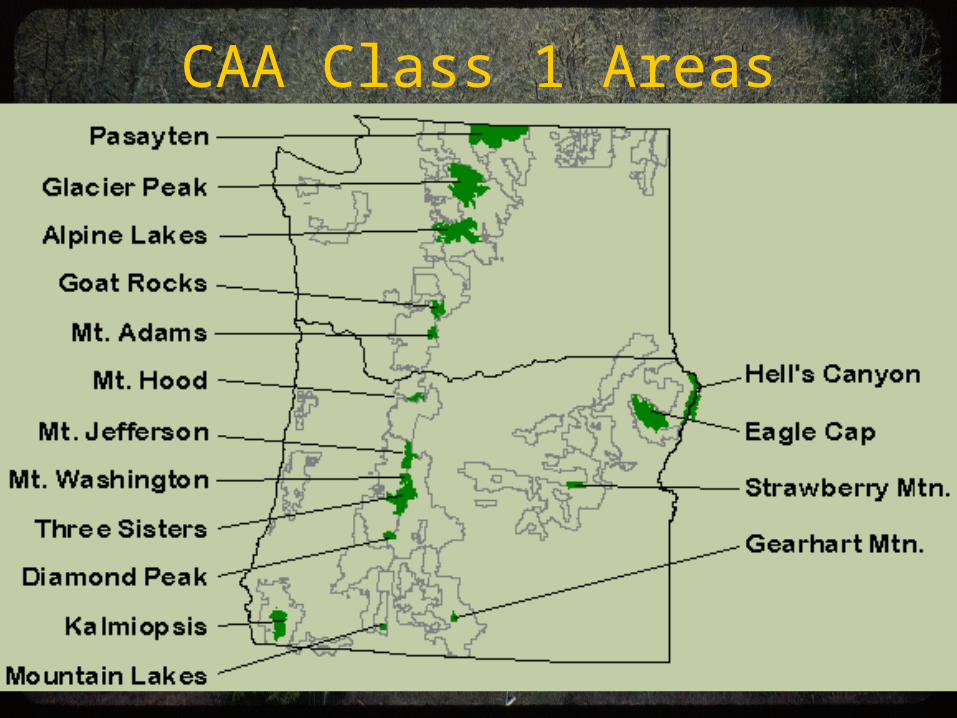
CAA Class 1 Areas

AQ Regulation
New Source Review includes the Prevention of Significant Deterioration (PSD) permitting process. New sources cannot exceed allowable increments for the criteria pollutants
Air Quality Related Values: flora and fauna, soil, water, visibility, biological diversity, cultural and archeological resources, odor
**Because the NAAQs are not sufficient to protect the most sensitive AQRVs, documenting concerns regarding effects on AQRVs is the primary way FLMs can protect air quality in Wilderness**

AQ RegulationTo monitor air pollution in the PNW, FLMs use:
Criteria Pollutant or AQRV Federally Sponsored Information Source
Visibility Nephalometers, IMPROVE, CameraPM10, PM2.5 NephalometersN, S deposition and effects on biodiversity and on terrestrial and aquatic resources
NADP, CastNet, lichens, water and snow
Ozone Active and passive monitorsPb IMPROVE, lichensCO Not measured

Emissions
Most pollution is from individual actions: Driving cars,using wood stoves,gas-powered lawn
mowers, motor boats, paints, aerosol products, outdoor burning
EPA National Emissions Inventory: http://www.epa.gov/ttn/chief/
Emissions
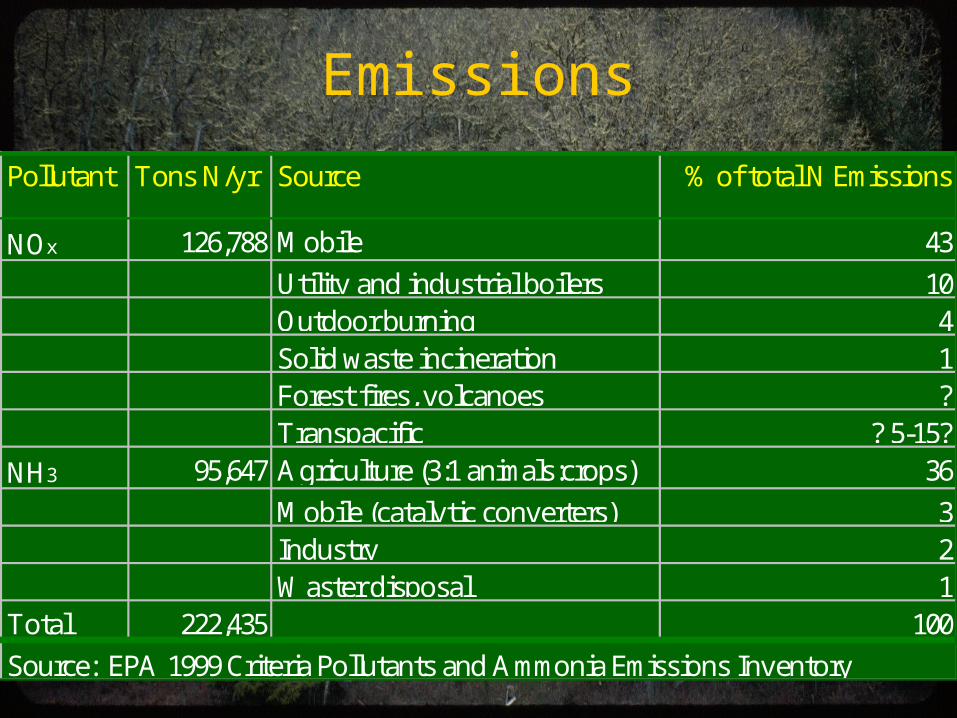
Pollutant Tons N/yr Source % of total N Emissions
NOx 126,788 Mobile 43
Utility and industrial boilers 10Outdoor burning 4Solid waste incineration 1Forest fires, volcanoes ?Transpacific ? 5-15?
NH3 95,647 Agriculture (3:1 animals:crops) 36
Mobile (catalytic converters) 3Industry 2Waster disposal 1
Total 222,435 100
Source: EPA 1999 Criteria Pollutants and Ammonia Emissions Inventory

Deposition


Trends
State 1980 population 2000 population % IncreaseOregon 2.6 million 3.4 million 30Washington 4.1 million 5.9 million 43
Trends
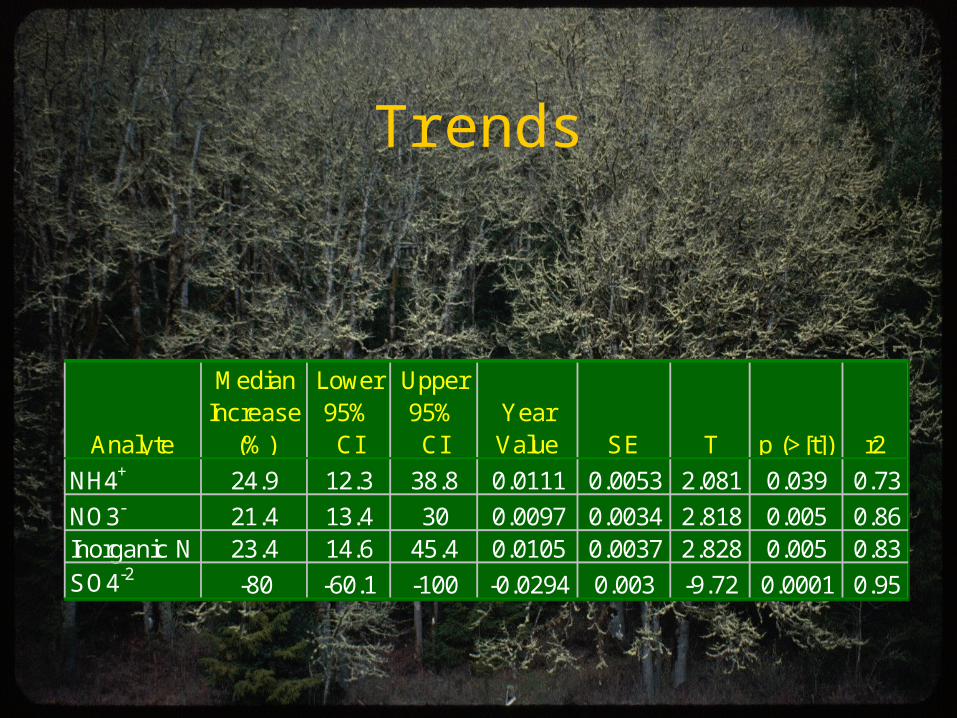
Analyte
Median Increase
(%)
Lower 95% CI
Upper 95% CI
Year Value SE T p (>[t]) r2
NH4+ 24.9 12.3 38.8 0.0111 0.0053 2.081 0.039 0.73
NO3- 21.4 13.4 30 0.0097 0.0034 2.818 0.005 0.86Inorganic N 23.4 14.6 45.4 0.0105 0.0037 2.828 0.005 0.83SO4-2 -80 -60.1 -100 -0.0294 0.003 -9.72 0.0001 0.95
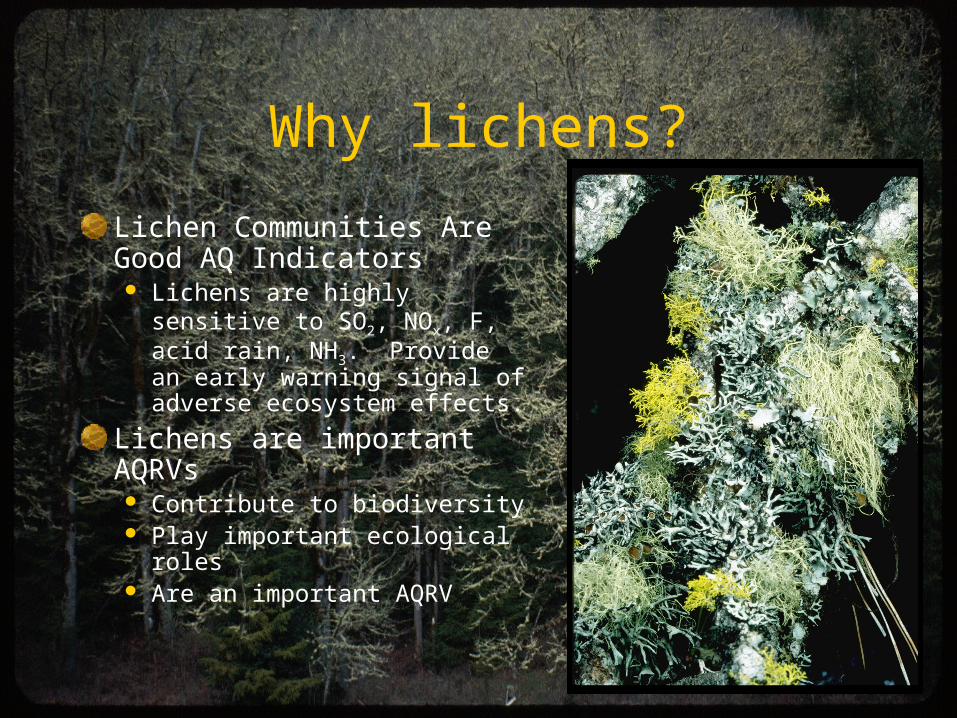
Why lichens?
Lichen Communities Are Good AQ Indicators Lichens are highly sensitive to
SO2, NOx, F, acid rain, NH3. Provide an early warning signal of adverse ecosystem effects.
Lichens are important AQRVs Contribute to biodiversity Play important ecological roles Are an important AQRV

Why lichens?Lichen Tissue Analyses also Indicate Air Quality Lichens are good accumulators of N, S, metals Lichens have consistent ranges in clean sites, different from
polluted sites
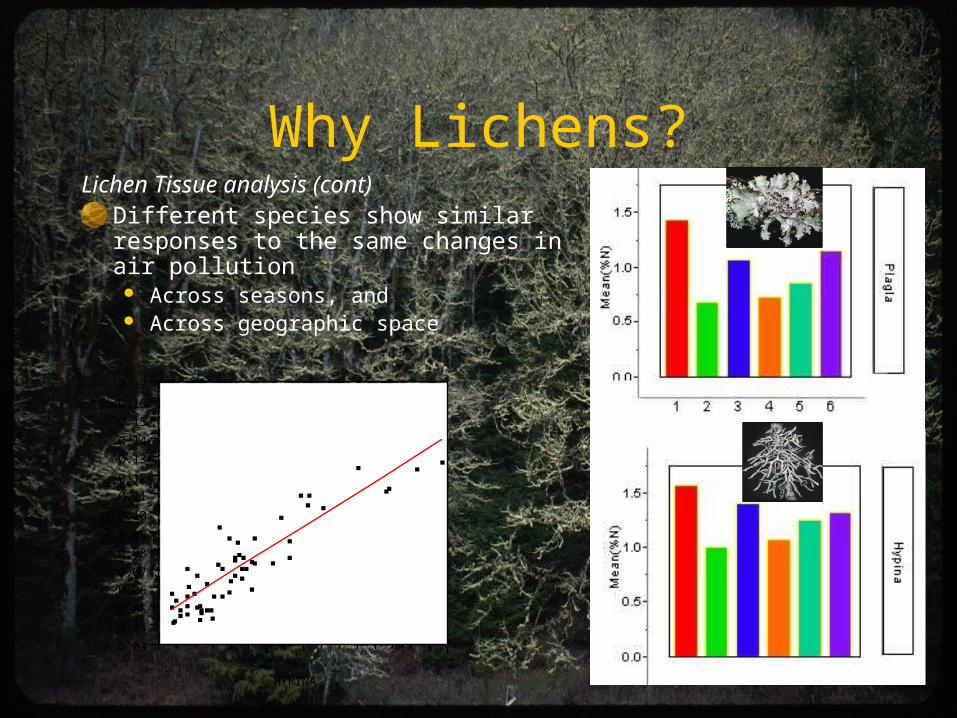
Why Lichens?Lichen Tissue analysis (cont)
Different species show similar responses to the same changes in air pollution Across seasons, and Across geographic space
PL
AG
LA
0.03
0.04
0.05
0.06
0.07
0.08
0.09
0.10
0.11
0.12
0.13
0.14
0.15
0.16
0.17
.1 .2
HYPINA

Federal Lichen Monitoring
FIA/FHM:28 km2 sampling grid over US forestsProvides early detection and quantification
of potential air pollution effects Monitors spatial and temporal changes
Lichens and Air Quality Workgrouphttp://ocid.nacse.org/research/airlichen/
workgroup
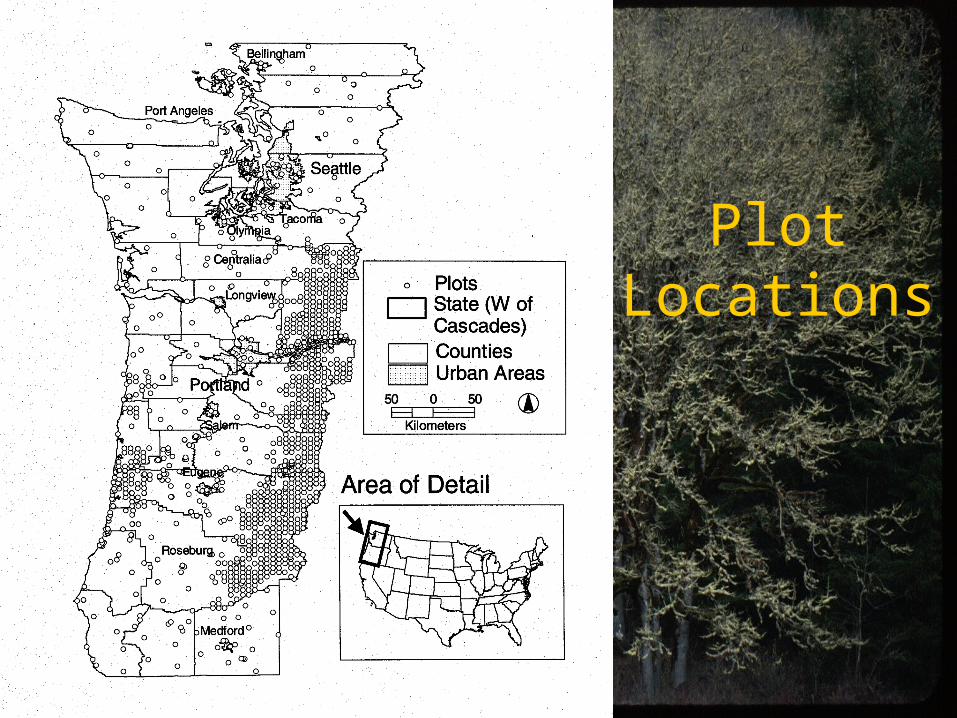
Plot Locations
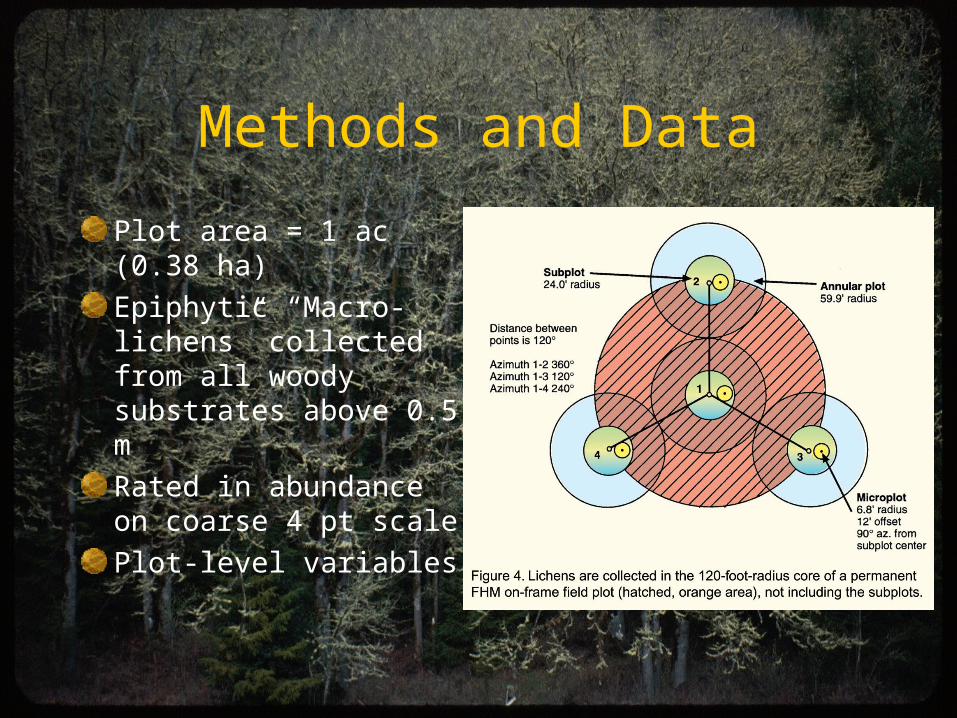
Methods and Data
Plot area = 1 ac (0.38 ha)
Epiphytic “Macro-lichens” collected from all woody substrates above 0.5 m
Rated in abundance on coarse 4 pt scale
Plot-level variables
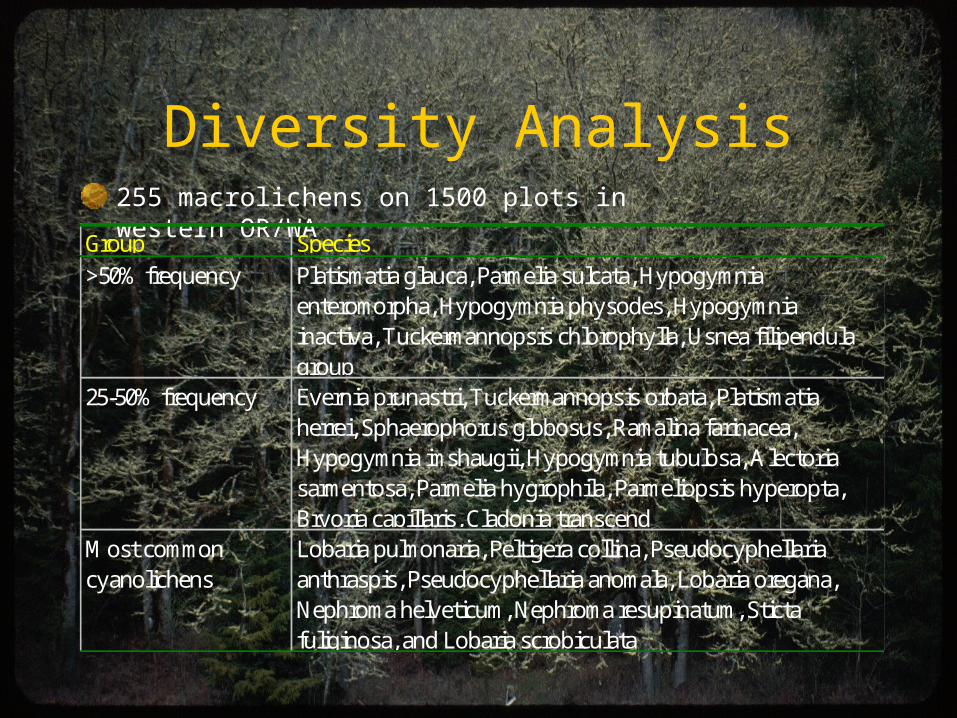
Diversity Analysis255 macrolichens on 1500 plots in western OR/WA
Group Species>50% frequency Platismatia glauca, Parmelia sulcata, Hypogymnia
enteromorpha, Hypogymnia physodes, Hypogymnia inactiva, Tuckermannopsis chlorophylla, Usnea filipendula group
25-50% frequency Evernia prunastri, Tuckermannopsis orbata, Platismatia herrei, Sphaerophorus globosus, Ramalina farinacea, Hypogymnia imshaugii, Hypogymnia tubulosa, Alectoria sarmentosa, Parmelia hygrophila, Parmeliopsis hyperopta, Bryoria capillaris, Cladonia transcend
Most common cyanolichens
Lobaria pulmonaria, Peltigera collina, Pseudocyphellaria anthraspis, Pseudocyphellaria anomala, Lobaria oregana, Nephroma helveticum, Nephroma resupinatum, Sticta fuliginosa, and Lobaria scrobiculata
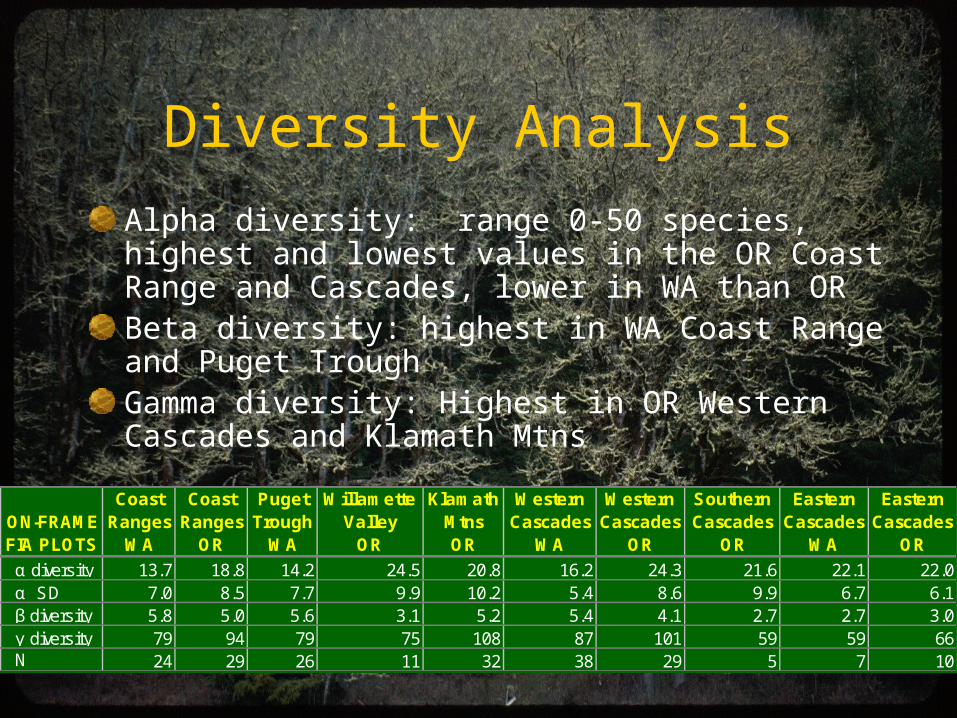
Diversity AnalysisAlpha diversity: range 0-50 species, highest and lowest values in the OR Coast Range and Cascades, lower in WA than ORBeta diversity: highest in WA Coast Range and Puget TroughGamma diversity: Highest in OR Western Cascades and Klamath Mtns
ON-FRAME FIA PLOTS
Coast Ranges
WA
Coast Ranges
OR
Puget Trough
WA
Willamette Valley
OR
Klamath Mtns OR
Western Cascades
WA
Western Cascades
OR
Southern Cascades
OR
Eastern Cascades
WA
Eastern Cascades
OR
α diversity 13.7 18.8 14.2 24.5 20.8 16.2 24.3 21.6 22.1 22.0 α SD 7.0 8.5 7.7 9.9 10.2 5.4 8.6 9.9 6.7 6.1 β diversity 5.8 5.0 5.6 3.1 5.2 5.4 4.1 2.7 2.7 3.0 γ diversity 79 94 79 75 108 87 101 59 59 66 N 24 29 26 11 32 38 29 5 7 10


Choosing the area to be Modeled
Mean Annual Extreme Min Temp
Mean Ann Precip
Mean July Max Temp

Multi-variate AnalysisInitial ordination
Problem: pollution signal is not separate from elevation, precipitation, or % hardwood– cannot tell how pollution alone affects lichen communities

Multivariate AnalysisSolution: Balance the data set
Assigned each plot to one of 12 gps. Began with 1500+ plots.Pollution (0/1) using threshold for clean sites %0.59 N, or urbanElevation (1,2,3): 0-800, 801-2200, >2200 ft)Hardwoods (0/1): <20, >20% BASorted plots within each group by precipitation and random #Selected 30 plots from each group to represent the precipitation range in that group90% of plots had tissue data
Group Poll? HWD? Elev Precip # Plots1 0 0 1 18-160 242 0 0 2 28-158 273 0 0 3 38-189 284 0 1 1 34-158 285 0 1 2 29-179 316 0 1 3 31-150 217 1 0 1 23-90 318 1 0 2 20-95 309 1 0 3 23-112 12
10 1 1 1 20-102 2811 1 1 2 54-131 2012 1 1 3 33-126 5

N Plagla
ElevLonContinentality
PNVTemp
CoastDis
% Rel Hum
Min Dec Temp
S Plagla
NMS Ordination
Axis 1
Axi
s 2
Polluted?01
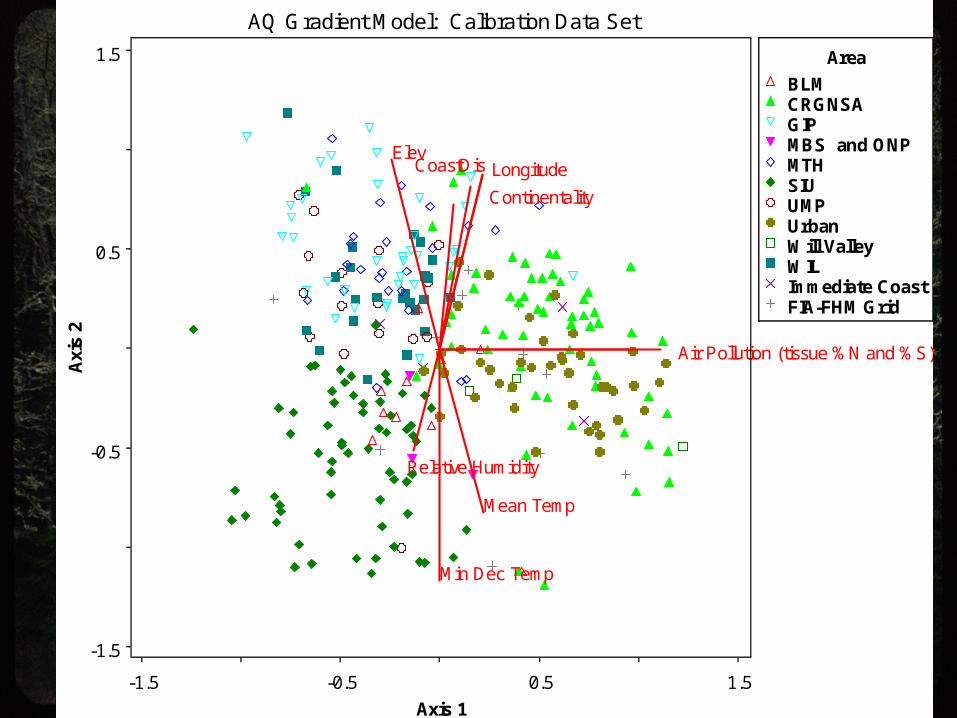
Air Pollution (tissue %N and %S)
ElevLongitude
Continentality
Mean Temp
CoastDis
Relative Humidity
Min Dec Temp
-1.5
-1.5
-0.5 0.5 1.5
-0.5
0.5
1.5
AQ Gradient Model: Calibration Data Set
Axis 1
Axi
s 2
Area
BLMCRGNSAGIPMBS and ONPMTHSIUUMPUrbanWill ValleyWILImmediate CoastFIA-FHM Grid
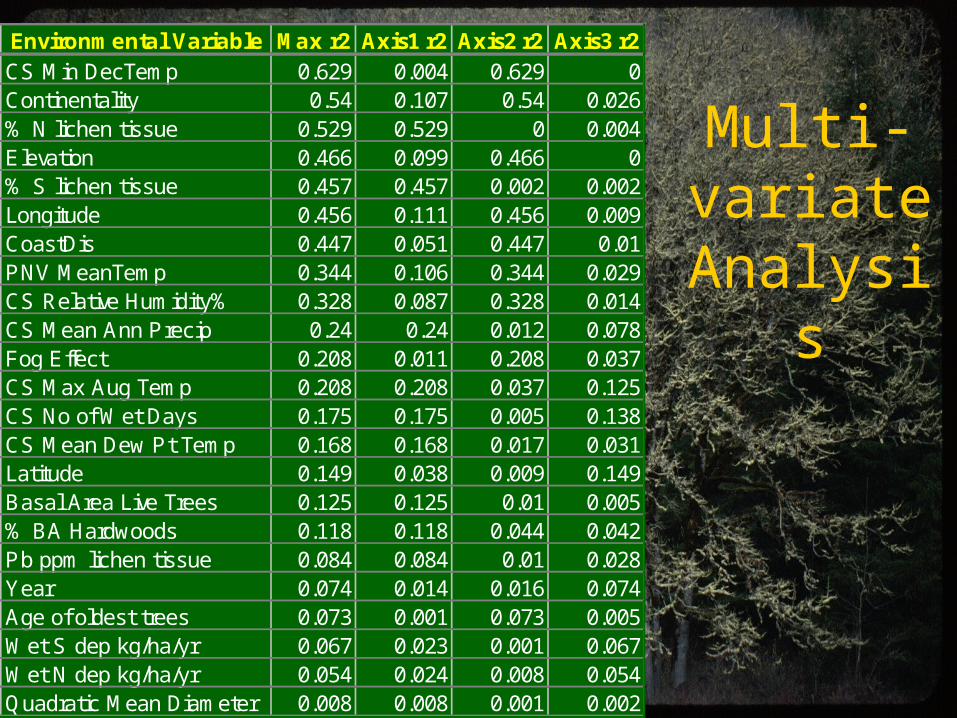
Multi-variate Analysis
Environmental Variable Max r2 Axis1 r2 Axis2 r2 Axis3 r2CS Min DecTemp 0.629 0.004 0.629 0Continentality 0.54 0.107 0.54 0.026% N lichen tissue 0.529 0.529 0 0.004Elevation 0.466 0.099 0.466 0% S lichen tissue 0.457 0.457 0.002 0.002Longitude 0.456 0.111 0.456 0.009CoastDis 0.447 0.051 0.447 0.01PNV MeanTemp 0.344 0.106 0.344 0.029CS Relative Humidity% 0.328 0.087 0.328 0.014CS Mean Ann Precip 0.24 0.24 0.012 0.078Fog Effect 0.208 0.011 0.208 0.037CS Max Aug Temp 0.208 0.208 0.037 0.125CS No of Wet Days 0.175 0.175 0.005 0.138CS Mean Dew Pt Temp 0.168 0.168 0.017 0.031Latitude 0.149 0.038 0.009 0.149Basal Area Live Trees 0.125 0.125 0.01 0.005% BA Hardwoods 0.118 0.118 0.044 0.042Pb ppm lichen tissue 0.084 0.084 0.01 0.028Year 0.074 0.014 0.016 0.074Age of oldest trees 0.073 0.001 0.073 0.005Wet S dep kg/ha/yr 0.067 0.023 0.001 0.067Wet N dep kg/ha/yr 0.054 0.024 0.008 0.054Quadratic Mean Diameter 0.008 0.008 0.001 0.002

Lichens of Polluted Areas r Lichens of Clean Areas rEvernia prunastri 0.77 Sphaerophorus globosus -0.67Xanthoria polycarpa 0.71 Hypogymnia enteromorpha -0.56Physcia adscendens 0.68 Hypogymnia appinata -0.48Ramalina farinacea 0.61 Lobaria oregana -0.47Parmelia sulcata 0.51 Alectoria sarmentosa -0.40Physcia aipolia 0.50 Platismatia herrei -0.37Melanelia exasperatula 0.48 Parmeliopsis hyperopta -0.34Candelaria concolor 0.44 Pseudocypellaria anthraspis -0.30Physconia perisidiosa 0.43 Nodobryoria oregana -0.30Physcia tenella 0.42 Usnea cornuta -0.29Melanelia fuliginosa 0.41 Cavernularia lophyrea -0.29Physconia enteroxantha 0.38 Menegazzia terrebrata -0.28Melanelia subaurifera 0.37 Pseudocypellaria crocata -0.27Xanthoria fallax 0.36 Platismatia norvegica -0.26Physconia isidigera 0.36 Bryoria capillaris -0.25Hypogymnia tubulosa 0.36 Usnea filipendula -0.25Ramalina subleptocarpha 0.28 Nephroma bellum -0.25Melanelia subelegantula 0.27 Cavernularia hultenii -0.24Xanthoria candelaria 0.26 Bryoria fuscescens -0.21

#### #
# ## ####
## ## ##### ## ### #### # #### ## #### ## ## # ### ## # ### #
# # ## #####
########## ##### ##### ####### #################### ####### #
########### ### #################### ## ## ####### ##### ### #### #######################
################ ########## # # ### ########### ### ## ####### ## ################ ## ######## #### ############## #################################### ## ## ########## #### ## ## ### ## ###### ##### ##### #### ### ## ########## ###### ## ########## ## ## ## ## ########### ### ### ## ## ### ##### # ### ## # ### ## ## ## ## #### ## #### ## ## ##### # # ## ## # ### ## ## ## ### ##### ## ## # #### # ####### # # ### #### # ##### # ## ## ## ### ## # ## ### ## ####### ####### ## ## ## ## ## ### ## ### ####### ### #### ## ### ####### ### #### ### # ### ## #### # ## ## ### ### # ##### ## ### ## ### #
############## ######## ######### ###### ####### ###### ### ##### ##########
######### ## ####### ### # ####### #### # ## ## ## ## ##### ## ## #### ## #### ### ############ ## # ######## ######### ## ## # ######## ## ## # # ##### ####### #### ### ###### #### # ########## ## ### ##############################################
# ### ######### # ## ##### ## ## ## #### ### # ### # #### #### ### ### ###### # ###### ##### #### ### # ###### ###### ## ##### #### ## ### ###### #### ## ### # #### ### # #### ### ## #### #### #### # ## ##### ###### ## ##### # ######## ## ### ### ### #### # # ### ######## ########### ################# ####### ##### ### ###### #### ## ######
### ######## #################
################## ########## ### ######## # ########## #### ## ##########
######### # #### ######### ## ########## ## ############ # # ### ####### # ## #### # ##### ## ##
## ### ### ## ## #
## # ### #### ##### ##
# ### #
## ### ## ### ###### ### ####### ## #
####### # ### ###
### ##
### #
# ### #
########
## ##### #
#
Roseburg
Olympia
Bellingham
Tacoma
Longview
Medford
Eugene
Salem
Port Angeles
Centralia
Portland
Seattle
Urban AreasState (W of Cascades)
Climate Score# Maritime (-1.249 - -0.384)# Valley (-0.384 - 0.051)# Foothills (0.051 - 0.377)# Montane (0.377 - 0.76)# High Elevation (0.76 - 1.743)
[
[
[
[
[ [
[
[
[[
[
[ [
[[[
[[[
[[ [ [
[[
[ [[[ [
[[
[ [
[ [ [[[[[
[[
[ [ [[
[
[ [
[[
[
[ [[
[[
[
[ [
[
[
[
[[
[
[
[ [
[[[ [ [[[ [[
[ [[[[
[ [
[
[
[
[
[
[
[[
[
[[
[
[ [
[
[
[
[
[
#### #
# ## ####
## ## ##### ## ### ### #
#### ## ## # ## # ### ## # ### ## # ## #
#### ######## ##### ### ####### ################# ####### #
########### ### ############### ## # ##### ##### ### #### ##################
############### ########## # # ## ########### ### ## ####### ## ############## ## ######## ### ############## ### ## ## #### #### ## ## # ## ###### ##### ##### #### ### ## ######## ##### ## ########## ## ## ## ## ########## ### ### ## ## ### ##### # ### ## # ### ## ## ## ## ### ## #### ## ## ##### # # ## ## # ### ## ## ## ### ## ## ## # #### # ####### # # ### ### # ##### # ## ## ## ### ## # ## ### ## #### ####### ## ## ## ## ## ## ## ### ####### ### ### ## ### ####### ### #### ## # ## ## #### # ## ## ### ### # ##### ## ### ## ### #
############ ## ####### ###### #####
###### ## ##### ########## # ####### ### # ###### ## # ## ## ## ## ##### ## ## ####
## #### ## ########### ## # ####### ######## ## ## # ######## ## ## # # ##### ###### #### ### #### #### # ########## ## ### ###########
# ## ######### # # ##### ## # ## ### ### # ## # ### ### ### ### ###### # ###### ### ### ### # ##### ##### # ### #### # ## ##### ### ## ## # #### ### # #### ### ## ### ### ### # ## ### ##### ## #### # ######## ## ### ### ### #### # #### ######## ########### ############ ####### ##### ## ###### # ## #####
## ####### ##############
############### ######### ### ######## ####### #### ## #########
######### # #### ######## ## ######## ## ########### # # ### ####### # ## #### # ##### ## ##
## ### ## ## ## ## # ### ##
## #### ## #
## ### ### ## ### ###### ### #####
## ## ######## # ### #
###
## ##### #
# ### #
########
## ##### #
#
Seattle
Portland
Centralia
Port Angeles
Salem
Eugene
Medford
Longview
Tacoma
Bellingham
Olympia
Roseburg
Urban AreasState (W of Cascades)
Cities (pop.)[ 10,000 - 25,000[ 25,000 - 50,000[ 50,000 - 100,000[ 100,000 - 200,000[ 200,000 - 1,000,000
Air Scores
Best AQ--All Sensitive Species Present (-1.4 - -0.19) Good AQ --90% Lobaria oregana quantile(-0.19 - -0.07)
Moderate AQ--90% quantile for Usnea filipendula and Bryoria capillaris (-0.07 - 0.13)
Fair AQ--Some of the Most Sensitive Species Absent (0.13 - 0.24)
Degraded AQ--Most of the Sensitive Species Absent (0.24 - 0.35)
Poor AQ--Weedy Nitrophilous Species Enhanced (0.35 - 0.49) Worst AQ--All Sensitive Species Absent (0.49 - 2)
#
#
#
#
#
#
#
AQ and Climate Response Maps

Air Pollution Response
Maps
Pollution indicators: X. polycarpaC. concolor
Sensitive species:L. oreganaS. globosus

Candelaria concolor
Physcia adscendens
Xanthoria polycarpa MeanNitro
Nitrophytic Nitrophytic Nitrophytic Nitrophytic1.37 1.74 1.35 1.491.35 1.35 1.30 1.331.23 1.11 1.10 1.140.92 0.87 0.80 0.860.69 0.59 0.57 0.620.38 0.35 0.33 0.350.14 0.15 0.14 0.14
-0.21 -0.09 -0.09 -0.13-0.42 -0.38 -0.19 -0.33
64 147 148 120
StatisticAlectoria
sarmentosaBryoria
capillarisLobaria oregana
Sphaerophorus
globosusUsnea
filipendulaUsnea
scabrata MeanSens Mean All SensSensitivity Quantile Sensitive Sensitive Sensitive Sensitive Sensitive Sensitive Sensitive SensitiveMax Score 100 0.30 0.32 0.21 0.55 0.88 0.58 0.47 0.40
97.5 0.15 0.21 0.05 0.13 0.49 0.44 0.24 0.2190 -0.01 0.05 -0.07 0.03 0.14 0.11 0.04 0.02
Quartile 75 -0.14 -0.08 -0.19 -0.09 0.03 -0.02 -0.08 -0.11Median 50 -0.29 -0.24 -0.32 -0.24 -0.12 -0.15 -0.23 -0.25Quartile 25 -0.43 -0.39 -0.46 -0.41 -0.27 -0.27 -0.37 -0.39
10 -0.57 -0.50 -0.66 -0.56 -0.41 -0.45 -0.52 -0.552.5 -0.75 -0.69 -0.84 -0.76 -0.55 -0.62 -0.70 -0.72
Min Score 0 -1.00 -1.37 -1.19 -1.19 -1.37 -0.76 -1.14 -1.11N 725 360 202 577 517 192 429 802
Standard Error[
[
[
[
[ [
[
[
[[
[
[ [
[[ [[
[[
[[ [ [
[[[ [
[[ [[
[
[ [
[ [ [[[[
[ [[
[ [ [[
[
[ [
[[[
[ [[
[[
[[ [
[
[
[
[[
[
[
[ [
[[[ [
[[[ [[
[[[[[
[[
[
[
[
[
[
[
[[
[
[[
[
[ [
[
[
[
[
[
Port Angeles
Centralia
Tacoma
Salem
Olympia
Longview
Medford
Bellingham
Eugene
Roseburg
Seattle
PortlandStandard Error Kriged Air Scores
0.247 - 0.2670.267 - 0.2870.287 - 0.3070.307 - 0.3270.327 - 0.3470.347 - 0.368
0.227 - 0.247
Urban AreasState (W of Cascades)
Cities (pop.)[ 10,000 - 25,000[ 25,000 - 50,000[ 50,000 - 100,000[ 100,000 - 200,000[ 200,000 - 1,000,000
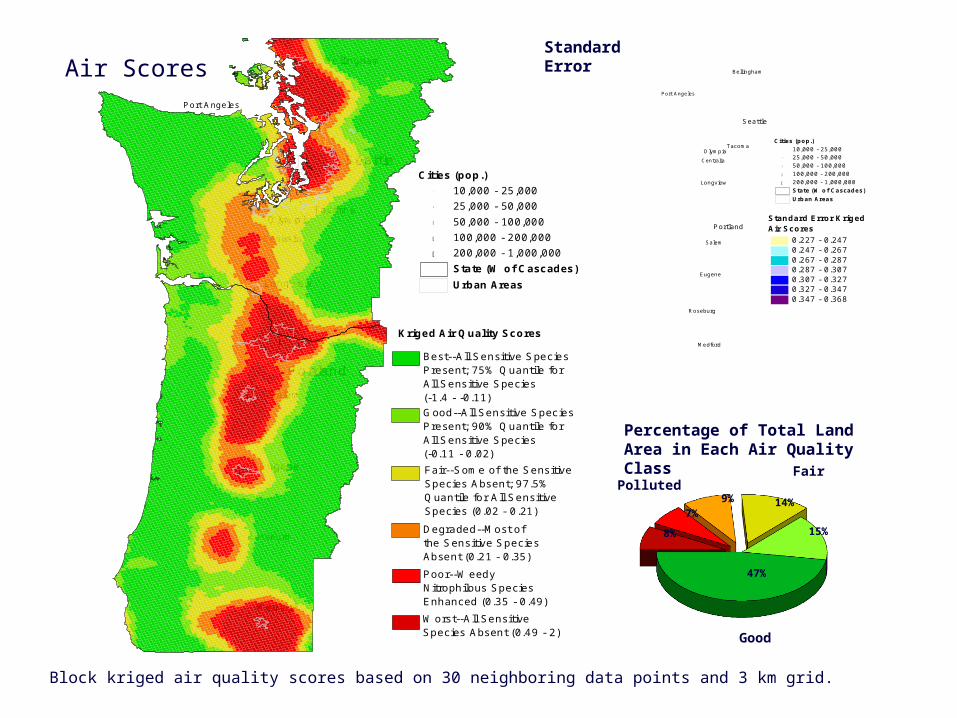
Block kriged air quality scores based on 30 neighboring data points and 3 km grid.
8%
9%
7%14%
15%
47%
Good
FairPolluted
Percentage of Total Land Area in Each Air Quality Class
Air Scores[
[
[
[
[ [
[
[
[[
[[ [
[[[
[[[
[[ [ [[[
[ [[[ [
[[
[ [
[ [ [[[[[ [[
[ [ [[
[
[ [
[[
[
[ [[
[[
[
[ [
[
[
[
[[
[
[
[ [
[[[ [ [[[ [[
[ [[[[[
[
[
[
[
[
[
[
[[
[
[[
[
[ [
[
[
[
[
[
Portland
Seattle
Eugene
Bellingham
Medford
OlympiaTacoma
Centralia
Port Angeles
Longview
Roseburg
Salem
Kriged Air Quality Scores
Best--All Sensitive Species Present; 75% Quantile for All Sensitive Species (-1.4 - -0.11) Good--All Sensitive SpeciesPresent; 90% Quantile for All Sensitive Species (-0.11 - 0.02) Fair--Some of the Sensitive Species Absent; 97.5%Quantile for All SensitiveSpecies (0.02 - 0.21)
Degraded--Most of the Sensitive Species Absent (0.21 - 0.35)
Poor--Weedy Nitrophilous Species Enhanced (0.35 - 0.49)
Worst--All Sensitive Species Absent (0.49 - 2)
Urban AreasState (W of Cascades)
Cities (pop.)[ 10,000 - 25,000[ 25,000 - 50,000[ 50,000 - 100,000[ 100,000 - 200,000[ 200,000 - 1,000,000
[
[
[
[
[ [
[
[
[[
[[ [
[[[
[[[
[[ [ [[[
[ [[[ [
[[
[ [
[ [ [[[[[ [[
[ [ [[
[
[ [
[[
[
[ [[
[[
[
[ [
[
[
[
[[
[
[
[ [
[[[ [ [[[ [[
[ [[[[[
[
[
[
[
[
[
[
[[
[
[[
[
[ [
[
[
[
[
[
Portland
Seattle
Eugene
Bellingham
Medford
OlympiaTacoma
Centralia
Port Angeles
Longview
Roseburg
Salem

Conclusions
Lichen communities show location and relative severity of air pollution impactsLow levels of anthropogenic nitrogen and sulfur (primarily as SO2, acid rain, and fertilizing N) detrimentally affect lichen communities.Combined with trends and instrument monitoring lichens provide a broad picture of relatively clean region with impacts primarily to: Corridors with densest population, high traffic volume, industrial
development, multiple small point sources, and intensive agriculture
In the 1990s the total area with some AQ deterioration was 24-38%
ConclusionsFuture Information Needs
Continued monitoring to detect trendsHigher density of plots in some areas, lower in othersEstablish acceptable thresholds for tissue data and lichen community scores to aid decision-making processes.Better differentiation of effects of individual pollutants (NO3 and SO4 vs NH3, oxidants, F) on lichen communitiesMulti-methodologies approach: combine biomonitors, water and snow chemisry data with active/passive monitoring of ambient air and deposition

Conclusions
Air quality and our future Bottom Line: growing population equals growing
transportation, food, and energy needs, therefore to maintain the same AQ requires stabilizing population, and/or reducing emissions.

Acknowledgements
Abbey Rosso Adam Blackwood Aimee Lundee Alexander Mikulin Anne Ingersoll Bruce McCune Carolina Hooper Cheryl Coon Chiska Derr Christine Lindquist Christine Ott-Hopkins Colleen Rash Cort Skolout Dan Powell Daphne Stone Deigh Bates Delphine Miguet Dottie Riley Doug Glavich Eric Peterson Eric Phenix Eric Youngstrom Heath Kierstead Heather Laub Jason Unrine Jen Kalt Jenifer Hutchinson Jim Belsher-Howe Jim Riley Jim Russell John Coulston John Kelley John Wade Jon Martin Julie Evans Ken Snell Ken Stolte Kim Gossen Kristin Myers Linda Chesnut Linda Hasselbach Mark Boyll Mark Pistrang Mike Kania Nancy Diaz Natalia Bonilla Pekka Halonen Riban Ulrich Richard Helliwell Rick Shorey Roger Eliason Roger Rosentreter Sally Campbell Sally Claggett Samuel Solano Sarah Butler Sarah Jovan Scott Rash Shanti Berryman Star Hormann Suzy Will-Wolf Tom High Trevor Goward Walter Foss Walter Grabowiecki William Bechtold Yarrow Wolfe