air quality in ontario · i 2011 report highlights ontario air quality is improving • the 2011...
TRANSCRIPT

Air Quality in Ontario
Report for 2011

Acknowledgements This report has been prepared by the staff of the Environmental Monitoring and Reporting Branch of the Ontario Ministry of the Environment. Environment Canada’s National Air Pollution Surveillance program is acknowledged for providing air monitoring instrumentation to the province of Ontario.
Cette publication hautement spécialisée n’est disponible qu’en anglais en vertu du reglement 441/97, qui en exempte I’application de la Loi sur les services en français. Pour obtenir de l’aide en français, veuillez communiquer avec le ministère de l’Environnement au Centre d’information, 416-325-4000 ou 1-800-565-4923.
For more information: Ministry of the Environment Public Information Centre Telephone: 416-325-4000 Toll free: 1-800-565-4923 Email: [email protected] www.ontario.ca/environment © Queen’s Printer for Ontario, 2013 PIBS 9196e

i
2011 Report Highlights ONTARIO AIR QUALITY IS IMPROVING • The 2011 air quality report marks 41
years of long-term reporting on the state of air quality in Ontario. This report summarizes province-wide trends for key airborne pollutants impacting Ontario’s air quality.
• Overall, air quality has improved significantly over the past 10 years, especially for nitrogen dioxide (NO2), carbon monoxide (CO) and sulphur dioxide (SO2) - pollutants emitted by vehicles and industry, as well as fine particulate matter (PM2.5), which may be emitted directly or from other emissions such as SO2.
• Ozone is a secondary pollutant formed when nitrogen oxides (NOx) and volatile organic compounds (VOCs) react in the presence of sunlight. Ozone annual means have increased by 7 per cent from 2002 to 2011, however, ozone summer means continue to show improvement and have decreased by 9 per cent over the same period.
ONTARIO EMISSIONS ARE DECREASING • Emissions of nitrogen oxides (NOX), CO and
SO2 continue to decrease due in part to Ontario’s air quality initiatives such as the phase-out of coal-fired generating stations, emissions trading regulations (O. Reg. 397/01 and O. Reg. 194/05), emissions controls at Ontario smelters, and Drive Clean emissions testing, which supports the federal vehicle emission standards and lower sulphur content in transportation fuels.
Decreasing Provincial Ambient Concentrations
NO2 41% (2002-2011)
CO 35% (2002-2011)
SO2 52% (2002-2011)
PM2.5 30% (2003-2011)
Decreasing Provincial Emissions (2001-2010)
NOx 36%
CO 24%
SO2 55%
PM2.5 33%

ii
• Transboundary influences, mainly from the U.S., account for approximately half of Ontario’s smog. Emission reductions in Ontario and the U.S. have contributed to decreases in PM2.5 and summer ozone levels. Winter and annual ozone levels are increasing due to a global rise in ozone levels.
THE ONTARIO AMBIENT AIR QUALITY CRITERIA (NO2, CO, SO2, and O3) • During 2011, the provincial Ambient Air Quality Criteria (AAQC) for
NO2, CO and SO2 were not exceeded in any regions of Ontario where ambient air monitoring exists.
• The provincial one-hour AAQC for O3 was exceeded at 28 of the 40 ambient air monitoring sites in 2011 for at least one hour, and these exceedances exclusively occurred in summer from May to September.
THE CANADA-WIDE STANDARDS (CWS) (PM2.5 and Ozone) • For a fourth year in a row, the CWS for PM2.5 was not exceeded in
Ontario. The PM2.5 CWS 3-year metrics are trending downwards from 2005 to 2011.
• Six of the 21 designated sites met the CWS for ozone in 2011. For the first time, Barrie, London, Mississauga, and Sudbury met the CWS for ozone. The ozone CWS 3-year metrics are trending downwards from 2005 to 2011.

Table of Contents
2011 Report Highlights.............................................. i Section 1.0 Introduction.......................................................... 1-1
Section 2.0 Ground-Level Ozone...............................................
2-1
Section 3.0 Particulate Matter in the Air.....................................
3-1
Section 4.0 Other Air Pollutants................................................
4-1
Section 5.0 Air Quality Index and Smog Advisories.....................
5-1
Glossary.................................................................. 6-1 Acronyms................................................................ 7-1 References............................................................... 8-1 Appendices.............................................................. A-i Appendix A: Annual Statistics.................................. A-1 Appendix B: 10y Trends......................................... B-1 Appendix C: 20y Ozone Trends............................... C-1 Appendix D: 20y NO2 Trends................................... D-1 Appendix E: 20y SO2 Trends................................... E-1 Appendix F: Summary of Smog Advisories and Smog
Advisory Days (2005-2011)..................
F-1

1-1
1.0 Introduction This annual report, the 41st in a series, summarizes the state of ambient air quality in Ontario during 2011 and examines 10-year trends. It reports on the measured levels of six common air pollutants: ground-level ozone (O3), fine particulate matter (PM2.5), nitrogen dioxide (NO2), carbon monoxide (CO), sulphur dioxide (SO2) and total reduced sulphur (TRS) compounds. The report also summarizes the results from the Air Quality Index (AQI) and Smog Alert programs. The annual statistics and 10- and 20-year trends of ambient air quality data are presented in the attached appendix.
Ontario continues to benefit from one of the most comprehensive air monitoring systems in North America, comprised of 40 monitoring sites across the province that undergo regular maintenance and strict data quality assurance and quality control (QA/QC) procedures to ensure a high standard of data quality. The data, which are collected continuously at these sites, are used to determine the current state of air quality and reported in near real-time on the ministry’s website at www.airqualityontario.com.
The Ministry of the Environment uses this information to:
inform the public about Ontario’s ambient air quality; assess Ontario’s air quality and evaluate long-term trends; identify areas where criteria and standards are exceeded; provide the basis for air policy/program development; determine the impact from U.S. and Canadian sources on Ontario’s air
quality; provide scientists with air quality data to link environmental and human
health effects to pollution levels; and provide smog advisories for public health protection.

2-1
2.0 Ground-Level Ozone Ground-level ozone is a gas formed when nitrogen oxides (NOX) and volatile organic compounds (VOCs) react in the presence of sunlight. While ozone at ground level is a major environmental and health concern, the naturally occurring ozone in the stratosphere is beneficial as it shields the earth from harmful ultraviolet radiation. 2.1 Characteristics, sources and effects Ozone is a colourless, odourless gas at typical ambient concentrations, and is a major component of smog. Ozone is not generally emitted directly into the atmosphere; the formation and transport of ozone are strongly dependent on meteorological conditions and emissions of chemical precursors. Changing weather patterns contribute to differences in ozone concentrations hourly, daily, seasonally and year-to-year. In Ontario, elevated concentrations of ground-level ozone are typically recorded on hot and sunny days from mainly May to September, between noon and early evening. Figure 2.1 shows the 2010 estimates of Ontario’s VOC emissions from point, area and transportation sources. Transportation sectors accounted for approximately 36 per cent of VOC emissions. General solvent use was the second largest source of VOC emissions, accounting for approximately 26 per cent. Figure 2.2 shows the 2010 estimates of Ontario’s NOX emissions from point, area and transportation sources. Transportation sectors accounted for approximately 71 per cent of NOX emissions (NPRI, 2012).
General Solvent Use26%
Other Transportation
23%Road Vehicles
13%
Other Industrial Processes
13%
Miscellaneous3%
Residential8%
Printing/Surface Coating
14%
Figure 2.1Ontario Volatile Organic Compounds Emissions by Sector (Emissions from Point/Area/Transportation Sources, 2010 Estimates)
Note: Provincial total 409 kilotonnes. Excludes open and natural sources.
Data Source: NPRI, 2012.

2-2
Other Transportation
46%
Miscellaneous8%
Utilities7%
Cement and Concrete
4%
Other Industrial Processes
7%
Road Vehicles25%
Smelters/Primary Metals
3%
Figure 2.2Ontario Nitrogen Oxides Emissions by Sector (Emissions from Point/Area/Transportation Sources, 2010 Estimates)
Note: Provincial total 383 kilotonnes. Excludes open and natural sources.
Data Source: NPRI, 2012.
Ozone irritates the respiratory tract and eyes. Exposure to ozone in sensitive people can result in chest tightness, coughing and wheezing. Children who are active outdoors during the summer, when ozone levels are highest, are particularly at risk. Individuals with pre-existing respiratory disorders, such as asthma and chronic obstructive pulmonary disease (COPD), are also at risk. Ozone has been linked to increased hospital admissions and premature deaths. Ozone also causes agricultural crop loss each year in Ontario, with visible leaf damage in many crops, garden plants and trees, especially during the summer months.
2.2 Monitoring results for 2011 During 2011, ozone was monitored at 40 Ontario Ministry of the Environment AQI monitoring stations. The highest annual mean was 32.8 parts per billion (ppb), measured at Grand Bend and Port Stanley, transboundary-influenced sites on the eastern shore of Lake Huron and the northern shore of Lake Erie, respectively. The lowest annual mean, 20.1 ppb, was measured at Toronto West, an urban site located near a major transportation corridor, Highway 401 and directly impacted by local nitric oxide (NO) emissions from vehicles. Generally, ozone concentrations are lower in urban areas because ozone is reduced by reacting with NO emitted by vehicles and other local combustion sources. Ground-level ozone concentrations continued to exceed the provincial one-hour ambient air quality criterion (AAQC) of 80 ppb across the province. In 2011, Ontario’s one-hour AAQC for ozone was exceeded at 28 of the 40 AQI stations for at least one hour, and these exceedances exclusively occurred

2-3
from May to September, which is considered as the summer period in this report. The maximum one-hour ozone concentrations ranged from a low of 60 ppb recorded in Thunder Bay to 115 ppb recorded at Grand Bend. Windsor Downtown recorded the most instances (42) when ozone exceeded Ontario's one-hour AAQC.
Figure 2.3 shows the geographical distribution of one-hour ozone exceedances across Ontario in 2011. Generally, higher numbers of one-hour ozone exceedances were recorded in southwestern Ontario, on the eastern shore of Lake Huron and the northern shore of Lake Erie, than over central and eastern Ontario. There were no ozone exceedances in the north. As stated in the Transboundary Air Pollution in Ontario report, elevated ozone levels in southwestern Ontario are generally attributed to the long-range transport of pollutants into Ontario from the United States. Transboundary air pollution is combined with local emissions of smog-related pollutants, and can impact various areas of the province during a smog episode (Yap, Reid, De Brou, & Bloxam, 2005).
8
12
Mississauga
NewmarketBrampton
Guelph
HamiltonBurlington
Oakville
TorontoOshawa
Kitchener
St. Catharines
Ottawa
London
Merlin
Grand Bend
Tiverton
North Bay
Lake Ontario
Thunder Bay
Lake SuperiorGeorgian Bay
Brantford
14
4
98
8
12
30
3
0
50
4
89
202
Sarnia London
Port Stanley
Chatham
Grand Bend
TivertonKingston
North Bay
Dorset
Lake Ontario
Lake Erie
Lake Huro
n
Thunder Bay
Lake Superior
Georgian
Bay
Parry Sound
Windsor
PeterboroughBarrie
Belleville
Brantford
MorrisburgCornwal
Sault Ste. Marie
Sudbury Petawawa
Ottawa
30
4216
12
2010
00 0
0
0
0
0
0
062
01
06
2
6
1
4
4
3
6
4
2
21
3
Figure 2.3Distribution of One-Hour Ozone Exceedances Across Ontario 201Geographical in 1
6-10>10
0
1-5
Figure 2.4 shows ozone summer (May – September) means of hourly concentrations in 2011 for cities with population greater than 100,000 in the Great Lakes Basin, including 18 sites in Ontario and 14 sites in the U.S.

2-4
Ozone summer means were generally lower in central and northern Ontario than southwestern Ontario and the U.S. Relatively high ozone concentrations at the Windsor and Kingston sites were largely impacted by transboundary pollution, whereas relatively low ozone levels at urban sites like Toronto were reduced by reactions with NO emitted by local vehicles.
Thunder Bay
Toledo
Barrie
Mississauga
Sudbury
Toronto
Brampton
Oshawa
Syracuse
Oakville
Peterborough
Kitchener
London
Brantford
St. Catharines
Guelph
Kingston
Erie
Fort Wayne Akron
WindsorDetroit
Flint
Warren
Green Bay
South Bend
Lansing
Chicago
Milwaukee
Cleveland
24 HamiltonBurlington
> 31
28-29
< 28
Figure 2.4Geographical Distribution of Ozone Summer Means (ppb) in 2011in the Great Lakes Basin
Great Lake Basin
30-31
27
2727
26
26
28
29
29
29
29
31
30 30
30
31
32
3131
32
32
32
32
32
32
32
33
33
33
35
35
2.3 Trends The trend of the ozone annual means is shown in Figure 2.5 for the 10-year period of 2002 to 2011. The data show an increasing trend (7 per cent) in the ozone annual means over the 10-year period. Table 2.1 shows the spatial variability of ozone annual means in 2011 and trends of annual means from 2002 to 2011 at North Bay in northeastern Ontario; Ottawa in eastern Ontario; Toronto in central Ontario; and Windsor in southwestern Ontario. Ozone annual means and trends throughout the

2-5
10-year period differ at these four sites: the ozone annual means at North Bay and Ottawa slightly increased by approximately 2 per cent, while Toronto increased by 11 per cent and Windsor increased by 28 per cent. The increase in the ozone annual means at the Windsor site may be generally attributed to the reduction of NOX emissions and the changeover in vehicle fleet which in turn lessened the effect of ozone titration by NO in the urban centre.
15
20
25
30
35
40
2002 2003 2004 2005 2006 2007 2008 2009 2010 2011
Conce
ntr
atio
n (
ppb)
Annual Mean 7%
Note: Ten-year trend is a composite annual mean based on data from 36 monitoring sites.
Figure 2.5Trend of Ozone Annual Means Across Ontario (2002-2011)
↑
Table 2.1: Ozone Annual Means (ppb) in 2011 and Per Cent Change from 2002-2011 at Four Select Cities.
City Ozone Annual Mean (ppb) in
2011
Per Cent Change of Ozone Annual Mean
(2002-2011) North Bay 26.7 ↑ 2% Ottawa 24.2 ↑ 2% Toronto 25.4 ↑ 11% Windsor 27.2 ↑ 28%
The trend of ozone summer means and ozone winter means, as recorded at Ontario’s 36 air monitoring sites with sufficient data, is shown in Figure 2.6 for the 10-year period of 2002 to 2011. The ozone summer means have decreased by approximately 9 per cent, whereas the ozone winter means have increased by approximately 22 per cent over the past 10 years (2002 to 2011). Although the ozone winter means increased over the past 10 years, the provincial one-hour AAQC of 80 ppb for ozone was not exceeded at any of the 40 AQI sites during the winter of 2011. The increase in winter means, as shown in Figure 2.6, resulted in the overall increasing trend of ozone annual means.

2-6
15
20
25
30
35
40
2002 2003 2004 2005 2006 2007 2008 2009 2010 2011
Conce
ntr
atio
n (
ppb)
Summer Mean 9%
Winter Mean 22%
Note: Ten-year trends are composite means for the summer and winter months based on data from 36 monitoring sites. Summer: May - September; Winter: January - April, October - December.
Figure 2.6Trend of Ozone Summer and Winter Means (ppb) Across Ontario (2002-2011)
↑
↓
Elevated ozone concentrations in Ontario are typically recorded during the summer months due to the local production of pollution, and transboundary pollution under certain weather conditions. The decrease in summer means over the past 10 years is largely due to the progressive reductions of NOX emissions in Ontario and the U.S. resulting in the decrease in local ozone formation and transboundary influences especially during the summer months. In contrast, local ozone production is at its lowest in winter, and the increasing ozone winter means are mainly attributed to the rising global background concentrations, and lessened NO titration effects as a result of the reduced NOX emissions. The increase in ozone annual means can be attributed to the reductions in local NOX emissions, the rising global background ozone concentrations, and the variability in meteorological conditions (Yap et al., 2005). 2.4 The Canada-wide Standard for Ozone In 2000, the Canadian Council of Ministers of the Environment (CCME) developed a Canada-wide Standard (CWS) for ozone as a result of the pollutant’s adverse effects on human health and the environment. As referenced in the Guidance Document on Achievement Determination (GDAD), the CWS for ozone is 65 ppb, which is based on eight-hour running average time and the 4th highest annual ambient measurement averaged over three consecutive years (Canadian Council of Ministers of the Environment, 2002).

2-7
Table 2.2 displays the calculated ozone CWS 3-year metric for designated sites where populations are greater than 100,000 across Ontario from 2005 to 2011. In 2011, six of the 21 designated sites met the CWS of 65 ppb for ozone. The communities in Barrie, London, Mississauga and Sudbury met the CWS for ozone for the first time in 2011, indicating, once again, that air quality in Ontario has improved recently. The downward trend of ozone CWS metrics from 2005 to 2011 (Table 2.2) is consistent with the declining summer means (Figure 2.6) since CWS metrics are calculated from the 4th highest ozone concentrations that are usually recorded during the summer months. Table 2.2: Ozone CWS Metric (ppb) for Designated Sites Across Ontario
City 2003
– 2005
2004 –
2006
2005 –
2007
2006 –
2008
2007 –
2009
2008 –
2010
2009 –
2011
Change over time
Windsor Downtown 82 81 89 85 81 74 75 ↓ 11% Chatham n/a 86 86 80 78 73 72 ↓ 18% London 74 70 73 72 69 67 65 ↓ 11% Brantford n/r n/r n/r n/r n/r n/r 72 ‐ Kitchener 79 74 77 74 71 68 66 ↓ 15% Guelph 79 77 79 75 73 70 69 ↓ 13% St. Catharines 81 75 81 76 73 67 67 ↓ 17% Hamilton Downtown 77 72 76 74 71 69 67 ↓ 11% Hamilton Mountain 82 76 80 76 74 71 70 ↓ 14% Burlington 75 72 76 74 71 68 66 ↓ 11% Oakville 81 74 80 77 75 71 69 ↓ 13% Mississauga 80 75 80 77 66 66 65 ↓ 20% Brampton 80 75 79 76 74 69 68 ↓ 14% Toronto 81 75 80 78 76 74 71 ↓ 10% Oshawa n/a 77 80 76 74 70 68 ↓ 14% Barrie 72 69 72 71 70 67 62 ↓ 11% Peterborough 81 72 73 71 73 73 71 ↓ 8% Kingston 77 77 89 85 81 77 74 ↓ 24% Ottawa Downtown 69 67 71 68 65 61 58 ↓ 15% Sudbury 76 74 77 71 69 66 65 ↓ 18% Thunder Bay 58 57 57 55 53 54 54 ↓ 7% Notes: The CWS for ozone is 65 ppb, which is based on eight-hour running average time and the 4th highest annual ambient measurement averaged over three consecutive years. CWS metrics are calculated as per the GDAD. Toronto reporting is based on Toronto Downtown, Toronto North, Toronto East and Toronto West sites. Red font indicates an exceedance of the CWS. n/a indicates data are not sufficient to calculate metrics. n/r indicates site not designated for CWS reporting. Brantford was added as a CWS designated site in 2009-2011. A linear regression is applied to derive per cent change over time.

3-1
3.0 Particulate Matter in the Air Airborne particulate matter is the general term used to describe a mixture of microscopic solid particles and liquid droplets suspended in air. Particulate matter is classified according to its aerodynamic size, mainly due to the different health effects associated with particles of different diameters. Fine particulate matter, denoted as PM2.5, refers to respirable particles that are less than 2.5 microns in diameter. Due to their small size, they can penetrate deep into the respiratory system. To put this in perspective, PM2.5 is approximately 30 times smaller than the average diameter of a human hair. Particles originate from many different industrial and transportation sources, as well as natural sources. They may be emitted directly from a source or formed in the atmosphere by the transformation of gaseous emissions. This chapter discusses the monitoring results from Ontario’s ambient continuous PM2.5 monitoring network. 3.1 Characteristics, sources and effects Particulate matter includes aerosols, smoke, fumes, dust, fly ash and pollen. Its composition varies with origin, residence time in the atmosphere, time of year and environmental conditions. Fine particulate matter may be emitted directly to the atmosphere as a by-product of fuel combustion. Major sources of PM2.5 include motor vehicles, smelters, power plants, industrial facilities, residential fireplaces and wood stoves, agricultural burning and forest fires, or may be formed indirectly in the atmosphere through a series of complex chemical reactions. Figure 3.1 shows the 2010 estimates of Ontario’s primary PM2.5 emissions from point, area and transportation sources. The residential and transportation sectors accounted for 39 per cent and 24 per cent of PM2.5 emissions, respectively, whereas industrial processes accounted for 29 per cent (NPRI, 2012). The major contributor to residential emissions is fuel wood combustion in fireplaces and wood stoves. Significant amounts of PM2.5 in southern Ontario are referred to as secondary PM2.5 being formed in the atmosphere from gaseous precursors such as SO2 and NO2, and of transboundary origin. During periods of elevated concentrations of PM2.5 in Ontario, it is estimated that there are significant contributions from the U.S., specifically affecting border communities such as: Windsor and Port Stanley, on the northern shore of Lake Erie; Grand Bend and Tiverton, on the eastern shores of Lake Huron; and Parry Sound, on the eastern shore of Georgian Bay (Yap et al., 2005).

3-2
Other Industrial Processes
16%
Road Vehicles3%
Other Transportation
21%Residential39%
Miscellaneous7%
Cement and Concrete
4%
Smelters/Primary Metals
10%
Figure 3.1Ontario PM2.5 Emissions by Sector (Emissions from Point/Area/Transportation Sources, 2010 Estimates)
Note: Provincial total 62 kilotonnes. Excludes open and natural sources. Data Source: NPRI, 2012.
3.2 Monitoring results for 2011 In 2011, Ontario’s 40 air monitoring sites were equipped with a Tapered Element Oscillating Microbalance (TEOM) instrument maintained at 30°C with a Sample Equilibration System (SES) to measure PM2.5 concentrations on an hourly basis. As shown in Figure 3.2, the 2011 annual mean PM2.5 concentrations ranged from 3.4 micrograms per cubic metre (μg/m3) in Petawawa to 10.5 μg/m3 in Sarnia. The 24-hour maximum PM2.5 concentrations ranged from 14 μg/m3 in Petawawa to 52 μg/m3 in Thunder Bay. The 24-hour maximum PM2.5 concentration at Thunder Bay was recorded on July 19, 2011 due to smoke from forest fires in northwestern Ontario, which is considered as an exceptional event and not the norm for air quality in Thunder Bay. The PM2.5 reference level of 30 μg/m3 (based on the CWS) for a 24-hour period was exceeded at 7 of the 40 sites in 2011 on at least one occasion. Figure 3.3 shows PM2.5 annual concentrations for 2011 for cities with population greater than 100,000 in the Great Lakes Basin, including 18 sites in Ontario and 8 sites in the U.S. PM2.5 annual means were generally lower in Ontario, especially in the northern part of the province, than in the U.S. Relatively higher annual PM2.5 concentrations in Windsor and Hamilton are combined effects of transboundary pollution and local industrial emissions (Yap et al., 2005).

3-3
0
2
4
6
8
10
12
Sar
nia
Ham
ilton
Win
dso
r W
est
Toro
nto
Nort
hW
indso
r D
ow
nto
wn
Ham
ilton W
est
Toro
nto
Wes
tKin
gst
on
Ham
ilton M
ounta
inBra
ntf
ord
Chat
ham
Oak
ville
St.
Cat
har
ines
Toro
nto
Dow
nto
wn
Burlin
gto
nKitch
ener
Toro
nto
Eas
tLo
ndon
Gra
nd B
end
Mis
siss
auga
Port
Sta
nle
yBra
mpto
nG
uel
ph
Cor
nw
all
Bar
rie
Pete
rboro
ugh
New
mar
ket
Osh
awa
Morr
isburg
Ott
awa
Dow
nto
wn
Bel
levi
lleThunder
Bay
Par
ry S
ound
Tiv
erto
nO
ttaw
a Cen
tral
Sau
lt S
te.
Mar
ieN
ort
h B
ayD
orse
tSudbury
Pet
awaw
a
Conce
ntr
atio
n (μg/m
3)
Figure 3.2PM2.5 Annual Means (µg/m3) Across Ontario (2011)
5.7
Thunder Bay
Toledo
Barrie
Mississauga
Sudbury
Toronto
Brampton
Oshawa
Rochester
Oakville
Peterborough
Kitchener
London
Brantford
St. Catharines
Guelph
Kingston
WindsorDetroit
Flint
Lansing
Chicago 15.9
8.99.3
9.6 7.7
10.2
6.26.6
6.34.8
4.0
8.2
5.5 6.9
6.8
Hamilton 7.3
6.2Burlington
5.5
6.0
6.4
6.0
6.2
5.9
>7
6-7
4-5
Figure 3.3Geographical Distribution of PM Annual Means ( g/m ) in 2011 2.5 μ 3
in the Great Lakes Basin
Data Source: AQS, 2012.ghhghjghjghjg
9.6
GrandRapids
9.2 Buffalo

3-4
3.3 Trends The trend of PM2.5 annual means, as recorded at 34 air monitoring sites with sufficient data, is shown in Figure 3.4 for the nine-year period of 2003 to 2011. Annual means of PM2.5 have decreased approximately 30 per cent since 2003.
0
2
4
6
8
10
12
14
2003 2004 2005 2006 2007 2008 2009 2010 2011
Conce
ntr
atio
n (μg/m
3)
Note: The trend is a composite mean based on data from 34 monitoring sites.
Figure 3.4Trend of PM2.5 Annual Means (µg/m3) Across Ontario (2003-2011)
Annual Mean (↓ 30%)
Overall, provincial PM2.5 emissions have decreased approximately 33 per cent from 2001 to 2010, as shown in Figure 3.5 (NPRI, 2012; NPRI, 2010; P. Georges, personal communication, April 1, 2010). Fine particulate emissions from industrial processes have been reduced by over 57 per cent over the 10-year period from 2001 to 2010. Emissions from the transportation sector show a gradual decrease of 23 per cent over this time period with the phase-in of new vehicles/engines having more stringent emission standards over the same period.
Table 3.1 shows PM2.5 annual means in 2011 and trends of annual means from 2002 to 2011 at North Bay in northeastern Ontario; Ottawa in eastern Ontario; Toronto in central Ontario; and Windsor in southwestern Ontario. Spatial differences are apparent: the PM2.5 annual means in 2011 in Windsor, an urban industrial centre, were higher than those reported at Toronto, Ottawa and North Bay, indicating influences from transboundary pollution and local emission sources. PM2.5 annual means at North Bay, Ottawa, Toronto and Windsor decreased by approximately 27 per cent, 40 per cent, 30 per cent and 18 per cent, respectively.

3-5
0
20
40
60
80
100
2001 2002 2003 2004 2005 2006 2007 2008 2009 2010
Em
issi
ons
(kilo
tonnes
)MiscellaneousTransportationResidentialIndustrial Processes
Figure 3.5Trend of Ontario PM2.5 Emissions in Kilotonnes (2001-2010)
Note: Excludes open and natural sources.
References: NPRI, 2012; NPRI, 2010; and P. Georges, personal communication, April 1, 2010.
Table 3.1: PM2.5 Annual Means (µg/m3) in 2011 and Per Cent Change from 2002-2011 at Four Select Cities.
City PM2.5 Annual Mean (µg/m3) in 2011
Per Cent Change of PM2.5 Annual Mean
(2002-2011) North Bay 4.2 ↓ 27% Ottawa 4.9 ↓ 40% Toronto 6.2 ↓ 30% Windsor 7.6 ↓ 18%
Figure 3.6 shows the trend of the PM2.5 summer means and PM2.5 winter means as recorded at 34 air monitoring sites for the period of 2003 to 2011. There has been a decreasing trend in both the PM2.5 summer and winter means during the nine-year period. The PM2.5 summer means have decreased by approximately 33 per cent and the PM2.5 winter means by approximately 27 per cent, which coincides with a combined reduction of primary PM2.5 emissions (as shown in Figure 3.5) and secondary PM2.5 formation. Figure 3.6 indicates that the summer means were consistently higher than the winter means, which can be attributed to the formation of secondary PM2.5 under favourable synoptic patterns with lighter winds and prevailing south-westerly flows, and the potential loss of PM2.5 with the TEOM during cooler temperatures. The ministry is replacing the TEOM PM2.5 monitor with a new monitoring method to provide more comprehensive cold weather measurements.

3-6
0
2
4
6
8
10
12
14
2003 2004 2005 2006 2007 2008 2009 2010 2011
Conce
ntr
atio
n (μg/m
3)
Summer Mean 33%
Winter Mean 27%
Note: Ten-year trends are composite means for the summer and winter months based on data from 34 monitoring sites. Summer: May - September; Winter: January - April, October - December.
Figure 3.6Trend of PM2.5 Summer and Winter Means (µg/m3) Across Ontario (2003-2011)
↓
↓
3.4 The Canada-wide Standard for PM2.5 In 2000, the CCME developed a CWS for PM2.5 as a result of the pollutant’s adverse effects on human health and the environment. As referenced in the GDAD, the CWS for PM2.5 is 30 μg/m3, 24-hour averaging time, based on the 98th percentile annual ambient measurement averaged over three consecutive years (Canadian Council of Ministers of the Environment, 2002). Table 3.2 displays the calculated PM2.5 CWS 3-year metric for designated CWS sites where populations are greater than 100,000 across Ontario from 2005 to 2011. The 2011 concentrations ranged from 12 μg/m3 reported for Sudbury to 22 μg/m3 reported for Hamilton Downtown and Kingston. The CWS of 30 μg/m3 was not exceeded at any of the CWS designated sites. The PM2.5 CWS 3-year metrics are trending downwards from 2005 to 2011. The 2011 PM2.5 CWS 3-year metrics are markedly lower than those metrics reported in 2005, at all locations.

3-7
Table 3.2 PM2.5 CWS Metric (µg/m3) for Designated Sites Across Ontario
City 2003
– 2005
2004 –
2006
2005 –
2007
2006 –
2008
2007 –
2009
2008 –
2010
2009 –
2011
Change over time
Windsor Downtown 31 29 29 25 23 21 21 ↓ 36% Chatham n/a 28 28 25 23 20 19 ↓ 35% London 30 28 26 23 22 20 17 ↓ 42% Brantford n/r n/r n/r n/r n/r n/r 20 ‐ Kitchener 34 30 29 25 22 19 18 ↓ 49% Guelph 34 30 28 24 21 19 18 ↓ 50% St. Catharines 29 30 31 27 23 20 19 ↓ 39% Hamilton Downtown 34 32 32 29 25 23 22 ↓ 38% Hamilton Mountain 32 31 29 26 23 21 19 ↓ 42% Burlington 30 29 28 25 22 21 19 ↓ 38% Oakville 34 30 28 24 21 19 18 ↓ 50% Mississauga 34 32 29 27 19 19 17 ↓ 54% Brampton 31 29 28 24 22 19 17 ↓ 46% Toronto 33 31 30 25 22 20 19 ↓ 46% Oshawa n/a 29 29 25 21 19 18 ↓ 43% Barrie 30 29 28 24 21 18 17 ↓ 47% Peterborough 28 29 28 23 20 17 17 ↓ 46% Kingston n/a n/a 30 28 24 23 22 ↓ 28% Ottawa Downtown 30 26 25 20 17 15 14 ↓ 57% Sudbury n/a 20 21 18 16 13 12 ↓ 44% Thunder Bay n/a n/a 16 15 14 13 14 ↓ 15% Notes: The CWS for PM2.5 is 30 µg/m3, 24-hour average time, based on the 98th percentile annual ambient measurement averaged over three consecutive years. CWS metrics are calculated as per the GDAD. Toronto reporting is based on Toronto Downtown, Toronto North, Toronto East and Toronto West sites. Red font indicates an exceedance of the CWS. n/a indicates data are not sufficient to calculate metrics. n/r indicates site not designated for CWS reporting. Brantford was added as a CWS designated site in 2009-2011. A linear regression is applied to derive per cent change over time.

4-1
4.0 Other Air Pollutants This chapter discusses characteristics, sources and effects of NO2, CO and SO2, as well as their ambient concentrations in 2011, and trends of ambient concentrations and emissions, where appropriate. 4.1 NITROGEN DIOXIDE 4.1.1 Characteristics, sources and effects Nitrogen dioxide is a reddish-brown gas with a pungent odour, which transforms in the atmosphere to form gaseous nitric acid and nitrates. It plays a major role in atmospheric reactions that produce ground-level ozone, a major component of smog. Nitrogen dioxide also reacts in the air to form organic compounds, which contribute to the formation of fine particulate matter in the atmosphere.
All combustion in air produces NOX, of which NO2 is a component. Major sources of NOX emissions include the transportation sector, industrial processes and utilities. Ontario’s NOX emission estimates by sector are displayed in Figure 2.2 of Section 2.1. Nitrogen dioxide can irritate the lungs and lower their resistance to respiratory infection. People with asthma and bronchitis have increased sensitivity to NO2. Nitrogen dioxide chemically transforms into nitric acid in the atmosphere and, when deposited, contributes to the acidification of lakes and soils in Ontario. Nitric acid can also corrode metals, fade fabrics, degrade rubber, and damage trees and crops. 4.1.2 Monitoring results for 2011 The Toronto West site, located in an area of Toronto influenced by significant vehicular traffic, recorded the highest annual mean (19.1 ppb) for NO2 during 2011, whereas Tiverton, a rural site, recorded the lowest NO2 annual mean (2.5 ppb). The highest NO2 means are recorded in large urbanized areas, such as the Greater Toronto Area (GTA) of southern Ontario. The Toronto North air monitoring station recorded the highest 24-hour average concentration (44 ppb), and Windsor West had the highest one-hour concentration (93 ppb) in 2011. The provincial 24-hour criterion of 100 ppb and one-hour criterion of 200 ppb for NO2 were not exceeded at any of the monitoring locations in Ontario during 2011.

4-2
4.1.3 Trends Figure 4.1 shows the trend of annual means for NO2 concentrations from 2002 to 2011. The annual means for NO2 concentrations decreased by approximately 41 per cent over the last decade from 2002 to 2011.
0
5
10
15
20
25
2002 2003 2004 2005 2006 2007 2008 2009 2010 2011
Conce
ntr
atio
n (
ppb)
Annual Mean 41%
Note: The trend is a composite mean based on data from 21 monitoring sites.
Figure 4.1Trend of NO2 Annual Means (ppb) Across Ontario (2002-2011)
↓
Figure 4.2 displays the NOX emission trend from 2001 to 2010. Overall, NOX emissions have decreased approximately 36 per cent over the 10-year period (NPRI, 2012; NPRI, 2010; P. Georges, personal communication, April 1, 2010). Ontario’s emissions trading regulations on sulphur dioxide and nitrogen oxides (O. Reg. 397/01 and O. Reg. 194/05) have contributed to the reduction in nitrogen oxides emissions in recent years. The NOX emissions from on-road vehicles also decreased due to the phase-in of new vehicles having more stringent emission standards. The implementation of the Ontario’s Drive Clean program in southern Ontario in 1999 also helped to further reduce the NOX emissions from light duty gasoline vehicles. Changes in the diurnal patterns of NO2 concentrations at the Toronto East station can be seen in Figure 4.3 for years 2002 and 2011. The Toronto East station is located near a busy roadway and is greatly influenced by vehicular traffic, a major source of NOX. This is evident during the morning rush-hour period (6 a.m. to 9 a.m.) when temperature inversions near the ground typically occur with light winds which in turn cause less dispersion and local build-up of pollutants. Overall, the diurnal patterns show a considerable decrease in NO2 concentrations measured in 2011 when compared to previous years. The reduction in NOX emissions over time is mainly due to a cleaner vehicle fleet in the GTA, and, in part, due to Ontario’s Drive Clean program. NO2 concentrations at 8 a.m. have decreased by 24 per cent between 2002 and 2011.

4-3
0
100
200
300
400
500
600
700
2001 2002 2003 2004 2005 2006 2007 2008 2009 2010
Em
issi
ons
(kilo
tonnes
) MiscellaneousOther TransportationRoad VehiclesOther Ind. ProcessesElectricity Utilities
Figure 4.2Trend of Ontario NOX Emissions in Kilotonnes (2001-2010)
Note: Excludes open and natural sources.
References: NPRI, 2012; NPRI, 2010; and P. Georges, personal communication, April 1, 2010.
5
10
15
20
25
30
1 2 3 4 5 6 7 8 9 101112131415161718192021222324
Hour (EST)
Conce
ntr
atio
n (
ppb)
20022011
Figure 4.3Diurnal Trend of NO2 Concentrations (ppb) at Toronto East (2002 and 2011)

4-4
4.2 CARBON MONOXIDE 4.2.1 Characteristics, sources and effects Carbon monoxide is a colourless, odourless, tasteless and, at high concentrations, poisonous gas. This gas can enter the bloodstream and reduce oxygen delivery to the organs and tissues. People with heart disease are particularly sensitive to CO. Exposure to high CO levels is linked with the impairment of vision, work capacity, learning ability and performance of complex tasks. Carbon monoxide is produced primarily by the incomplete combustion of fossil fuels. As displayed in Figure 4.4, the transportation sector accounted for 87 per cent of all CO emissions (NPRI, 2012).
Road Vehicles44%
Smelters/Primary Metals
3%
Residential/Miscellaneous
7%
OtherIndustrialProcesses
3%
Figure 4.4Ontario CO Emissions by Sector (Emissions from Point/Area/Transportation Sources, 2010 Estimates)
OtherTransportation
43%
Note: Provincial total 2,329 kilotonnes. Excludes open and natural sources.
Data Source: NPRI, 2012. 4.2.2 Monitoring results for 2011 In 2011, the highest one-hour maximum CO value, 3.77 parts per million (ppm) and the highest eight-hour maximum CO value, 1.46 ppm, were measured at the Windsor Downtown site. Typically, higher CO concentrations are recorded in urban centres as a result of vehicle emissions. Ontario’s one-hour (30 ppm) and eight-hour (13 ppm) AAQC for CO were not exceeded at any of the monitoring sites in 2011.

4-5
4.2.3 Trends Figure 4.5 shows the trend of annual means of the one-hour and eight-hour maximums for CO concentrations from 2002 to 2011. As shown in Figure 4.5, ambient CO concentrations, as measured by the annual means of the one-hour and eight-hour maximums, decreased by approximately 35 per cent and 53 per cent, respectively, over the 10-year period of 2002 to 2011 due to reductions in CO emissions from the transportation sector and to a lesser degree, the industrial sector. Figure 4.6 shows that CO emissions have been reduced by approximately 24 per cent from 2001 to 2010 (NPRI, 2012; NPRI, 2010; P. Georges, personal communication, April 1, 2010).
0
1
2
3
4
5
2002 2003 2004 2005 2006 2007 2008 2009 2010 2011
Conce
ntr
atio
n (
ppm
)
One-Hour Maximum Means 35%
Eight-Hour Maximum Means 53%
Note: Trends are composite means based on data from 4 sites. Ontario one-hour AAQC = 30 ppm; eight-hour AAQC = 13 ppm.
Figure 4.5Trends of CO Annual Means of One-Hour and Eight-Hour Maximums (ppm) Across Ontario (2002-2011)
↓
↓
4.3 SULPHUR DIOXIDE 4.3.1 Characteristics, sources and effects Sulphur dioxide is a colourless gas that smells like burnt matches. Sulphur dioxide can also be oxidized in the atmosphere to form sulphuric acid aerosols. In addition, sulphur dioxide is a precursor to sulphates, one of the main components of airborne fine particulate matter. Electric utilities and smelters are the major sources of SO2 emissions in Ontario, accounting for approximately 67 per cent of the provincial SO2 emissions, as shown in Figure 4.7. Other industrial processes (e.g. petroleum refining, cement and concrete manufacturing) accounted for an additional 24 per cent. The transportation sector and miscellaneous sources

4-6
accounted for the remaining 9 per cent of all SO2 emissions in the province according to 2010 estimates (NPRI, 2012).
0
500
1,000
1,500
2,000
2,500
3,000
3,500
2001 2002 2003 2004 2005 2006 2007 2008 2009 2010
Em
issi
ons
(kilo
tonnes
)
Residential/MiscellaneousOther TransportationRoad VehiclesIndustrial Processes
Figure 4.6Trend of Ontario CO Emissions in Kilotonnes (2001-2010)
Note: Excludes open and natural sources.
References: NPRI, 2012; NPRI, 2010; and P. Georges, personal communication, April 1, 2010.
ElectricUtilities15%
Smelters52%
Miscellaneous4%
Other IndustrialProcesses
24%
Figure 4.7Ontario SO2 Emissions by Sector (Emissions from Point/Area/Transportation Sources, 2010 Estimates)
Transportation5%
Note: Provincial total 268 kilotonnes. Excludes open and natural sources.
Data Source: NPRI, 2012.
Health effects caused by exposure to high levels of SO2 include breathing problems, respiratory illness, and the exacerbation of respiratory and cardiovascular disease. People with asthma, chronic lung disease or heart

4-7
disease are the most sensitive to SO2. Sulphur dioxide damages trees and crops. Sulphur dioxide, like NO2, is also a precursor of acid rain, which contributes to the acidification of soils, lakes and streams, accelerated corrosion of buildings, and reduced visibility. Sulphur dioxide also leads to the formation of fine particulate matter or PM2.5, which have health implications and contribute to climate change. 4.3.2 Monitoring results for 2011 Sarnia recorded the highest annual mean (3.9 ppb) and 24-hour maximum concentration (53 ppb) of SO2 during 2011, whereas Hamilton Downtown recorded the highest one-hour maximum (117 ppb). The highest concentrations of SO2 historically have been recorded in the vicinity of large industrial facilities such as smelters and utilities. The provincial one-hour, 24-hour and annual AAQC of 250 ppb, 100 ppb and 20 ppb, respectively, for SO2 were not exceeded at any of the ambient air monitoring sites in 2011. 4.3.3 Trends Figure 4.8 shows the trend of annual means for SO2 concentrations from 2002 to 2011. Over the 10-year period, SO2 concentrations have decreased by approximately 52 per cent. Overall, provincial SO2 emissions have reduced by approximately 55 per cent from 2001 to 2010, as shown in Figure 4.9 (NPRI, 2012; NPRI, 2010; P. Georges, personal communication, April 1, 2010). The reduction of SO2 emissions over the years is the result of various initiatives which include, but are not limited to: i) Control orders for Ontario smelters; ii) Countdown Acid Rain program and Canada-wide Acid Rain Strategy; iii) Ontario’s emissions trading regulations on sulphur dioxide and nitrogen
oxides (O. Reg. 397/01 and O. Reg. 194/05); iv) Phase-out of coal-fired generating stations, with Lakeview Thermal
Generating Station shut down in 2005; and v) Low sulphur content in transportation fuels.

4-8
0
1
2
3
4
5
6
2002 2003 2004 2005 2006 2007 2008 2009 2010 2011
Conce
ntr
atio
n (
ppb)
Annual Mean 52%
Note: Ten-year trend is a composite mean based on 9 sites.
Figure 4.8Trend of SO2 Annual Means (ppb) Across Ontario (2002-2011)
↓
0
200
400
600
800
2001 2002 2003 2004 2005 2006 2007 2008 2009 2010
Em
issi
ons
(kilo
tonnes
)
Transportation/MiscellaneousOther Industrial ProcessesSmeltersElectricity Utilities
Figure 4.9Trend of Ontario SO2 Emissions in Kilotonnes (2001-2010)
Note: Excludes open and natural sources.
References: NPRI, 2012; NPRI, 2010; and P. Georges, personal communication, April 1, 2010.

5-1
5.0 Air Quality Index and Smog Advisories
This chapter focuses on the Air Quality Index (AQI) and smog advisories. The ministry’s AQI program was established in 1988, and originally included ozone, NO2, SO2, CO, suspended particles (SP) and TRS compounds. On August 23, 2002, the ministry replaced SP in the AQI with PM2.5, commonly known as fine particulate matter, making Ontario the first province in Canada to do so. These fine particles penetrate deep into the lungs and are closely linked to respiratory impacts. Fine particulate matter reporting provides a more accurate representation of Ontario’s air and allows people to make more informed decisions to protect their health. In association with the AQI program, the ministry launched the Air Quality Advisory program in 1993. In 2000, this program was expanded to the Smog Alert program under which smog advisories are issued.
5.1 Air Quality Indices
The Ministry of the Environment operates an extensive network of air quality monitoring sites across the province. In 2011, 40 of these sites formed the basis of the AQI network. The Air Quality Office of the Environmental Monitoring and Reporting Branch continuously obtains near real-time data for criteria air pollutants from these 40 sites.
Figure 5.1Air Quality Index (AQI) Monitoring Sites in Ontario (2011)
Cornwall
Lake Ontario
Lake Erie
Lake Huron
Ottawa Dtn.Lake Superior
Georgian
Bay
Peterborough
Dorset
Sudbury North BaySault Ste. Marie
Petawawa
Parry Sound
Thunder Bay Ottawa C.
Morrisburg
Kingston
BellevilleOshawa
Barrie
NewmarketBrampton
Guelph
Tiverton
KitchenerHamilton Dtn.
Hamilton W. Hamilton Mtn.St. Catharines
Grand Bend
SarniaLondon
Brantford
Port StanleyChathamWindsor Dtn.
Windsor W.
TorontoMississauga
OakvilleBurlington
Rural AQI Sites (7) Urban AQI Sites (33)
Toronto
Toronto Dtn.
Toronto N. Toronto E.
Toronto W.

5-2
The AQI network, shown in Figure 5.1, provides the public with air quality information, every hour, 24 hours a day, from across the province. The AQI is based on pollutants that have adverse effects on human health and the environment, including O3, PM2.5, NO2, CO, SO2 and TRS compounds. At the end of each hour, the concentration of each pollutant measured at each site is converted into a number ranging from zero upwards using a common scale or index. The calculated number for each pollutant is referred to as a sub-index. At a given air monitoring site, the highest sub-index for any given hour becomes the AQI reading for that hour. The index is a relative scale, in that the lower the index, the better the air quality. The index values, corresponding categories, and potential health and environmental effects are shown in Table 5.1. If the AQI value is below 32, the air quality is categorized as good. For AQI values in the 32-49 range (moderate category), there may be some adverse effects for very sensitive people. For index values in the 50-99 range (poor category), the air quality may have adverse effects for sensitive members of human and animal populations, and may cause significant damage to vegetation and property. With an AQI value of 100 or more (very poor category), the air quality may have adverse effects for a large proportion of those exposed. Computed AQI values are released to the public every hour on the ministry’s website at www.airqualityontario.com. The public can also access the index values by calling the ministry’s air quality information Interactive Voice Response (IVR) system. (To access an English recording, call 1-800-387-7768, or in Toronto, call 416-246-0411. For a French recording, call 1-800-221-8852.) Air quality forecasts, based on regional meteorological conditions and current pollution levels in Ontario and bordering U.S. states, are also provided daily on the ministry’s website and IVR system.

5-3
Ta
ble
5.1
: A
ir Q
ua
lity I
nd
ex
Po
lluta
nts
an
d T
he
ir I
mp
act
s*
0-1
5Ver
y G
ood
No h
ealth
effec
ts a
re
expe
cted
in h
ealth
y pe
opl
e
Sen
sitive
popul
atio
ns
may
wan
t to
exe
rcis
e
caut
ion
No h
ealth
effec
ts
are
expe
cted
in
heal
thy
peo
ple
No h
ealth
effec
ts
are
expe
cted
in
heal
thy
peo
ple
No h
eal
th e
ffec
ts
are
expe
cted
in
hea
lthy
people
No h
ealth
effec
ts
are
expe
cted
in
heal
thy
peo
ple
16-3
1G
ood
No h
ealth
effec
ts a
re
expe
cted
in h
ealth
y pe
opl
e
Sen
sitive
popul
atio
ns
may
wan
t to
exe
rcis
e
caut
ion
Slig
ht
odour
No h
ealth
effec
ts
are
expe
cted
in
heal
thy
peo
ple
Dam
age
s so
me
veget
atio
n in
co
mbin
atio
n w
ith
ozo
ne
Slig
ht
odour
32-4
9M
ode
rate
Resp
irat
ory
irrit
atio
n in
se
nsiti
ve p
eopl
e d
urin
g
vigo
rous
exe
rcis
e;
pe
opl
e w
ith h
eart
/lung
di
sord
ers
at
som
e r
isk;
dam
ages
ver
y se
nsiti
ve
plan
ts
Peopl
e w
ith r
espi
rato
ry
dise
ase
at s
om
e ris
kO
dour
Blo
od
chem
istr
y
chan
ges,
but
no
notic
eable
im
pairm
ent
Dam
age
s so
me
ve
get
atio
nO
dour
50-9
9Po
or
Sens
itiv
e p
eopl
e m
ay
expe
rience
irrit
atio
n
whe
n br
eat
hing
and
po
ssib
le lu
ng
dam
age
whe
n ph
ysic
ally
act
ive;
peopl
e w
ith h
eart
/lung
di
sord
ers
at
gre
ater
ris
k; d
amage
s so
me
plan
ts
Peopl
e w
ith r
espi
rato
ry
dise
ase
should
lim
it pr
olo
nge
d ex
ertio
n;
gene
ral p
opu
lation
at
som
e ris
k
Air s
mel
ls a
nd
looks
brow
n;
som
e in
creas
e in
br
onch
ial r
eac
tivity
in a
sthm
atic
s
Incr
ease
d
sym
ptom
s in
sm
oke
rs w
ith h
eart
di
seas
e
Odo
ur;
incr
eas
ing
veget
atio
n
dam
age
Str
ong
odo
ur
100-
ove
rVery
Poor
Serio
us
resp
irat
ory
ef
fect
s, e
ven d
urin
g
light
phy
sica
l act
ivity
; pe
opl
e w
ith h
eart
/lung
di
sord
ers
at
hig
h ris
k;
more
vege
tatio
n da
mag
e
Ser
ious
resp
irat
ory
ef
fect
s eve
n du
ring
light
ph
ysic
al a
ctiv
ity;
people
w
ith h
eart
dis
ease
, th
e el
derly
and
chi
ldre
n at
hi
gh r
isk;
incr
ease
d ris
k fo
r ge
nera
l popu
latio
n
Incr
easi
ng
sens
itivi
ty for
asth
mat
ics
and
peopl
e w
ith
bronch
itis
Incr
easi
ng
sym
ptom
s in
non-
smoke
rs w
ith h
eart
di
seas
es;
blu
rred
visi
on;
som
e
clum
sine
ss
Incr
easi
ng
sensi
tivi
ty for
ast
hm
atic
s and
pe
opl
e w
ith
bro
nchi
tis
Seve
re o
dour;
so
me
people
may
ex
perien
ce n
ause
a an
d he
adac
hes
* N
ote
that
the
info
rmat
ion
in t
his
table
is s
ubj
ect
to c
hange
.
Tota
l Red
uce
d Sul
phu
r (T
RS)
Com
poun
dsIn
dex
Cate
gory
Fine
Part
icula
te M
atte
r
(PM
2.5
)N
itro
gen
Dio
xide
(NO
2)
Car
bon
Monoxid
e
(CO
)Sulp
hur
Dio
xide
(SO
2)
Ozone
(O3)
5-4
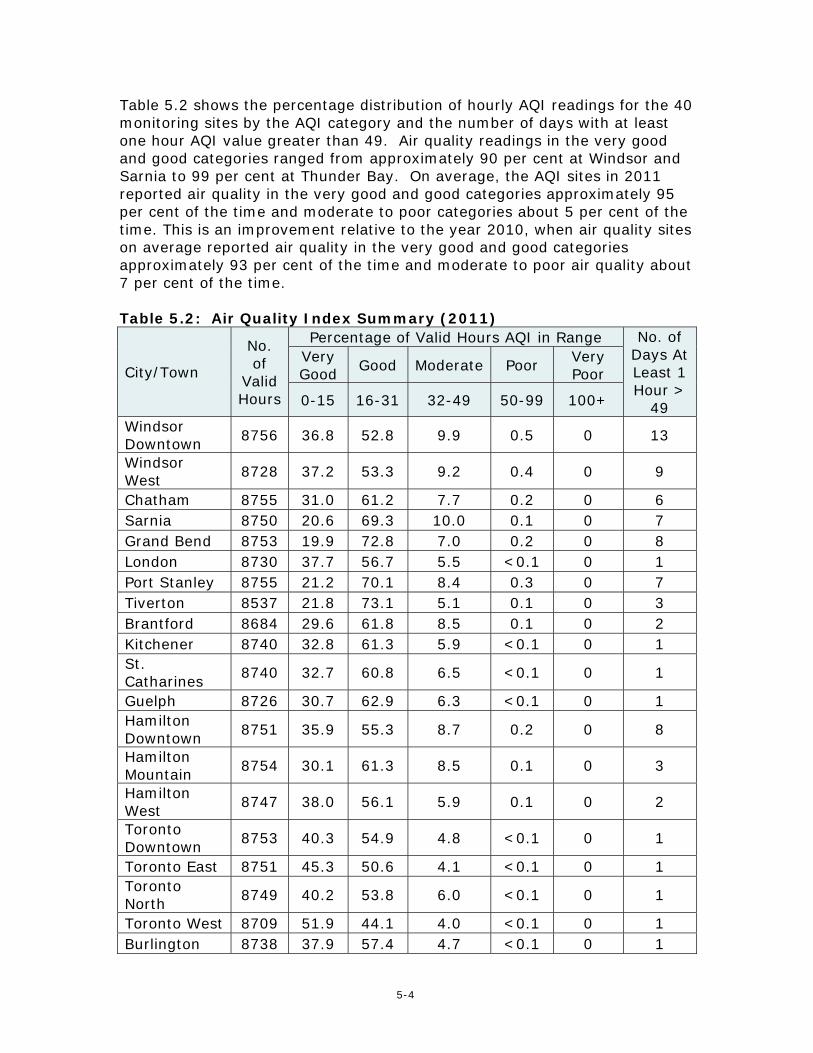
Table 5.2 shows the percentage distribution of hourly AQI readings for the 40 monitoring sites by the AQI category and the number of days with at least one hour AQI value greater than 49. Air quality readings in the very good and good categories ranged from approximately 90 per cent at Windsor and Sarnia to 99 per cent at Thunder Bay. On average, the AQI sites in 2011 reported air quality in the very good and good categories approximately 95 per cent of the time and moderate to poor categories about 5 per cent of the time. This is an improvement relative to the year 2010, when air quality sites on average reported air quality in the very good and good categories approximately 93 per cent of the time and moderate to poor air quality about 7 per cent of the time. Table 5.2: Air Quality Index Summary (2011)
City/Town
No. of
Valid Hours
Percentage of Valid Hours AQI in Range No. of Days At Least 1 Hour >
49
Very Good
Good Moderate Poor Very Poor
0-15 16-31 32-49 50-99 100+
Windsor Downtown
8756 36.8 52.8 9.9 0.5 0 13
Windsor West
8728 37.2 53.3 9.2 0.4 0 9
Chatham 8755 31.0 61.2 7.7 0.2 0 6 Sarnia 8750 20.6 69.3 10.0 0.1 0 7 Grand Bend 8753 19.9 72.8 7.0 0.2 0 8 London 8730 37.7 56.7 5.5 <0.1 0 1 Port Stanley 8755 21.2 70.1 8.4 0.3 0 7 Tiverton 8537 21.8 73.1 5.1 0.1 0 3 Brantford 8684 29.6 61.8 8.5 0.1 0 2 Kitchener 8740 32.8 61.3 5.9 <0.1 0 1 St. Catharines
8740 32.7 60.8 6.5 <0.1 0 1
Guelph 8726 30.7 62.9 6.3 <0.1 0 1 Hamilton Downtown
8751 35.9 55.3 8.7 0.2 0 8
Hamilton Mountain
8754 30.1 61.3 8.5 0.1 0 3
Hamilton West
8747 38.0 56.1 5.9 0.1 0 2
Toronto Downtown
8753 40.3 54.9 4.8 <0.1 0 1
Toronto East 8751 45.3 50.6 4.1 <0.1 0 1 Toronto North
8749 40.2 53.8 6.0 <0.1 0 1
Toronto West 8709 51.9 44.1 4.0 <0.1 0 1 Burlington 8738 37.9 57.4 4.7 <0.1 0 1

5-5
Table 5.2: Air Quality Index Summary (2011) - Continued
City/Town
No. of
Valid Hours
Percentage of Valid Hours AQI in Range No. of Days At Least 1 Hour >
49
Very Good
Good Moderate Poor Very Poor
0-15 16-31 32-49 50-99 100+
Oakville 8633 35.5 59.0 5.4 <0.1 0 1 Oshawa 8748 36.7 59.8 3.5 <0.1 0 2 Brampton 8755 37.2 57.1 5.7 <0.1 0 2 Mississauga 8628 41.3 55.0 3.6 <0.1 0 1 Barrie 8675 38.7 58.3 3.1 0 0 0 Newmarket 8758 33.4 61.6 4.9 0.1 0 2 Parry Sound 8752 27.9 67.4 4.7 <0.1 0 1 Dorset 8733 35.3 61.8 2.8 0 0 0 Ottawa Downtown
8674 44.4 53.8 1.8 0 0 0
Ottawa Central
8754 41.9 56.5 1.5 0 0 0
Petawawa 8658 38.9 59.4 1.7 0 0 0 Kingston 8637 24.8 69.5 5.7 0 0 0 Belleville 8749 34.4 61.3 4.2 0.1 0 4 Morrisburg 8749 33.9 63.0 3.1 0 0 0 Cornwall 8749 35.3 62.1 2.7 0 0 0 Peterborough 8713 32.7 63.0 4.2 <0.1 0 1 Thunder Bay 8595 38.8 59.8 1.2 0.2 0 1 Sault Ste. Marie
8726 34.4 62.8 2.9 0 0 0
North Bay 8759 36.9 60.4 2.7 0 0 0 Sudbury 8745 31.9 65.7 2.4 0 0 0 Figure 5.2 shows the provincial average for the percentages of time the AQI was in the various air quality categories as recorded by all sites across the province in 2011. The pie diagram at the top left shows the category percentages. The pie diagram at the bottom right breaks down the poor air quality (0.1 per cent) into percentages of pollutants associated with the AQI above 49. Approximately 86 per cent of the poor AQI values were due to ozone, 13 per cent were due to fine particulate matter, and less than 1 per cent due to TRS compounds. Among the poor AQI values, approximately 98 per cent occurred in summer from May to September, while the remaining 2 per cent occurred in April and October.

5-6
5.2 Smog Advisories Under the Smog Alert program, smog advisories are issued to the public in advance when AQI values are expected to be greater than 49 due to elevated, widespread and persistent levels of O3 and/or PM2.5. Generally, smog advisories are issued 24 hours in advance; however, if elevated smog conditions occur suddenly, and weather conditions conducive to elevated smog levels are expected to continue for several hours, a smog advisory is issued effective immediately. Note that a smog advisory is a forecast and does not necessarily mean elevated smog is a certainty since it is based on weather forecasts. Smog advisories are available to the public and media via: i) The ministry’s website at www.airqualityontario.com; ii) Smog alerts emailed directly to everyone who subscribes to the ministry’s
Smog Alert network at the above website; and iii) The ministry’s air quality information IVR system. (To access an English
recording, call 1-800-387-7768, or in Toronto, call 416-246-0411. For a French recording, call 1-800-221-8852.)
5.2.1 2011 Smog Advisories In 2011, Ontarians experienced five smog advisories covering just nine days. Four of the five smog advisories occurred during the traditional smog season (May 1 to September 30 inclusive), while one smog advisory was issued on October 11, 2011 covering one day for Hamilton due to elevated PM2.5 concentrations. In 2010, the ministry issued three smog advisories covering 12 days. The number and duration of smog advisories are highly dependent on meteorological conditions.
Figure 5.2Air Quality Index Summary (2011)
Good60.1%
Very Good34.7%
Moderate5.1%
Poor0.1%
PM2.513%
Ozone86%
TRS<1%
Very Poor0%
Figure 5.2Air Quality Index Summary (2011)
Good60.1%
Very Good34.7%
Moderate5.1%
Poor0.1%
PM2.513%
Ozone86%
TRS<1%
Very Poor0%

6-1
GLOSSARY
Air Quality Index - real-time information system that provides the public with an indication of air quality in cities, towns and in rural areas across Ontario.
AQI station - continuous monitoring station used to inform the public of general ambient air quality levels over an entire region (not a localized area) on a real-time basis; station reports on criteria pollutant levels that are not unduly influenced by a single emission source, but rather are the result of emissions from multiple sources, including those in neighbouring provinces and states.
Ambient air - outdoor or open air.
Carbon monoxide - a colourless, odourless, tasteless, and at high concentrations, poisonous gas.
Continuous pollutants - pollutants for which a continuous record exists; effectively, pollutants that have hourly data (maximum 8,760 values per year except leap year – e.g. 2004 where maximum values for the year are 8,784).
Continuous station - where pollutants are measured on a real-time basis and data determined hourly (for example ozone, sulphur dioxide).
Criterion - maximum concentration or level (based on potential effects) of pollutant that is desirable or considered acceptable in ambient air.
Diurnal - recurring every day; actions that are completed in 24 hours and repeated every 24 hours.
Exceedance - violation of the air pollutant concentration levels established by environmental protection criteria or other environmental standards.
Fine Particulate Matter - particles smaller than 2.5 microns in aerodynamic diameter, which arise mainly from fuel combustion, condensation of hot vapours and chemically-driven gas-to-particle conversion processes; also referred to as PM2.5 or respirable particles. These are fine enough to penetrate deep into the lungs.

6-2
Glossary continued
Fossil fuels - natural gas, petroleum, coal and any form of solid, liquid or gaseous fuel derived from organic materials for the purpose of generating heat.
Ground-level ozone
- colourless gas formed from chemical reactions between nitrogen oxides and volatile organic compounds (VOCs) in the presence of sunlight near the Earth's surface.
Micron - a millionth of a metre.
Nitrogen dioxide - a reddish-brown gas with a pungent and irritating odour.
Oxidation - a chemical reaction where a substance gains an oxygen; for example, in the atmosphere, sulphur dioxide is oxidized by hydroxyl radicals to form sulphate.
Particulate matter - refers to all airborne finely divided solid or liquid material with an aerodynamic diameter smaller than 44 microns.
Percentile value - percentage of the data set that lies below the stated value; if the 70 percentile value is 0.10 ppm, then 70 per cent of the data are equal to or below 0.10 ppm.
Primary pollutant - pollutant emitted directly to the atmosphere.
Secondary pollutant - pollutant formed from other pollutants in the atmosphere.
Smog - a contraction of smoke and fog; colloquial term used for photochemical smog, which includes ozone, and may include fine particulate matter, and other contaminants; tends to be a brownish haze.
Smog advisory - smog advisories are issued to the public when there is a strong likelihood that widespread, elevated and persistent smog levels are expected.
Stratosphere - atmosphere 10 to 40 kilometres above the Earth's surface.

6-3
Glossary continued
Stratospheric ozone - ozone formed in the stratosphere from the conversion of oxygen molecules by solar radiation; ozone found there absorbs much ultraviolet radiation and prevents it from reaching the Earth.
Sulphur dioxide - a colourless gas that smells like burnt matches.
Troposphere - atmospheric layer extending from the surface up to about 10 kilometres above the Earth's surface.

7-1
ACRONYMS
AAQC - Ambient Air Quality Criteria (Ontario)
AQI - Air Quality Index
CCME - Canadian Council of Ministers of the Environment
CO - carbon monoxide
CWS - Canada-wide Standard
GTA - Greater Toronto Area
IVR - Interactive Voice Response
NO - nitric oxide
NO2 - nitrogen dioxide
NOX - nitrogen oxides
O3 - ozone
PM2.5 - fine particulate matter
SES (TEOM) - Sample Equilibration System
SO2 - sulphur dioxide
TEOM - Tapered Element Oscillating Microbalance
TRS - total reduced sulphur
VOCs - volatile organic compounds
kt - kilotonnes
μg/m3 - micrograms (of contaminant) per cubic metre (of air) – by weight
ppb - parts (of contaminant) per billion (parts of air) – by volume
ppm - parts (of contaminant) per million (parts of air) – by volume

8-1
REFERENCES 1. AQS, 2012. Air Quality System (AQS) Data Mart. United States
Environmental Protection Agency. http://www.epa.gov/ttn/airs/aqsdatamart/access/interface.htm (accessed July 2012)
2. Canadian Council of Ministers of the Environment, 2002. Guidance
Document on Achievement Determination: Canada-Wide Standards for Particulate Matter and Ozone.
3. NPRI, 2012. National Pollutant Release Inventory (NPRI) Downloadable
Datasets. Environment Canada. http://www.ec.gc.ca/inrp-npri/default.asp?lang=en&n=0EC58C98- (accessed February 2012).
4. NPRI, 2010. National Pollutant Release Inventory (NPRI) Downloadable
Datasets. Environment Canada. http://www.ec.gc.ca/inrp-npri/default.asp?lang=en&n=0EC58C98- (accessed October 2010).
5. Ontario Ministry of the Environment. 2012. Air Quality in Ontario –
Report for 2010. 6. Yap, D., Reid, N., De Brou, G. and R. Bloxam. 2005. Transboundary Air
Pollution in Ontario. Ontario Ministry of the Environment. RESOURCES 1. Brook, J.R., Dann, T. and R.T. Burnett. 1997: The Relationship among
TSP, PM10, PM2.5 and Inorganic Constituents of Atmospheric Particulate Matter at Multiple Canadian Locations. Journal of Air and Waste Management Association, Vol 46, pp. 2-18.
2. Burnett, R.T., Dales, R.E., Krewski, D., Vincent, R., Dann, T., and J.R.
Brook. 1995: Associations between Ambient Particulate Sulphate and Admissions to Ontario Hospitals for Cardiac and Respiratory Diseases. American Journal of Epidemiology, Vol 142, pp. 15-22.
3. Fraser, D., Yap, D., Kiely, P. and D. Mignacca. 1991. Analysis of
Persistent Ozone Episodes in Southern Ontario 1980-1991. Technology Transfer Conference, Toronto, 1991. Proceedings AP14, pp. 222-227.
4. Geddes, J.A., Murphy, J.G., D.K.Wang. 2009. Long term changes in
nitrogen oxides and volatile organic compounds in Toronto and the challenges facing local ozone control. Atmospheric Environment, Vol. 43, pp. 3407-3415.

8-2
Resources continued… 5. Itano, Y., Bandow, H., Takenaka, N., Saitoh, Y., Asayama, A., J.
Fukuyama. 2007. Impact of NOX reduction on long-term ozone trends in an urban atmosphere. Science of the Total Environment, Vol. 379, pp. 46-55.
6. Lin, C.C.-Y., Jacob, D.J., Munger, J.W., and A.M. Fiore. 2000.
Increasing Background Ozone in Surface Air Over the United States. Geophysical Research Letters, Vol. 27 (21), pp. 3465-3468.
7. Lioy, P. et al., 1991. Assessing Human Exposure to Airborne Pollutants.
Environmental Science and Technology, Vol. 25, pp. 1360. 8. Lipfert, F.W. and T. Hammerstrom. 1992. Temporal Patterns in Air
Pollution and Hospital Admissions. Environmental Research, Vol. 59, pp. 374-399.
9. Lippmann, M. 1991. Health Effects of Tropospheric Ozone.
Environmental Science and Technology, Vol. 25, No. 12, pp. 1954-1962. 10. Logan, J. A., Staehelin, J., Megretskaia, I. A., Cammas, J.-P., Thouret,
V., Claude, H., Backer, H. D., Steinbacher, M., Scheel, H.-E., Stubi, R., Frohlich, M., and R. G. Derwent. 2012. Changes in ozone over Europe: Analysis of ozone measurements from sondes, regular aircraft (MOZAIC) and alpine surface sites, Journal of Geophysical Research, 117, D09301, doi:10.1029/2011JD016952.
11. Ontario Ministry of the Environment, 2010. Publications. Ontario
Ministry of the Environment. http://www.airqualityontario.com/press/publications.php.
12. Pengelly, L.D., Silverman, F. and C.H. Goldsmith. 1992. Health Effects
of Air Pollution Assessed Using Ontario Health Survey Data. Urban Air Group, McMaster University.
13. Reid, N., Yap, D., R. Bloxam. 2008. The potential role of background
ozone on current and emerging air issues: An overview. Air Quality, Atmosphere & Health, Vol. 1, pp. 19-29.
14. Rethinking the Ozone Problem in Urban and Regional Air Pollution.
National Academy Press, Washington, D.C., 1991. 15. United States Environmental Protection Agency. 2003. Latest Findings
on National Air Quality, 2002 Status and Trends. 16. United States Environmental Protection Agency. 2003. National Air
Quality and Emission Trends, 2003 Special Studies Edition.

8-3
Resources continued… 17. United States Environmental Protection Agency. 2004. Particle Pollution
Report, Current Understanding of Air Quality and Emissions through 2003.
18. Vingarzan, R. 2004. A review of surface ozone background levels and
trends. Atmospheric Environment, Vol. 38, pp. 3431-42. 19. Wolff, G.T., Kelley, N.A. and M.A. Ferman. 1982. Source Regions of
Summertime Ozone and Haze Episodes in the Eastern U.S. Water, Air and Soil Pollution, 18: pp. 65-81.
20. Yap, D., Ning, D.T. and W. Dong. 1988. An Assessment of Source
Contribution to the Ozone Concentrations in Southern Ontario. Atmospheric Environment, Vol. 22, No. 6, pp. 1161-1168.

A-i
APPENDICES
The Appendices are intended for use in conjunction with the 2011 Annual Air Quality in Ontario report. The Appendices briefly describe the provincial Air Quality Index (AQI) network, quality assurance and quality control procedures, and the Ministry of the Environment’s air quality database. It also includes a series of tables displaying station locations and a listing of the summary statistics including means, maximums, percentile values and the number of exceedances of the Ontario ambient air quality criteria (AAQC) for each pollutant. In addition, trends for select pollutants are displayed for 10- and 20-year periods. MONITORING NETWORK OPERATIONS Network Description
In 2011, the Environmental Monitoring and Reporting Branch (EMRB) operated 40 ambient air monitoring sites across Ontario. Monitoring site locations for the AQI network are illustrated in Map 1. The AQI network was comprised of 133 continuous monitoring instruments at 40 sites. These instruments have the capability of recording minute data (approximately 70 million data points per year) that are used to scan and validate the continuous hourly data. Quality Assurance and Quality Control
Day-to-day maintenance and support of the instruments are administered by EMRB staff. Instrumentation precision is verified by daily automatic internal zero and span checks. Data analysts and station operators review span control charts to confirm instrument precision using a telemetry system. A quarterly quality assurance and quality control (QA/QC) review is performed on the ambient data set in order to highlight anomalies and administer corrective action in a timely manner. The air monitoring station operators routinely inspect and maintain monitoring equipment and stations with mandatory bi-monthly on-site visits where secondary transfer standards are used to calibrate instrumentation. Station activity is recorded using FieldWorker Inc. software, an electronic documentation solution; this information is transferred directly to the ministry’s database. The instrumentation used throughout the provincial air

A-ii

A-iii
monitoring network has been standardized to Thermo Electron Corporation analyzers in an effort to streamline parts inventory and leverage common hardware used within each analyzer. The following is a summary of the instrumentation deployed within the network:
o Ozone – TE49C/I o Fine Particulate Matter – TEOM 1400AB/SES o Nitrogen Oxides – TE42C/I o Carbon Monoxide – TE48C/I o Total Reduced Sulphur – TE43C/CDN101 o Sulphur Dioxide – TE43C/I
EMRB operates a laboratory with gas reference standards that adhere to those of the U.S. National Institute of Standards and Technology (NIST) and the Air Quality Research Division of Environment Canada. The secondary transfer standards used by station operators are referenced and certified to EMRB’s NIST primary standards on a quarterly basis. Primary weighed filter standards from Environment Canada are used to calibrate the TEOM twice a year.
The Ontario ambient air quality monitoring network undergoes constant maintenance to ensure a high standard of quality control. Continuous real-time data are consistently reviewed, assessed and validated by EMRB staff. Immediate actions are taken to correct any inconsistencies that may affect the validity of the data. These measures ensure ambient air monitoring data are valid, complete, comparable, representative and accurate. As a result, the 2011 ambient air quality monitoring network had greater than 99 per cent valid data from over one million hourly data points.
Continuous PM2.5 Monitoring Network Upgrade As part of a national initiative, funded by Environment Canada, Ontario will be upgrading its PM2.5 monitoring network at a cost of 1.5 million dollars. The new PM2.5 monitors will be deployed across the AQI network in 2012 and commence reporting in 2013. The new monitors will address issues with cold weather PM2.5 measurements and reduce long-term operation costs. The ministry historically relied on the non-continuous Federal Reference Method (FRM) for PM2.5 monitoring, which produces 24-hour averaged measurements on a 3-day or 6-day cycle. The FRM is resource-intensive and requires sample setup and laboratory analysis and can take up to several

A-iv
months to report PM2.5 data. Continuous particulate matter (PM) monitoring is essential for reporting hourly ambient concentrations; however, it comes with technical challenges. The Tapered Element Oscillating Microbalance (TEOM) technology was developed for continuous real-time PM monitoring (Patashnick and Rupprecht, 1991) and received United States Environmental Protection Agency (USEPA) Class III Federal Equivalent Method (FEM) designation in 1990 for PM10 reporting (USEPA, 2011). The Class III FEM is a designation for measuring ambient concentrations of specified air pollutants in accordance with Title 40, Part 53 of the Code of Federal Regulations (40 CFR Part 53). Ontario was the first province in Canada to report continuous real-time PM2.5 concentrations to the public in 2002 under the AQI program when continuous measurements of PM2.5 became a priority for provincial and federal governments. TEOM was the most innovative method at the time for continuous real-time PM2.5 monitoring, and continues to be used by many jurisdictions across North America. However, studies indicate that PM2.5 measurements by the TEOM are found to be lower than those by FRM when temperatures are low (Rizzo et al., 2003; Motallebi et al., 2003; Zhu et al., 2007; Tortajada-Genaro, L.-A. and E. Borrás, 2011). Over the last decade, continuous PM2.5 monitoring technologies have evolved dramatically to address the technical issues associated with cold weather PM2.5 measurements. To ensure consistency and comparability in PM2.5 monitoring and reporting, in 2006, the USEPA published criteria for designating a continuous PM2.5 monitor as Class III FEM (Federal Register, 2006). Manufacturers are required to collocate their PM2.5 monitors with FRM measurements and pass rigorous tests following the USEPA guidelines to receive the Class III FEM PM2.5 designation (Federal Register, 2006). Six continuous PM2.5 monitors received the Class III FEM designation as of October 12, 2011. After extensive evaluation of four designated Class III FEM PM2.5 monitors, Ontario selected the Thermo Scientific Synchronized Hybrid Ambient Real-time Particulate (SHARP) 5030 to replace the TEOM monitors currently deployed in the AQI network. Ontario will be upgrading its PM2.5 monitoring network to the USEPA Class III FEM to standardize the monitoring methods and ensure consistency of data quality across Canada.

A-v
Data Base
The ambient air quality data used in this report are stored in the ministry’s air quality information system (AQUIS). A statistical pattern test is used to identify data anomalies, such as unusual pollutant concentrations. Each pollutant has a predetermined concentration range based on historical data. Values outside this range are flagged for further investigation. Data obtained from automated ambient air monitoring instruments that operate continuously to produce an average measurement for every hour for a possible total of 8,760 measurements in a given year. Hourly parameters measured include O3, PM2.5, NO/NO2/NOx, CO, SO2 and TRS compounds. A valid annual mean requires at least 6,570 hourly readings. In addition, the 2nd and 3rd quarters of the year should have 75 per cent valid data for ozone, whereas for PM2.5, each quarter of the year should have 75 per cent valid data (Canadian Council of Ministers of the Environment, 2002). NETWORK DESCRIPTIVE TABLE, ANNUAL STATISTICS AND TRENDS
The AQI network for 2011 is summarized in Table 1. The table displays the station name, numerical identifier and pollutants measured. The numerical identifier is the station (ID) number, the first digit of which identifies the geographic region in which the station is located. Table 1 also identifies the type of air monitoring site: ambient, road-side, Canada-wide Standard (CWS), and/or National Air Pollution Surveillance (NAPS). Ambient sites represent the general air quality of an area without any direct influence of local industrial sources. Road-side sites are within approximately 100 m of a major roadway with daily traffic volumes greater than 10,000 vehicles per day. The 2011 statistical data and 10-year trends for various continuous pollutants are provided in Appendices A and B, respectively. To be included in the 10-year trend analysis, a site must have valid annual means for a minimum of 8 years over the 10-year period from 2002-2011. The 20-year trends for ozone, NO2 and SO2 are provided in Appendices C-E. To be included in the 20-year trend analysis, a site must have valid annual means for a minimum of 15 years over the 20-year period from 1992-2011. A linear regression was applied to each of the trends presented in Appendices B-E to calculate the per cent change in concentrations over time.

A-vi
REFERENCES FOR APPENDIX
Canadian Council of Ministers of the Environment, 2002. Guidance Document on Achievement Determination: Canada-Wide Standards for Particulate Matter and Ozone. Federal Register. 2006. 40 CFR Parts 53 and 58: Revisions to Ambient Air Monitoring Regulations; Final Rule. 71 (200), 61236-61328. October 17, 2006. Motallebi, N., Taylor, C.A., Turkiewicz, Jr., K. and B.E. Croes. 2003. Particulate Matter in California: Part 1 – Intercomparison of Several PM2.5, PM10-2.5, and PM10 Monitoring Networks. Journal of the Air & Waste Management Association, Vol. 53, pp. 1509-1516. Patashnick, H. and E.G. Rupprecht. 1991. Continuous PM-10 Measurements Using the tapered Element Oscillating Microbalance. Journal of the Air & Waste Management Association, Vol. 41, pp. 1079-1083. Rizzo, M., Scheff, P.A. and W. Kaldy. 2003. Adjusting Tapered Element Oscillating Microbalance Data for Comparison with Federal Reference Method PM2.5 Measurements in Region 5. Journal of the Air & Waste Management Association, Vol. 53, pp. 596-607. Tortajada-Genaro, L.-A. and E. Borrás. 2011. Temperature effect of tapered element oscillating microbalance (TEOM) system measuring semi-volatile organic particulate matter, Journal of Environmental Monitoring, Vol. 13, pp. 1017-1026. United States Environmental Protection Agency (USEPA). 2011. List of Designated Reference and Equivalent Methods. Issue Date: October 12, 2011. Zhu, K., Zhang, J., and P.J. Lioy. 2007. Evaluation and Comparison of Continuous Fine Particulate Matter Monitors for Measurement of Ambient Aerosols. Journal of the Air & Waste Management Association, Vol. 57, pp. 1499-1506.

Table 12011 Ontario Continuous Ambient Air Monitoring Network
ID STATION NAME STATION LOCATION YEARLATITUDE (D:M:S)
LONGITUDE (D:M:S)
AIR INTAKE (AGL)
TYPE AQI O3 PM2.5 NO2 SO2 CO TRS
12008 WINDSOR DOWNTOWN 467 UNIVERSITY AVE. W. 1969 42°18'56.8" -83°02'37.2" 8 A/RS/C/N Y T T T T T .
12016 WINDSOR WEST COLLEGE AVE./SOUTH ST. 1975 42°17'34.4" -83°04'23.3" 4 A/N Y T T T T . T
13001 CHATHAM 435 GRAND AVE. W. 2005 42°24'13.3" -82°12'29.9" 15 A/C/N Y T T T . . .
14064 SARNIA FRONT ST. N./CN TRACKS, CENTENNIAL PARK 1978 42°58'56.2" -82°24'18.3" 3 A/N Y T T T T . T
15020 GRAND BEND POINT BLAKE CONSERVATION AREA 1991 43°19'59.1" -81°44'34.4" 5 A/N Y T T T . . .
15025 LONDON 900 HIGHBURY AVE. N. 1995 43°00'24.2" -81°12'23.1" 4 A/C/N Y T T T . . .
16015 PORT STANLEY 43665 DEXTER LINE, ELGIN WATER T. PLANT 2002 42°40'19.5" -81°09'46.4" 5 A/N Y T T . . . .
18007 TIVERTON 4th CONCESSION/BRUCE RD. 23 1979 44°18'52.1" -81°32'59.0" 4 A/N Y T T T . . .
21005 BRANTFORD 324 GRAND RIVER AVE. 2004 43°08'19.0" -80°17'33.5" 5 A/C/N Y T T T . . .
26060 KITCHENER WEST AVE./HOMEWOOD AVE. 1990 43°26'37.8" -80°30'13.7" 5 A/C/N Y T T T . . .
27067 ST. CATHARINES ARGYLE CRES., PUMP STN. 1987 43°09'36.2" -79°14'05.1" 4 A/C/N Y T T T . . .
28028 GUELPH EXHIBITION ST./CLARK ST. W. 2000 43°33'05.8" -80°15'51.0" 4 A/C/N Y T T T . . .
29000 HAMILTON DOWNTOWN ELGIN ST./KELLY ST. 1987 43°15'28.0" -79°51'42.0" 4 A/RS/C/N Y T T T T T T
29114 HAMILTON MOUNTAIN VICKERS RD./E. 18TH ST. 1985 43°13'45.9" -79°51'46.0" 3 A/C/N Y T T T T . .
29118 HAMILTON WEST MAIN ST. W./HWY 403 1985 43°15'26.8" -79°54'27.9" 3 A/RS Y T T T . . .
31103 TORONTO DOWNTOWN BAY ST./WELLESLEY ST. W. 2000 43°39'46.7" -79°23'17.2" 10 A/RS/C/N Y T T T . . .
33003 TORONTO EAST KENNEDY RD./LAWRENCE AVE. E. 1970 43°44'52.5" -79°16'26.6" 4 A/RS/C/N Y T T T . . .
34020 TORONTO NORTH HENDON AVE./YONGE ST. 1988 43°46'53.8" -79°25'03.8" 5 A/RS/C/N Y T T T . . .
35125 TORONTO WEST 125 RESOURCES RD. 2003 43°42'34.0" -79°32'36.6" 8 A/RS/C/N Y T T T T T .
44008 BURLINGTON NORTH SHORE BLVD. E./LAKESHORE RD. 1979 43°18'54.4" -79°48'09.5" 5 A/C/N Y T T T . . .
44017 OAKVILLE EIGHTH LINE/GLENASHTON DR., HALTON RESERVOIR 2003 43°29'12.9" -79°42'08.2" 12 A/C/N Y T T T . . .
45026 OSHAWA 2000 SIMCOE ST. N., DURHAM COLLEGE 2005 43°56'45.4" -78°53'41.7" 7 A/RS/C/N Y T T T . . .
46089 BRAMPTON 525 MAIN ST. N., PEEL MANOR 2000 43°41'55.5" -79°46'51.3" 5 A/C/N Y T T T . . .
46108 MISSISSAUGA 3359 MISSISSAUGA RD. N., U of T MISSISSAUGA 2007 43°32'49.1" -79°39'31.3" 5 A/C/N Y T T T T . .
47045 BARRIE 83 PERRY ST. 2001 44°22'56.5" -79°42'08.3" 5 A/C/N Y T T T . . .
48006 NEWMARKET EAGLE ST. W./McCAFFREY RD. 2001 44°02'39.5" -79°28'59.7" 5 A/N Y T T T . . .
49005 PARRY SOUND 7 BAY ST. 2001 45°20'16.3" -80°02'17.4" 5 A/N Y T T T . . .
49010 DORSET 1026 BELLWOOD ACRES RD. 1981 45°13'27.4" -78°55'58.6" 3 A/N Y T T . . . .
51001 OTTAWA DOWNTOWN RIDEAU ST./WURTEMBURG ST. 1971 45°26'03.6" -75°40'33.6" 4 A/C/N Y T T T T T .
51002 OTTAWA CENTRAL 960 CARLING AVE. 2007 45°22'57.1" -75°42'51.1" 5 A/N Y T T T . . .
A-vii

Table 12011 Ontario Continuous Ambient Air Monitoring Network (continued)
ID STATION NAME STATION LOCATION YEARLATITUDE (D:M:S)
LONGITUDE (D:M:S)
AIR INTAKE (AGL)
TYPE AQI O3 PM2.5 NO2 SO2 CO TRS
51010 PETAWAWA PETAWAWA RESEARCH FOREST FACILITY 2007 45°59'48.2" -77°26'28.3" 6 A/N Y T T . . . .
52022 KINGSTON 752 KING ST. W. 2006 44°12'58.5" -76°31'41.9" 13 A/C/N Y T T T . . .
54012 BELLEVILLE 2 SIDNEY ST., WATER TREATMENT PLANT 2002 44°09'01.9" -77°23'43.8" 10 A/N Y T T T . . .
56010 MORRISBURG COUNTY RD. 2, MORRISBURG WATER TOWER 2005 44°53'59.1" -75°11'23.8" 5 A/N Y T T . . . .
56051 CORNWALL BEDFORD ST./3RD ST. W. 1970 45°01'04.7" -74°44'06.8" 4 A/N Y T T T . . .
59006 PETERBOROUGH 10 HOSPITAL DR. 1998 44°18'06.9" -78°20'46.4" 10 A/C/N Y T T T . . .
63203 THUNDER BAY 421 JAMES ST. S. 2004 48°22'45.8" -89°17'24.6" 15 A/RS/C/N Y T T T . . .
71078 SAULT STE. MARIE SAULT COLLEGE 2004 46°31'59.5" -84°18'35.7" 8 A/N Y T T T T . T
75010 NORTH BAY CHIPPEWA ST. W., DEPT. NATIONAL DEFENCE 1979 46°19'23.5" -79°26'57.4" 4 A/RS/N Y T T T . . .
77219 SUDBURY 1222 RAMSEY LAKE RD. 2004 46°28'32.5" -80°57'46.6" 3 A/C/N Y T T . T . .
TOTAL 40 40 40 35 10 4 4
Notes:
ID
Year
Air intakeType
AQI
T - telemetry
O3
PM2.5
NO2 - nitrogen dioxide
CO - carbon monoxide
SO2 - sulphur dioxide
TRS - total reduced sulphur
- ground-level ozone
- fine particulate matter
A-viii
- station identfication number
- year station began monitoring
- height of air intake above ground (m)
- type of monitoring site: A = ambient, RS = road-side, C = CWS, N = NAPS
- Air Quality Index site

Table A12011 Ozone (O3) StatisticsUnit: parts per billion (ppb)O3 1-hour AAQC is 80 ppb
No. of Times Above Criterion
10% 30% 50% 70% 90% 99% Mean 1h 24h 1h
12008 Windsor Downtown 467 University Ave. W. 8734 7 18 26 34 48 74 27.2 100 65 42
12016 Windsor West College Ave./South St. 8704 7 18 25 33 47 72 26.4 101 59 31
13001 Chatham 435 Grand Ave. W. 8561 14 22 29 36 46 67 29.7 92 59 16
14064 Sarnia Front St. N./Cn Tracks, Centennial Park 8700 13 22 29 36 46 68 29.7 94 57 12
15020 Grand Bend Point Blake Conservation Area 8743 17 26 33 39 47 69 32.8 115 60 20
15025 London 900 Highbury Ave. N. 8689 11 20 26 33 43 62 26.8 83 57 2
16015 Port Stanley 43665 Dexter Line, Elgin Water T. Plt 8750 17 26 32 38 48 71 32.8 94 67 30
18007 Tiverton 4th Concession/Bruce Rd. 23 8523 18 26 32 38 45 65 32.1 89 63 6
21005 Brantford 324 Grand River Ave. 8679 10 21 29 36 46 65 28.7 94 68 10
26060 Kitchener West Ave./Homewood Ave. 8727 11 20 27 34 44 61 27.6 87 59 3
27067 St. Catharines Argyle Cres., Pump Stn. 8734 10 21 28 35 45 63 28.0 83 59 1
28028 Guelph Exhibition St./Clark St. W. 8667 11 22 29 36 45 64 28.9 94 61 4
29000 Hamilton Downtown Elgin St./Kelly St. 8745 8 18 25 32 42 62 25.4 92 60 5
29114 Hamilton Mountain Vickers Rd./E. 18th St. 8752 11 21 28 35 46 65 28.8 95 65 6
29118 Hamilton West Main St. W./Hwy 403 8743 5 17 24 31 40 60 24.2 88 56 3
31103 Toronto Downtown Bay St./Wellesley St. W. 8724 8 18 25 32 42 61 25.4 88 58 1
33003 Toronto East Kennedy Rd./Lawrence Ave. E. 8703 5 16 23 30 40 61 23.3 82 57 1
34020 Toronto North Hendon Ave./Yonge St. 8744 6 16 23 30 40 61 23.6 85 57 1
35125 Toronto West 125 Resources Rd. 8659 2 11 19 27 38 61 20.1 87 53 1
44008 Burlington North Shore Blvd. E./Lakeshore Rd. 8682 7 18 26 33 43 60 25.9 85 57 2
44017 Oakville Eighth Line/Glenashton Dr., Halton Res. 8616 9 20 27 33 43 63 26.8 95 60 4
45026 Oshawa 2000 Simcoe St. N., Durham College 8742 11 20 26 33 41 61 26.6 85 50 2
46089 Brampton 525 Main St. N., Peel Manor 8731 7 19 26 33 44 64 26.1 88 62 4
46108 Mississauga 3359 Mississauga Rd. N., U Of T Campus 8596 4 17 24 31 41 59 24.1 87 57 3
47045 Barrie 83 Perry St. 8659 7 18 25 33 42 57 25.3 67 52 0
48006 Newmarket Eagle St. W./Mccaffrey Rd. 8675 11 21 28 34 44 63 27.8 84 64 6
A-1
P E R C E N T I L E S MaximumID City/Town Location Valid h

Table A12011 Ozone (O3) Statistics (continued)Unit: parts per billion (ppb)O3 1-hour AAQC is 80 ppb
No. of Times Above Criterion
10% 30% 50% 70% 90% 99% Mean 1h 24h 1h
49005 Parry Sound 7 Bay St. 8737 14 24 30 36 44 61 29.7 81 59 1
49010 Dorset 1026 Bellwood Acres Rd. 8729 9 21 28 34 43 55 27.0 72 47 0
51001 Ottawa Downtown Rideau St./Wurtemburg St. 8609 9 17 24 30 39 52 24.2 66 46 0
51002 Ottawa Central 960 Carling Ave. 8689 9 19 25 32 40 52 24.8 64 48 0
51010 Petawawa Petawawa Research Forest Facility 8625 10 20 27 33 42 53 26.7 67 50 0
52022 Kingston 752 King St. W. 8605 15 24 30 36 44 62 30.3 80 64 0
54012 Belleville 2 Sidney St., Water Treatment Plant 8740 11 21 28 34 43 61 27.9 86 62 6
56010 Morrisburg County Rd. 2, Morrisburg Water Tower 8741 11 21 28 34 42 55 27.2 76 55 0
56051 Cornwall Bedford St./3rd St. W. 8741 9 20 26 33 41 54 26.1 72 55 0
59006 Peterborough 10 Hospital Dr. 8703 12 21 28 34 43 62 27.9 86 60 2
63203 Thunder Bay 421 James St. S. 8584 7 19 26 32 41 50 25.2 60 46 0
71078 Sault Ste. Marie Sault College 8722 13 22 28 34 43 54 27.8 80 50 0
75010 North Bay Chippewa St. W., Dept. National Defence 8753 10 20 27 33 42 56 26.7 74 52 0
77219 Sudbury 1222 Ramsey Lake Rd. 8700 14 23 29 34 43 55 28.7 67 51 0
A-2
ID City/Town Location Valid hP E R C E N T I L E S Maximum

Table A22011 Fine Particulate Matter (PM2.5) StatisticsUnit: micrograms per cubic metre (µg/m3)PM2.5 24-hour Reference Level is 30 µg/m3
No. of Times Above Reference Level
10% 30% 50% 70% 90% 99% Mean 1h 24h 24h
12008 Windsor Downtown 467 University Ave. W. 8546 1 4 6 9 16 29 7.6 42 30 0
12016 Windsor West College Ave./South St. 8503 1 4 6 10 16 30 7.8 57 31 2
13001 Chatham 435 Grand Ave. W. 8680 1 3 5 8 14 27 6.6 63 30 1
14064 Sarnia Front St. N./Cn Tracks, Centennial Park 8696 4 6 9 12 20 32 10.5 84 33 2
15020 Grand Bend Point Blake Conservation Area 8703 1 3 4 7 14 26 6.1 48 27 0
15025 London 900 Highbury Ave. N. 8520 1 3 5 8 13 26 6.2 39 27 0
16015 Port Stanley 43665 Dexter Line, Elgin Water T. Plt 8657 1 3 5 7 13 26 6.0 47 30 1
18007 Tiverton 4th Concession/Bruce Rd. 23 8500 0 2 3 6 11 20 4.7 38 21 0
21005 Brantford 324 Grand River Ave. 8581 1 3 5 8 15 28 6.6 45 28 0
26060 Kitchener West Ave./Homewood Ave. 8641 1 3 5 8 14 26 6.2 52 25 0
27067 St. Catharines Argyle Cres., Pump Stn. 8684 1 3 5 8 13 24 6.3 37 23 0
28028 Guelph Exhibition St./Clark St. W. 8651 0 2 4 7 13 25 5.9 42 28 0
29000 Hamilton Downtown Elgin St./Kelly St. 8446 1 4 6 10 18 35 8.1 65 37 1
29114 Hamilton Mountain Vickers Rd./E. 18th St. 8640 1 3 5 8 15 29 6.7 84 29 0
29118 Hamilton West Main St. W./Hwy 403 8680 1 3 5 8 16 30 7.1 60 28 0
31103 Toronto Downtown Bay St./Wellesley St. W. 8641 0 3 5 8 14 24 6.2 45 21 0
33003 Toronto East Kennedy Rd./Lawrence Ave. E. 8642 1 3 5 8 14 24 6.2 37 21 0
34020 Toronto North Hendon Ave./Yonge St. 8566 1 3 6 10 17 31 7.7 47 30 0
35125 Toronto West 125 Resources Rd. 8610 1 3 5 9 15 26 6.9 45 24 0
44008 Burlington North Shore Blvd. E./Lakeshore Rd. 8603 1 3 5 8 14 24 6.2 42 23 0
44017 Oakville Eighth Line/Glenashton Dr., Halton Res. 8511 1 3 5 8 14 25 6.4 46 25 0
45026 Oshawa 2000 Simcoe St. N., Durham College 8560 0 2 4 7 12 23 5.5 38 22 0
46089 Brampton 525 Main St. N., Peel Manor 8537 0 3 4 7 13 24 6.0 50 24 0
46108 Mississauga 3359 Mississauga Rd. N., U Of T Campus 8487 1 3 5 8 13 23 6.0 37 21 0
47045 Barrie 83 Perry St. 8616 1 2 4 7 13 23 5.7 49 26 0
48006 Newmarket Eagle St. W./Mccaffrey Rd. 8717 0 2 4 7 13 24 5.5 52 23 0
A-3
MaximumP E R C E N T I L E SID City/Town Location Valid h

Table A22011 Fine Particulate Matter (PM2.5) Statistics (continued)Unit: micrograms per cubic metre (µg/m3)PM2.5 24-hour Reference Level is 30 µg/m3
No. of Times Above Reference Level
10% 30% 50% 70% 90% 99% Mean 1h 24h 24h
49005 Parry Sound 7 Bay St. 8685 0 2 3 6 11 22 4.7 49 24 0
49010 Dorset 1026 Bellwood Acres Rd. 8662 0 2 3 5 10 20 4.1 45 22 0
51001 Ottawa Downtown Rideau St./Wurtemburg St. 8640 0 2 4 6 11 21 4.9 40 22 0
51002 Ottawa Central 960 Carling Ave. 8655 0 2 3 6 10 18 4.5 51 20 0
51010 Petawawa Petawawa Research Forest Facility 8618 0 1 3 4 8 14 3.4 45 14 0
52022 Kingston 752 King St. W. 8559 1 3 5 8 15 31 6.9 49 37 1
54012 Belleville 2 Sidney St., Water Treatment Plant 8696 0 2 4 6 11 21 4.8 46 19 0
56010 Morrisburg County Rd. 2, Morrisburg Water Tower 8716 1 2 4 6 11 22 5.2 35 22 0
56051 Cornwall Bedford St./3rd St. W. 8713 1 3 4 7 12 23 5.7 43 24 0
59006 Peterborough 10 Hospital Dr. 8677 1 2 4 7 12 23 5.5 48 23 0
63203 Thunder Bay 421 James St. S. 8532 0 2 4 6 10 20 4.8 84 52 1
71078 Sault Ste. Marie Sault College 8633 0 2 3 5 10 21 4.4 46 29 0
75010 North Bay Chippewa St. W., Dept. National Defence 8702 0 2 3 5 9 19 4.2 54 24 0
77219 Sudbury 1222 Ramsey Lake Rd. 8712 0 2 3 5 9 19 4.0 38 22 0
Notes:
Measurements taken by Tapered Element Oscillating Microbalance (TEOM) sampler operated at 30 degrees Celsius with a
Sample Equilibrium System (SES).
INS indicates there was insufficient data in any one quarter to calculate a valid annual mean.
The PM2.5 reference level is 30 µg/m3 for a 24-hour period (based on CWS).
A-4
ID City/Town Location Valid hP E R C E N T I L E S Maximum

Table A32011 Nitric Oxide (NO) StatisticsUnit: parts per billion (ppb)
Valid h10% 30% 50% 70% 90% 99% Mean 1h 24h
12008 Windsor Downtown 467 University Ave. W. 8740 0 1 2 4 9 46 4.5 238 51
12016 Windsor West College Ave./South St. 8497 0 1 1 3 7 41 3.8 374 90
13001 Chatham 435 Grand Ave. W. 8687 0 1 1 2 4 13 1.9 127 22
14064 Sarnia Front St. N./Cn Tracks, Centennial Park 8703 0 2 3 3 5 19 3.14 140 40
15020 Grand Bend Point Blake Conservation Area 8740 0 0 0 0 1 4 0.3 20 3
15025 London 900 Highbury Ave. N. 8715 1 1 2 3 6 28 3.3 140 31
18007 Tiverton 4th Concession/Bruce Rd. 23 8529 0 1 1 1 2 4 0.9 55 5
21005 Brantford 324 Grand River Ave. 8680 0 0 0 1 3 19 1.2 95 14
26060 Kitchener West Ave./Homewood Ave. 8686 0 0 1 1 3 36 2.0 112 22
27067 St. Catharines Argyle Cres., Pump Stn. 8733 0 0 1 1 4 36 2.3 133 47
28028 Guelph Exhibition St./Clark St. W. 8671 1 1 1 1 3 33 2.4 124 30
29000 Hamilton Downtown Elgin St./Kelly St. 8641 0 1 1 3 11 60 4.8 225 55
29114 Hamilton Mountain Vickers Rd./E. 18th St. 8732 0 0 1 2 5 26 2.3 105 31
29118 Hamilton West Main St. W./Hwy 403 8743 0 1 2 4 16 73 6.4 212 71
31103 Toronto Downtown Bay St./Wellesley St. W. 8698 0 1 1 3 8 36 3.4 123 29
33003 Toronto East Kennedy Rd./Lawrence Ave. E. 8700 1 1 3 6 17 75 7.6 218 60
34020 Toronto North Hendon Ave./Yonge St. 8654 0 1 3 5 14 61 6.2 181 62
35125 Toronto West 125 Resources Rd. 8698 0 2 5 12 33 105 12.4 253 71
44008 Burlington North Shore Blvd. E./Lakeshore Rd. 8589 0 1 1 3 10 57 4.6 191 52
44017 Oakville Eighth Line/Glenashton Dr., Halton Res. 8619 0 0 1 2 6 36 2.7 177 40
45026 Oshawa 2000 Simcoe St. N., Durham College 8688 0 1 1 2 5 25 2.3 64 31
46089 Brampton 525 Main St. N., Peel Manor 8723 0 1 1 3 9 66 4.6 217 65
46108 Mississauga 3359 Mississauga Rd. N., U Of T Campus 8542 0 1 1 2 8 57 4.1 172 56
47045 Barrie 83 Perry St. 8664 0 0 1 2 8 57 3.8 302 39
48006 Newmarket Eagle St. W./Mccaffrey Rd. 8703 0 1 1 1 4 28 2.2 147 25
P E R C E N T I L E S MaximumID City/Town Location
A-5

Table A32011 Nitric Oxide (NO) Statistics (continued)Unit: parts per billion (ppb)
Valid h10% 30% 50% 70% 90% 99% Mean 1h 24h
49005 Parry Sound 7 Bay St. 8749 0 0 1 1 2 9 0.9 47 7
51001 Ottawa Downtown Rideau St./Wurtemburg St. 8467 0 0 1 1 4 20 1.8 126 17
51002 Ottawa Central 960 Carling Ave. 8517 0 0 0 0 3 27 1.5 141 20
52022 Kingston 752 King St. W. 8626 0 0 0 0 1 6 0.5 39 7
54012 Belleville 2 Sidney St., Water Treatment Plant 8739 0 0 1 2 5 28 2.3 111 28
56051 Cornwall Bedford St./3rd St. W. 8738 0 0 1 1 3 30 1.9 209 51
59006 Peterborough 10 Hospital Dr. 8705 0 1 1 2 4 27 2.2 87 21
63203 Thunder Bay 421 James St. S. 8584 1 2 2 4 15 45 5.9 142 35
71078 Sault Ste. Marie Sault College 8721 1 1 1 2 4 14 2.0 64 11
75010 North Bay Chippewa St. W., Dept. National Defence 8757 1 2 2 3 6 40 4.0 149 36
Note:
INS indicates there was insufficient data to calculate a valid annual mean.
A-6
ID City/Town LocationP E R C E N T I L E S Maximum

Table A42011 Nitrogen Dioxide (NO2) StatisticsUnit: parts per billion (ppb)NO2 1-hour AAQC is 200 ppbNO2 24-hour AAQC is 100 ppb
Valid h10% 30% 50% 70% 90% 99% Mean 1h 24h 1h 24h
12008 Windsor Downtown 467 University Ave. W. 8740 5 8 12 17 27 46 14.5 69 40 0 0
12016 Windsor West College Ave./South St. 8497 4 7 11 15 24 46 12.9 93 37 0 0
13001 Chatham 435 Grand Ave. W. 8687 1 3 5 8 14 27 6.6 49 23 0 0
14064 Sarnia Front St. N./Cn Tracks, Centennial Park 8703 2 4 6 11 19 32 8.6 55 30 0 0
15020 Grand Bend Point Blake Conservation Area 8740 1 2 3 4 8 15 3.6 23 17 0 0
15025 London 900 Highbury Ave. N. 8715 3 4 6 9 17 34 8.3 50 28 0 0
18007 Tiverton 4th Concession/Bruce Rd. 23 8529 1 1 2 3 5 13 2.5 24 12 0 0
21005 Brantford 324 Grand River Ave. 8680 2 3 4 7 13 27 6.1 53 23 0 0
26060 Kitchener West Ave./Homewood Ave. 8686 2 4 6 9 16 35 7.7 51 29 0 0
27067 St. Catharines Argyle Cres., Pump Stn. 8733 3 5 6 10 17 32 8.5 46 31 0 0
28028 Guelph Exhibition St./Clark St. W. 8671 2 3 5 8 16 32 7.3 50 26 0 0
29000 Hamilton Downtown Elgin St./Kelly St. 8641 4 8 11 16 25 42 13.5 64 37 0 0
29114 Hamilton Mountain Vickers Rd./E. 18th St. 8732 3 5 7 12 20 37 9.9 56 30 0 0
29118 Hamilton West Main St. W./Hwy 403 8743 4 7 10 16 26 42 13.1 56 42 0 0
31103 Toronto Downtown Bay St./Wellesley St. W. 8698 6 9 13 18 27 42 14.9 54 36 0 0
33003 Toronto East Kennedy Rd./Lawrence Ave. E. 8700 5 9 13 18 30 44 15.2 60 41 0 0
34020 Toronto North Hendon Ave./Yonge St. 8654 4 8 13 19 30 46 15.4 61 44 0 0
35125 Toronto West 125 Resources Rd. 8698 7 12 17 23 34 49 19.1 71 42 0 0
44008 Burlington North Shore Blvd. E./Lakeshore Rd. 8589 3 6 10 14 24 42 11.8 58 37 0 0
44017 Oakville Eighth Line/Glenashton Dr., Halton Res. 8619 3 5 8 12 22 39 10.3 55 33 0 0
45026 Oshawa 2000 Simcoe St. N., Durham College 8688 2 3 5 8 15 33 7.0 47 32 0 0
46089 Brampton 525 Main St. N., Peel Manor 8723 3 5 8 13 25 43 11.3 61 39 0 0
46108 Mississauga 3359 Mississauga Rd. N., U Of T Campus 8542 3 5 8 12 21 40 10.6 62 35 0 0
47045 Barrie 83 Perry St. 8664 3 4 6 10 18 36 8.6 56 30 0 0
48006 Newmarket Eagle St. W./Mccaffrey Rd. 8703 2 4 5 9 17 37 8.1 64 39 0 0
No. of Times Above Criteria
P E R C E N T I L E S MaximumID City/Town Location
A-7

Table A42011 Nitrogen Dioxide (NO2) Statistics (continued)Unit: parts per billion (ppb)NO2 1-hour AAQC is 200 ppbNO2 24-hour AAQC is 100 ppb
Valid h10% 30% 50% 70% 90% 99% Mean 1h 24h 1h 24h
49005 Parry Sound 7 Bay St. 8749 1 1 2 4 8 21 3.6 36 15 0 0
51001 Ottawa Downtown Rideau St./Wurtemburg St. 8467 2 3 5 9 17 34 7.9 49 34 0 0
51002 Ottawa Central 960 Carling Ave. 8517 1 3 4 7 15 36 6.6 49 36 0 0
52022 Kingston 752 King St. W. 8626 2 2 3 5 9 23 4.6 48 19 0 0
54012 Belleville 2 Sidney St., Water Treatment Plant 8739 2 3 4 7 13 29 6.3 47 26 0 0
56051 Cornwall Bedford St./3rd St. W. 8738 2 3 4 7 14 35 6.5 59 40 0 0
59006 Peterborough 10 Hospital Dr. 8705 1 2 3 4 9 30 4.3 46 28 0 0
63203 Thunder Bay 421 James St. S. 8584 2 4 6 10 19 35 8.6 50 26 0 0
71078 Sault Ste. Marie Sault College 8721 1 2 4 6 12 25 5.3 48 19 0 0
75010 North Bay Chippewa St. W., Dept. National Defence 8757 2 3 4 7 17 43 7.4 61 32 0 0
Note:
INS indicates there was insufficient data to calculate a valid annual mean.
A-8
ID City/Town LocationP E R C E N T I L E S Maximum
No. of Times Above Criteria

Table A52011 Nitrogen Oxides (NOx) StatisticsUnit: parts per billion (ppb)
10% 30% 50% 70% 90% 99% Mean 1h 24h
12008 Windsor Downtown 467 University Ave. W. 8740 6 10 14 21 36 86 18.9 272 78
12016 Windsor West College Ave./South St. 8497 5 9 13 18 31 78 16.7 467 127
13001 Chatham 435 Grand Ave. W. 8687 2 4 6 9 17 37 8.4 154 34
14064 Sarnia Front St. N./Cn Tracks, Centennial Park 8703 3 6 9 13 23 48 11.7 196 69
15020 Grand Bend Point Blake Conservation Area 8740 1 2 3 4 8 18 4.0 35 19
15025 London 900 Highbury Ave. N. 8715 4 6 8 12 22 56 11.6 190 48
18007 Tiverton 4th Concession/Bruce Rd. 23 8529 1 2 3 4 6 15 3.4 76 15
21005 Brantford 324 Grand River Ave. 8680 2 3 5 8 15 41 7.3 148 30
26060 Kitchener West Ave./Homewood Ave. 8686 3 4 6 10 19 61 9.6 149 46
27067 St. Catharines Argyle Cres., Pump Stn. 8733 3 5 7 11 21 60 10.9 177 78
28028 Guelph Exhibition St./Clark St. W. 8671 3 4 6 10 19 59 9.5 165 51
29000 Hamilton Downtown Elgin St./Kelly St. 8641 5 9 13 20 36 94 18.3 288 87
29114 Hamilton Mountain Vickers Rd./E. 18th St. 8732 3 5 9 14 25 60 12.2 156 53
29118 Hamilton West Main St. W./Hwy 403 8743 5 8 13 20 41 106 19.5 259 107
31103 Toronto Downtown Bay St./Wellesley St. W. 8698 7 10 15 21 34 75 18.4 161 64
33003 Toronto East Kennedy Rd./Lawrence Ave. E. 8700 6 11 17 24 45 114 22.8 260 101
34020 Toronto North Hendon Ave./Yonge St. 8654 5 10 16 24 43 100 21.5 241 104
35125 Toronto West 125 Resources Rd. 8698 8 15 23 35 64 142 31.5 309 103
44008 Burlington North Shore Blvd. E./Lakeshore Rd. 8589 4 7 11 17 33 95 16.4 242 87
44017 Oakville Eighth Line/Glenashton Dr., Halton Res. 8619 3 5 9 14 27 69 13.0 217 64
45026 Oshawa 2000 Simcoe St. N., Durham College 8688 2 4 6 9 19 53 9.2 107 53
46089 Brampton 525 Main St. N., Peel Manor 8723 3 6 10 16 34 104 15.9 278 90
46108 Mississauga 3359 Mississauga Rd. N., U Of T Campus 8542 4 6 10 15 29 93 14.7 228 79
47045 Barrie 83 Perry St. 8664 3 5 7 12 25 87 12.4 344 56
48006 Newmarket Eagle St. W./Mccaffrey Rd. 8703 3 4 7 10 21 59 10.3 197 57
P E R C E N T I L E S MaximumID City/Town Location Valid h
A-9

Table A52011 Nitrogen Oxides (NOx) Statistics (continued)Unit: parts per billion (ppb)
10% 30% 50% 70% 90% 99% Mean 1h 24h
49005 Parry Sound 7 Bay St. 8749 1 2 3 4 9 27 4.5 65 17
51001 Ottawa Downtown Rideau St./Wurtemburg St. 8467 2 4 6 11 21 50 9.7 167 45
51002 Ottawa Central 960 Carling Ave. 8517 1 3 4 8 18 61 8.1 145 54
52022 Kingston 752 King St. W. 8626 2 3 4 5 10 28 5.3 87 26
54012 Belleville 2 Sidney St., Water Treatment Plant 8739 3 4 5 8 17 52 8.7 148 53
56051 Cornwall Bedford St./3rd St. W. 8738 2 3 5 8 17 61 8.4 268 88
59006 Peterborough 10 Hospital Dr. 8705 2 3 4 6 13 47 6.6 99 41
63203 Thunder Bay 421 James St. S. 8584 4 6 9 15 32 75 14.5 182 61
71078 Sault Ste. Marie Sault College 8721 2 3 5 8 15 36 7.2 112 30
75010 North Bay Chippewa St. W., Dept. National Defence 8757 4 5 7 10 24 79 11.5 200 66
Note:
INS indicates there was insufficient data to calculate a valid annual mean.
A-1
0
ID City/Town Location Valid hP E R C E N T I L E S Maximum

Table A62011 Carbon Monoxide (CO) StatisticsUnit: parts per million (ppm)CO 1-hour AAQC is 30 ppmCO 8-hour AAQC is 13 ppm
10% 30% 50% 70% 90% 99% Mean 1h 8h 1h 8h
12008 Windsor Downtown 467 University Ave. W. 8651 0.16 0.20 0.23 0.27 0.38 0.69 0.26 3.77 1.46 0 0
29000 Hamilton Downtown Elgin St./Kelly St. 8677 0 0.16 0.21 0.26 0.40 0.84 0.22 1.83 1.15 0 0
35125 Toronto West 125 Resources Rd. 8568 0.07 0.14 0.18 0.23 0.33 0.61 0.20 1.39 0.76 0 0
51001 Ottawa Downtown Rideau St./Wurtemburg St. 8371 0.19 0.23 0.27 0.32 0.40 0.57 0.29 1.45 0.96 0 0
A-1
1
No. of Times Above Criteria
P E R C E N T I L E S MaximumID City/Town Location Valid h

Table A72011 Sulphur Dioxide (SO2) StatisticsUnit: parts per billion (ppb)SO2 1-hour AAQC is 250 ppbSO2 24-hour AAQC is 100 ppbSO2 1-year AAQC is 20 ppb
10% 30% 50% 70% 90% 99% Mean 1h 24h 1h 24h 1y
12008 Windsor Downtown 467 University Ave. W. 8741 0 1 2 3 9 27 3.5 61 17 0 0 0
12016 Windsor West College Ave./South St. 8581 0 1 1 3 9 25 3.4 75 19 0 0 0
14064 Sarnia Front St. N./Cn Tracks, Centennial Park 8700 1 1 2 3 12 56 5.3 94 53 0 0 0
29000 Hamilton Downtown Elgin St./Kelly St. 8748 0 1 1 3 16 48 5.2 117 29 0 0 0
29114 Hamilton Mountain Vickers Rd./E. 18th St. 8750 1 1 2 3 10 32 4.1 99 43 0 0 0
35125 Toronto West 125 Resources Rd. 8703 1 1 1 2 3 6 1.5 17 5 0 0 0
46108 Mississauga 3359 Mississauga Rd. N., U Of T Campus 8554 0 1 1 1 2 7 1.3 24 5 0 0 0
51001 Ottawa Downtown Rideau St./Wurtemburg St. 8264 0 0 0 0 1 3 0.4 13 3 0 0 0
71078 Sault Ste. Marie Sault College 8722 0 0 0 0 1 17 0.8 54 11 0 0 0
77219 Sudbury 1222 Ramsey Lake Rd. 8733 0 0 0 1 2 25 1.5 113 18 0 0 0
No. of Times Above Criteria
P E R C E N T I L E S MaximumID City/Town Location Valid h
A-1
2

Table A82011 Total Reduced Sulphur (TRS) Compounds StatisticsUnit: parts per billion (ppb)
10% 30% 50% 70% 90% 99% Mean 1h 24h
12016 Windsor West College Ave./South St. 8705 0 0 0 0 1 2 0.2 18 2
14064 Sarnia Front St. N./Cn Tracks, Centennial Park 7624 0 0 0 0 1 2 0.2 4 1
29000 Hamilton Downtown Elgin St./Kelly St. 8745 0 0 0 1 1 3 0.5 28 4
71078 Sault Ste. Marie Sault College 8720 0 0 1 1 1 1 0.5 4 1
A-1
3
P E R C E N T I L E S MaximumID City/Town Location Valid h

Table B1: 10-Year Trend for O3
Annual Mean (ppb)
ID City/Town 2002 2003 2004 2005 2006 2007 2008 2009 2010 2011
12008 Windsor Downtown 21.9 22.9 20.2 25.3 24.6 27.0 26.9 24.8 28.0 27.2 ↑ 28%12016 Windsor West 20.2 22.9 22.6 25.6 24.3 25.3 25.9 24.9 26.7 26.4 ↑ 24%14064 Sarnia 26.5 24.7 23.8 27.4 26.7 28.6 28.7 26.6 30.7 29.7 ↑ 20%15020 Grand Bend 29.8 30.7 25.8 32.5 29.7 31.7 31.3 29.6 35.0 32.8 ↑ 14%15025 London 25.3 26.9 23.6 26.1 25.1 27.2 27.0 25.1 28.2 26.8 ↑ 8%16015 Port Stanley INS 34.9 32.2 34.6 32.4 34.3 34.3 30.9 34.6 32.8 ↓ 3%18007 Tiverton 34.7 33.2 28.1 31.8 29.0 34.3 32.6 31.4 33.8 32.1 ↑ 1%21005 Brantford n/a INS 26.2 27.9 27.0 28.9 28.4 26.5 29.4 28.7 ↑ 7%26060 Kitchener 27.3 28.1 24.8 28.0 26.6 28.6 28.1 27.0 29.4 27.6 ↑ 5%27067 St. Catharines 24.1 25.3 23.6 26.3 26.2 28.1 27.5 25.6 28.3 28.0 ↑ 16%28028 Guelph 28.4 24.4 25.9 28.6 26.8 28.1 27.9 27.3 30.7 28.9 ↑ 11%29000 Hamilton Downtown 20.4 21.7 20.1 23.3 23.2 24.8 25.1 24.3 26.9 25.4 ↑ 29%29114 Hamilton Mountain 27.7 28.4 24.6 28.2 27.5 29.2 29.0 27.2 29.7 28.8 ↑ 7%29118 Hamilton West 20.5 22.0 19.2 21.2 20.9 23.0 23.3 21.8 24.5 24.2 ↑ 20%31103 Toronto Downtown 24.0 23.6 22.8 24.5 22.6 25.7 26.0 24.6 26.1 25.4 ↑ 11%33003 Toronto East 21.0 21.8 19.9 22.4 22.0 23.2 21.6 22.1 23.0 23.3 ↑ 10%34020 Toronto North 25.1 23.6 22.5 24.5 23.3 24.5 22.7 22.1 24.8 23.6 ↓ 3%35125 Toronto West n/a 18.7 17.6 20.3 19.0 21.1 20.7 19.5 20.6 20.1 ↑ 11%44008 Burlington 26.3 22.8 21.0 23.9 23.5 24.6 24.9 24.1 26.6 25.9 ↑ 10%44017 Oakville 25.1 INS 24.6 27.7 26.1 27.5 27.0 25.5 28.0 26.8 ↑ 8%45026 Oshawa 23.2 24.1 23.3 28.6 25.1 28.0 27.0 25.5 28.0 26.6 ↑ 15%46089 Brampton 26.2 25.1 25.1 26.8 25.5 26.8 26.6 25.2 27.5 26.1 ↑ 3%46108 Mississauga 23.1 24.8 20.6 23.1 22.4 23.3 24.6 24.0 25.9 24.1 ↑ 9%47045 Barrie 26.1 23.2 24.8 26.9 24.1 25.9 26.5 24.3 26.8 25.3 ↑ 3%48006 Newmarket 31.4 29.6 28.3 30.8 28.8 31.7 29.5 28.6 31.5 27.8 ↓ 3%49005 Parry Sound INS INS 31.1 33.8 30.7 31.8 32.1 29.7 31.3 29.7 ↓ 7%49010 Dorset 32.4 30.1 28.8 32.3 28.9 29.9 29.3 27.7 28.6 27.0 ↓ 12%51001 Ottawa Downtown 24.9 24.7 21.7 23.3 23.6 24.7 23.3 23.4 25.7 24.2 ↑ 2%54012 Belleville INS 30.9 28.1 29.4 29.2 32.0 29.8 28.5 30.0 27.9 ↓ 3%56010 Morrisburg n/a INS 28.0 27.8 28.0 29.2 27.9 26.1 28.6 27.2 ↓ 2%56051 Cornwall 24.8 25.9 23.8 27.7 27.5 28.3 26.6 25.5 27.9 26.1 ↑ 7%59006 Peterborough 30.5 29.7 27.1 31.2 24.9 27.6 28.2 27.7 30.5 27.9 ↓ 4%63203 Thunder Bay 23.4 26.1 22.0 22.3 23.5 24.2 23.0 24.2 25.7 25.2 ↑ 6%71078 Sault Ste. Marie 24.2 26.8 27.0 30.2 29.1 29.7 28.9 27.8 28.4 27.8 ↑ 9%75010 North Bay 26.8 27.0 25.2 28.0 26.7 27.1 27.7 26.1 28.0 26.7 ↑ 2%77219 Sudbury 29.2 28.5 27.8 31.0 28.4 28.1 27.9 25.9 28.7 28.7 ↓ 4%
Notes:n/a indicates pollutant not monitored.INS indicates there was insufficient data in the 2nd and/or 3rd quarter to calculate a valid annual mean.Station 44017 replaced station 44015 as the Oakville site in 2003.Station 45026 replaced station 45025 as the Oshawa site in 2005.Station 46108 replaced station 46109 as the Mississauga site in 2009.Station 46109 replaced station 46110 as the Mississauga site in 2004.Station 63203 replaced station 63200 as the Thunder Bay site in 2004.Station 71078 replaced station 71068 as the Sault Ste. Marie site in 2004.Station 77219 replaced station 77203 as the Sudbury site in 2004.
Change Over Time
B-1

Table B2: 10-Year Trend for O3 Summer Means (May - September)Summer Mean (ppb)
ID City/Town 2002 2003 2004 2005 2006 2007 2008 2009 2010 2011
12008 Windsor Downtown 33.0 32.3 26.3 35.6 32.6 36.3 34.1 30.4 34.6 33.8 ↑ 7%12016 Windsor West 32.6 32.3 29.6 35.8 31.9 33.5 32.1 29.5 31.8 31.9 ↓ 3%14064 Sarnia 35.9 31.8 26.6 34.1 32.0 34.2 33.0 28.6 34.3 32.9 → 0%15020 Grand Bend 36.8 33.6 29.8 36.3 33.5 34.9 32.4 29.7 37.8 33.9 ↓ 1%15025 London 35.3 33.9 28.5 33.9 31.2 33.2 31.6 28.4 32.5 30.7 ↓ 9%16015 Port Stanley 45.5 41.2 35.7 42.3 38.5 40.4 38.8 33.2 38.9 35.5 ↓ 16%18007 Tiverton 41.6 37.6 29.8 33.3 30.4 38.3 34.0 30.3 33.3 31.7 ↓ 16%21005 Brantford n/a INS 28.9 33.5 31.8 33.6 31.0 27.5 31.6 31.1 ↓ 3%26060 Kitchener 36.2 34.3 29.8 34.3 32.0 34.2 31.0 28.8 31.6 30.2 ↓ 14%27067 St. Catharines 33.4 31.7 28.3 33.6 32.6 33.9 31.2 27.7 32.0 31.2 ↓ 4%28028 Guelph 34.7 29.7 29.5 34.0 31.5 33.1 30.4 28.7 32.5 31.3 ↓ 4%29000 Hamilton Downtown 29.2 28.3 24.9 30.4 29.2 30.8 29.8 28.2 31.6 28.7 ↑ 7%29114 Hamilton Mountain 38.2 35.0 29.7 36.7 33.7 36.1 33.6 31.0 34.4 32.3 ↓ 9%29118 Hamilton West 27.0 26.3 22.7 25.7 25.3 26.9 26.7 23.9 27.9 26.2 ↑ 3%31103 Toronto Downtown 31.6 31.1 28.3 31.9 28.7 33.2 30.9 27.9 31.1 29.5 ↓ 3%33003 Toronto East 27.1 28.3 24.5 30.6 27.2 28.3 24.9 25.2 26.7 27.4 ↓ 4%34020 Toronto North 33.3 29.2 26.3 30.2 28.6 29.9 26.4 25.6 28.0 27.5 ↓ 13%35125 Toronto West 24.7 24.1 21.4 26.5 24.3 25.9 24.8 22.5 24.3 23.6 ↓ 1%44008 Burlington 33.4 29.0 25.1 30.2 29.2 30.0 28.3 26.7 30.2 29.2 ↓ 5%44017 Oakville 32.7 35.5 28.6 34.4 31.7 32.8 30.8 28.2 31.5 29.9 ↓ 11%45026 Oshawa INS 27.8 25.9 INS 28.0 31.5 28.3 26.4 29.5 28.5 ↑ 5%46089 Brampton 32.9 31.2 29.1 31.7 31.3 31.9 31.0 28.5 30.8 29.3 ↓ 7%46108 Mississauga 29.4 31.3 24.6 31.6 28.5 28.6 27.3 26.2 29.0 26.7 ↓ 8%47045 Barrie 31.3 25.7 27.3 30.7 28.1 28.6 30.0 25.0 27.9 26.2 ↓ 8%48006 Newmarket 38.1 34.7 32.3 36.1 33.7 36.0 32.1 30.9 34.4 30.5 ↓ 13%49005 Parry Sound 37.7 33.0 33.2 36.9 33.3 33.6 32.2 28.6 30.4 28.7 ↓ 20%49010 Dorset 34.8 29.5 28.5 33.0 29.2 30.0 27.2 25.0 25.2 23.8 ↓ 27%51001 Ottawa Downtown 30.6 29.0 23.5 27.2 26.5 28.2 24.9 24.6 26.1 25.1 ↓ 13%54012 Belleville INS 37.7 33.0 35.6 34.1 37.0 32.3 30.6 34.2 29.9 ↓ 14%56010 Morrisburg n/a n/a 29.7 30.6 30.6 31.6 27.8 26.7 29.5 27.1 ↓ 11%56051 Cornwall 30.1 31.1 26.1 31.8 29.8 31.1 27.6 27.1 29.8 26.7 ↓ 9%59006 Peterborough 37.5 34.0 30.0 36.5 27.2 30.0 31.6 29.2 32.0 29.8 ↓ 16%63203 Thunder Bay 25.0 27.3 22.7 23.6 24.7 24.6 21.3 24.2 23.9 24.2 ↓ 7%71078 Sault Ste. Marie 25.3 28.0 27.3 32.0 31.4 31.5 28.4 27.5 27.2 26.4 ↓ 1%75010 North Bay 31.2 29.8 28.4 31.0 29.0 28.5 28.3 26.5 28.4 26.3 ↓ 13%77219 Sudbury 33.2 32.0 28.7 32.4 30.1 29.5 26.0 25.7 26.3 26.9 ↓ 22%
Notes:n/a indicates pollutant not monitored.INS indicates there was insufficient data in the 2nd and/or 3rd quarter to calculate a valid annual mean.Station 44017 replaced station 44015 as the Oakville site in 2003.Station 45026 replaced station 45025 as the Oshawa site in 2005.Station 46108 replaced station 46109 as the Mississauga site in 2009.Station 46109 replaced station 46110 as the Mississauga site in 2004.Station 63203 replaced station 63200 as the Thunder Bay site in 2004.Station 71078 replaced station 71068 as the Sault Ste. Marie site in 2004.Station 77219 replaced station 77203 as the Sudbury site in 2004.
Change Over Time
B-2

Table B3: 10-Year Trend for O3 Winter Means (January-April, October-December)Winter Mean (ppb)
ID City/Town 2002 2003 2004 2005 2006 2007 2008 2009 2010 2011
12008 Windsor Downtown INS 16.4 16.0 16.5 18.8 20.3 21.7 20.8 23.2 22.5 ↑ 49%12016 Windsor West INS 16.1 17.7 18.2 18.8 19.4 21.5 21.6 22.8 22.5 ↑ 41%14064 Sarnia INS 19.6 22.0 INS 23.0 24.7 25.5 25.2 28.1 27.4 ↑ 38%15020 Grand Bend INS 28.7 22.7 29.8 26.8 29.4 30.5 29.5 33.0 32.1 ↑ 25%15025 London INS 21.8 20.0 20.4 20.7 22.8 23.7 22.8 25.0 24.2 ↑ 21%16015 Port Stanley INS 30.7 29.9 29.2 28.0 30.0 31.0 29.4 31.5 31.0 ↑ 4%18007 Tiverton INS 29.7 INS 30.7 28.2 31.5 31.7 32.3 34.1 32.2 ↑ 14%21005 Brantford INS INS 24.1 23.9 23.6 25.5 26.6 25.8 27.8 27.1 ↑ 17%26060 Kitchener INS 23.7 21.1 23.4 22.7 24.6 26.0 25.9 27.8 25.7 ↑ 22%27067 St. Catharines 22.8 20.8 20.2 20.9 21.7 24.1 24.9 24.1 25.6 25.8 ↑ 25%28028 Guelph INS 20.8 23.4 24.8 23.4 24.8 26.1 26.4 29.3 27.2 ↑ 30%29000 Hamilton Downtown INS 16.9 16.6 18.2 18.9 20.5 21.7 21.5 23.5 23.1 ↑ 45%29114 Hamilton Mountain INS 23.7 21.1 22.1 23.0 24.2 25.7 24.5 26.3 26.3 ↑ 21%29118 Hamilton West 18.6 18.9 16.6 17.9 17.8 20.1 20.9 20.4 22.1 22.7 ↑ 28%31103 Toronto Downtown 16.7 18.2 18.7 19.1 18.2 20.4 22.2 22.4 22.4 22.6 ↑ 36%33003 Toronto East 19.2 17.2 16.6 17.5 18.2 19.5 19.3 19.9 20.4 20.4 ↑ 17%34020 Toronto North 15.4 19.7 19.7 20.4 19.4 20.7 20.1 19.5 22.5 20.8 ↑ 21%35125 Toronto West 21.1 14.6 14.9 15.8 15.1 17.7 17.7 17.4 18.0 17.7 ↑ 5%44008 Burlington INS 18.5 18.1 19.3 19.3 20.7 22.5 22.3 23.9 23.5 ↑ 35%44017 Oakville 19.9 22.7 21.7 22.8 22.0 23.7 24.4 23.6 25.5 24.7 ↑ 20%45026 Oshawa 21.3 21.5 21.4 24.1 23.0 25.6 25.7 24.9 26.9 25.2 ↑ 25%46089 Brampton 18.3 20.8 22.3 23.3 21.4 23.1 23.4 22.8 25.2 23.8 ↑ 23%46108 Mississauga 22.4 20.2 18.0 17.0 18.0 19.2 22.8 22.5 23.7 22.5 ↑ 19%47045 Barrie 26.6 21.3 22.9 24.2 21.3 24.0 24.2 23.8 26.0 24.7 ↑ 5%48006 Newmarket INS 26.0 25.4 27.0 25.3 28.6 27.6 27.1 29.4 25.8 ↑ 7%49005 Parry Sound 30.3 INS 29.6 31.6 28.9 30.6 32.0 30.5 31.9 30.4 ↑ 4%49010 Dorset 21.1 29.0 29.0 31.8 28.6 30.1 30.7 29.6 31.0 29.5 ↑ 19%51001 Ottawa Downtown INS 20.8 20.4 20.7 21.4 22.0 22.2 22.6 25.5 23.6 ↑ 21%54012 Belleville INS 26.1 24.6 25.1 25.8 28.4 28.0 26.9 27.0 26.4 ↑ 8%56010 Morrisburg 25.4 INS 26.6 25.7 26.2 27.5 27.9 25.7 28.0 27.5 ↑ 8%56051 Cornwall INS 22.4 22.2 24.8 25.9 26.3 26.0 24.5 26.5 25.7 ↑ 15%59006 Peterborough INS 26.6 25.0 27.3 23.3 25.9 26.0 26.7 29.5 26.6 ↑ 8%63203 Thunder Bay 23.7 25.4 21.9 21.7 22.6 23.9 24.3 24.2 27.1 26.1 ↑ 13%71078 Sault Ste. Marie 26.6 24.7 26.8 28.9 27.5 28.6 29.3 28.4 29.3 28.9 ↑ 13%75010 North Bay INS 25.0 23.0 25.9 25.0 26.2 27.2 25.8 27.7 27.0 ↑ 13%77219 Sudbury INS 25.9 27.2 30.0 27.2 27.2 29.3 26.0 30.5 30.0 ↑ 10%
Notes:n/a indicates pollutant not monitored.INS indicates there was insufficient data in the 2nd and/or 3rd quarter to calculate a valid annual mean.Station 44017 replaced station 44015 as the Oakville site in 2003.Station 45026 replaced station 45025 as the Oshawa site in 2005.Station 46108 replaced station 46109 as the Mississauga site in 2009.Station 46109 replaced station 46110 as the Mississauga site in 2004.Station 63203 replaced station 63200 as the Thunder Bay site in 2004.Station 71078 replaced station 71068 as the Sault Ste. Marie site in 2004.Station 77219 replaced station 77203 as the Sudbury site in 2004.
Change Over Time
B-3

Table B4: 10-Year Trend for PM2.5
Annual Mean (µg/m3)
ID City/Town 2002 2003 2004 2005 2006 2007 2008 2009 2010 2011
12008 Windsor Downtown n/a 8.5 8.6 10.4 8.2 9.5 8.3 7.2 7.7 7.6 ↓ 18%12016 Windsor West n/a 9.6 9.5 10.5 9.2 9.8 8.9 7.4 7.8 7.8 ↓ 24%14064 Sarnia n/a 11.9 12.2 12.9 11.3 12.2 11.4 9.8 10.4 10.5 ↓ 18%15020 Grand Bend n/a INS 7.0 7.4 6.5 6.7 6.8 5.8 6.1 6.1 ↓ 18%15025 London n/a 7.9 7.8 8.8 6.9 6.5 6.8 5.7 INS 6.2 ↓ 30%16015 Port Stanley n/a 8.0 7.5 8.6 7.3 7.2 6.7 5.6 5.9 6.0 ↓ 31%18007 Tiverton n/a 6.5 5.8 6.6 5.6 5.6 5.0 4.0 4.5 4.7 ↓ 34%21005 Brantford n/a INS 7.5 8.9 7.6 7.7 6.8 5.8 6.5 6.6 ↓ 25%26060 Kitchener n/a 8.1 8.1 9.5 7.7 8.0 7.1 5.8 6.3 6.2 ↓ 32%27067 St. Catharines n/a 7.8 7.3 8.6 7.9 8.2 7.4 6.0 6.5 6.3 ↓ 23%28028 Guelph n/a 7.3 7.8 8.8 7.0 7.5 6.5 5.6 5.7 5.9 ↓ 31%29000 Hamilton Downtown n/a 10.6 8.9 10.0 9.1 8.9 8.3 6.8 7.7 8.1 ↓ 27%29114 Hamilton Mountain n/a 9.6 9.3 9.8 8.1 7.8 7.3 6.3 6.2 6.7 ↓ 39%29118 Hamilton West n/a INS 8.4 9.6 8.2 8.3 7.6 6.1 6.8 7.1 ↓ 28%31103 Toronto Downtown n/a 8.4 7.1 8.5 7.3 7.3 6.6 5.6 6.0 6.2 ↓ 30%33003 Toronto East n/a 8.8 7.4 8.4 7.6 7.8 6.7 5.9 6.7 6.2 ↓ 29%34020 Toronto North n/a 8.3 7.7 9.4 7.6 7.8 7.3 5.9 6.2 7.7 ↓ 22%35125 Toronto West n/a 9.8 9.8 10.0 8.2 8.4 7.5 6.1 6.5 6.9 ↓ 39%44008 Burlington n/a 8.6 7.9 9.1 7.6 7.3 6.9 5.9 6.2 6.2 ↓ 33%44017 Oakville n/a INS 8.1 8.9 7.4 7.6 6.7 5.3 5.7 6.4 ↓ 35%46089 Brampton n/a 8.2 7.7 8.9 7.2 7.4 6.8 5.6 5.8 6.0 ↓ 34%46108 Mississauga n/a 7.9 8.0 9.2 7.6 7.2 7.1 5.8 6.1 6.0 ↓ 32%47045 Barrie n/a 7.5 6.9 8.1 6.7 6.9 6.1 5.2 5.4 5.7 ↓ 31%48006 Newmarket n/a 7.3 6.4 7.7 6.4 6.6 6.0 5.1 5.6 5.5 ↓ 28%49005 Parry Sound n/a INS 5.3 6.1 5.3 5.5 4.7 3.9 4.4 4.7 ↓ 26%49010 Dorset n/a 5.9 4.7 5.8 4.5 5.0 4.5 3.6 4.0 4.1 ↓ 32%51001 Ottawa Downtown n/a 7.2 6.5 7.7 6.1 6.0 5.3 4.6 4.5 4.9 ↓ 40%54012 Belleville n/a 6.9 6.4 7.0 6.2 6.2 6.1 4.9 4.3 4.8 ↓ 35%56010 Morrisburg n/a INS 6.2 7.0 6.8 6.2 5.7 5.0 5.3 5.2 ↓ 26%56051 Cornwall n/a INS 6.8 7.6 6.5 6.4 6.1 5.4 5.7 5.7 ↓ 24%59006 Peterborough n/a 6.7 5.9 7.5 6.3 6.4 6.0 4.9 5.1 5.5 ↓ 24%63203 Thunder Bay n/a INS 4.2 4.4 4.8 4.4 4.2 3.8 4.1 4.8 ↓ 2%71078 Sault Ste. Marie n/a INS 4.5 5.4 5.2 5.3 4.4 4.0 4.1 4.4 ↓ 19%75010 North Bay n/a 5.5 4.5 5.6 4.9 5.0 4.6 3.8 3.8 4.2 ↓ 27%
Notes:Ontario standardized the PM2.5 monitoring method in 2003; therefore, data are reported from 2003 for consistency.n/a indicates pollutant not monitored.INS indicates there was insufficient data in any one quarter to calculate a valid annual mean.
Change Over Time
B-4

Table B5: 10-Year Trend for NOAnnual Mean (ppb)
ID City/Town 2002 2003 2004 2005 2006 2007 2008 2009 2010 2011
12008 Windsor Downtown 10.9 INS 10.5 7.8 7.2 6.4 5.9 5.6 4.7 4.5 ↓ 64%12016 Windsor West 13.0 INS 11.3 8.3 7.2 6.5 5.1 5.4 6.1 3.8 ↓ 71%14064 Sarnia 7.1 5.0 3.7 3.8 3.7 3.2 3.2 2.8 2.2 3.1 ↓ 62%15025 London INS INS 6.0 5.5 4.4 3.6 3.1 2.8 2.9 3.3 ↓ 56%21005 Brantford n/a INS 2.8 3.8 2.5 1.8 1.3 1.7 1.3 1.2 ↓ 70%26060 Kitchener 3.8 INS 4.9 4.4 3.5 2.7 2.5 2.1 2.5 2.0 ↓ 58%29000 Hamilton Downtown 10.4 11.7 9.6 9.9 8.0 7.7 6.5 5.8 5.0 4.8 ↓ 60%31103 Toronto Downtown 8.2 8.7 7.6 7.2 7.0 5.9 5.0 5.1 4.1 3.4 ↓ 59%33003 Toronto East 16.1 17.0 16.0 14.4 12.5 10.8 9.2 7.8 7.8 7.6 ↓ 63%34020 Toronto North 12.4 12.4 10.5 10.8 10.0 8.3 7.7 7.1 5.7 6.2 ↓ 57%35125 Toronto West n/a 30.2 26.6 26.1 20.1 17.5 16.2 13.5 13.4 12.4 ↓ 65%44008 Burlington 11.8 14.0 11.1 12.3 9.8 8.8 6.5 5.9 5.0 4.6 ↓ 69%44017 Oakville INS INS 5.3 5.2 4.3 3.9 4.0 3.5 3.6 2.7 ↓ 45%45026 Oshawa 10 9.33 8.22 INS 3.8 3.2 3.2 3.0 2.3 2.3 ↓ 90%46089 Brampton 9.1 10.4 8.7 8.9 9.1 6.0 5.8 6.5 3.7 4.6 ↓ 58%47045 Barrie 7.3 9.3 7.3 7.1 8.0 5.5 5.5 5.1 4.3 3.8 ↓ 54%48006 Newmarket 4.6 4.0 3.1 3.5 3.0 2.2 2.6 3.2 2.3 2.2 ↓ 49%51001 Ottawa Downtown INS 5.8 3.2 3.3 3.0 3.4 2.7 2.4 1.6 1.8 ↓ 67%54012 Belleville INS 6.1 5.6 4.5 3.0 3.2 3.0 1.9 2.3 2.3 ↓ 73%59006 Peterborough 3.8 3.4 n/a n/a 2.5 2.3 3.0 1.9 1.7 2.2 ↓ 50%75010 North Bay 6.7 6.4 8.8 3.7 4.4 3.5 3.8 4.2 3.4 4.0 ↓ 55%
Notes:n/a indicates pollutant not monitored.INS indicates there was insufficient data to calculate a valid annual mean.Station 44017 replaced station 44015 as the Oakville site in 2003.Station 45026 replaced station 45025 as the Oshawa site in 2005.
Change Over Time
B-5

Table B6: 10-Year Trend for NO2
Annual Mean (ppb)
ID City/Town 2002 2003 2004 2005 2006 2007 2008 2009 2010 2011
12008 Windsor Downtown 19.1 INS 18.3 16.9 17.2 17.2 15.2 14.4 15.6 14.5 ↓ 25%12016 Windsor West 19.6 INS 17.6 17.1 15.7 16.1 16.2 13.2 14.5 12.9 ↓ 32%14064 Sarnia 17.5 13.1 11.7 12.7 11.0 11.3 10.8 8.2 8.0 8.6 ↓ 50%15025 London INS INS 13.7 14.1 12.3 11.7 10.8 9.0 8.8 8.3 ↓ 44%21005 Brantford n/a INS 8.6 10.1 8.8 7.7 6.9 7.3 5.8 6.1 ↓ 39%26060 Kitchener 11.9 INS 13.1 12.9 10.8 9.7 9.0 8.6 7.7 7.7 ↓ 44%29000 Hamilton Downtown 20.9 21.3 16.8 19.3 17.0 17.0 14.7 13.6 12.7 13.5 ↓ 41%31103 Toronto Downtown 23.3 23.2 20.1 20.7 19.2 18.2 17.0 16.5 16.1 14.9 ↓ 37%33003 Toronto East 22.0 21.3 19.8 20.1 17.4 17.2 16.5 14.9 14.8 15.2 ↓ 36%34020 Toronto North 21.0 20.4 17.3 19.2 17.4 16.7 16.5 15.8 14.3 15.4 ↓ 29%35125 Toronto West n/a 26.2 24.8 26.6 22.3 22.1 20.8 19.0 20.1 19.1 ↓ 30%44008 Burlington 17.9 17.3 15.3 17.2 16.2 16.0 13.6 12.5 12.2 11.8 ↓ 35%44017 Oakville INS INS 13.5 14.5 12.5 13.0 12.0 11.1 9.2 10.3 ↓ 31%45026 Oshawa 17.2 16.2 14.2 INS 8.9 8.1 8.5 7.4 7.2 7.0 ↓ 68%46089 Brampton 16.3 17.6 16.2 16.9 15.2 13.9 13.1 13.3 10.7 11.3 ↓ 37%47045 Barrie 14.4 14.8 13.3 13.8 12.6 11.5 10.8 9.9 8.7 8.6 ↓ 44%48006 Newmarket 11.5 10.2 9.9 8.5 9.0 8.3 8.0 7.8 7.2 8.1 ↓ 33%51001 Ottawa Downtown INS 13.7 11.1 9.8 8.6 8.7 11.4 8.6 7.4 7.9 ↓ 38%54012 Belleville INS 10.5 9.4 8.2 4.5 6.4 7.3 6.0 5.5 6.3 ↓ 44%59006 Peterborough 9.8 8.3 n/a n/a 6.3 6.4 7.0 5.6 5.0 4.3 ↓ 51%75010 North Bay 10.1 10.1 9.2 6.8 7.7 7.4 7.5 8.2 7.6 7.4 ↓ 25%
Notes:n/a indicates pollutant not monitored.INS indicates there was insufficient data to calculate a valid annual mean.Station 44017 replaced station 44015 as the Oakville site in 2003.Station 45026 replaced station 45025 as the Oshawa site in 2005.
Change Over Time
B-6

Table B7: 10-Year Trend for NOX
Annual Mean (ppb)
ID City/Town 2002 2003 2004 2005 2006 2007 2008 2009 2010 2011
12008 Windsor Downtown 29.2 INS 29.3 24.9 24.4 23.6 21.1 20.0 20.2 18.9 ↓ 38%12016 Windsor West 32.5 INS 29.1 25.6 22.8 22.6 21.3 18.6 20.6 16.7 ↓ 47%14064 Sarnia 24.6 18.1 15.7 16.8 14.7 14.5 13.9 11.0 10.2 11.7 ↓ 54%15025 London INS INS 19.4 19.4 16.7 15.3 13.9 11.9 11.7 11.6 ↓ 46%21005 Brantford n/a INS 11.6 13.7 11.3 9.5 8.2 9.1 7.2 7.3 ↓ 46%26060 Kitchener 15.5 INS 18.2 17.4 14.3 12.4 11.5 10.8 10.3 9.6 ↓ 48%29000 Hamilton Downtown 31.4 33.3 27.7 30.1 24.9 24.7 21.2 19.5 17.8 18.3 ↓ 49%31103 Toronto Downtown 31.5 32.2 28.1 28.2 26.1 24.2 22.1 21.6 20.3 18.4 ↓ 43%33003 Toronto East 37.7 37.9 36.3 34.7 29.9 28.0 25.7 22.7 22.6 22.8 ↓ 47%34020 Toronto North 33.4 33.1 28.3 30.4 27.5 25.0 24.3 22.8 20.0 21.5 ↓ 40%35125 Toronto West n/a 56.9 51.2 52.4 42.4 39.6 37.0 32.5 33.5 31.5 ↓ 48%44008 Burlington 28.4 31.0 26.1 29.3 26.0 24.8 20.0 18.4 17.2 16.4 ↓ 48%44017 Oakville INS INS 18.3 19.5 16.7 16.9 16.1 14.6 12.8 13.0 ↓ 34%45026 Oshawa 27.2 25.5 22.5 INS 12.7 11.3 11.7 10.4 9.5 9.2 ↓ 76%46089 Brampton 25.1 28.1 25.0 25.9 24.2 19.9 18.9 19.9 14.4 15.9 ↓ 45%47045 Barrie 21.4 24.2 20.8 21.0 20.6 17.0 16.3 15.1 13.1 12.4 ↓ 47%48006 Newmarket 15.1 14.1 13.0 12.2 11.8 10.4 10.4 11.0 9.5 10.3 ↓ 35%51001 Ottawa Downtown INS 20.1 14.7 13.7 11.5 12.0 14.0 11.0 9.0 9.7 ↓ 48%54012 Belleville INS 15.8 14.4 12.6 7.5 9.6 10.2 7.9 7.8 8.7 ↓ 52%59006 Peterborough 13.5 11.7 n/a n/a 8.8 8.6 10.0 7.5 6.7 6.6 ↓ 51%75010 North Bay 16.5 16.4 19.0 11.2 12.1 10.9 11.3 12.4 11.0 11.5 ↓ 39%
Notes:n/a indicates pollutant not monitored.INS indicates there was insufficient data to calculate a valid annual mean.Station 44017 replaced station 44015 as the Oakville site in 2003.Station 45026 replaced station 45025 as the Oshawa site in 2005.
Change Over Time
B-7

Table B8: 10-Year Trend for CO1h Maximum (ppm)CO 1-hour AAQC is 30 ppm
ID City/Town 2002 2003 2004 2005 2006 2007 2008 2009 2010 2011
12008 Windsor Downtown 4.3 4.3 2.3 1.3 2.9 5.0 1.3 1.4 2.5 3.8 ↓ 32%15025 London 2.3 3.2 2.3 2.4 1.8 1.2 1.0 1.4 1.1 0.3 ↓ 80%29000 Hamilton Downtown 2.3 3.1 4.0 2.6 2.8 6.0 3.3 5.0 2.2 1.8 → 0%31103 Toronto Downtown 2.9 2.4 1.9 1.6 1.5 1.7 0.9 1.1 1.5 0.5 ↓ 73%35125 Toronto West n/a 3.4 2.9 2.7 3.0 1.4 1.7 1.6 1.8 1.4 ↓ 65%51001 Ottawa Downtown 2.8 2.2 2.2 2.0 1.4 1.5 1.3 1.4 1.5 1.5 ↓ 52%
Note:n/a indicates pollutant not monitored.
Table B9: 10-Year Trend for SO2
Annual Mean (ppb)SO2 1-year AAQC is 20 ppb
ID City/Town 2002 2003 2004 2005 2006 2007 2008 2009 2010 2011
12008 Windsor Downtown 5.7 5.9 4.8 4.9 5.0 5.5 4.5 3.5 3.5 3.5 ↓ 41%12016 Windsor West 7.9 6.4 4.6 5.1 4.9 5.2 4.7 3.6 3.2 3.4 ↓ 55%14064 Sarnia 10.4 7.1 8.2 7.8 8.3 8.0 7.7 4.5 3.9 5.3 ↓ 50%29000 Hamilton Downtown 4.9 5.0 4.0 5.3 4.8 4.2 4.3 3.3 3.3 5.2 ↓ 18%29114 Hamilton Mountain 4.8 5.3 n/a n/a 3.3 3.5 3.0 3.0 2.9 4.1 ↓ 37%35125 Toronto West n/a 2.9 2.7 2.3 2.0 1.5 1.4 1.2 0.9 1.5 ↓ 69%51001 Ottawa Downtown 2.9 INS 1.0 1.5 1.1 0.9 1.0 0.9 0.2 0.4 ↓ 94%71078 Sault Ste. Marie 1.7 2.0 0.9 1.5 1.4 1.8 1.2 0.6 0.7 0.8 ↓ 59%77219 Sudbury 3.1 2 INS 2.8 2.4 2.3 2.0 1.1 1.3 1.5 ↓ 54%
Notes:n/a indicates pollutant not monitored.INS indicates there was insufficient data to calculate a valid annual mean.Station 71078 replaced station 71068 as the Sault Ste. Marie site in 2004.Station 77219 replaced station 77203 as the Sudbury site in 2004.
Change Over Time
Change Over Time
B-8

C-1
Appendix C 20-Year Ozone Trends (1992-2011)
0
5
10
15
20
25
30
35
401992
1993
1994
1995
1996
1997
1998
1999
2000
2001
2002
2003
2004
2005
2006
2007
2008
2009
2010
2011
Conce
ntr
atio
n (
ppb)
Figure C1Ozone Annual Mean at Windsor Downtown
↑ 67%
0
5
10
15
20
25
30
35
40
1992
1993
1994
1995
1996
1997
1998
1999
2000
2001
2002
2003
2004
2005
2006
2007
2008
2009
2010
2011
Conce
ntr
atio
n (
ppb)
Figure C2Ozone Annual Mean at Windsor West
↑ 60%

C-2
0
5
10
15
20
25
30
35
40
1992
1993
1994
1995
1996
1997
1998
1999
2000
2001
2002
2003
2004
2005
2006
2007
2008
2009
2010
2011
Conce
ntr
atio
n (
ppb)
Figure C3Ozone Annual Mean at Sarnia
↑ 33%
0
5
10
15
20
25
30
35
40
1992
1993
1994
1995
1996
1997
1998
1999
2000
2001
2002
2003
2004
2005
2006
2007
2008
2009
2010
2011
Conce
ntr
atio
n (
ppb)
Figure C4Ozone Annual Mean at Grand Bend
↑ 3%

C-3
0
5
10
15
20
25
30
35
40
1992
1993
1994
1995
1996
1997
1998
1999
2000
2001
2002
2003
2004
2005
2006
2007
2008
2009
2010
2011
Conce
ntr
atio
n (
ppb)
Figure C5Ozone Annual Mean at London
↑ 25%
0
5
10
15
20
25
30
35
40
1992
1993
1994
1995
1996
1997
1998
1999
2000
2001
2002
2003
2004
2005
2006
2007
2008
2009
2010
2011
Conce
ntr
atio
n (
ppb)
Figure C6Ozone Annual Mean at Tiverton
↓ 1%

C-4
0
5
10
15
20
25
30
35
40
1992
1993
1994
1995
1996
1997
1998
1999
2000
2001
2002
2003
2004
2005
2006
2007
2008
2009
2010
2011
Conce
ntr
atio
n (
ppb)
Figure C7Ozone Annual Mean at Kitchener
↑ 24%
0
5
10
15
20
25
30
35
40
1992
1993
1994
1995
1996
1997
1998
1999
2000
2001
2002
2003
2004
2005
2006
2007
2008
2009
2010
2011
Conce
ntr
atio
n (
ppb)
Figure C8Ozone Annual Mean at St. Catharines
↑ 41%

C-5
0
5
10
15
20
25
30
35
40
1992
1993
1994
1995
1996
1997
1998
1999
2000
2001
2002
2003
2004
2005
2006
2007
2008
2009
2010
2011
Conce
ntr
atio
n (
ppb)
Figure C9Ozone Annual Mean at Guelph
↑ 28%
0
5
10
15
20
25
30
35
40
1992
1993
1994
1995
1996
1997
1998
1999
2000
2001
2002
2003
2004
2005
2006
2007
2008
2009
2010
2011
Conce
ntr
atio
n (
ppb)
Figure C10Ozone Annual Mean at Hamilton Downtown
↑ 66%

C-6
0
5
10
15
20
25
30
35
40
1992
1993
1994
1995
1996
1997
1998
1999
2000
2001
2002
2003
2004
2005
2006
2007
2008
2009
2010
2011
Conce
ntr
atio
n (
ppb)
Figure C11Ozone Annual Mean at Hamilton Mountain
↑ 50%
0
5
10
15
20
25
30
35
40
1992
1993
1994
1995
1996
1997
1998
1999
2000
2001
2002
2003
2004
2005
2006
2007
2008
2009
2010
2011
Conce
ntr
atio
n (
ppb)
Figure C12Ozone Annual Mean at Hamilton West
↑ 42%

C-7
0
5
10
15
20
25
30
35
40
1992
1993
1994
1995
1996
1997
1998
1999
2000
2001
2002
2003
2004
2005
2006
2007
2008
2009
2010
2011
Conce
ntr
atio
n (
ppb)
Figure C13Ozone Annual Mean at Toronto Downtown
↑ 82%
0
5
10
15
20
25
30
35
40
1992
1993
1994
1995
1996
1997
1998
1999
2000
2001
2002
2003
2004
2005
2006
2007
2008
2009
2010
2011
Conce
ntr
atio
n (
ppb)
Figure C14Ozone Annual Mean at Toronto East
↑ 38%

C-8
0
5
10
15
20
25
30
35
40
1992
1993
1994
1995
1996
1997
1998
1999
2000
2001
2002
2003
2004
2005
2006
2007
2008
2009
2010
2011
Conce
ntr
atio
n (
ppb)
Figure C15Ozone Annual Mean at Toronto North
↑ 38%
0
5
10
15
20
25
30
35
40
1992
1993
1994
1995
1996
1997
1998
1999
2000
2001
2002
2003
2004
2005
2006
2007
2008
2009
2010
2011
Conce
ntr
atio
n (
ppb)
Figure C16Ozone Annual Mean at Burlington
↑ 17%

C-9
0
5
10
15
20
25
30
35
40
1992
1993
1994
1995
1996
1997
1998
1999
2000
2001
2002
2003
2004
2005
2006
2007
2008
2009
2010
2011
Conce
ntr
atio
n (
ppb)
Figure C17Ozone Annual Mean at Oakville
↑ 42%
0
5
10
15
20
25
30
35
40
1992
1993
1994
1995
1996
1997
1998
1999
2000
2001
2002
2003
2004
2005
2006
2007
2008
2009
2010
2011
Conce
ntr
atio
n (
ppb)
Figure C18Ozone Annual Mean at Oshawa
↑ 29%

C-10
0
5
10
15
20
25
30
35
40
1992
1993
1994
1995
1996
1997
1998
1999
2000
2001
2002
2003
2004
2005
2006
2007
2008
2009
2010
2011
Conce
ntr
atio
n (
ppb)
Figure C19Ozone Annual Mean at Mississauga
↑ 46%
0
5
10
15
20
25
30
35
40
1992
1993
1994
1995
1996
1997
1998
1999
2000
2001
2002
2003
2004
2005
2006
2007
2008
2009
2010
2011
Conce
ntr
atio
n (
ppb)
Figure C20Ozone Annual Mean at Dorset
↓ 6%

C-11
0
5
10
15
20
25
30
35
40
1992
1993
1994
1995
1996
1997
1998
1999
2000
2001
2002
2003
2004
2005
2006
2007
2008
2009
2010
2011
Conce
ntr
atio
n (
ppb)
Figure C21Ozone Annual Mean at Ottawa Downtown
↑ 37%
0
5
10
15
20
25
30
35
40
1992
1993
1994
1995
1996
1997
1998
1999
2000
2001
2002
2003
2004
2005
2006
2007
2008
2009
2010
2011
Conce
ntr
atio
n (
ppb)
Figure C22Ozone Annual Mean at Cornwall
↑ 30%

C-12
0
5
10
15
20
25
30
35
40
1992
1993
1994
1995
1996
1997
1998
1999
2000
2001
2002
2003
2004
2005
2006
2007
2008
2009
2010
2011
Conce
ntr
atio
n (
ppb)
Figure C23Ozone Annual Mean at Thunder Bay
↑ 32%
0
5
10
15
20
25
30
35
40
1992
1993
1994
1995
1996
1997
1998
1999
2000
2001
2002
2003
2004
2005
2006
2007
2008
2009
2010
2011
Conce
ntr
atio
n (
ppb)
Figure C24Ozone Annual Mean at Sault Ste. Marie
↑ 33%

C-13
0
5
10
15
20
25
30
35
40
1992
1993
1994
1995
1996
1997
1998
1999
2000
2001
2002
2003
2004
2005
2006
2007
2008
2009
2010
2011
Conce
ntr
atio
n (
ppb)
Figure C25Ozone Annual Mean at North Bay
↑ 8%
0
5
10
15
20
25
30
35
40
1992
1993
1994
1995
1996
1997
1998
1999
2000
2001
2002
2003
2004
2005
2006
2007
2008
2009
2010
2011
Conce
ntr
atio
n (
ppb)
Figure C26Ozone Annual Mean at Sudbury
↑ 4%

D-1
Appendix D 20-Year NO2 Trends (1992-2011)
0
5
10
15
20
25
30
351992
1993
1994
1995
1996
1997
1998
1999
2000
2001
2002
2003
2004
2005
2006
2007
2008
2009
2010
2011
Conce
ntr
atio
n (
ppb)
Figure D1NO2 Annual Mean at Windsor Downtown
↓ 49%
0
5
10
15
20
25
30
35
1992
1993
1994
1995
1996
1997
1998
1999
2000
2001
2002
2003
2004
2005
2006
2007
2008
2009
2010
2011
Conce
ntr
atio
n (
ppb)
Figure D2NO2 Annual Mean at Sarnia
↓ 54%

D-2
0
5
10
15
20
25
30
35
1992
1993
1994
1995
1996
1997
1998
1999
2000
2001
2002
2003
2004
2005
2006
2007
2008
2009
2010
2011
Conce
ntr
atio
n (
ppb)
Figure D3NO2 Annual Mean at London
↓ 59%
0
5
10
15
20
25
30
35
1992
1993
1994
1995
1996
1997
1998
1999
2000
2001
2002
2003
2004
2005
2006
2007
2008
2009
2010
2011
Conce
ntr
atio
n (
ppb)
Figure D4NO2 Annual Mean at Kitchener
↓ 43%

D-3
0
5
10
15
20
25
30
35
1992
1993
1994
1995
1996
1997
1998
1999
2000
2001
2002
2003
2004
2005
2006
2007
2008
2009
2010
2011
Conce
ntr
atio
n (
ppb)
Figure D5NO2 Annual Mean at St. Catharines
↓ 39%
0
5
10
15
20
25
30
35
1992
1993
1994
1995
1996
1997
1998
1999
2000
2001
2002
2003
2004
2005
2006
2007
2008
2009
2010
2011
Conce
ntr
atio
n (
ppb)
Figure D6NO2 Annual Mean at Hamilton Downtown
↓ 35%

D-4
0
5
10
15
20
25
30
35
1992
1993
1994
1995
1996
1997
1998
1999
2000
2001
2002
2003
2004
2005
2006
2007
2008
2009
2010
2011
Conce
ntr
atio
n (
ppb)
Figure D7NO2 Annual Mean at Hamilton Mountain
↓ 48%
0
5
10
15
20
25
30
35
1992
1993
1994
1995
1996
1997
1998
1999
2000
2001
2002
2003
2004
2005
2006
2007
2008
2009
2010
2011
Conce
ntr
atio
n (
ppb)
Figure D8NO2 Annual Mean at Toronto Downtown
↓ 50%

D-5
0
5
10
15
20
25
30
35
1992
1993
1994
1995
1996
1997
1998
1999
2000
2001
2002
2003
2004
2005
2006
2007
2008
2009
2010
2011
Conce
ntr
atio
n (
ppb)
Figure D9NO2 Annual Mean at Toronto East
↓ 32%
0
5
10
15
20
25
30
35
1992
1993
1994
1995
1996
1997
1998
1999
2000
2001
2002
2003
2004
2005
2006
2007
2008
2009
2010
2011
Conce
ntr
atio
n (
ppb)
Figure D10NO2 Annual Mean at Toronto North
↓ 32%

D-6
0
5
10
15
20
25
30
35
1992
1993
1994
1995
1996
1997
1998
1999
2000
2001
2002
2003
2004
2005
2006
2007
2008
2009
2010
2011
Conce
ntr
atio
n (
ppb)
Figure D11NO2 Annual Mean at Burlington
↓ 35%
0
5
10
15
20
25
30
35
1992
1993
1994
1995
1996
1997
1998
1999
2000
2001
2002
2003
2004
2005
2006
2007
2008
2009
2010
2011
Conce
ntr
atio
n (
ppb)
Figure D12NO2 Annual Mean at Oakville
↓ 45%

D-7
0
5
10
15
20
25
30
35
1992
1993
1994
1995
1996
1997
1998
1999
2000
2001
2002
2003
2004
2005
2006
2007
2008
2009
2010
2011
Conce
ntr
atio
n (
ppb)
Figure D13NO2 Annual Mean at Oshawa
↓ 66%
0
5
10
15
20
25
30
35
1992
1993
1994
1995
1996
1997
1998
1999
2000
2001
2002
2003
2004
2005
2006
2007
2008
2009
2010
2011
Conce
ntr
atio
n (
ppb)
Figure D14NO2 Annual Mean at Ottawa Downtown
↓ 57%

E-1
Appendix E 20-Year SO2 Trends (1992-2011)
0
3
6
9
12
151992
1993
1994
1995
1996
1997
1998
1999
2000
2001
2002
2003
2004
2005
2006
2007
2008
2009
2010
2011
Conce
ntr
atio
n (
ppb)
Figure E1SO2 Annual Mean at Windsor West
↓ 44%
0
3
6
9
12
15
1992
1993
1994
1995
1996
1997
1998
1999
2000
2001
2002
2003
2004
2005
2006
2007
2008
2009
2010
2011
Conce
ntr
atio
n (
ppb)
Figure E2SO2 Annual Mean at Windsor West
↓ 56%

E-2
0
3
6
9
12
15
1992
1993
1994
1995
1996
1997
1998
1999
2000
2001
2002
2003
2004
2005
2006
2007
2008
2009
2010
2011
Conce
ntr
atio
n (
ppb)
Figure E3SO2 Annual Mean at Sarnia
↓ 37%
0
3
6
9
12
15
1992
1993
1994
1995
1996
1997
1998
1999
2000
2001
2002
2003
2004
2005
2006
2007
2008
2009
2010
2011
Conce
ntr
atio
n (
ppb)
Figure E4SO2 Annual Mean at Hamilton Downtown
↓ 44%

E-3
0
3
6
9
12
15
1992
1993
1994
1995
1996
1997
1998
1999
2000
2001
2002
2003
2004
2005
2006
2007
2008
2009
2010
2011
Conce
ntr
atio
n (
ppb)
Figure E5SO2 Annual Mean at Hamilton Mountain
↓ 52%
0
3
6
9
12
15
1992
1993
1994
1995
1996
1997
1998
1999
2000
2001
2002
2003
2004
2005
2006
2007
2008
2009
2010
2011
Conce
ntr
atio
n (
ppb)
Figure E6SO2 Annual Mean at Ottawa Downtown
↓ 77%

E-4
0
3
6
9
12
15
1992
1993
1994
1995
1996
1997
1998
1999
2000
2001
2002
2003
2004
2005
2006
2007
2008
2009
2010
2011
Conce
ntr
atio
n (
ppb)
Figure E7SO2 Annual Mean at Sault Ste. Marie
↓ 46%
0
3
6
9
12
15
1992
1993
1994
1995
1996
1997
1998
1999
2000
2001
2002
2003
2004
2005
2006
2007
2008
2009
2010
2011
Conce
ntr
atio
n (
ppb)
Figure E8SO2 Annual Mean at Sudbury
↓ 69%

Table F1: Summary of Smog Advisories and Smog Advisory Days (2005-2011)
Smog Advisories
Smog Advisory
Days
Smog Advisories
Smog Advisory
Days
Smog Advisories
Smog Advisory
Days
Smog Advisories
Smog Advisory
Days
Smog Advisories
Smog Advisory
Days
Smog Advisories
Smog Advisory
Days
Smog Advisories
Smog Advisory
DaysAlgonquin 5 16 1 3 1 3 0 0 1 1 0 0 0 0Bancroft-Bon Echo 7 21 1 3 4 13 2 3 2 4 1 5 0 0Barrie-Orillia-Midland 13 39 5 11 8 21 3 7 2 4 1 4 1 1Belleville-Quinte-Northumberland 13 42 5 12 9 24 4 8 2 4 2 8 1 1Brockville-Leeds and Grenville 7 24 2 5 3 5 2 4 2 4 1 2 0 0Burk’s Falls Bayfield Inlet 8 24 2 4 1 3 0 0 1 1 0 0 0 0City of Hamilton 13 45 5 11 10 31 6 13 2 4 2 8 2 2City of Ottawa 7 25 2 5 2 4 1 1 2 4 1 2 0 0City of Toronto 14 48 5 11 11 29 6 13 2 4 2 8 1 1Cornwall-Morrisburg 7 25 2 5 3 5 2 4 2 4 1 2 0 0Dufferin-Innisfil 13 44 5 11 9 27 3 7 2 4 1 5 1 1Dunnville-Caledonia-Haldimand 13 45 5 11 12 31 4 11 2 4 2 8 1 1Elgin 12 45 4 13 13 37 6 15 2 4 2 10 2 4Elliot Lake-Ranger Lake 4 12 1 3 1 3 0 0 0 0 0 0 0 0Greater Sudbury and Vicinity 7 20 2 4 1 3 0 0 1 1 0 0 0 0Grey-Bruce 10 32 4 10 9 22 1 2 2 4 2 8 1 1Haliburton 10 30 4 10 6 17 1 2 2 4 1 4 0 0Halton-Peel 14 48 5 11 11 31 6 13 2 4 2 8 1 1Huron-Perth 12 44 4 11 12 27 3 7 2 4 2 10 1 1Kingston-Prince Edward 10 32 5 12 9 23 4 8 2 4 2 8 1 1London-Middlesex 12 45 4 12 12 27 5 11 2 4 2 9 1 1Manitoulin-Northshore-Killarney 6 18 2 4 1 3 0 0 1 1 0 0 0 0Niagara 13 45 5 11 10 29 4 11 2 4 2 8 1 1North Bay-West Nipissing 7 20 2 4 1 3 0 0 1 1 0 0 0 0Oxford-Brant 13 46 5 11 12 31 4 11 2 4 2 8 1 1Parry Sound-Muskoka-Huntsville 10 30 4 10 8 21 2 5 2 4 1 4 0 0Peterborough-Kawartha Lakes 12 38 4 10 8 21 3 6 2 4 2 8 0 0Prescott and Russell 7 25 2 5 2 4 1 1 2 4 1 2 0 0Renfrew-Pembroke-Barry’s Bay 5 17 1 3 2 5 0 0 2 4 1 2 0 0Sarnia-Lambton 13 46 4 12 13 29 4 10 2 4 2 10 2 4Sault Ste. Marie-Superior East 4 10 1 3 1 3 0 0 0 0 0 0 0 0Simcoe-Delhi-Norfolk 13 46 5 11 12 31 4 11 2 4 2 10 1 1Smiths Falls-Lanark-Sharbot Lake 6 19 2 5 2 4 1 1 2 4 1 2 0 0Stirling-Tweed-South Frontenac 8 25 2 5 5 13 2 3 2 4 2 8 0 0Waterloo-Wellington 13 45 5 11 11 29 3 7 2 4 2 8 1 1Windsor-Essex-Chatham-Kent 13 46 4 14 13 38 5 12 3 5 2 10 4 8York-Durham 14 48 5 11 11 29 5 9 2 4 2 8 1 1ONTARIO 15 53 6 17 13 39 8 17 3 5 3 12 5 9
Note: A smog advisory day refers to a calendar day when a smog advisory is in effect.
201120102009
Forecast Region
F-1
2005 2006 2007 2008
