air quality study report - caltrans - california ... · pdf file30/5/2014 · this...
TRANSCRIPT
Air Quality Study Report
SR-94 Improvement Project
Jamul, California
District 11 – San Diego County – State Route 94 –
PM: 13.4-14.2; 17.1-17.6; 19.2-20.2; 20.4-21.4
May 2014

Air Quality Study Report
SR-94 Improvement Project
Jamul, California
District 11 – San Diego County – State Route 94 –
PM: 13.4-14.2; 17.1-17.6; 19.2-20.2; 20.4-21.4
Prepared By: Jeremy Louden, Principal Date: 5-30-14
Phone Number 760-473-1253
Company Name Ldn Consulting Inc.
Prepared for: California Department of Transportation District 11
4050 Taylor Street San Diego, CA 92110

Air Quality Technical Report SR 94 Improvement Project Jamul
Page i
TABLE OF CONTENTS
1.0 Summary 1
2.0 Introduction 2
2.1 Project Purpose 5 2.2 Project Description 6 2.3 Construction Activities 16
3.0 Air Pollutants 18
3.1 Carbon Monoxide (CO) 18 3.2 Ozone (O3) 18 3.3 Nitrogen Dioxide (NO2) 19 3.4 Sulfur Dioxide (SO2) 19 3.5 Lead (Pb) 19 3.6 Particulate Matter (PM) 19 3.7 Toxic Air Contaminants (TACS) 20 3.8 Asbestos 23
4.0 Applicable Standards 24
4.1 Federal and State Standards 24 4.2 Regional Authority 24
5.0 Environmental Setting 25
5.1 Environmental Setting, Climate, and Meteorology 25 5.2 Regional and Local Air Quality 25 5.3 Roadways and Traffic 28
6.0 Project Impacts 29
6.1 Long-Term Emissions 29 6.2 Local Air Quality (“Hot Spots”) 29 6.3 Construction Impacts 37
7.0 Pollution Abatement Measures 39
8.0 References 40
TABLES
Table 1 Status Of State Implementation Plan In San Diego ................................................................... 1 Table 2 Ambient Air Quality Standards ................................................................................................ 22 Table 3 Ambient Air Quality Summary – Alpine And Otay Mesa Monitoring Stations ........................ 27 Table 4 Signalized Intersection Los Analysis ........................................................................................ 32 Table 5 Estimated Future Maximum CO Concentrations .................................................................... 33
Air Quality Technical Report for the SR 94 Improvement Project Jamul
Page ii
FIGURES
Figure 1 Regional Location Map .............................................................................................................. 3 Figure 2 Project Vicinity Map .................................................................................................................. 4 Figure 3 Alternative 1 ............................................................................................................................ 10 Figure 4 Alternative 2 ............................................................................................................................ 13 Figure 5 Alternative 3 ............................................................................................................................ 15
ATTACHMENTS
1: CO Protocol Flow Chart
2: Caline4 Modeling Output
Air Quality Technical Report for the SR 94 Improvement Project Jamul
Page 1
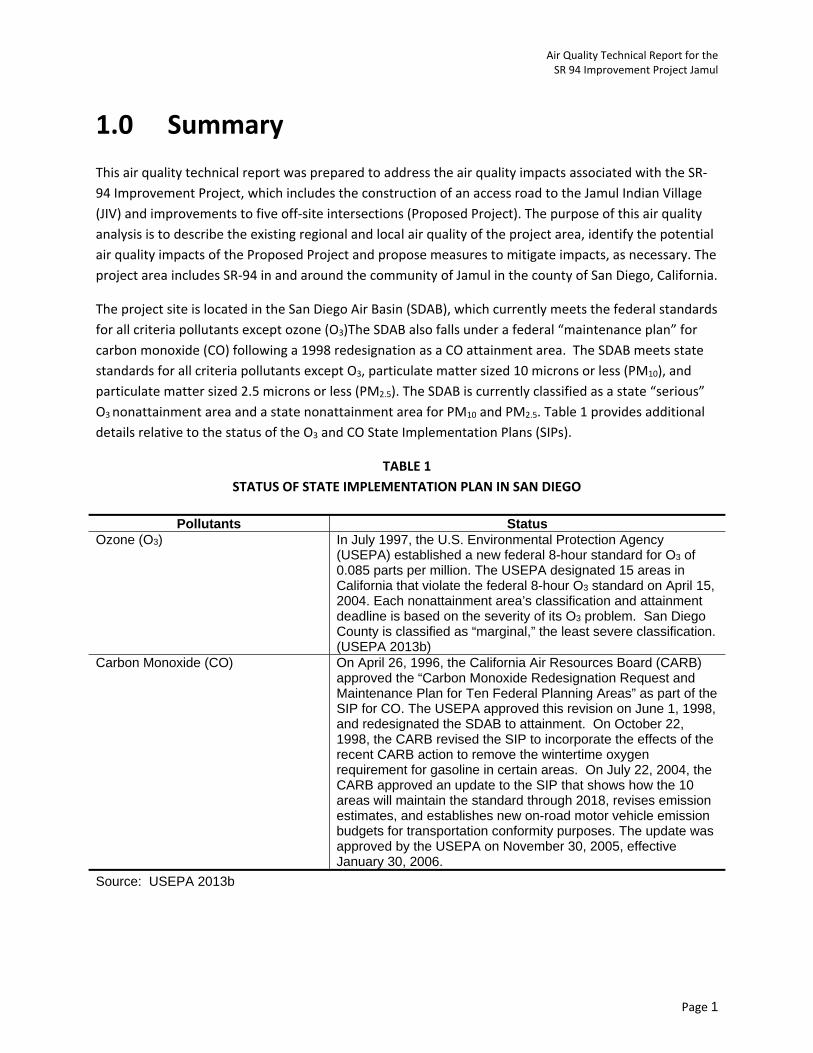
1.0 Summary
This air quality technical report was prepared to address the air quality impacts associated with the SR-94 Improvement Project, which includes the construction of an access road to the Jamul Indian Village (JIV) and improvements to five off-site intersections (Proposed Project). The purpose of this air quality analysis is to describe the existing regional and local air quality of the project area, identify the potential air quality impacts of the Proposed Project and propose measures to mitigate impacts, as necessary. The project area includes SR-94 in and around the community of Jamul in the county of San Diego, California.
The project site is located in the San Diego Air Basin (SDAB), which currently meets the federal standards for all criteria pollutants except ozone (O3)The SDAB also falls under a federal “maintenance plan” for carbon monoxide (CO) following a 1998 redesignation as a CO attainment area. The SDAB meets state standards for all criteria pollutants except O3, particulate matter sized 10 microns or less (PM10), and particulate matter sized 2.5 microns or less (PM2.5). The SDAB is currently classified as a state “serious” O3 nonattainment area and a state nonattainment area for PM10 and PM2.5. Table 1 provides additional details relative to the status of the O3 and CO State Implementation Plans (SIPs).
TABLE 1 STATUS OF STATE IMPLEMENTATION PLAN IN SAN DIEGO
Pollutants Status Ozone (O3) In July 1997, the U.S. Environmental Protection Agency
(USEPA) established a new federal 8-hour standard for O3 of 0.085 parts per million. The USEPA designated 15 areas in California that violate the federal 8-hour O3 standard on April 15, 2004. Each nonattainment area’s classification and attainment deadline is based on the severity of its O3 problem. San Diego County is classified as “marginal,” the least severe classification. (USEPA 2013b)
Carbon Monoxide (CO) On April 26, 1996, the California Air Resources Board (CARB) approved the “Carbon Monoxide Redesignation Request and Maintenance Plan for Ten Federal Planning Areas” as part of the SIP for CO. The USEPA approved this revision on June 1, 1998, and redesignated the SDAB to attainment. On October 22, 1998, the CARB revised the SIP to incorporate the effects of the recent CARB action to remove the wintertime oxygen requirement for gasoline in certain areas. On July 22, 2004, the CARB approved an update to the SIP that shows how the 10 areas will maintain the standard through 2018, revises emission estimates, and establishes new on-road motor vehicle emission budgets for transportation conformity purposes. The update was approved by the USEPA on November 30, 2005, effective January 30, 2006.
Source: USEPA 2013b
Air Quality Technical Report for the SR 94 Improvement Project Jamul
Page 2
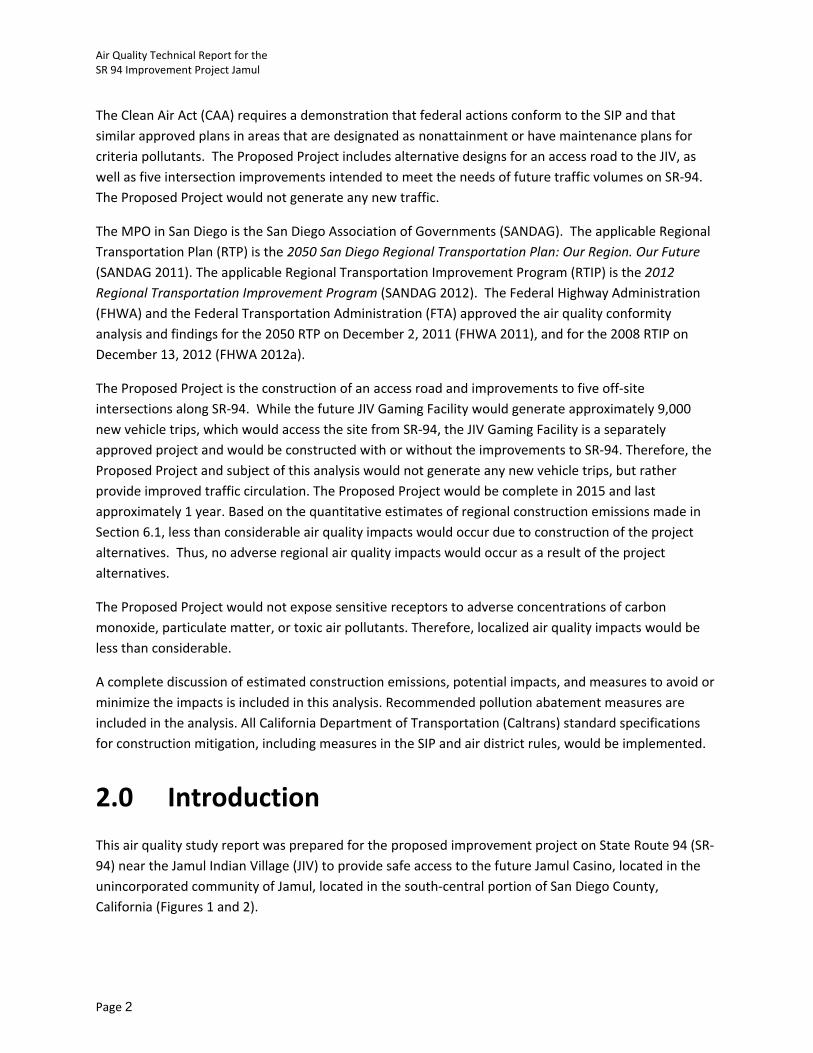
The Clean Air Act (CAA) requires a demonstration that federal actions conform to the SIP and that similar approved plans in areas that are designated as nonattainment or have maintenance plans for criteria pollutants. The Proposed Project includes alternative designs for an access road to the JIV, as well as five intersection improvements intended to meet the needs of future traffic volumes on SR-94. The Proposed Project would not generate any new traffic.
The MPO in San Diego is the San Diego Association of Governments (SANDAG). The applicable Regional Transportation Plan (RTP) is the 2050 San Diego Regional Transportation Plan: Our Region. Our Future (SANDAG 2011). The applicable Regional Transportation Improvement Program (RTIP) is the 2012 Regional Transportation Improvement Program (SANDAG 2012). The Federal Highway Administration (FHWA) and the Federal Transportation Administration (FTA) approved the air quality conformity analysis and findings for the 2050 RTP on December 2, 2011 (FHWA 2011), and for the 2008 RTIP on December 13, 2012 (FHWA 2012a).
The Proposed Project is the construction of an access road and improvements to five off-site intersections along SR-94. While the future JIV Gaming Facility would generate approximately 9,000 new vehicle trips, which would access the site from SR-94, the JIV Gaming Facility is a separately approved project and would be constructed with or without the improvements to SR-94. Therefore, the Proposed Project and subject of this analysis would not generate any new vehicle trips, but rather provide improved traffic circulation. The Proposed Project would be complete in 2015 and last approximately 1 year. Based on the quantitative estimates of regional construction emissions made in Section 6.1, less than considerable air quality impacts would occur due to construction of the project alternatives. Thus, no adverse regional air quality impacts would occur as a result of the project alternatives.
The Proposed Project would not expose sensitive receptors to adverse concentrations of carbon monoxide, particulate matter, or toxic air pollutants. Therefore, localized air quality impacts would be less than considerable.
A complete discussion of estimated construction emissions, potential impacts, and measures to avoid or minimize the impacts is included in this analysis. Recommended pollution abatement measures are included in the analysis. All California Department of Transportation (Caltrans) standard specifications for construction mitigation, including measures in the SIP and air district rules, would be implemented.
2.0 Introduction
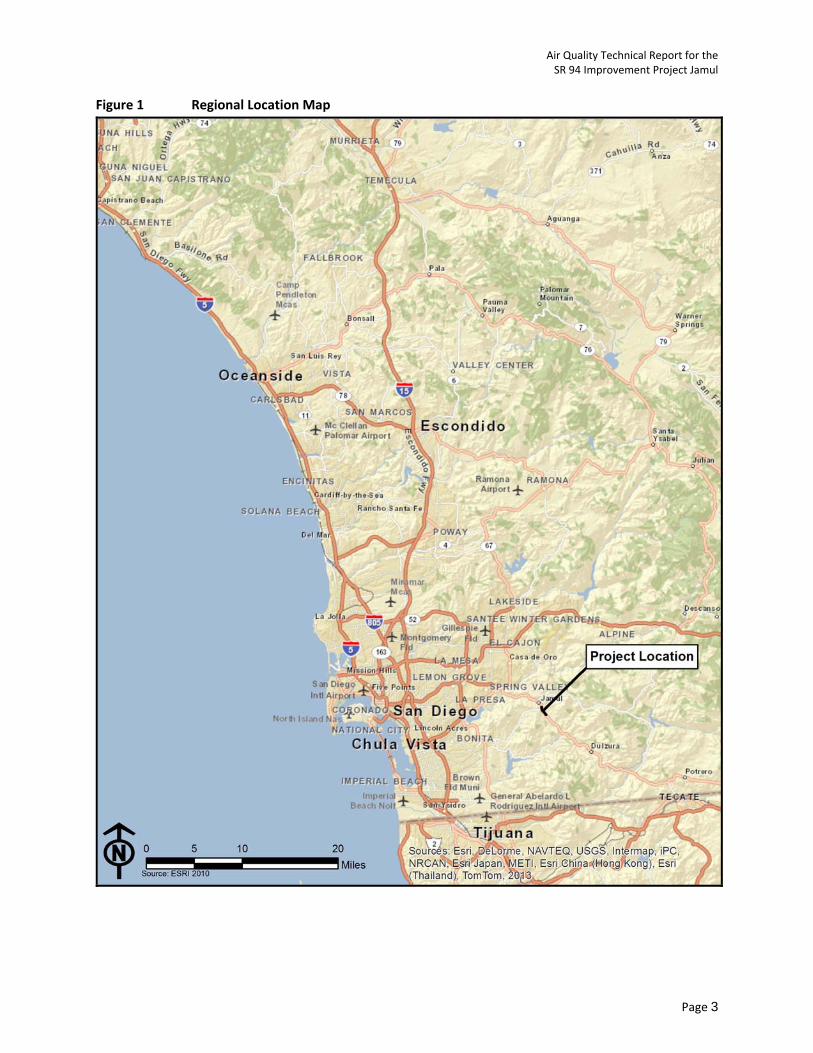
This air quality study report was prepared for the proposed improvement project on State Route 94 (SR-94) near the Jamul Indian Village (JIV) to provide safe access to the future Jamul Casino, located in the unincorporated community of Jamul, located in the south-central portion of San Diego County, California (Figures 1 and 2).
Air Quality Technical Report for the SR 94 Improvement Project Jamul
Page 3
Figure 1 Regional Location Map
Air Quality Technical Report for the SR 94 Improvement Project Jamul
Page 4
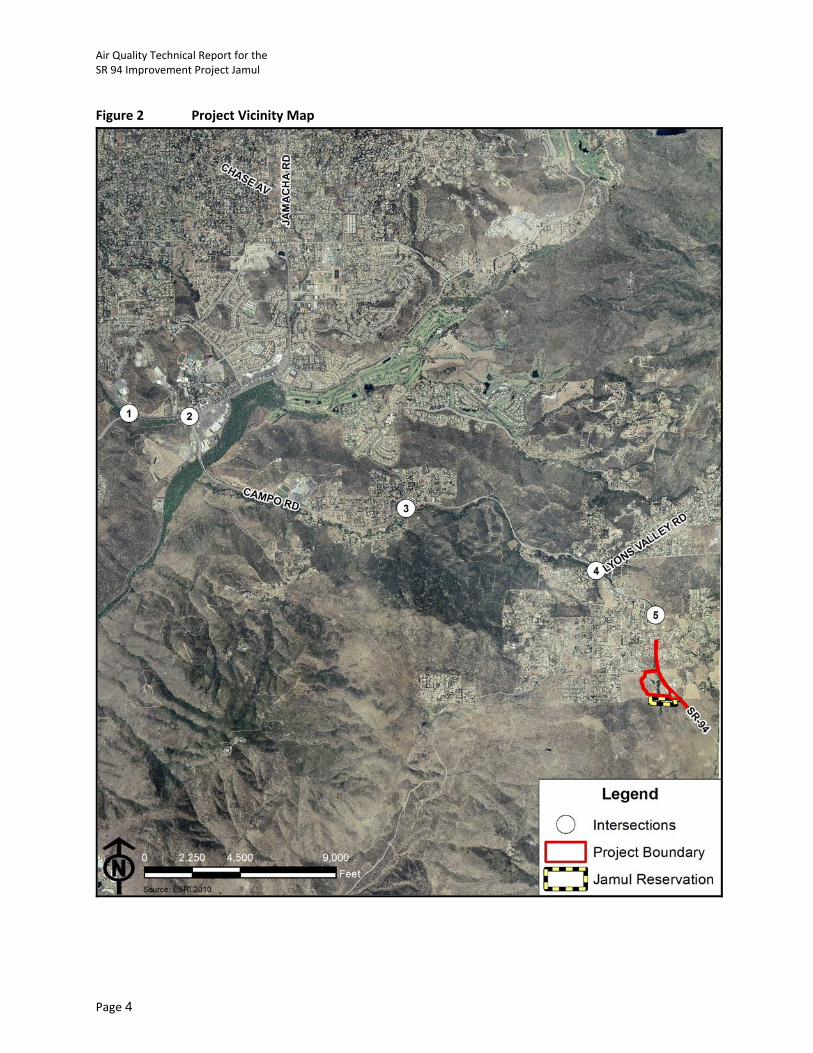
Figure 2 Project Vicinity Map
Air Quality Technical Report for the SR 94 Improvement Project Jamul
Page 5
The purpose of this air quality study is to describe the existing regional and local air quality of the project area; identify the potential air quality impacts of the project alternatives; and as necessary, identify methods to reduce potential emissions to comply with state and national ambient air quality standards.
2.1 Project Purpose
The primary objectives of the Proposed Project are to accomplish the following:
Reduce congestion and delay, and improve Level of Service (LOS) along SR-94 in the vicinity of Melody Road and Reservation Road;
Improve the geometric design of the main access between SR-94 and the Jamul Indian Village; and
Improve the geometrics of SR-94 in the vicinity of Melody Road and Reservation Road in a manner consistent with the SR-94 Transportation Concept Summary (TCS) and the 2050 Regional Transportation Plan (RTP).
Traffic volumes on SR-94 are projected to increase from 10,600 average daily trips (ADT) north of Melody Road and 7,500 ADT south of Melody Road in 2010 (existing conditions) to 17,000 ADT north of Melody Road, and 13,000 ADT south of Melody Road in 2035. Per the SR-94 Improvement Traffic Impact Study prepared for the Project (Kimley-Horn 2013), the LOS of SR-94 north and south of Melody Road, as well as the peak hour LOS at the SR-94/Melody Intersection, are projected to degrade to unacceptable LOS producing congestion and excessive delays. In addition, unacceptable LOS would also result from the JIV Gaming Project at the five off-site intersections addressed in this assessment: (1) SR-94/Jamacha Boulevard, (2) SR-94/Jamacha Road, (3) SR-94/Steele Canyon Road, (4) SR-94/Lyons Valley Road and (5) SR-94/Maxfield Road.
The Final Tribal Environmental Evaluation (Final EE) prepared for the JIV Gaming Project, which serves as the basis for this air quality assessment, indicates the existing geometric design of the SR-94/Reservation Road connection is inadequate as a main access to the JIV. The angle of intersection, horizontal alignment, shoulder width, and corner sight distance are all non-standard. The SR-94 Rural TCS identified portions of SR-94 south of Melody Road as potentially hazardous due to existing highway geometrics and terrain. Realignment of deficient curves, widening of the traveled way, installation of standard 8-foot shoulders, addition of passing lanes, and adding/improving turn pockets are included as types of improvements. The 2050 RTP unconstrained scenario includes upgrading SR-94 from a 2-lane conventional highway to a 4-lane conventional highway north of Melody Road.
Air Quality Technical Report for the SR 94 Improvement Project Jamul
Page 6
2.2 Project Description
The Jamul Indian Village (JIV) is proposing to construct signalized driveway access to their separately and independently approved future gaming facility and also to improve five intersection locations along State Route 94 (SR-94), as a result of traffic generate from the operation of their future gaming facility. The California Department of Transportation (Caltrans) is required to review encroachments on State right of way and anticipates the JIV to apply for one or more encroachment permits to perform the proposed construction. In conjunction with the proposed improvements and impact to State right of way, the requirements of the California Environmental Quality Act (CEQA) must be met before the issuance of a future encroachment permit. With Caltrans’ oversight, the JIV is preparing the necessary environmental and engineering technical studies and will prepare an Environmental Impact Report (EIR) on Caltrans’ behalf under CEQA and Caltrans guidelines to address the potential impacts from the proposed access alternatives and five intersection improvement locations. Caltrans will be the lead agency on the EIR and will independently review the EIR to ensure that the EIR meets CEQA requirements. The JIV is located approximately 1-mile south of Jamul, California (Figures A-1 and A-2, in Attachment 1) (Mile Post# 20.4/21.4).
The JIV is proposing three alternatives to access the future gaming facility adjacent to their property along SR-94. In addition, improvements to five intersections along SR-94 west of the future gaming facility will be a project feature of each of the three proposed access road alternatives. These access alternatives are proposed at the following locations: (1) the existing “Reservation Road”, which connects the JIV property to SR-94, (2) an adjacent 4-acre parcel (north of the JIV property), which is currently owned by the JIV “known as Daisy Drive”, or (3) via a new roadway constructed from Melody Road south to the JIV property. Under the Daisy Drive access alternative, there are three potential build options which are described in more detail below. The third access alternative at Melody Road would connect off of the County of San Diego’s property. This access alternative would still require improvements to SR-94 resulting in the need for an encroachment permit from Caltrans. In addition to the driveway access alternatives and the five intersection improvements a No Build alternative will be under consideration. Below is a breakdown of the proposed improvement alternatives:
Access Alternative 1: Reservation Road Access,
Access Alternative 2: Daisy Drive Access,
Option 1: Full Disturbed Area
Option 2: Reduced Disturbed Area
Option 3: Minimum Disturbed Area
Access Alternative 3: Melody Road Access, and
Air Quality Technical Report for the SR 94 Improvement Project Jamul
Page 7
Alternative 4: No Build Alternative.
The various options under Alternative 2 differ in the amount of additional right of way (ROW) needed to be incorporated into the project improvements. Each of the access alternatives are described in detail below in Section 1.2 Alternatives.
In addition to the access road improvements, the JIV also proposes to improve five intersections along SR-94 to address anticipated traffic generated from their future gaming facility. The intersections to be improved include:
1. SR-94/Jamacha Boulevard Intersection,
2. SR-94/Jamacha Road Intersection,
3. SR-94/Steele Canyon Road Intersection,
4. SR-94/Lyons Valley Road Intersection, and
5. SR-94/Maxfield Road Intersection.
Proposed improvements for these intersections would range from signalization to restriping to providing an additional through/turn lane. Details related to intersection improvements are provided below in Section 1.2 Alternatives. The 3 access alternatives, No Build alternative and five on system intersection improvements will be evaluated in the CEQA EIR upon completion of the necessary technical studies.
Alternatives
The JIV is proposing three build alternatives adjacent to their property along SR-94 to access the future
gaming facility. In addition to the access road improvements, the JIV also proposes to improve five
intersections along SR-94 to address anticipated traffic generated from their future gaming facility. The
five intersection improvements will be a project feature of all the access road alternatives. The
intersections to be improved include:
1. SR-94/Jamacha Boulevard Intersection: Restripe the northbound left-turn lane to a through shared-left-turn lane and the northbound through-shared-left turn lane as a second right-turn lane (including required traffic signal modifications). The proposed improvements would affect Jamacha
Boulevard, which is within the County.
2. SR-94/Jamacha Road Intersection: Add a second eastbound right-turn lane and retaining wall
(including required traffic signal modifications). The right-turn lane would extend beyond the existing
Caltrans ROW. Reconstruct the northbound median to provide additional left-turn storage capacity for the northbound left-turn movement. The median would be reduced to provide additional storage while maintaining the left-turn storage for southbound left-turns into Rancho San Diego Town Center. Construct a vegetated bioswale on the north side of the SR-94, west of the Campo Road intersection, to treat stormwater runoff. Treatment works by filtration removal of pollutants
Air Quality Technical Report for the SR 94 Improvement Project Jamul
Page 8
through vegetative uptake and soil filtration. Runoff will enter the bioswale by curb cuts along the north side of SR-94.
3. SR-94/Steele Canyon Road Intersection: Add a second eastbound and westbound through lane
(including required traffic signal modification). Two of the approaches are within the County ROW. Three vegetated bioswales will be constructed to treat the stormwater runoff from the proposed improvements. One is located on the west bound side, west of Steele Canyon Road. Two are proposed on the east bound side, east and west of Steele Canyon Road. Treatment works by filtration removal of pollutants through vegetative uptake and soil filtration. Runoff will enter the bioswale by curb cuts along the north side of SR-94.
4. SR-94/Lyons Valley Road Intersection: Install a traffic signal. Traffic signal equipment, such as
detection system, conduits and pullboxes would have to be installed within the County's ROW.
5. SR-94/Maxfield Road Intersection: Restripe the northbound approaches along SR-94 to include
an acceleration lane. This improvement will also include the widening of SR-94 north of Maxfield Road
necessary to accommodate additional acceleration lane. Re-grade the existing hillside on the west side of SR-94, north of the Maxfield Road intersection, to provide additional sight distance for motorists. The grading limits will encompass approximately 1-acre of area and will include a vegetated 2-to-1 slope and retaining wall along the existing Caltrans ROW. The retaining wall will be approximately 340-feet in length at an average height of 10-feet. Lastly, construct two vegetated bioswales on the west side of SR-94, north of the Maxfield intersection, to treat stormwater runoff by removing pollutants by filtration through vegetative uptake and soil filtration. Runoff will enter the bioswale by curb cuts along SR-94.
2.2.1 Alternative 1 – Realigned Reservation Road Access and Five Off-Site Intersections
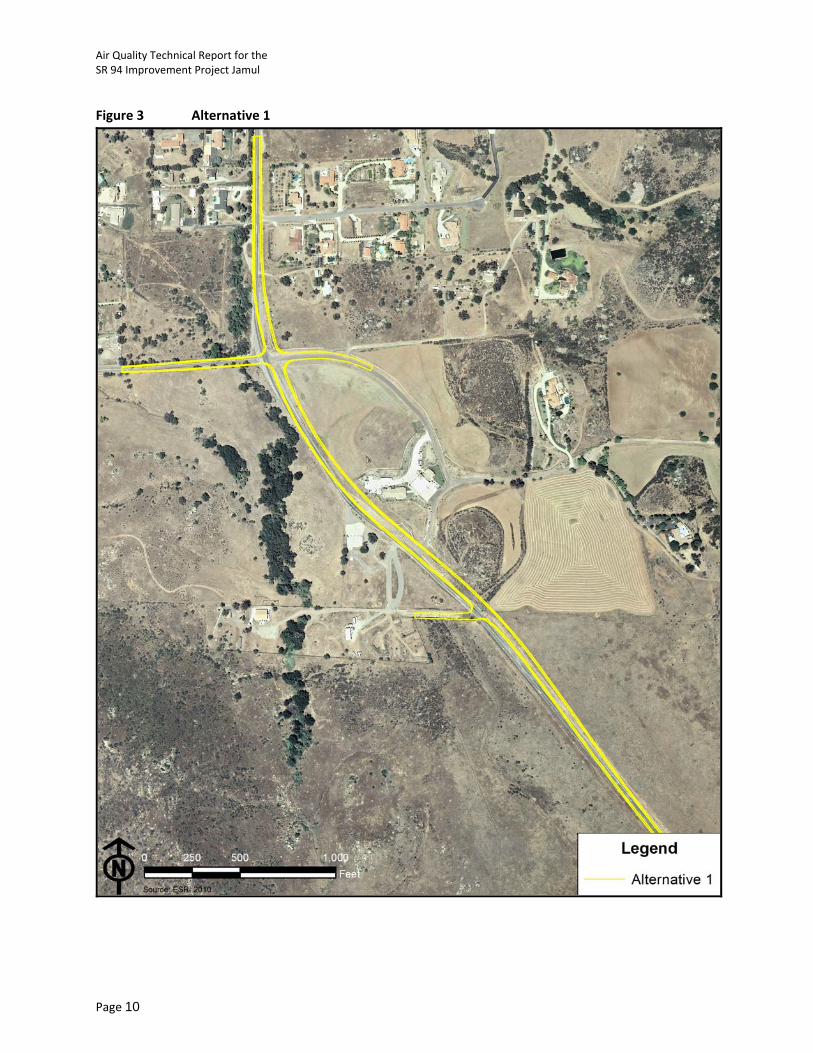
Alternative 1 (Figures 3) proposes improvements to SR-94 from approximately 1,200 feet north of Melody Road to approximately 1,800 feet south of Reservation Road, for a total length of approximately 0.9 miles. The alignment of SR-94 is realigned to provide flatter horizontal and vertical curvature, as well as pavement cross slope and superelevation meeting current design standards. Lanes and shoulders are widened where necessary to also meet current standards.
New traffic signals would be installed for Alternative 1 at the intersection of SR-94/Melody Road, and also at the intersection of SR-94/Reservation Road, which is the proposed JIV access location for Alternative 1. Exclusive left-turn lanes would be provided along SR-94 for the north to west move onto Melody Road, and the south to east move onto Peaceful Valley Ranch Road. Likewise, an exclusive left-turn lane would be provided for the north to west move onto Reservation Road. In addition, a second southbound through lane would be provided along SR-94 between Melody Road and Reservation Road. Alternative 1 also widens Melody Road and Peaceful Valley Ranch Road to provide exclusive left-turn
Air Quality Technical Report for the SR 94 Improvement Project Jamul
Page 9
lanes onto SR-94 for overall improved intersection operation. The length of improvements along Melody Road and Peaceful Valley Ranch Road are approximately 700 feet and 500 feet, respectively. The intersection of SR-94/Reservation Road is also reconfigured with Alternative 1 to provide an intersection angle which meets current design standards. Retaining walls are proposed for Alternative 1 in order to minimize ROW requirements and environmental impacts. The five previously stated SR-94 intersection improvements apply to Alternative 1.
Air Quality Technical Report for the SR 94 Improvement Project Jamul
Page 10
Figure 3 Alternative 1
Air Quality Technical Report for the SR 94 Improvement Project Jamul
Page 11
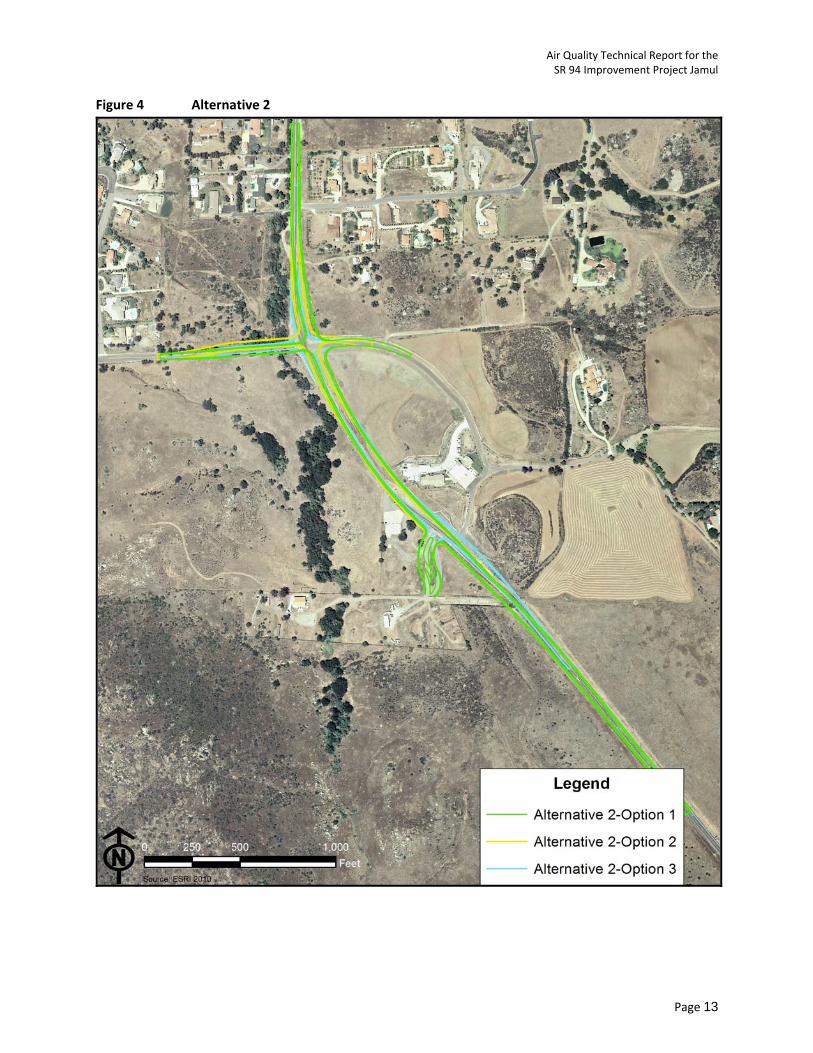
2.2.2 Alternative 2 – Daisy Drive Access
Alternative 2 (Figure 4) proposes improvements along SR-94 from an area north of Melody Road to an area south of the JIV property. Three options using the same entrance are addressed under Alternative 2. While maintaining the same entrance, each of these options contains separate ROW requirements. The JIV access driveway for Alternative 2 is located approximately 500 feet north of existing Reservation Road, at “Daisy Drive.” Locating the access point at Daisy Drive decreases the intersection spacing to Melody Road, but shortens the project limits at the southern end. The Alternative 2 realignment of SR-94 maintains an alignment on the west side of existing SR-94, south of Daisy Drive, which results in one less horizontal curve along SR-94 within the project limits.
Alternative 2: Option 1 (Full Disturbed Area)
Option 1 proposes to improve SR-94 from approximately 1,200 feet north of Melody Road to approximately 1,400 feet south of existing Reservation Road, for a total length of approximately 0.8 miles. Similar to Alternative 1, SR-94 is realigned and widened as part of Option 1 to improve traffic operations. No design exceptions are needed for Option 1.
Proposed traffic signals and exclusive left-turn lanes for Alternative 2: Option 1 are the same as for Alternative 1, except the traffic signal for access to the JIV Gaming Project is provided at Daisy Drive instead of Reservation Road. In Addition, Option 1 would provide an additional northbound lane along SR-94 between Daisy Drive and Peaceful Valley Ranch Road to accommodate the expected dual left-turn lanes departing from the access driveway at Daisy Drive. Improvements to Melody Road and Peaceful Valley Ranch Road are the same for Alternatives 1 and 2: Option 1. Retaining walls associated with Alternative 2: Option 1 are reduced when compared to Alternative 1. The five previously stated SR-94 intersection improvements apply to Alternative 2: Option 1.
Alternative 2: Option 2 (Reduced Disturbed Area)
Option 2 proposes to improve SR-94 from about 1200 feet north of Melody Road to about 1400 feet south of existing Reservation Road, for a total length of approximately 0.8 miles. The project limits north and south along SR-94 are the same as stated for Alternative 2: Option 1. Alternative 2: Option 2 differs from Option 1 in that ROW impacts are reduced within private property and environmentally sensitive areas. The Option 2 centerline alignment for SR-94 is shifted to the west through the intersection with Melody Road with the use of a reduced radius, and a broken-back curve (two curves with a short tangent deflecting in the same direction) is introduced between Melody Road and the proposed access driveway at Daisy Drive. The introduction of a reduced radius and broken-back horizontal curvature helps facilitate the reduced ROW impact associated with Option 2.
Proposed traffic signals and left-turn lanes are the same as stated for Alternative 2: Option 1, with the exception that no exclusive left-turn lane is proposed on the departure from Peaceful Valley Ranch Road for Option 2. In addition, the alignment for Melody Road, as well as for Peaceful Valley Ranch Road, is
Air Quality Technical Report for the SR 94 Improvement Project Jamul
Page 12
shifted to the north with Option 2 to further reduce ROW impact to environmentally sensitive areas. Alternative 2: Option 2 requires various retaining walls and fill walls to reduce the proposed footprint. The five previously discussed SR-94 intersection improvements apply to Alternative 2: Option 2.
Alternative 2: Option 3 (Minimum Disturbed Area)
Option 3 proposes to provide access to the JIV Gaming Project via Daisy Drive, the same as for Alternatives 2: Options 1 and 2. Alternative 2: Option 3, however, minimizes ROW impacts with the implementation of non-standard geometric elements requiring mandatory exceptions to Caltrans design standards. Reduced design speed from 55 mph to 45 mph, reduction in horizontal curvature, reduced shoulder width, reduced stopping sight distance along vertical curvature, increased maximum grade, and reduced superelevation rate are all incorporated to minimize impacts to ROW.
Improvements for Alternative 2: Option 3 begin approximately 800 feet north of Melody Road and continue to about 400 feet south of existing Reservation Road, for a total length of approximately 0.6 miles. Proposed traffic signals and exclusive left-turn lanes are the same for Options 2 and 3, except no left-turn is provided on the departure from Peaceful Valley Ranch Road. Lane widths are reduced along Melody Road in order to accommodate the roadway widening while minimizing ROW impacts. Unlike Alternative 2: Option2 which realigned Melody Road to the south, Alternative 2: Option 3 retains the existing southern edge of traveled way and widens Melody Road to the north. One fill-wall and three cut-walls are proposed along SR-94 for Option 3. No walls are proposed along Melody Road. The five previously discussed SR-94 intersection improvements apply to Alternative 2: Option 3.
Air Quality Technical Report for the SR 94 Improvement Project Jamul
Page 13
Figure 4 Alternative 2
Air Quality Technical Report for the SR 94 Improvement Project Jamul
Page 14
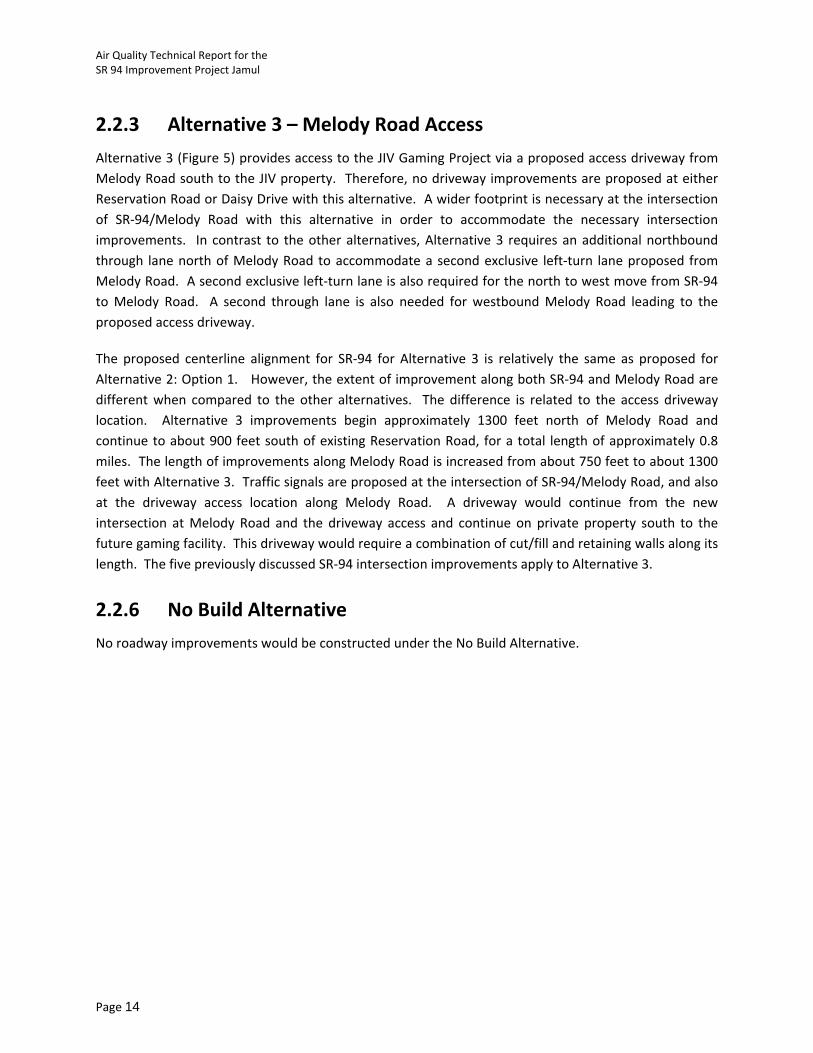
2.2.3 Alternative 3 – Melody Road Access
Alternative 3 (Figure 5) provides access to the JIV Gaming Project via a proposed access driveway from Melody Road south to the JIV property. Therefore, no driveway improvements are proposed at either Reservation Road or Daisy Drive with this alternative. A wider footprint is necessary at the intersection of SR-94/Melody Road with this alternative in order to accommodate the necessary intersection improvements. In contrast to the other alternatives, Alternative 3 requires an additional northbound through lane north of Melody Road to accommodate a second exclusive left-turn lane proposed from Melody Road. A second exclusive left-turn lane is also required for the north to west move from SR-94 to Melody Road. A second through lane is also needed for westbound Melody Road leading to the proposed access driveway.
The proposed centerline alignment for SR-94 for Alternative 3 is relatively the same as proposed for Alternative 2: Option 1. However, the extent of improvement along both SR-94 and Melody Road are different when compared to the other alternatives. The difference is related to the access driveway location. Alternative 3 improvements begin approximately 1300 feet north of Melody Road and continue to about 900 feet south of existing Reservation Road, for a total length of approximately 0.8 miles. The length of improvements along Melody Road is increased from about 750 feet to about 1300 feet with Alternative 3. Traffic signals are proposed at the intersection of SR-94/Melody Road, and also at the driveway access location along Melody Road. A driveway would continue from the new intersection at Melody Road and the driveway access and continue on private property south to the future gaming facility. This driveway would require a combination of cut/fill and retaining walls along its length. The five previously discussed SR-94 intersection improvements apply to Alternative 3.
2.2.6 No Build Alternative
No roadway improvements would be constructed under the No Build Alternative.
Air Quality Technical Report for the SR 94 Improvement Project Jamul
Page 15
Figure 5 Alternative 3
Air Quality Technical Report for the SR 94 Improvement Project Jamul
Page 16
2.3 Construction Activities
2.3.1 Roadway Improvements
While the precise level of construction activity, i.e. equipment, manpower, and time to completion is not currently known, past experience with similar projects allows certain assumptions to be made. Manpower and other job needs would be at the discretion of the contractor. Construction activity is expected to be completed within a 12 month period, depending on weather conditions. With limited exceptions, most construction activities would be completed during daylight hours.
Heavy equipment would include an earthmover/large D-8 dozer, one or two graders, one or two backhoes, a water truck, as many as four asphalt/concrete trucks, one to two paving machines and two roller compactors. Approximately 8-10 workers are anticipated to be on site at any one time to complete the construction work; workers would be divided up into work crews or gangs doing paving, excavating, clearing/grubbing and other targeted activities. Electrical, telephone, and water/wastewater crews would be onsite as necessary throughout the duration of construction activities.
Staging Areas
Two staging areas located adjacent to the project site are viable for staging; the first is the 10-acre parcel (currently optioned by the JIV) located at the northwest corner of SR-94 and Melody Road, while the second is the 4-acre triangular parcel owned by the JIV directly adjacent to the JIV land. In order to make the site as safe as possible, the staging areas would be surrounded by chain-link fencing and illuminated at night to discourage theft or vandalism. Due to the short duration that the land would be occupied, no grading or other alteration of the topography would take place, nor would any trees or other natural features be disturbed or altered. Any topsoil that is disturbed during construction activities will be reseeded with native grasses after the work is completed so that visually and otherwise, the site will be identical to pre-construction conditions.
Construction Phases
Construction would be done is three predominant phases. Phase 1 would include the implementation of a Traffic Management Plan (TMP), which would include, among other things, installation of temporary lanes to carry traffic uninterrupted during the balance of the project. Phase 2 involves the installation and/or relocation of all infrastructure, both underground and surface level, including electrical, water and wastewater, and other third-tier utilities. The cabling and powering up for new traffic signals and streetlights would also be addressed during this phase. New expanded culverts and the construction of retaining walls would take place during Phase 2, as well as compaction activities to prepare the new road base for widened lanes and new driveways. Phase 3 involves the laying of new pavement and/or concrete for all new travel lanes, turn lanes, and shoulders. Extruded concrete curbs would also be installed during Phase 3. Finally, finishing work, including striping, the installation of top features (light standards and other lighting devices), and landscaping would be completed during Phase 3.
Air Quality Technical Report for the SR 94 Improvement Project Jamul
Page 17
Construction Control Measures
A final TMP would be developed by the general contractor prior to the start of construction activities. The TMP would outline project elements including maintaining public access during construction, coordinating with private property owners where private driveways are involved (maintaining private property access via temporary access ways, etc.), and notifying the driving public of information about construction activities. Specific elements of the plan are noted below, but the list is not all-inclusive.
Create a public noticing and awareness campaign,
Determine the appropriate placement of signs, barricades, and other safety devices, and
Develop traffic contingency plans to account for weather, traffic collisions, or other emergency situations, including detours to keep traffic moving and construction progressing during unexpected or unanticipated events.
2.3.2 Intersection Improvements
Construction equipment would vary depending on the various activities required for each intersection. It is estimated that construction activity could be as long as 2 months for Intersections 2 (SR-94/Jamacha Road) and 3 (SR-94/Steele Canyon Road), to as little as 1-month for the remainder. Construction activities would be completed during daylight hours.
Heavy equipment would include one grader, one backhoe, a water truck, an asphalt truck, one paving machine and a roller compactor. Approximately 3-5 workers are anticipated to be on site at any one time to complete the construction work; workers would be divided up into work crews or gangs doing paving, excavating, clearing/grubbing and other targeted activities. Electrical, telephone, and water/wastewater crews would be onsite as necessary throughout the duration of construction activities.
Staging Areas
Staging areas would be located immediately adjacent to the construction site situated away from drainage areas, sensitive habitat and steep slopes.
Construction Phases
Although not as substantial as identified for the access road, construction phasing for the intersection improvements would be similar to those identified for the access road.
Construction Control Measures
The construction control measures would be the same for the intersections as identified for the access road.
Air Quality Technical Report for the SR 94 Improvement Project Jamul
Page 18
3.0 Air Pollutants
“Air Pollution” is a general term that refers to one or more chemical substances that degrade the quality of the atmosphere. Individual air pollutants may adversely affect human or animal health, reduce visibility, damage property, and reduce the productivity or vigor of crops and natural vegetation.
Air quality at a particular location is a function of the kinds, amounts, and dispersal rates of pollutants being emitted into the air locally and throughout an air basin. The major factors affecting air pollutant dispersion are wind speed and direction, the vertical dispersion of pollutants, and the local topography. Air quality issues arise when the rate of pollutant emissions exceeds the rate of dispersion. Air quality in California is commonly expressed as the number of days in which air pollution levels exceed standards set by the California Air Resources Board (CARB) and the U.S. Environmental Protection Agency (USEPA).
The Clean Air Act (CAA) requires the USEPA to set ambient air quality standards (AAQS) for six common pollutants, known as criteria pollutants. The pollutants regulated as criteria pollutants are: O3, CO, sulfur dioxide (SO2), nitrogen dioxide (NO2), lead (Pb), and respirable particulate matter (PM10 and PM2.5) (USEPA 2013a).
In addition to the criteria pollutants, toxic air contaminants (TACs), asbestos, and greenhouse gases are air pollutants of concern.
3.1 Carbon Monoxide (CO)
CO is a colorless and odorless gas which, in the urban environment, is associated primarily with the incomplete combustion of fossil fuels in motor vehicles. Relatively high concentrations are typically found near crowded intersections and along heavily used roadways carrying slow-moving traffic. Even under the severest meteorological and traffic conditions, high concentrations of CO are limited to locations within a relatively short distance (300 to 600 feet) of heavily traveled roadways. Overall, CO emissions are decreasing as a result of the Federal Motor Vehicle Control Program, which has mandated increasingly lower emission levels for vehicles manufactured since 1973 (USEPA 2013a). CO concentrations are typically higher in winter. As a result, California has required the use of oxygenated gasoline in the winter months to reduce CO emissions.
3.2 Ozone (O3)
O3 is the principal component of smog and is formed in the atmosphere through a series of reactions involving reactive organic gases (ROG) and oxides of nitrogen (NOX) in the presence of sunlight (USEPA 2013a). ROG and NOX are called precursors of O3. NOX includes various combinations of nitrogen and oxygen, including nitrogen oxide (NO), nitrogen dioxide (NO2), nitrogen trioxide (NO3), etc. O3 is a principal cause of lung and eye irritation in the urban environment. Significant O3 concentrations are normally produced in the summer, when atmospheric inversions are greatest and temperatures are
Air Quality Technical Report for the SR 94 Improvement Project Jamul
Page 19
high. ROG and NOX emissions are both considered critical in O3 formation. Control strategies for O3 have focused on reducing emissions from vehicles, industrial processes using solvents and coatings, and consumer products.
3.3 Nitrogen Dioxide (NO2)
NO2 is a product of combustion and is generated in vehicles and in stationary sources such as power plants and boilers. NO2 can cause lung damage. As noted above, NO2 is part of the NOX group and is a principal contributor to O3 and smog (USEPA 2013a).
3.4 Sulfur Dioxide (SO2)
SO2 is a combustion product, with the primary source being power plants and heavy industries that use coal or oil as fuel. SO2 is also a product of diesel engine combustion (USEPA 2013a). The health effects of SO2 include lung disease and breathing problems for asthmatics. SO2 in the atmosphere contributes to the formation of acid rain. In the SDAB, there is relatively little use of coal and oil; therefore, SO2 is of lesser concern than in many other parts of the country.
3.5 Lead (Pb)
Pb is a stable compound that persists and accumulates both in the environment and in animals. Previously, the Pb used in gasoline anti-knock additives represented a major source of Pb emissions to the atmosphere. The USEPA began working to reduce Pb emissions soon after its inception, issuing the first reduction standards in 1973, which called for a gradual phase down of Pb to one-tenth of a gram per gallon by 1986. The average Pb content in gasoline in 1973 was 2 to 3 grams per gallon, or about 200,000 tons of Pb a year. In 1975, passenger cars and light trucks were manufactured with a more elaborate emission control system, which included a catalytic converter that required lead-free fuel. In 1995 leaded fuel accounted for only 0.6 percent of total gasoline sales and less than 2,000 tons of Pb per year. Effective January 1, 1996, the CAA banned the sale of the small amount of leaded fuel that was still available in some parts of the country for use in on-road vehicles (USEPA 1996). Pb emissions have significantly decreased due to the near elimination of the use of leaded gasoline.
3.6 Particulate Matter (PM)
Particulate matter (PM) is a complex mixture of extremely small particles and liquid droplets. PM is made up of a number of components, including acids (such as nitrates and sulfates), organic chemicals, metals, and soil or dust particles (USEPA 2013a). Natural sources of particulates include windblown dust and ocean spray.
Air Quality Technical Report for the SR 94 Improvement Project Jamul
Page 20
The size of PM is directly linked to the potential for causing health problems. The USEPA is concerned about particles that are 10 micrometers in diameter or smaller because those are the particles that generally pass through the throat and nose and enter the lungs. Once inhaled, these particles can affect the heart and lungs and cause serious health effects. Health studies have shown a significant association between exposure to PM and premature death. Other important effects include aggravation of respiratory and cardiovascular disease, lung disease, decreased lung function, asthma attacks, and certain cardiovascular problems such as heart attacks and irregular heartbeat (USEPA 2007). Individuals particularly sensitive to fine particle exposure include older adults, people with heart and lung disease, and children. The USEPA groups PM into two categories, PM2.5 and PM10, as described below.
3.6.1 Fine Particulate Matter (PM2.5)
Fine particles, such as those found in smoke and haze, are 2.5 micrometers in diameter and smaller (PM2.5). Sources of fine particles include all types of combustion activities (motor vehicles, power plants, wood burning, etc.) and certain industrial processes. PM2.5 is the major cause of reduced visibility (haze) in California. Control of PM2.5 is primarily achieved through the regulation of emission sources, such as the USEPA’s Clean Air Interstate Rule and Clean Air Visibility Rule for stationary sources; the 2004 Clean Air Nonroad Diesel Rule, the Tier 2 Vehicle Emission Standards, and Gasoline Sulfur Program; or the CARB Goods Movement reduction plan.
3.6.2 Inhalable Particulate Matter (PM10)
Inhalable particles (PM10) include both fine and coarse dust particles; the fine particles are PM2.5. Coarse particles, such as those found near roadways and dusty industries, are larger than 2.5 micrometers and smaller than 10 micrometers in diameter. Sources of coarse particles include crushing or grinding operations, and dust from paved or unpaved roads. The health effects of PM10 are similar to PM2.5. Control of PM10 is primarily achieved through the control of dust at construction and industrial sites, the cleaning of paved roads, and the wetting or paving of frequently used unpaved roads.
The criteria pollutants that are most important for this air quality impact analysis are those that can be traced principally to motor vehicles and to earth-moving activities. Of these pollutants, CO, ROG, NOX, PM2.5, and PM10 are evaluated on a regional or “mesoscale” basis. CO is also often analyzed on a localized or “microscale” basis in cases of congested traffic conditions (USEPA 2013a). In December 2010, the FHWA and USEPA released the final guidance for conducting quantitative analyses to evaluate microscale impacts of PM2.5 and PM10 (FHWA 2010).
3.7 Toxic Air Contaminants (TACS)
In addition to the criteria air pollutants for which there are National Ambient Air Quality Standards (NAAQS), the USEPA also regulates TACs, also known as hazardous air pollutants. Concentrations of TACs are also used as indicators of ambient air quality conditions. A TAC is defined as an air pollutant that may cause or contribute to an increase in mortality or in serious illness, or that may pose a hazard
Air Quality Technical Report for the SR 94 Improvement Project Jamul
Page 21
to human health. TACs are usually present in minute quantities in the ambient air; however, their high toxicity or health risk may pose a threat to public health even at low concentrations. In general, for those TACs that may cause cancer, there is no concentration that does not present some risk. In other words, there is no threshold level below which adverse health impacts may not be expected to occur. This contrasts with the criteria air pollutants for which acceptable levels of exposure can be determined and for which the ambient standards have been established (Table 2). Most TACs originate from human-made sources, including on-road mobile sources, nonroad mobile sources (e.g., airplanes), area sources (e.g., dry cleaners), and stationary sources (e.g., factories or refineries).
3.7.1 Mobile Source Air Toxics
The CAA identified 188 TACs and the USEPA has assessed this expansive list of toxics and identified a group of 21 as Mobile Source Air Toxics (MSATs). The MSATs are compounds emitted from highway vehicles and nonroad equipment. Some toxic compounds are present in fuel and are emitted to the air when the fuel evaporates or passes through the engine unburned. Other toxics are emitted from the incomplete combustion of fuels or as secondary combustion products. Metal air toxics also result from engine wear or from impurities in oil or gasoline. The USEPA also extracted a subset of this list of 21 compounds that it now labels as the seven priority MSATs. These are benzene, formaldehyde, diesel particulate matter/diesel exhaust organic gases, acrolein, naphthalene, polycyclic organic matter, and 1, 3-butadiene. While these MSATs are considered the priority transportation toxics, the USEPA stresses that the lists are subject to change and may be adjusted by future regulatory actions (FHWA 2012b).
The USEPA has issued a number of regulations that will dramatically decrease MSATs through cleaner fuels and cleaner engines. According to an FHWA analysis, even if the number of vehicle miles traveled increases by 64 percent, reductions of 57 percent to 87 percent in MSATs are projected from 2000 to 2020. Project MSAT impacts are discussed in Section 5.1 of this report.
3.7.2 Diesel Exhaust Particulate
In 1999, the CARB identified particulate emissions from diesel-fueled engines as a TAC. Once a substance is identified as a TAC, the CARB is required by law to determine if there is a need for further control. This is referred to as risk management (CARB 2001). The process of further studies is ongoing at the CARB, with committees meeting to analyze both stationary and mobile diesel engine sources, as well as many other aspects of the problem. On September 28, 2000, the CARB approved the Proposed Diesel Risk Reduction Plan and the Proposed Risk Management Guidance for the Permitting of New Stationary Diesel-Fueled Engines. CARB programs in progress relating to truck emissions are included in the following paragraphs. There are other programs for risk reduction for off-road diesel engines.
In February 2001, the USEPA issued new rules requiring cleaner diesel fuels in 2006 and beyond. However, since 1993 California’s regulations have required cleaner diesel fuel than the federal requirements. The 1993 federal regulations reduced particulate emissions by 5 percent, while the California regulations reduced particulate emissions by 25 percent.
Air Quality Technical Report for the SR 94 Improvement Project Jamul
Page 22
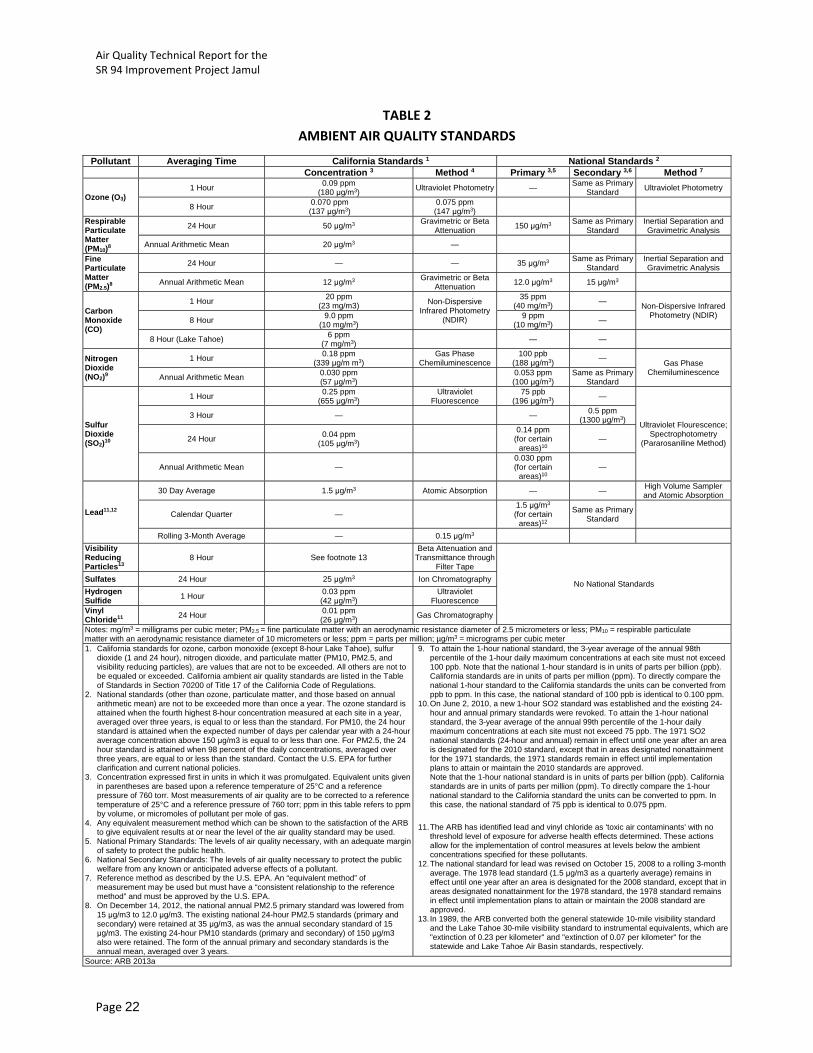
TABLE 2 AMBIENT AIR QUALITY STANDARDS
Pollutant Averaging Time California Standards 1 National Standards 2
Concentration 3 Method 4 Primary 3,5 Secondary 3,6 Method 7
Ozone (O3) 1 Hour
0.09 ppm (180 μg/m3)
Ultraviolet Photometry — Same as Primary
Standard Ultraviolet Photometry
8 Hour 0.070 ppm (137 μg/m3)
0.075 ppm (147 μg/m3)
Respirable Particulate Matter (PM10)8
24 Hour 50 μg/m3 Gravimetric or Beta
Attenuation 150 μg/m3
Same as Primary Standard
Inertial Separation and Gravimetric Analysis
Annual Arithmetic Mean 20 μg/m3 —
Fine Particulate Matter (PM2.5)8
24 Hour — — 35 μg/m3 Same as Primary
Standard Inertial Separation and Gravimetric Analysis
Annual Arithmetic Mean 12 μg/m3 Gravimetric or Beta
Attenuation 12.0 μg/m3 15 μg/m3
Carbon Monoxide (CO)
1 Hour 20 ppm
(23 mg/m3) Non-Dispersive Infrared Photometry
(NDIR)
35 ppm (40 mg/m3)
— Non-Dispersive Infrared
Photometry (NDIR) 8 Hour
9.0 ppm (10 mg/m3)
9 ppm (10 mg/m3)
—
8 Hour (Lake Tahoe) 6 ppm (7 mg/m3)
— —
Nitrogen Dioxide (NO2)9
1 Hour 0.18 ppm
(339 μg/m m3) Gas Phase
Chemiluminescence 100 ppb
(188 μg/m3) —
Gas Phase Chemiluminescence
Annual Arithmetic Mean 0.030 ppm (57 μg/m3)
0.053 ppm (100 μg/m3)
Same as Primary Standard
Sulfur Dioxide (SO2)10
1 Hour 0.25 ppm
(655 μg/m3) Ultraviolet
Fluorescence 75 ppb
(196 μg/m3) —
Ultraviolet Flourescence; Spectrophotometry
(Pararosaniline Method)
3 Hour — — 0.5 ppm
(1300 μg/m3)
24 Hour 0.04 ppm
(105 μg/m3)
0.14 ppm (for certain
areas)10 —
Annual Arithmetic Mean — 0.030 ppm (for certain
areas)10 —
Lead11,12
30 Day Average 1.5 μg/m3 Atomic Absorption — — High Volume Sampler and Atomic Absorption
Calendar Quarter — 1.5 μg/m3 (for certain
areas)12
Same as Primary Standard
Rolling 3-Month Average — 0.15 μg/m3
Visibility Reducing Particles13
8 Hour See footnote 13 Beta Attenuation and
Transmittance through Filter Tape
No National Standards Sulfates 24 Hour 25 μg/m3 Ion Chromatography
Hydrogen Sulfide
1 Hour 0.03 ppm (42 μg/m3)
Ultraviolet Fluorescence
Vinyl Chloride11
24 Hour 0.01 ppm (26 μg/m3)
Gas Chromatography
Notes: mg/m3 = milligrams per cubic meter; PM2.5 = fine particulate matter with an aerodynamic resistance diameter of 2.5 micrometers or less; PM10 = respirable particulate matter with an aerodynamic resistance diameter of 10 micrometers or less; ppm = parts per million; µg/m3 = micrograms per cubic meter 1. California standards for ozone, carbon monoxide (except 8-hour Lake Tahoe), sulfur
dioxide (1 and 24 hour), nitrogen dioxide, and particulate matter (PM10, PM2.5, and visibility reducing particles), are values that are not to be exceeded. All others are not to be equaled or exceeded. California ambient air quality standards are listed in the Table of Standards in Section 70200 of Title 17 of the California Code of Regulations.
2. National standards (other than ozone, particulate matter, and those based on annual arithmetic mean) are not to be exceeded more than once a year. The ozone standard is attained when the fourth highest 8-hour concentration measured at each site in a year, averaged over three years, is equal to or less than the standard. For PM10, the 24 hour standard is attained when the expected number of days per calendar year with a 24-hour average concentration above 150 μg/m3 is equal to or less than one. For PM2.5, the 24 hour standard is attained when 98 percent of the daily concentrations, averaged over three years, are equal to or less than the standard. Contact the U.S. EPA for further clarification and current national policies.
3. Concentration expressed first in units in which it was promulgated. Equivalent units given in parentheses are based upon a reference temperature of 25°C and a reference pressure of 760 torr. Most measurements of air quality are to be corrected to a reference temperature of 25°C and a reference pressure of 760 torr; ppm in this table refers to ppm by volume, or micromoles of pollutant per mole of gas.
4. Any equivalent measurement method which can be shown to the satisfaction of the ARB to give equivalent results at or near the level of the air quality standard may be used.
5. National Primary Standards: The levels of air quality necessary, with an adequate margin of safety to protect the public health.
6. National Secondary Standards: The levels of air quality necessary to protect the public welfare from any known or anticipated adverse effects of a pollutant.
7. Reference method as described by the U.S. EPA. An “equivalent method” of measurement may be used but must have a “consistent relationship to the reference method” and must be approved by the U.S. EPA.
8. On December 14, 2012, the national annual PM2.5 primary standard was lowered from 15 μg/m3 to 12.0 μg/m3. The existing national 24-hour PM2.5 standards (primary and secondary) were retained at 35 μg/m3, as was the annual secondary standard of 15 μg/m3. The existing 24-hour PM10 standards (primary and secondary) of 150 μg/m3 also were retained. The form of the annual primary and secondary standards is the annual mean, averaged over 3 years.
9. To attain the 1-hour national standard, the 3-year average of the annual 98th percentile of the 1-hour daily maximum concentrations at each site must not exceed 100 ppb. Note that the national 1-hour standard is in units of parts per billion (ppb). California standards are in units of parts per million (ppm). To directly compare the national 1-hour standard to the California standards the units can be converted from ppb to ppm. In this case, the national standard of 100 ppb is identical to 0.100 ppm.
10. On June 2, 2010, a new 1-hour SO2 standard was established and the existing 24-hour and annual primary standards were revoked. To attain the 1-hour national standard, the 3-year average of the annual 99th percentile of the 1-hour daily maximum concentrations at each site must not exceed 75 ppb. The 1971 SO2 national standards (24-hour and annual) remain in effect until one year after an area is designated for the 2010 standard, except that in areas designated nonattainment for the 1971 standards, the 1971 standards remain in effect until implementation plans to attain or maintain the 2010 standards are approved.
Note that the 1-hour national standard is in units of parts per billion (ppb). California standards are in units of parts per million (ppm). To directly compare the 1-hour national standard to the California standard the units can be converted to ppm. In this case, the national standard of 75 ppb is identical to 0.075 ppm.
11. The ARB has identified lead and vinyl chloride as 'toxic air contaminants' with no threshold level of exposure for adverse health effects determined. These actions allow for the implementation of control measures at levels below the ambient concentrations specified for these pollutants.
12. The national standard for lead was revised on October 15, 2008 to a rolling 3-month average. The 1978 lead standard (1.5 μg/m3 as a quarterly average) remains in effect until one year after an area is designated for the 2008 standard, except that in areas designated nonattainment for the 1978 standard, the 1978 standard remains in effect until implementation plans to attain or maintain the 2008 standard are approved.
13. In 1989, the ARB converted both the general statewide 10-mile visibility standard and the Lake Tahoe 30-mile visibility standard to instrumental equivalents, which are "extinction of 0.23 per kilometer" and "extinction of 0.07 per kilometer" for the statewide and Lake Tahoe Air Basin standards, respectively.
Source: ARB 2013a
Air Quality Technical Report for the SR 94 Improvement Project Jamul
Page 23
The control of emissions from mobile sources is a statewide responsibility of the CARB that has not been delegated to the local air districts. However, the San Diego Air Pollution Control District (SDAPCD) is participating in the administration programs to reduce diesel emissions, principally by procurement and use of replacement vehicles powered by natural gas. Some air districts have issued preliminary project guidance for projects with large or concentrated numbers of trucks, such as warehouses and distribution facilities. No standards exist for quantitative impact analysis for diesel particulates.
3.8 Asbestos
The CAA requires the USEPA to develop and enforce regulations to protect the general public from exposure to airborne contaminants that are known to be hazardous to human health. In accordance with CAA Section 112, the USEPA established National Emissions Standards for Hazardous Air Pollutants (NESHAP) to protect the public. Asbestos was one of the first hazardous air pollutants regulated under this section. On March 31, 1971, the USEPA identified asbestos as a hazardous pollutant, and on April 6, 1973, first promulgated the asbestos NESHAP in 40 CFR 61. In 1990, a revised NESHAP regulation was promulgated by the USEPA.
The asbestos NESHAP regulations protect the public by minimizing the release of asbestos fibers during activities involving the processing, handling, and disposal of asbestos-containing material. Accordingly, the asbestos NESHAP specifies work practices to be followed during demolitions and renovations of all structures, installations, and buildings (excluding residential buildings that have four or fewer dwelling units). In addition, the regulations require the project applicant to notify applicable state and local agencies and/or USEPA regional offices before all demolitions or before construction that contains a certain threshold amount of asbestos.
3.8.1 Naturally Occurring Asbestos (NOA)-bearing Serpentine
Serpentine is a mineral commonly found in seismically active regions of California, usually in association with ultramafic rocks and along associated faults. Certain types of serpentine occur naturally in a fibrous form known generically as asbestos. Asbestos is a known carcinogen and inhalation of asbestos may result in the development of lung cancer or mesothelioma. The CARB has regulated the amount of asbestos in crushed serpentinite used in surfacing applications, such as for gravel on unpaved roads, since 1990. In 1998, new concerns were raised about health hazards from activities that disturb asbestos-bearing rocks and soil. In response, the CARB revised their asbestos limit for crushed serpentines and ultramafic rock in surfacing applications from 5 percent to less than 0.25 percent and adopted a new rule requiring best practices dust control measures for activities that disturb rock and soil containing NOA (CDC 2000). According to the report A General Location Guide for Ultramafic Rocks in California-Area Likely to Contain Naturally Occurring Asbestos (CDC 2000), the coastal portion of San Diego County NOA is not typically found in the geological formations present on the Proposed Project site (CDC 2000). Thus, hazardous exposure to asbestos-containing serpentine materials would not be a concern with the Proposed Project.
Air Quality Technical Report for the SR 94 Improvement Project Jamul
Page 24
4.0 Applicable Standards
4.1 Federal and State Standards
Ambient Air Quality Standards represent the maximum levels of background pollution considered safe, with an adequate margin of safety, to protect the public health and welfare. The CAA (42 U.S.C. §§ 7401-7671q) requires the adoption of NAAQS to protect the public health and welfare from the effects of air pollution. The EPA is responsible for the development of primary and secondary NAAQS. The NAAQS have been updated as needed.
The State of California has developed the California Ambient Air Quality Standards (CAAQS) and generally has set more stringent limits on criteria pollutants (see Table 3). In addition to the federal criteria pollutants, the CAAQS also specify standards for visibility-reducing particles, sulfates, hydrogen sulfide, and vinyl chloride (see Table 2). The California CAA requires that districts implement regulations to reduce emissions from mobile sources through the adoption and enforcement of transportation control measures.
4.2 Regional Authority
In San Diego County, the SDAPCD is the agency responsible for the administration of federal and state air quality laws, regulations, and policies. Included in the SDAPCD’s tasks are monitoring of air pollution, preparation of the SIP for the SDAB, and promulgation of Rules and Regulations.
The SIP includes strategies and tactics to be used to attain the federal O3 standard in the county. The SIP elements are taken from the Regional Air Quality Strategy (RAQS), the RAQS was developed to identify feasible emission control measures and provide expeditious progress toward attaining the State O3 standards. The two pollutants addressed in the RAQS are volatile organic compounds and NOx, which are precursors to the formation of O3 (CARB 2007).
The Rules and Regulations include procedures and requirements to control the emission of pollutants and to prevent adverse impacts. One SDAPCD rule is noted with respect to the Proposed Project:
SDAPCD Rule 51, Nuisance, prohibits emissions that cause injury, detriment, nuisance, or annoyance to the public.
The project is required to comply with this rule, and conformance will be incorporated into project specifications and procedures.
Air Quality Technical Report for the SR 94 Improvement Project Jamul
Page 25
5.0 Environmental Setting
5.1 Environmental Setting, Climate, and Meteorology
The project is located in the SDAB, which is coincident with San Diego County. The climate of San Diego County is characterized by warm, dry summers and mild, wet winters. One of the main determinants of the climatology is a semi-permanent high-pressure area (the Pacific High) in the eastern Pacific Ocean. In the summer, this pressure center is located well to the north, causing storm tracks to be directed north of California. This high-pressure cell maintains clear skies for much of the year. When the Pacific High moves southward during the winter, this pattern changes, and low-pressure storms are brought into the region, causing widespread precipitation. In San Diego County, the months of heaviest precipitation are November through April, averaging about 9 to 14 inches annually. The mean temperature is 62.2°F, and the mean maximum and mean minimum temperatures are 75.7°F and 48.5°F, respectively (Western Region Climatic Center 2013).
The Pacific High also influences the wind patterns of California. The predominant wind directions are westerly and west-southwesterly during all four seasons, and the average annual wind speed is approximately six miles per hour.
A common atmospheric condition known as a temperature inversion affects air quality in San Diego. During an inversion, air temperatures get warmer rather than cooler with increasing height. Subsidence inversions occur during the warmer months (May through October) as descending air associated with the Pacific High comes into contact with cooler marine air. The boundary between the layers of air represents a temperature inversion that traps pollutants below it. The inversion layer is approximately 2,000 feet above mean sea level during the months of May through October. However, during the remaining months (November through April), the temperature inversion is approximately 3,000 feet above mean sea level. Inversion layers are important elements of local air quality because they inhibit the dispersion of pollutants, thus resulting in a temporary degradation of air quality.
5.2 Regional and Local Air Quality
Specific geographic areas are classified as either “attainment” or “nonattainment” areas for each pollutant based on the comparison of measured data with federal and state standards. If an area is redesignated from nonattainment to attainment, the CAA requires a revision to the SIP, called a maintenance plan, to demonstrate how the air quality standard will be maintained for at least 10 years. The Transportation Conformity Rule, 51 CFR 390-464, classifies an area required to develop a maintenance plan as a maintenance area.
The project site is located in the SDAB, which currently meets the federal standards for all criteria pollutants, except O3, and state standards for all criteria pollutants, except O3, PM10, and PM2.5. On April
Air Quality Technical Report for the SR 94 Improvement Project Jamul
Page 26
15, 2004, the USEPA issued the initial designations for the 8-hour O3 standard, and the SDAB is classified as a federal nonattainment area (marginal) for the 8-hour O3 standard. Marginal is the least severe of the five degrees of O3 nonattainment. The boundaries of the 8-hour O3 nonattainment area are the boundaries of San Diego County (CARB 2013b). The SDAB is a CO attainment-maintenance area, following a 1998 redesignation as a CO attainment area.
The SDAB is currently classified as a state “serious” O3 nonattainment area and a state nonattainment area for PM2.5 and PM10 (CARB 2013b).
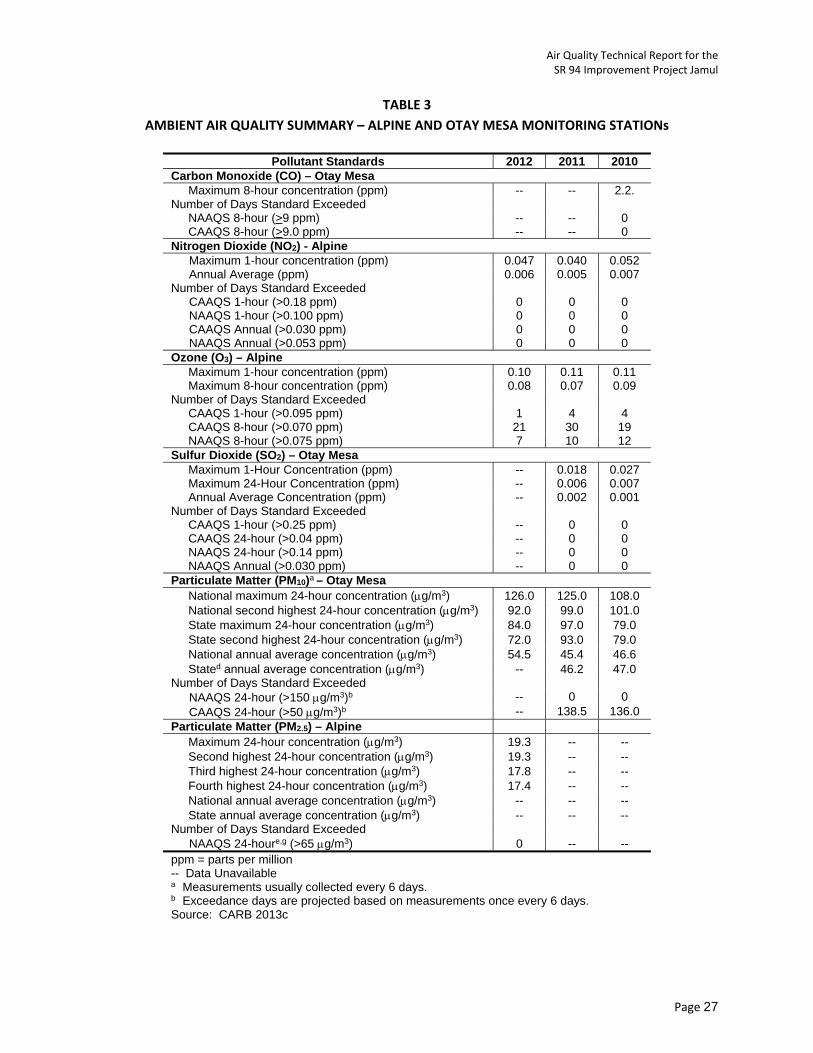
Ambient air pollutant concentrations in the SDAB are measured at 11 air quality monitoring stations operated by the SDAPCD. The SDAPCD air quality monitoring station that represents the project area, climate, and topography in the SDAB is the Alpine monitoring station, approximately eleven miles northeast of the project area. However, the station does not monitor CO or PM10. Thus, to provide data on other pollutants, the next most representative station, Otay Mesa, was used to report ambient concentrations of CO and PM10. Table 3 summarizes the excesses of standards and the highest pollutant levels recorded at these stations for the years 2010 to 2012.
Air Quality Technical Report for the SR 94 Improvement Project Jamul
Page 27
TABLE 3 AMBIENT AIR QUALITY SUMMARY – ALPINE AND OTAY MESA MONITORING STATIONs
Pollutant Standards 2012 2011 2010 Carbon Monoxide (CO) – Otay Mesa Maximum 8-hour concentration (ppm) -- -- 2.2. Number of Days Standard Exceeded NAAQS 8-hour (>9 ppm) -- -- 0 CAAQS 8-hour (>9.0 ppm) -- -- 0 Nitrogen Dioxide (NO2) - Alpine Maximum 1-hour concentration (ppm) 0.047 0.040 0.052 Annual Average (ppm) 0.006 0.005 0.007 Number of Days Standard Exceeded CAAQS 1-hour (>0.18 ppm) 0 0 0 NAAQS 1-hour (>0.100 ppm) 0 0 0 CAAQS Annual (>0.030 ppm) 0 0 0 NAAQS Annual (>0.053 ppm) 0 0 0 Ozone (O3) – Alpine Maximum 1-hour concentration (ppm) 0.10 0.11 0.11 Maximum 8-hour concentration (ppm) 0.08 0.07 0.09 Number of Days Standard Exceeded CAAQS 1-hour (>0.095 ppm) 1 4 4 CAAQS 8-hour (>0.070 ppm) 21 30 19 NAAQS 8-hour (>0.075 ppm) 7 10 12 Sulfur Dioxide (SO2) – Otay Mesa Maximum 1-Hour Concentration (ppm) -- 0.018 0.027 Maximum 24-Hour Concentration (ppm) -- 0.006 0.007 Annual Average Concentration (ppm) -- 0.002 0.001 Number of Days Standard Exceeded CAAQS 1-hour (>0.25 ppm) -- 0 0 CAAQS 24-hour (>0.04 ppm) -- 0 0 NAAQS 24-hour (>0.14 ppm) -- 0 0 NAAQS Annual (>0.030 ppm) -- 0 0 Particulate Matter (PM10)a
– Otay Mesa National maximum 24-hour concentration (g/m3) 126.0 125.0 108.0 National second highest 24-hour concentration (g/m3) 92.0 99.0 101.0 State maximum 24-hour concentration (g/m3) 84.0 97.0 79.0 State second highest 24-hour concentration (g/m3) 72.0 93.0 79.0 National annual average concentration (g/m3) 54.5 45.4 46.6 Stated annual average concentration (g/m3) -- 46.2 47.0 Number of Days Standard Exceeded NAAQS 24-hour (>150 g/m3)b -- 0 0 CAAQS 24-hour (>50 g/m3)b -- 138.5 136.0 Particulate Matter (PM2.5) – Alpine Maximum 24-hour concentration (g/m3) 19.3 -- -- Second highest 24-hour concentration (g/m3) 19.3 -- -- Third highest 24-hour concentration (g/m3) 17.8 -- -- Fourth highest 24-hour concentration (g/m3) 17.4 -- -- National annual average concentration (g/m3) -- -- -- State annual average concentration (g/m3) -- -- -- Number of Days Standard Exceeded NAAQS 24-houre,g (>65 g/m3) 0 -- -- ppm = parts per million -- Data Unavailable a Measurements usually collected every 6 days. b Exceedance days are projected based on measurements once every 6 days. Source: CARB 2013c
Air Quality Technical Report for the SR 94 Improvement Project Jamul
Page 28
5.3 Roadways and Traffic
The primary roadway within the access road project area is SR-94. SR-94 is a two-lane highway within a rural environment. The average daily traffic (AADT) volumes for SR-94 ranges from 10,500 to 16,700 vehicles in this area. The existing intersection with Melody Lane is controlled by a stop sign.
SR-94/Jamacha Boulevard Intersection
At the northeastern most end of the project area is the SR-94/Jamacha Boulevard Intersection. SR-94 is
a four-lane facility west of Jamacha Boulevard and a six-lane facility west of Jamacha Boulevard. The SR-
94/Jamacha Boulevard Intersection has two eastbound thru-lanes and three westbound thru-lanes, as
well as additional dedicated turning lanes on both sides of the intersection. Topography around the
intersection is rolling, and an unnamed intermittent drainage runs east toward Sweetwater River south
of the highway.
State Route 94/Jamacha Road Intersection SR-94 is a six-lane facility west of the Jamacha Road intersection to the Jamacha Boulevard intersection.
Jamacha Road is a six-lane expressway with two two-way turn lanes east of the Jamacha Road
intersection. SR-94 continues as a four-lane expressway with one southbound dedicated turn lane and
two northbound dedicated turn lanes south of the Jamacha Road intersection. This intersection is
characterized by its urban setting and flat topography.
State Route 94/Steele Canyon Road Intersection SR-94 is a two-lane facility with a two-way left turn lane. Steele Canyon Road, which terminates at this
intersection, has two lanes. This intersection and the segment is characterized primarily by commercial
land uses and steep topography.
State Route 94/Lyons Valley Road Intersection In the area of the intersection, SR-94 is two-lane facility with a two-way left turn lane. Lyons Valley Road
is a two-lane road with a right turn “sneaker” lane at this intersection. This intersection is characterized
by a variety of land uses, steep topography, and an adjacent drainage channel. (NEED TRAFFIC
INFORMATION)
State Route 94/Maxfield Road Intersection In the area of the intersection, SR-94 is a two-lane facility with a northbound left turn lane onto Maxfield
Road. This intersection is characterized by a variety of land uses, steep topography, and an adjacent
drainage channel.
Air Quality Technical Report for the SR 94 Improvement Project Jamul
Page 29
6.0 Project Impacts
6.1 Long-Term Emissions
6.1.1 Regional Air Quality
The Proposed Project includes the construction of an access road, as well as improvements to five off-
site intersections. While the future JIV Gaming Facility would generate approximately 9,000 new vehicle
trips, which would access the site from SR-94, the JIV Gaming Facility is a separately approved project
and would be constructed with or without the improvements to SR-94. Therefore, the Proposed Project
would not generate any new vehicle trips, but rather provide improved traffic flow through the access
road and off-site intersection locations. Therefore, the regional emissions of concern in this analysis are
related to construction activities only.
Construction activities would generate temporary (short-term) emissions as fugitive dust emissions from
earth-disturbing activities, and as exhaust emissions from the operation of construction equipment and
vehicles. Construction is anticipated to last for approximately 1 year. Federal conformity regulations
require analysis of construction impacts for projects when construction activities will last for more than
5 years. The proposed project would be complete in 2015 and last less than 5 years; therefore, no
quantitative estimates of regional construction emissions have been made. However, it is recommended
that specific measures to control dust and particulates be incorporated into project specifications. These
measures are identified in Chapter 7.0.
6.2 Local Air Quality (“Hot Spots”)
6.2.1 Carbon Monoxide
As part of conformity determinations, the USEPA requires a statement that:
Federal projects must not cause or contribute to any new localized CO violations or increase the frequency or severity of any existing CO violations in CO nonattainment and maintenance areas.
The CO portion of the Rule applies to the Proposed Project because the SDAB is classified as a federal CO maintenance area. Procedures and guidelines for use in evaluating the potential local level CO impacts of a project are contained in Transportation Project-Level Carbon Monoxide Protocol (CO Protocol; University of California, Davis—Institute of Transportation Studies 1997). The CO Protocol provides a methodology for determining the level of analysis, if any, required on a project. The guidelines comply with the CAA, federal, and state conformity rules, the National Environmental Policy Act (NEPA), and the California Environmental Quality Act. The CO Protocol states that the determination of project-level CO
Air Quality Technical Report for the SR 94 Improvement Project Jamul
Page 30
impacts should be carried out in accordance with the Local CO Analysis flow charts shown as Figures 1 and 3 of the Protocol (Attachment 1; Caltrans 2003). Figure 1 of the Protocol applies to the evaluation of new projects.
The determination of project-level CO impacts should be carried out according to the Local Analysis flow chart – Figure 3 of the CO Protocol. The procedures of Section 4 in Figure 3 of the Protocol are provided for the Proposed Project to identify the level of effort required.
Section 4, Local CO Analysis, Level 1
Question: Is the project in a CO nonattainment area?
Answer: No. The project is in a CO attainment-maintenance area, following a 1998 redesignation from a CO nonattainment area. Go to next question.
Question: Was the area redesignated as “attainment” after the 1990 Clean Air Act?
Answer: Yes. The area was redesignated as attainment in 1998. Go to next question.
Question: Has “continued attainment” been verified with the local air district (if appropriate)?
Answer: Yes. Continued attainment has been verified with the SDAPCD. Proceed to Level 7.
Level 7
Question: Does the project worsen air quality?
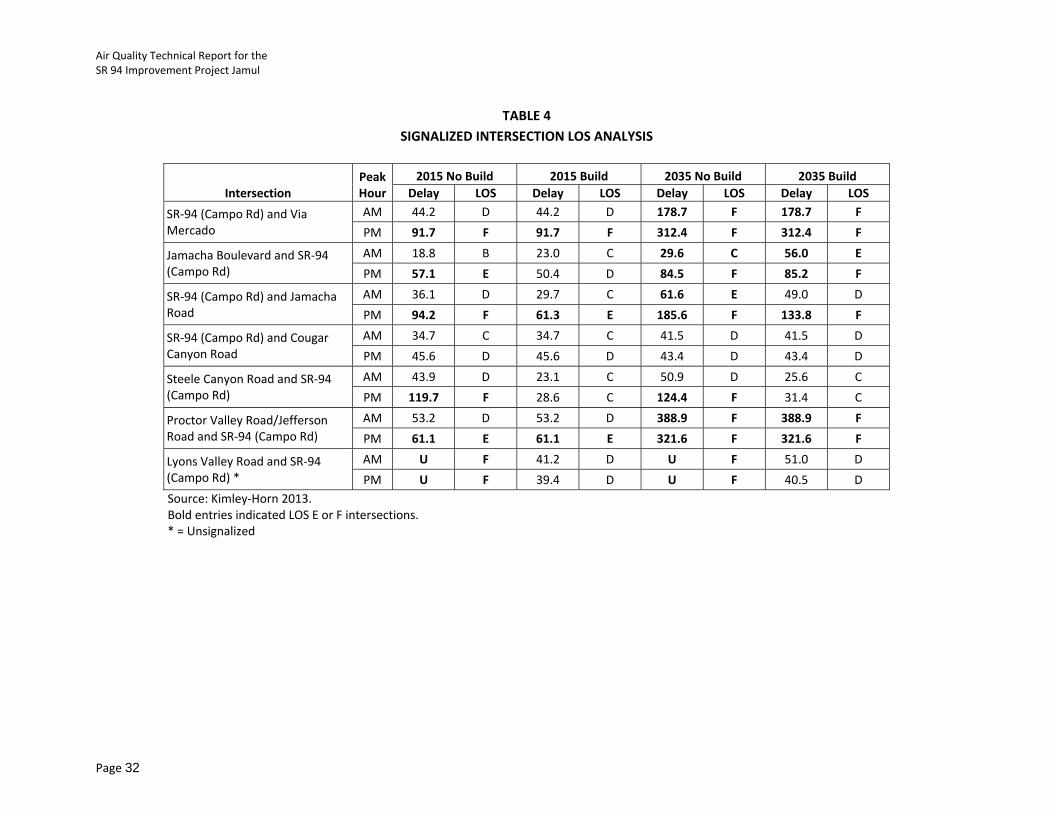
Answer: Yes, the project has the potential to effect local air quality due to increased congestion at local intersections. As shown in Table 4, the project traffic report identifies four signalized intersections that would operate at LOS E or LOS F under the 2035 build conditions: SR-94 and Via Mercado, Jamacha Boulevard and SR-94, SR-94 and Jamacha Road, Steele Canyon Road and SR-94, and Proctor Valley Road/Jefferson Road and SR-94. Additionally, the project will signalize the intersection of SR-94 and Lyons Valley Road, which is currently unrestricted along SR-94.
The intersection of SR-94 and Jamacha Boulevard would increase the delay or worsen the traffic flow under the 2035 conditions, the intersection of SR-94 and Jamacha Road would have the greatest traffic volumes, and the intersection of SR-94 and Lyons Valley Road would experience the greatest delay change along SR-94 due the new intersection. Therefore a detail CO hot spot analysis was conducted for these intersections. Curbside CO concentrations were estimated using the CALINE-4 dispersion model developed by Caltrans, using peak-hour AM and PM traffic volumes and worst-case meteorological assumptions. Worst-case meteorological conditions include low wind speed and stable atmospheric conditions producing the highest CO concentrations for each case. All approach volumes for the intersections, including left turn lanes, were modeled with using emissions factors for idling vehicles, while all departing vehicle emissions were modeled at 5 miles per hour. This is conservative as the Caltrans protocol methodology indicates approach and departure speeds due to cruise speeds and the number of
Air Quality Technical Report for the SR 94 Improvement Project Jamul
Page 31
lanes would be higher, which would result in lower emission factors. The highest 1-hour background concentration reported by the SDAPCD was 2.4 ppm in 2012 at the El Cajon monitoring station, which was used as the background concentration for all modeling conditions in 2015 and 2035 and added to the project’s contribution. This is considered conservative as it is the highest recorded concentration in 2012 and concentrations of CO are expected to drop due to fuel reformulations, and increases fuel efficiency requirements for new vehicles.
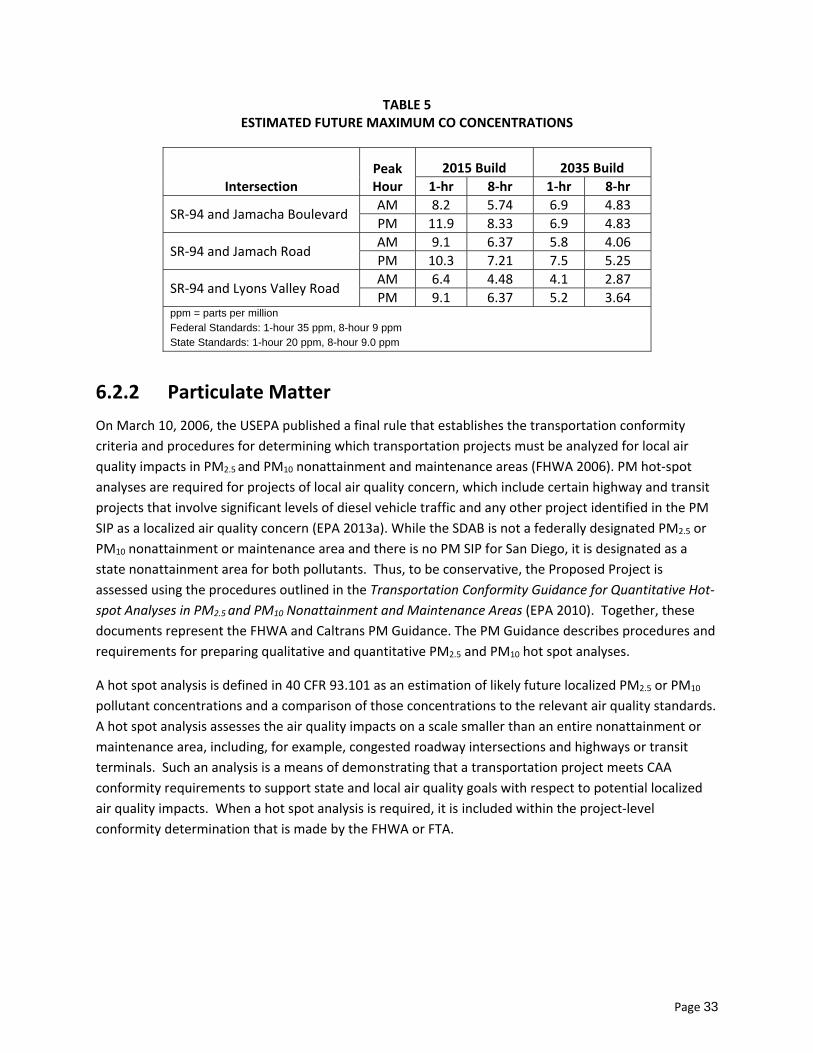
The results of the CO hotspot modeling for intersection is shown in Table 5, which indicates that the traffic delays resulting from the proposed project would not exceed the 1-hour or 8-hour NAAQS or CAAQS and would not create a CO hotspot. The Caline 4 output sheets and traffic data are contained in Attachment 2.
Air Quality Technical Report for the SR 94 Improvement Project Jamul
Page 32
TABLE 4 SIGNALIZED INTERSECTION LOS ANALYSIS
Intersection Peak Hour
2015 No Build 2015 Build 2035 No Build 2035 Build Delay LOS Delay LOS Delay LOS Delay LOS
SR-94 (Campo Rd) and Via Mercado
AM 44.2 D 44.2 D 178.7 F 178.7 F
PM 91.7 F 91.7 F 312.4 F 312.4 F
Jamacha Boulevard and SR-94 (Campo Rd)
AM 18.8 B 23.0 C 29.6 C 56.0 E
PM 57.1 E 50.4 D 84.5 F 85.2 F
SR-94 (Campo Rd) and Jamacha Road
AM 36.1 D 29.7 C 61.6 E 49.0 D
PM 94.2 F 61.3 E 185.6 F 133.8 F
SR-94 (Campo Rd) and Cougar Canyon Road
AM 34.7 C 34.7 C 41.5 D 41.5 D
PM 45.6 D 45.6 D 43.4 D 43.4 D
Steele Canyon Road and SR-94 (Campo Rd)
AM 43.9 D 23.1 C 50.9 D 25.6 C
PM 119.7 F 28.6 C 124.4 F 31.4 C
Proctor Valley Road/Jefferson Road and SR-94 (Campo Rd)
AM 53.2 D 53.2 D 388.9 F 388.9 F
PM 61.1 E 61.1 E 321.6 F 321.6 F
Lyons Valley Road and SR-94 (Campo Rd) *
AM U F 41.2 D U F 51.0 D
PM U F 39.4 D U F 40.5 D Source: Kimley-Horn 2013. Bold entries indicated LOS E or F intersections. * = Unsignalized
Page 33
TABLE 5 ESTIMATED FUTURE MAXIMUM CO CONCENTRATIONS
Intersection Peak Hour
2015 Build 2035 Build 1-hr 8-hr 1-hr 8-hr
SR-94 and Jamacha Boulevard AM 8.2 5.74 6.9 4.83 PM 11.9 8.33 6.9 4.83
SR-94 and Jamach Road AM 9.1 6.37 5.8 4.06 PM 10.3 7.21 7.5 5.25
SR-94 and Lyons Valley Road AM 6.4 4.48 4.1 2.87 PM 9.1 6.37 5.2 3.64
ppm = parts per million Federal Standards: 1-hour 35 ppm, 8-hour 9 ppm State Standards: 1-hour 20 ppm, 8-hour 9.0 ppm
6.2.2 Particulate Matter
On March 10, 2006, the USEPA published a final rule that establishes the transportation conformity criteria and procedures for determining which transportation projects must be analyzed for local air quality impacts in PM2.5 and PM10 nonattainment and maintenance areas (FHWA 2006). PM hot-spot analyses are required for projects of local air quality concern, which include certain highway and transit projects that involve significant levels of diesel vehicle traffic and any other project identified in the PM SIP as a localized air quality concern (EPA 2013a). While the SDAB is not a federally designated PM2.5 or PM10 nonattainment or maintenance area and there is no PM SIP for San Diego, it is designated as a state nonattainment area for both pollutants. Thus, to be conservative, the Proposed Project is assessed using the procedures outlined in the Transportation Conformity Guidance for Quantitative Hot-spot Analyses in PM2.5 and PM10 Nonattainment and Maintenance Areas (EPA 2010). Together, these documents represent the FHWA and Caltrans PM Guidance. The PM Guidance describes procedures and requirements for preparing qualitative and quantitative PM2.5 and PM10 hot spot analyses.
A hot spot analysis is defined in 40 CFR 93.101 as an estimation of likely future localized PM2.5 or PM10 pollutant concentrations and a comparison of those concentrations to the relevant air quality standards. A hot spot analysis assesses the air quality impacts on a scale smaller than an entire nonattainment or maintenance area, including, for example, congested roadway intersections and highways or transit terminals. Such an analysis is a means of demonstrating that a transportation project meets CAA conformity requirements to support state and local air quality goals with respect to potential localized air quality impacts. When a hot spot analysis is required, it is included within the project-level conformity determination that is made by the FHWA or FTA.
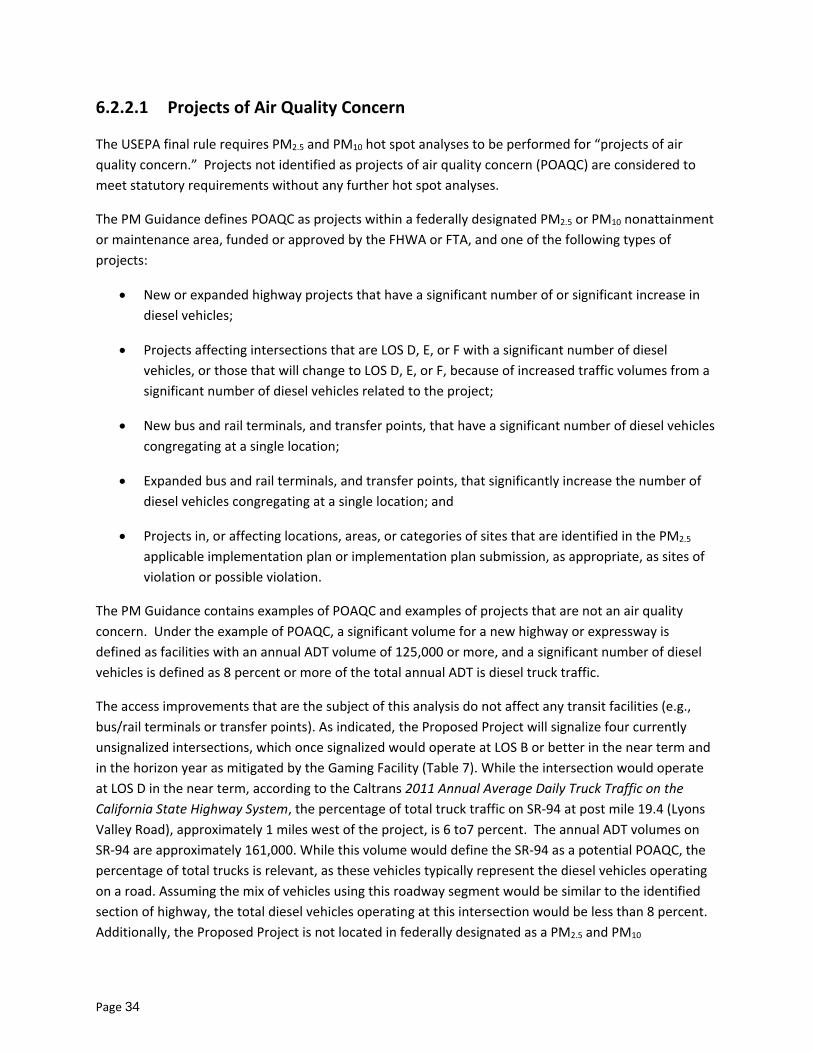
Page 34
6.2.2.1 Projects of Air Quality Concern
The USEPA final rule requires PM2.5 and PM10 hot spot analyses to be performed for “projects of air quality concern.” Projects not identified as projects of air quality concern (POAQC) are considered to meet statutory requirements without any further hot spot analyses.
The PM Guidance defines POAQC as projects within a federally designated PM2.5 or PM10 nonattainment or maintenance area, funded or approved by the FHWA or FTA, and one of the following types of projects:
New or expanded highway projects that have a significant number of or significant increase in diesel vehicles;
Projects affecting intersections that are LOS D, E, or F with a significant number of diesel vehicles, or those that will change to LOS D, E, or F, because of increased traffic volumes from a significant number of diesel vehicles related to the project;
New bus and rail terminals, and transfer points, that have a significant number of diesel vehicles congregating at a single location;
Expanded bus and rail terminals, and transfer points, that significantly increase the number of diesel vehicles congregating at a single location; and
Projects in, or affecting locations, areas, or categories of sites that are identified in the PM2.5 applicable implementation plan or implementation plan submission, as appropriate, as sites of violation or possible violation.
The PM Guidance contains examples of POAQC and examples of projects that are not an air quality concern. Under the example of POAQC, a significant volume for a new highway or expressway is defined as facilities with an annual ADT volume of 125,000 or more, and a significant number of diesel vehicles is defined as 8 percent or more of the total annual ADT is diesel truck traffic.
The access improvements that are the subject of this analysis do not affect any transit facilities (e.g., bus/rail terminals or transfer points). As indicated, the Proposed Project will signalize four currently unsignalized intersections, which once signalized would operate at LOS B or better in the near term and in the horizon year as mitigated by the Gaming Facility (Table 7). While the intersection would operate at LOS D in the near term, according to the Caltrans 2011 Annual Average Daily Truck Traffic on the California State Highway System, the percentage of total truck traffic on SR-94 at post mile 19.4 (Lyons Valley Road), approximately 1 miles west of the project, is 6 to7 percent. The annual ADT volumes on SR-94 are approximately 161,000. While this volume would define the SR-94 as a potential POAQC, the percentage of total trucks is relevant, as these vehicles typically represent the diesel vehicles operating on a road. Assuming the mix of vehicles using this roadway segment would be similar to the identified section of highway, the total diesel vehicles operating at this intersection would be less than 8 percent. Additionally, the Proposed Project is not located in federally designated as a PM2.5 and PM10
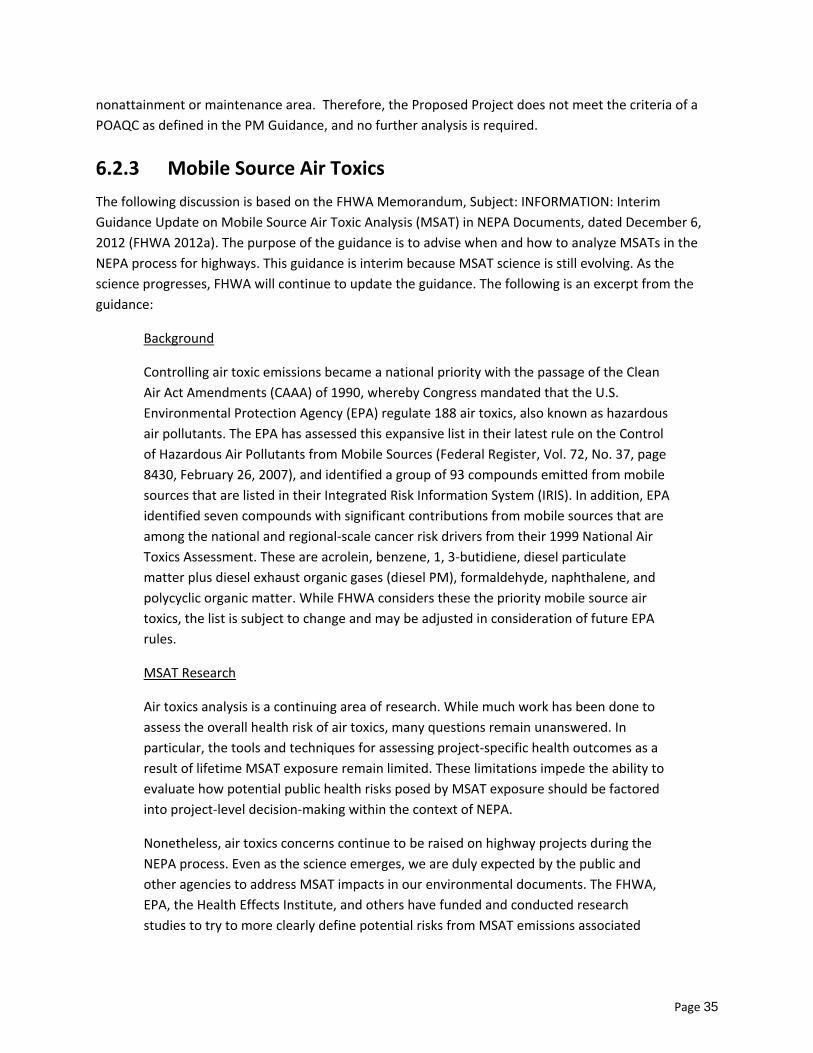
Page 35
nonattainment or maintenance area. Therefore, the Proposed Project does not meet the criteria of a POAQC as defined in the PM Guidance, and no further analysis is required.
6.2.3 Mobile Source Air Toxics
The following discussion is based on the FHWA Memorandum, Subject: INFORMATION: Interim Guidance Update on Mobile Source Air Toxic Analysis (MSAT) in NEPA Documents, dated December 6, 2012 (FHWA 2012a). The purpose of the guidance is to advise when and how to analyze MSATs in the NEPA process for highways. This guidance is interim because MSAT science is still evolving. As the science progresses, FHWA will continue to update the guidance. The following is an excerpt from the guidance:
Background
Controlling air toxic emissions became a national priority with the passage of the Clean Air Act Amendments (CAAA) of 1990, whereby Congress mandated that the U.S. Environmental Protection Agency (EPA) regulate 188 air toxics, also known as hazardous air pollutants. The EPA has assessed this expansive list in their latest rule on the Control of Hazardous Air Pollutants from Mobile Sources (Federal Register, Vol. 72, No. 37, page 8430, February 26, 2007), and identified a group of 93 compounds emitted from mobile sources that are listed in their Integrated Risk Information System (IRIS). In addition, EPA identified seven compounds with significant contributions from mobile sources that are among the national and regional-scale cancer risk drivers from their 1999 National Air Toxics Assessment. These are acrolein, benzene, 1, 3-butidiene, diesel particulate matter plus diesel exhaust organic gases (diesel PM), formaldehyde, naphthalene, and polycyclic organic matter. While FHWA considers these the priority mobile source air toxics, the list is subject to change and may be adjusted in consideration of future EPA rules.
MSAT Research
Air toxics analysis is a continuing area of research. While much work has been done to assess the overall health risk of air toxics, many questions remain unanswered. In particular, the tools and techniques for assessing project-specific health outcomes as a result of lifetime MSAT exposure remain limited. These limitations impede the ability to evaluate how potential public health risks posed by MSAT exposure should be factored into project-level decision-making within the context of NEPA.
Nonetheless, air toxics concerns continue to be raised on highway projects during the NEPA process. Even as the science emerges, we are duly expected by the public and other agencies to address MSAT impacts in our environmental documents. The FHWA, EPA, the Health Effects Institute, and others have funded and conducted research studies to try to more clearly define potential risks from MSAT emissions associated
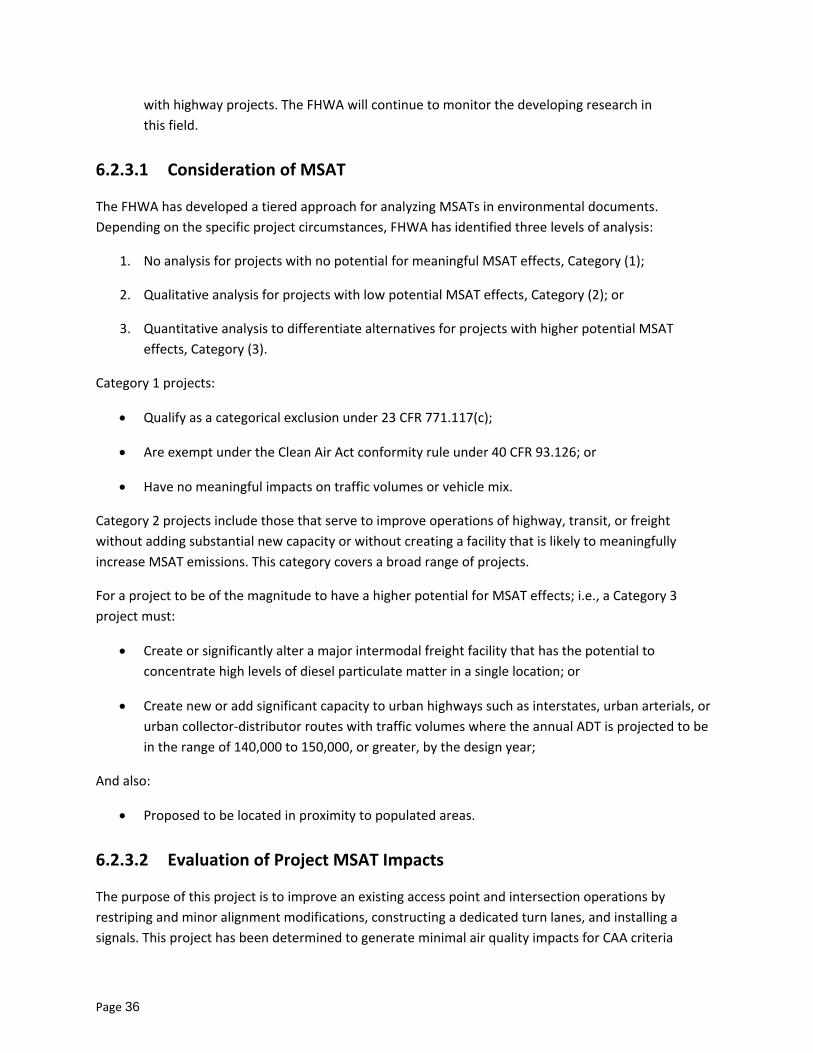
Page 36
with highway projects. The FHWA will continue to monitor the developing research in this field.
6.2.3.1 Consideration of MSAT
The FHWA has developed a tiered approach for analyzing MSATs in environmental documents. Depending on the specific project circumstances, FHWA has identified three levels of analysis:
1. No analysis for projects with no potential for meaningful MSAT effects, Category (1);
2. Qualitative analysis for projects with low potential MSAT effects, Category (2); or
3. Quantitative analysis to differentiate alternatives for projects with higher potential MSAT effects, Category (3).
Category 1 projects:
Qualify as a categorical exclusion under 23 CFR 771.117(c);
Are exempt under the Clean Air Act conformity rule under 40 CFR 93.126; or
Have no meaningful impacts on traffic volumes or vehicle mix.
Category 2 projects include those that serve to improve operations of highway, transit, or freight without adding substantial new capacity or without creating a facility that is likely to meaningfully increase MSAT emissions. This category covers a broad range of projects.
For a project to be of the magnitude to have a higher potential for MSAT effects; i.e., a Category 3 project must:
Create or significantly alter a major intermodal freight facility that has the potential to concentrate high levels of diesel particulate matter in a single location; or
Create new or add significant capacity to urban highways such as interstates, urban arterials, or urban collector-distributor routes with traffic volumes where the annual ADT is projected to be in the range of 140,000 to 150,000, or greater, by the design year;
And also:
Proposed to be located in proximity to populated areas.
6.2.3.2 Evaluation of Project MSAT Impacts
The purpose of this project is to improve an existing access point and intersection operations by restriping and minor alignment modifications, constructing a dedicated turn lanes, and installing a signals. This project has been determined to generate minimal air quality impacts for CAA criteria
Page 37
pollutants and has not been linked with any special MSAT concerns. As such, this project will not result in changes in traffic volumes, vehicle mix, basic project location, or any other factor that would cause a substantial increase in MSAT impacts compared to the existing conditions. This project has been determined to generate minimal air quality impacts for CAAA criteria pollutants and has not been linked with any special MSAT concerns. Additionally, the Proposed Project will not result in changes in traffic volumes, vehicle mix, basic project location, or any other factor that would cause an increase in MSAT impacts of the project from that of the no-build alternative. Therefore, the proposed action is considered a Category 1 project.
Moreover, USEPA regulations for vehicle engines and fuels will cause overall MSAT emissions to decline significantly over the next several decades. Based on regulations now in effect, an analysis of national trends with the USEPA’s MOVES model forecasts a combined reduction of over 80 percent in the total annual emission rate for the priority MSAT from 2010 to 2050, while vehicle-miles of travel are projected to increase by over 100 percent. This will both reduce the background level of MSAT as well as the possibility of even minor MSAT emissions from this project.
6.3 Construction Impacts
6.3.1 Regional Emissions
The principal criteria pollutants emitted during construction would be PM10 and PM2.5. The source of the pollutants would be fugitive dust created during clearing, grubbing, excavation, and grading; demolition of structures and pavement; vehicle travel on paved and unpaved roads; and material blown from unprotected graded areas, stockpiles, and haul trucks. Generally, the distance that particles drift from their source depends on their size, emission height, and wind speed. A secondary source of pollutants during construction would be the engine exhaust from construction equipment during all construction activities. The principal pollutants of concern would be NOX and volatile organic compounds emissions that would contribute to the formation of O3, which is a regional nonattainment pollutant.
The Proposed Project would be complete in 2015, with construction lasting approximately 1 year. As
previously discussed, federal conformity regulations require analysis of construction impacts for projects
when construction activities will last for more than 5 years. Therefore, no quantitative estimates of
regional construction emissions have been made. However, it is recommended that specific measures to
control dust and particulates be incorporated into project specifications. These measures are identified
in Chapter 7.0.
6.3.2 Local Emissions
According to 40 CFR, Part 51, Section 93.123 (5), CO, PM10, and PM2.5 hot spot analyses are not required for construction-related activities, which create a temporary increase in air emissions. Temporary is defined as increases that only occur during a construction phase and last five years or less at any individual site. The construction phase of the Proposed Project would last for approximately one year
Page 38
and would be considered temporary. Thus, no local hot spot is anticipated, and a hot spot analysis is not required for construction of the Proposed Project.
Diesel particulate emissions are pollutants of concern, as described in Section 2.7 of this report. While there is no formal guidance for construction impact analysis, potential adverse impacts would be increased if construction equipment and truck staging areas were to be located near schools, active recreation areas, or areas of higher population density. There are no active recreational areas along the existing or future alignment. However, several measures to reduce emission and potential exposure issues have been identified in Section 7.0.
Construction Odor
Sources of odor during Proposed Project construction would be exhaust fumes from diesel-fueled construction equipment and haul trucks, as well as emissions associated with asphalt paving. These odors may be considered offensive to some individuals. However, these odors would be temporary, would disperse rapidly with distance from the source, and would not affect a substantial number of people off-site. As a result, short-term construction odors at off-site land uses would be less than considerable.
Construction Toxic Air Contaminants
Construction activities would result in short-term emissions of diesel particulate matter (DPM) from off-road heavy-duty diesel equipment exhaust and diesel-fueled haul trucks. Diesel PM was identified as a TAC by ARB in 1998.
Health risks associated with exposure of sensitive receptors to TAC emissions are typically based on the concentration of a substance or substances in the environment (dose) and the duration of exposure to the substance(s). Dose is positively correlated with time, meaning that a longer exposure period would result in a higher exposure level for the maximally exposed individual. Thus, the risks estimated for a maximally exposed individual are higher if a fixed exposure occurs over a longer period of time. According to the California Office of Environmental Health Hazard Assessment, health risk assessments, which determine the exposure of sensitive receptors to TAC emissions, should be based on a 70-year exposure period. Proposed Project construction, however, would occur over a much shorter period of time; use of off-road heavy-duty diesel equipment would be temporary, and diesel PM emissions would disperse rapidly with distance from the source. Construction-related TAC emissions would not expose sensitive receptors to substantial concentrations of TACs and impacts would be less than considerable.
Page 39
7.0 Pollution Abatement Measures
No adverse air quality impacts from construction are anticipated because construction would be conducted in accordance with Caltrans Standard Specifications Section 14-9.01. Construction air emissions would be short-term, i.e. less than 5 years. Further, implementing the following measures would minimize the temporary air quality impacts from construction:
Minimize land disturbance.
Use watering trucks to minimize dust; watering should be sufficient to confine dust plumes to the project work areas.
Suspend grading and earth moving when wind gusts exceed 25 miles per hour unless the soil is wet enough to prevent dust plumes.
Cover all trucks hauling dirt when traveling at speeds greater than 15 miles per hour.
Stabilize the surface of dirt piles if not removed within two days.
Limit vehicular paths on unpaved surfaces and stabilize any temporary roads.
Minimize unnecessary vehicular and machinery activities.
Sweep paved streets at least once per day where there is evidence of dirt that has been carried on to the roadway.
Revegetate disturbed land, including vehicular paths created during construction to avoid future off-road vehicular activities.
Remove unused material.
It is recommended that the following measures be incorporated into the Proposed Project to minimize exposure to diesel particulate emissions.
Locate construction equipment and truck staging and maintenance areas as far as feasible and nominally downwind of schools, active recreation areas, and other areas of high population density.
Page 40
8.0 References
California Air Resources Board (CARB) 2001 Information on diesel particulate classification and programs. Available at www.arb.ca.gov. 2007 California State Implementation Plan (SIP). Available at http://www.arb.
ca.gov/planning/sip/sip.htm. Accessed on May 28, 2013. 2013a California Ambient Air Quality Standards (CAAQS), June 7, 2012. Available at
http://www.arb.ca.gov/aqs/aaqs2.pdf. Accessed May 28, 2013. 2013b 2012 State Area Designations, effective April 1, 2013. Available at
http://www.arb.ca.gov/desig/adm/adm.htm. Accessed May 28, 2013. 2013c Air Quality Data. Available at http://www.arb.ca.gov/aqd/aqdpage.htm. Accessed May 28,
2013. California Department of Conservation (CDC) 2000 A General Location Guide for Ultramafic Rocks in California – Areas More Likely to Contain
Naturally Occurring Asbestos, California Department of Conservation, Geological Surveys. Available at ftp://ftp.consrv.ca.gov/ pub/dmg/pubs/ofr/ofr_2000-019.pdf.
California Department of Transportation (Caltrans) 2003 Division of Environmental Analysis, Air Quality, CO Protocol. Available at
http://www.dot.ca.gov/hq/env/air/coprot.htm. Federal Register 2007 Federal Register, Vol. 72, No. 37, page 8430, February 26 Kimley-Horn and Associates, Inc. 2013 Draft Traffic Impact Study State Route 94 Improvement Project, March.
San Diego Association of Governments (SANDAG) 2011 2050 Regional Transportation Plan: Our Region. Our Future. Available at:
http://www.sandag.org/index.asp?projectid=349andfuseaction=projects.detail. October 28. 2012 2012 Regional Transportation Improvement Program. Available at
http://www.sandag.org/index.asp?projectid=410andfuseaction=projects.detail. September 28.
Page 41
U.S. Department of Transportation, Federal Highway Administration (FHWA) 2006 PM2.5 and PM10 Hot-Spot Analyses in Project-Level Transportation Conformity
Determination as for the New PM2.5 and Existing PM10 National Ambient Air Quality Standards, Final Rule, March 10.
2010 Transportation Conformity Guidance for Quantitative Hot-spot Analyses in PM2.5 and PM10
Nonattainment and Maintenance Areas, March 2011 Letter to Mr. Gary Gallegos, Executive Director, San Diego Association of Governments,
Subject: Conformity Determination for SANDAG’s 2050 RTP. December 2. 2012a Letter to Mr. Gary Gallegos, Executive Director, San Diego Association of Governments,
Subject: Conformity Determination for SANDAG’s 2012 RTIP. December 13. 2012b Memorandum: Interim Guidance Update on Mobile Source Air Toxic Analysis in NEPA.
December 6. Available at http://www.fhwa.dot.gov/environment/ air_quality/air_toxics/policy_and_guidance/aqintguidmem.cfm.
U.S. Environmental Protection Agency (USEPA) 1996 EPA Takes Final Step in Phaseout of Leaded Gasoline. January 29. 2013a Six Common Pollutants, Particulate Matter. Available at http://www.epa.gov/
air/particlepollution/index.html. 2013b Green Book. Available at http://www.epa.gov/air/oaqps/greenbk/. Accessed April 16, 2008. University of California, Davis. Institute of Transportation Studies 1997 Transportation Project-Level Carbon Monoxide Protocol (UCD-ITS-RR-97-21). December. Western Region Climatic Center 2013 Monthly Climate Summary, Escondido, California. Available at http://www.
wrcc.dri.edu/cgi-bin/cliMAIN.pl?ca2862. Accessed May 28.


This page is intentionally blank.

ATTACHMENTS

This page is intentionally blank.
ATTACHMENT 1
CO Protocol Flow Chart

This page is intentionally blank.
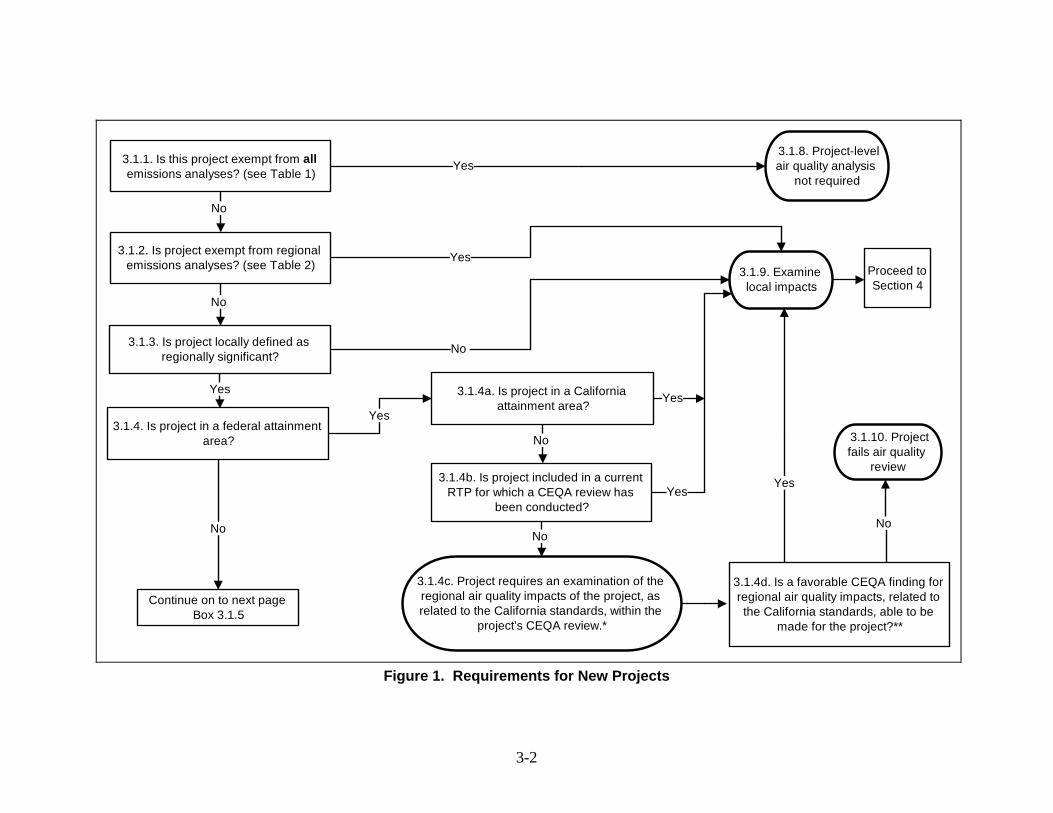
3.1.1. Is this project exempt from all emissions analyses? (see Table 1)
3.1.8. Project-level air quality analysis
not requiredYes
3.1.4. Is project in a federal attainment area?
3.1.3. Is project locally defined as regionally significant?
3.1.2. Is project exempt from regional emissions analyses? (see Table 2) 3.1.9. Examine
local impacts
No
No
No
Yes
Proceed to Section 4
3.1.4a. Is project in a California attainment area?
3.1.4b. Is project included in a current RTP for which a CEQA review has
been conducted?
3.1.4c. Project requires an examination of the regional air quality impacts of the project, as related to the California standards, within the
project's CEQA review.*
3.1.4d. Is a favorable CEQA finding for regional air quality impacts, related to the California standards, able to be
made for the project?**
3.1.10. Project fails air quality
review
No
Yes
No
No No
Yes
Continue on to next page Box 3.1.5
Yes
Yes
Yes
Figure 1. Requirements for New Projects
3-2
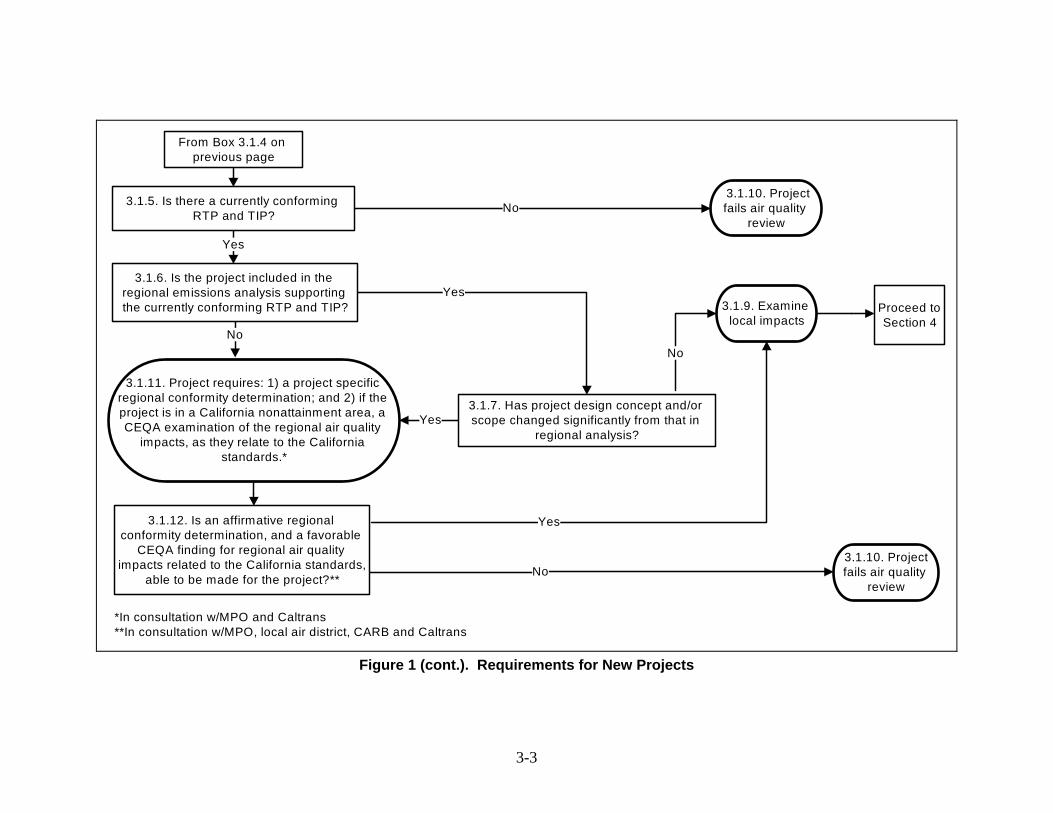
3-3
3.1.6. Is the project included in the regional emissions analysis supporting the currently conforming RTP and TIP?
3.1.5. Is there a currently conforming RTP and TIP?
3.1.10. Project fails air quality
review
3.1.7. Has project design concept and/or scope changed significantly from that in
regional analysis?
3.1.10. Project fails air quality
review
3.1.12. Is an affirmative regional conformity determination, and a favorable
CEQA finding for regional air quality impacts related to the California standards,
able to be made for the project?**
3.1.11. Project requires: 1) a project specific regional conformity determination; and 2) if the project is in a California nonattainment area, a CEQA examination of the regional air quality
impacts, as they relate to the California standards.*
*In consultation w/MPO and Caltrans **In consultation w/MPO, local air district, CARB and Caltrans
3.1.9. Examine local impacts
Proceed to Section 4
From Box 3.1.4 on previous page
Yes
Yes
No
Yes
Yes
No
No
No
Figure 1 (cont.). Requirements for New Projects
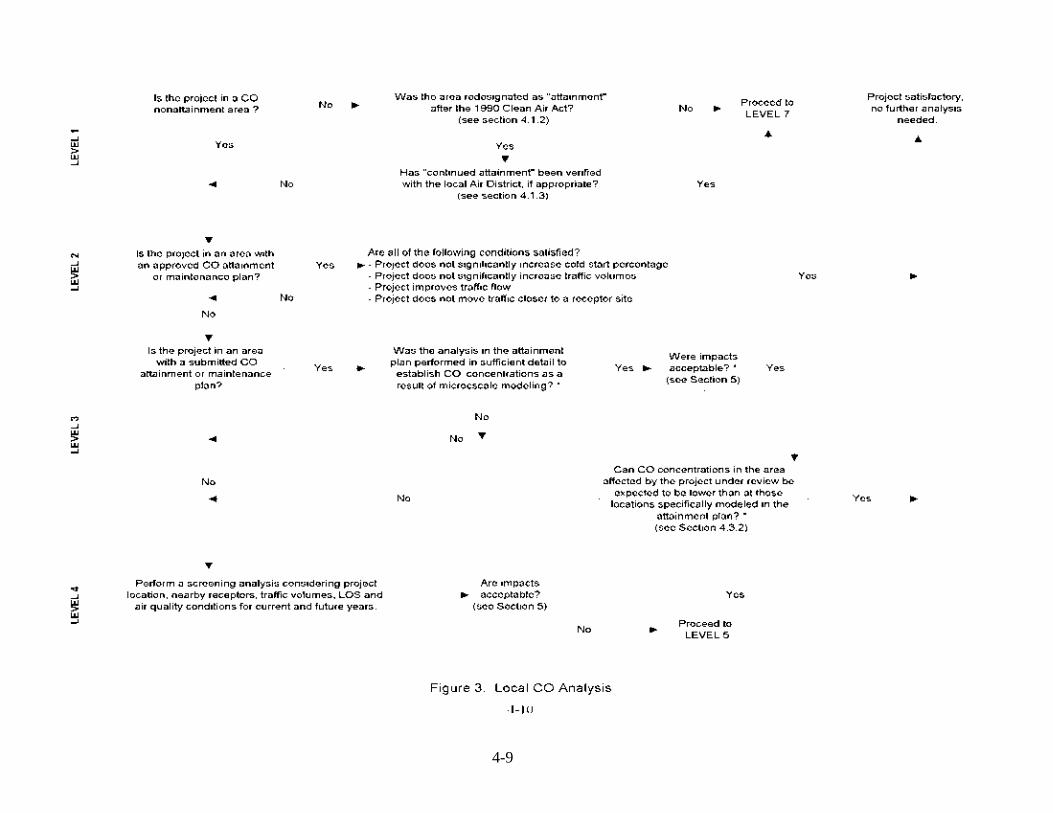
4-9
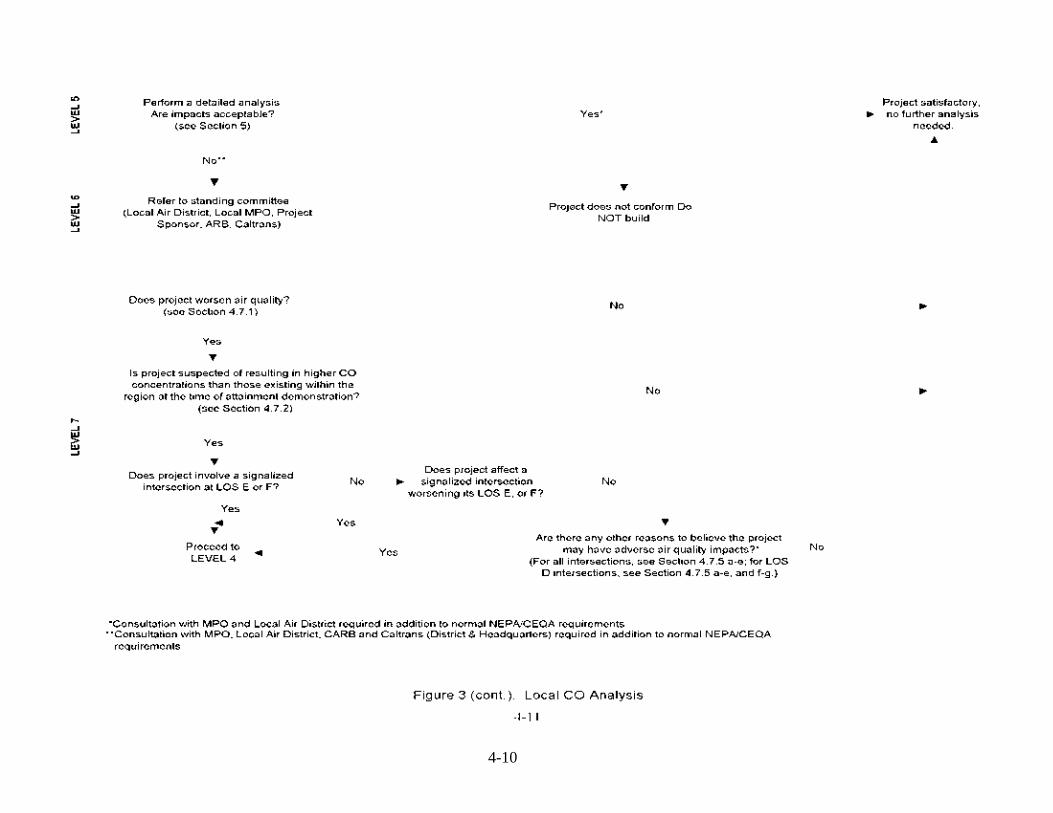
4-10
ATTACHMENT 2
Caline4 Modeling Output

This page is intentionally blank.
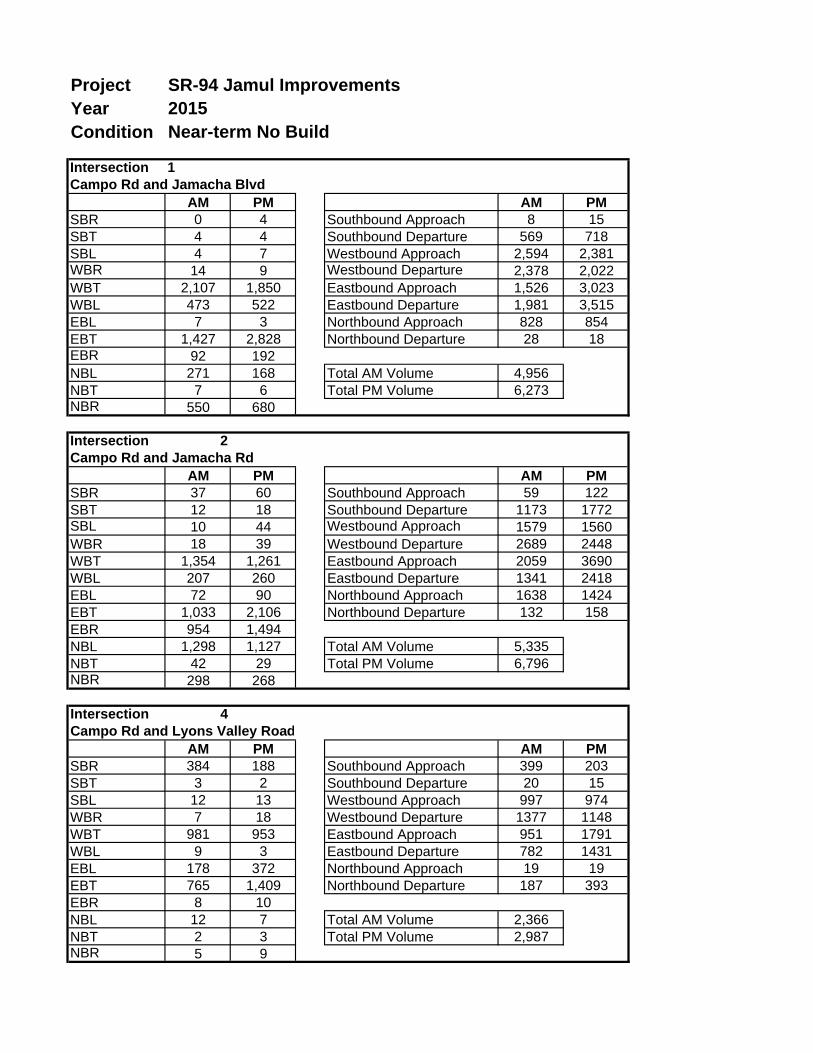
Project SR-94 Jamul ImprovementsYearCondition
Intersection 1Campo Rd and Jamacha Blvd
AM PM AM PMSBR 0 4 Southbound Approach 8 15SBT 4 4 Southbound Departure 569 718SBL 4 7 Westbound Approach 2,594 2,381WBR 14 9 Westbound Departure 2,378 2,022WBT 2,107 1,850 Eastbound Approach 1,526 3,023WBL 473 522 Eastbound Departure 1,981 3,515EBL 7 3 Northbound Approach 828 854EBT 1,427 2,828 Northbound Departure 28 18EBR 92 192NBL 271 168 Total AM Volume 4,956NBT 7 6 Total PM Volume 6,273NBR 550 680
Intersection 2Campo Rd and Jamacha Rd
AM PM AM PMSBR 37 60 Southbound Approach 59 122SBT 12 18 Southbound Departure 1173 1772SBL 10 44 Westbound Approach 1579 1560WBR 18 39 Westbound Departure 2689 2448WBT 1,354 1,261 Eastbound Approach 2059 3690WBL 207 260 Eastbound Departure 1341 2418EBL 72 90 Northbound Approach 1638 1424EBT 1,033 2,106 Northbound Departure 132 158EBR 954 1,494NBL 1,298 1,127 Total AM Volume 5,335NBT 42 29 Total PM Volume 6,796NBR 298 268
Intersection 4Campo Rd and Lyons Valley Road
AM PM AM PMSBR 384 188 Southbound Approach 399 203SBT 3 2 Southbound Departure 20 15SBL 12 13 Westbound Approach 997 974WBR 7 18 Westbound Departure 1377 1148WBT 981 953 Eastbound Approach 951 1791WBL 9 3 Eastbound Departure 782 1431EBL 178 372 Northbound Approach 19 19EBT 765 1,409 Northbound Departure 187 393EBR 8 10NBL 12 7 Total AM Volume 2,366NBT 2 3 Total PM Volume 2,987NBR 5 9
2015Near-term No Build
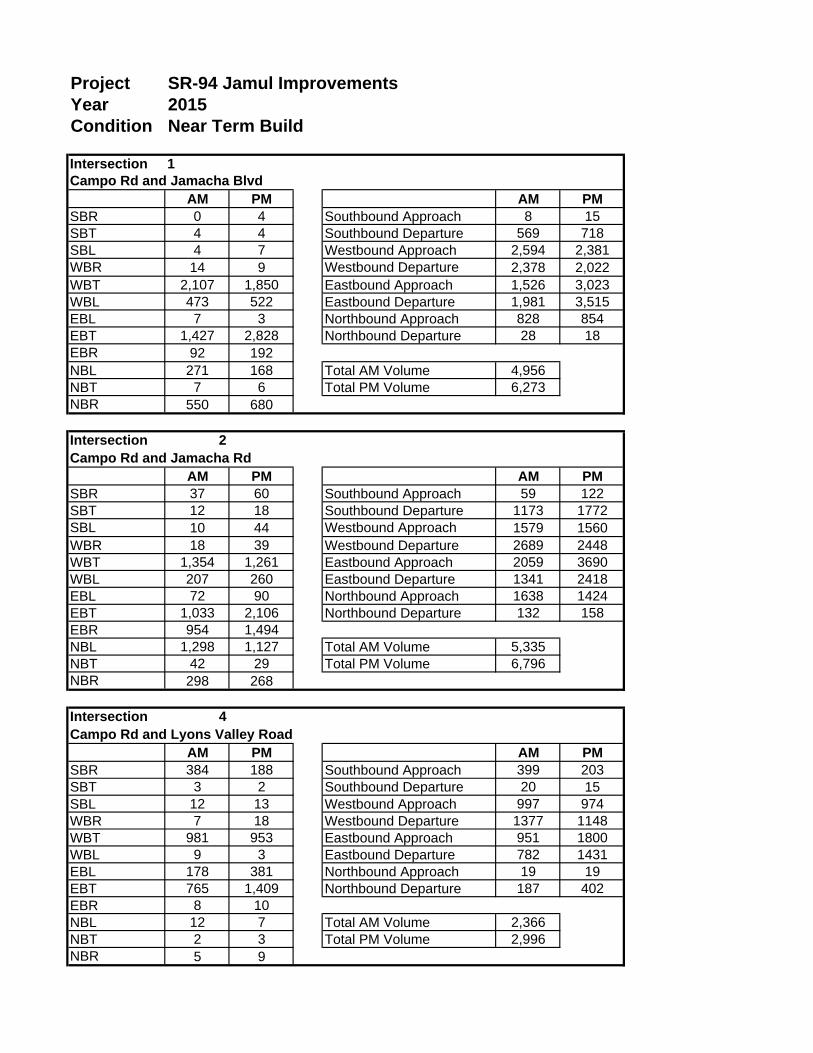
Project SR-94 Jamul ImprovementsYearCondition
Intersection 1Campo Rd and Jamacha Blvd
AM PM AM PMSBR 0 4 Southbound Approach 8 15SBT 4 4 Southbound Departure 569 718SBL 4 7 Westbound Approach 2,594 2,381WBR 14 9 Westbound Departure 2,378 2,022WBT 2,107 1,850 Eastbound Approach 1,526 3,023WBL 473 522 Eastbound Departure 1,981 3,515EBL 7 3 Northbound Approach 828 854EBT 1,427 2,828 Northbound Departure 28 18EBR 92 192NBL 271 168 Total AM Volume 4,956NBT 7 6 Total PM Volume 6,273NBR 550 680
Intersection 2Campo Rd and Jamacha Rd
AM PM AM PMSBR 37 60 Southbound Approach 59 122SBT 12 18 Southbound Departure 1173 1772SBL 10 44 Westbound Approach 1579 1560WBR 18 39 Westbound Departure 2689 2448WBT 1,354 1,261 Eastbound Approach 2059 3690WBL 207 260 Eastbound Departure 1341 2418EBL 72 90 Northbound Approach 1638 1424EBT 1,033 2,106 Northbound Departure 132 158EBR 954 1,494NBL 1,298 1,127 Total AM Volume 5,335NBT 42 29 Total PM Volume 6,796NBR 298 268
Intersection 4Campo Rd and Lyons Valley Road
AM PM AM PMSBR 384 188 Southbound Approach 399 203SBT 3 2 Southbound Departure 20 15SBL 12 13 Westbound Approach 997 974WBR 7 18 Westbound Departure 1377 1148WBT 981 953 Eastbound Approach 951 1800WBL 9 3 Eastbound Departure 782 1431EBL 178 381 Northbound Approach 19 19EBT 765 1,409 Northbound Departure 187 402EBR 8 10NBL 12 7 Total AM Volume 2,366NBT 2 3 Total PM Volume 2,996NBR 5 9
2015Near Term Build

Project SR-94 Jamul ImprovementsYearCondition
Intersection 1Campo Rd and Jamacha Blvd
AM PM AM PMSBR 0 7 Southbound Approach 10 19SBT 6 6 Southbound Departure 778 992SBL 4 6 Westbound Approach 2,793 2,425WBR 14 8 Westbound Departure 2,757 2,226WBT 2,214 1,847 Eastbound Approach 1,651 3,277WBL 565 570 Eastbound Departure 2,022 3,636EBL 13 7 Northbound Approach 1,141 1,158EBT 1,431 2,854 Northbound Departure 38 25EBR 207 416NBL 543 372 Total AM Volume 5,595NBT 11 10 Total PM Volume 6,879NBR 587 776
Intersection 2Campo Rd and Jamacha Rd
AM PM AM PMSBR 38 62 Southbound Approach 87 202SBT 22 29 Southbound Departure 1384 2114SBL 27 111 Westbound Approach 2426 2445WBR 50 107 Westbound Departure 3295 2875WBT 1,937 1,719 Eastbound Approach 2390 4508WBL 439 619 Eastbound Departure 2092 3668EBL 75 93 Northbound Approach 2068 1747EBT 1,392 2,949 Northbound Departure 200 245EBR 923 1,466NBL 1,320 1,094 Total AM Volume 6,971NBT 75 45 Total PM Volume 8,902NBR 673 608
Intersection 4Campo Rd and Lyons Valley Road
AM PM AM PMSBR 399 195 Southbound Approach 438 231SBT 7 6 Southbound Departure 27 22SBL 32 30 Westbound Approach 1054 963WBR 21 46 Westbound Departure 1431 1111WBT 1,020 910 Eastbound Approach 916 1768WBL 13 7 Eastbound Departure 768 1420EBL 185 386 Northbound Approach 26 26EBT 724 1,373 Northbound Departure 208 435EBR 7 9NBL 12 6 Total AM Volume 2,434NBT 2 3 Total PM Volume 2,988NBR 12 17
2035Horizon No Build

Project SR-94 Jamul ImprovementsYearCondition
Intersection 2Campo Rd and Jamacha Blvd
AM PM AM PMSBR 0 7 Southbound Approach 10 19SBT 6 6 Southbound Departure 778 992SBL 4 6 Westbound Approach 2,793 2,425WBR 14 8 Westbound Departure 2,757 2,226WBT 2,214 1,847 Eastbound Approach 1,651 3,277WBL 565 570 Eastbound Departure 2,022 3,636EBL 13 7 Northbound Approach 1,141 1,158EBT 1,431 2,854 Northbound Departure 38 25EBR 207 416NBL 543 372 Total AM Volume 5,595NBT 11 10 Total PM Volume 6,879NBR 587 776
Intersection 3Campo Rd and Jamacha Rd
AM PM AM PMSBR 38 62 Southbound Approach 87 202SBT 22 29 Southbound Departure 1384 2114SBL 27 111 Westbound Approach 2426 2445WBR 50 107 Westbound Departure 3295 2875WBT 1,937 1,719 Eastbound Approach 2390 4508WBL 439 619 Eastbound Departure 2092 3668EBL 75 93 Northbound Approach 2068 1747EBT 1,392 2,949 Northbound Departure 200 245EBR 923 1,466NBL 1,320 1,094 Total AM Volume 6,971NBT 75 45 Total PM Volume 8,902NBR 673 608
Intersection 6Campo Rd and Lyons Valley Road
AM PM AM PMSBR 399 195 Southbound Approach 438 231SBT 7 6 Southbound Departure 27 22SBL 32 30 Westbound Approach 1054 963WBR 21 46 Westbound Departure 1431 1111WBT 1,020 910 Eastbound Approach 916 1768WBL 13 7 Eastbound Departure 768 1420EBL 185 386 Northbound Approach 26 26EBT 724 1,373 Northbound Departure 208 435EBR 7 9NBL 12 6 Total AM Volume 2,434NBT 2 3 Total PM Volume 2,988NBR 12 17
2035Horizon Build

2015_AM_Build_LV.ou1
CALINE4: CALIFORNIA LINE SOURCE DISPERSION MODEL JUNE 1989 VERSION PAGE 1
JOB: SR-94 Improvements RUN: 2015 AM B LV (WORST CASE ANGLE) POLLUTANT: Carbon Monoxide
I. SITE VARIABLES
U= 0.5 M/S Z0= 10. CM ALT= 224. (M) BRG= WORST CASE VD= 0.0 CM/S CLAS= 7 (G) VS= 0.0 CM/S MIXH= 1000. M AMB= 2.4 PPM SIGTH= 5. DEGREES TEMP= 1.9 DEGREE (C)
II. LINK VARIABLES
LINK * LINK COORDINATES (M) * EF H W DESCRIPTION * X1 Y1 X2 Y2 * TYPE VPH (G/MI) (M) (M) ----------------*-------------------------*------------------------------ A. Link_1 * ***** ***** ***** ***** * AG 951 21.6 0.0 14.5 B. Link_2 * ***** ***** ***** ***** * AG 951 21.6 0.0 14.5 C. Link_3 * ***** ***** ***** ***** * AG 951 21.6 0.0 14.5 D. Link_4 * ***** ***** ***** ***** * AG 782 3.8 0.0 9.6 E. Link_5 * ***** ***** ***** ***** * AG 782 3.8 0.0 9.6 F. Link_6 * ***** ***** ***** ***** * AG 782 3.8 0.0 9.6 G. Link_7 * ***** ***** ***** ***** * AG 997 21.6 0.0 14.5 H. Link_8 * ***** ***** ***** ***** * AG 997 21.6 0.0 14.5 I. Link_9 * ***** ***** ***** ***** * AG 997 21.6 0.0 14.5 J. Link_10 * ***** ***** ***** ***** * AG 1377 3.8 0.0 9.6 K. Link_11 * ***** ***** ***** ***** * AG 1377 3.8 0.0 9.6 L. Link_12 * ***** ***** ***** ***** * AG 1377 3.8 0.0 9.6 M. Link_13 * ***** ***** ***** ***** * AG 19 21.6 0.0 9.6 N. Link_14 * ***** ***** ***** ***** * AG 187 3.8 0.0 9.6 O. Link_15 * ***** ***** ***** ***** * AG 187 3.8 0.0 9.6
Page 1

2015_AM_Build_LV.ou1 P. Link_16 * ***** ***** ***** ***** * AG 187 3.8 0.0 9.6 Q. Link_17 * ***** ***** ***** ***** * AG 187 3.8 0.0 9.6 R. Link_18 * ***** ***** ***** ***** * AG 187 3.8 0.0 9.6 S. Link_19 * ***** ***** ***** ***** * AG 187 3.8 0.0 9.6 T. Link_20 * ***** ***** ***** ***** * AG 399 21.6 0.0 9.6 U. Link_21 * ***** ***** ***** ***** * AG 399 21.6 0.0 9.6 V. Link_22 * ***** ***** ***** ***** * AG 399 21.6 0.0 9.6 W. Link_23 * ***** ***** ***** ***** * AG 399 21.6 0.0 9.6 X. Link_24 * ***** ***** ***** ***** * AG 399 21.6 0.0 9.6 Y. Link_25 * ***** ***** ***** ***** * AG 399 21.6 0.0 9.6 Z. Link_26 * ***** ***** ***** ***** * AG 399 21.6 0.0 9.6 a. Link_27 * ***** ***** ***** ***** * AG 20 3.8 0.0 9.6
1
CALINE4: CALIFORNIA LINE SOURCE DISPERSION MODEL JUNE 1989 VERSION PAGE 2
JOB: SR-94 Improvements RUN: 2015 AM B LV (WORST CASE ANGLE) POLLUTANT: Carbon Monoxide
III. RECEPTOR LOCATIONS
* COORDINATES (M) RECEPTOR * X Y Z ------------*--------------------- 1. R_001_NW * 511221 ****** 1.8 2. R_002_SW * 511206 ****** 1.8 3. R_003_SE * 511228 ****** 1.8 4. R_004_NE * 511245 ****** 1.8 5. R_005_DC * 511210 ****** 1.8 6. R_006_Co * 511186 ****** 1.8
IV. MODEL RESULTS (WORST CASE WIND ANGLE )
Page 2

2015_AM_Build_LV.ou1
* * PRED * CONC/LINK * BRG * CONC * (PPM) RECEPTOR * (DEG) * (PPM) * A B C D E F G H -------------*-------*-------*---------------------------------------- 1. R_001_NW * 138. * 5.3 * 0.0 0.0 0.0 0.0 0.2 0.0 0.1 0.5 2. R_002_SW * 123. * 5.9 * 0.0 0.0 0.5 0.1 0.4 0.0 0.1 0.6 3. R_003_SE * 320. * 6.4 * 0.1 0.2 2.9 0.2 0.0 0.0 0.0 0.0 4. R_004_NE * 138. * 4.7 * 0.0 0.0 0.0 0.0 0.2 0.0 0.1 0.9 5. R_005_DC * 336. * 3.5 * 0.0 0.1 0.8 0.0 0.0 0.0 0.0 0.0 6. R_006_Co * 124. * 5.9 * 0.0 0.0 0.8 0.1 0.3 0.0 0.1 0.5
* CONC/LINK RECEPTOR * I J K L M N O P Q R S T U V W X Y Z a ------------*----------------------------------------------------------------------------------------------- 1. R_001_NW * 1.7 0.0 0.0 0.0 0.0 0.0 0.0 0.0 0.0 0.0 0.0 0.0 0.0 0.0 0.0 0.0 0.0 0.4 0.0 2. R_002_SW * 1.7 0.0 0.0 0.0 0.0 0.0 0.0 0.0 0.0 0.0 0.0 0.0 0.0 0.0 0.0 0.0 0.0 0.0 0.0 3. R_003_SE * 0.0 0.2 0.1 0.0 0.0 0.0 0.0 0.0 0.0 0.0 0.0 0.0 0.0 0.0 0.0 0.0 0.0 0.0 0.0 4. R_004_NE * 1.2 0.0 0.0 0.0 0.0 0.0 0.0 0.0 0.0 0.0 0.0 0.0 0.0 0.0 0.0 0.0 0.0 0.0 0.0 5. R_005_DC * 0.0 0.1 0.1 0.0 0.0 0.0 0.0 0.0 0.0 0.0 0.0 0.0 0.0 0.0 0.0 0.0 0.0 0.0 0.0 6. R_006_Co * 1.7 0.0 0.0 0.0 0.0 0.0 0.0 0.0 0.0 0.0 0.0 0.0 0.0 0.0 0.0 0.0 0.0 0.0 0.0
1EXIT
Page 3

2015_PM_Build_LV.ou1
CALINE4: CALIFORNIA LINE SOURCE DISPERSION MODEL JUNE 1989 VERSION PAGE 1
JOB: SR-94 Improvements RUN: 2015 PM B LV (WORST CASE ANGLE) POLLUTANT: Carbon Monoxide
I. SITE VARIABLES
U= 0.5 M/S Z0= 10. CM ALT= 224. (M) BRG= WORST CASE VD= 0.0 CM/S CLAS= 7 (G) VS= 0.0 CM/S MIXH= 1000. M AMB= 2.4 PPM SIGTH= 5. DEGREES TEMP= 1.9 DEGREE (C)
II. LINK VARIABLES
LINK * LINK COORDINATES (M) * EF H W DESCRIPTION * X1 Y1 X2 Y2 * TYPE VPH (G/MI) (M) (M) ----------------*-------------------------*------------------------------ A. Link_1 * ***** ***** ***** ***** * AG 1800 21.6 0.0 14.5 B. Link_2 * ***** ***** ***** ***** * AG 1800 21.6 0.0 14.5 C. Link_3 * ***** ***** ***** ***** * AG 1800 21.6 0.0 14.5 D. Link_4 * ***** ***** ***** ***** * AG 1431 3.8 0.0 9.6 E. Link_5 * ***** ***** ***** ***** * AG 1431 3.8 0.0 9.6 F. Link_6 * ***** ***** ***** ***** * AG 1431 3.8 0.0 9.6 G. Link_7 * ***** ***** ***** ***** * AG 974 21.6 0.0 14.5 H. Link_8 * ***** ***** ***** ***** * AG 974 21.6 0.0 14.5 I. Link_9 * ***** ***** ***** ***** * AG 974 21.6 0.0 14.5 J. Link_10 * ***** ***** ***** ***** * AG 1148 3.8 0.0 9.6 K. Link_11 * ***** ***** ***** ***** * AG 1148 3.8 0.0 9.6 L. Link_12 * ***** ***** ***** ***** * AG 1148 3.8 0.0 9.6 M. Link_13 * ***** ***** ***** ***** * AG 19 21.6 0.0 9.6 N. Link_14 * ***** ***** ***** ***** * AG 402 3.8 0.0 9.6 O. Link_15 * ***** ***** ***** ***** * AG 402 3.8 0.0 9.6 P. Link_16 * ***** ***** ***** ***** * AG 402 3.8 0.0 9.6 Q. Link_17 * ***** ***** ***** ***** * AG 402 3.8 0.0 9.6 R. Link_18 * ***** ***** ***** ***** * AG 402 3.8 0.0 9.6 S. Link_19 * ***** ***** ***** ***** * AG 402 3.8 0.0 9.6
Page 1
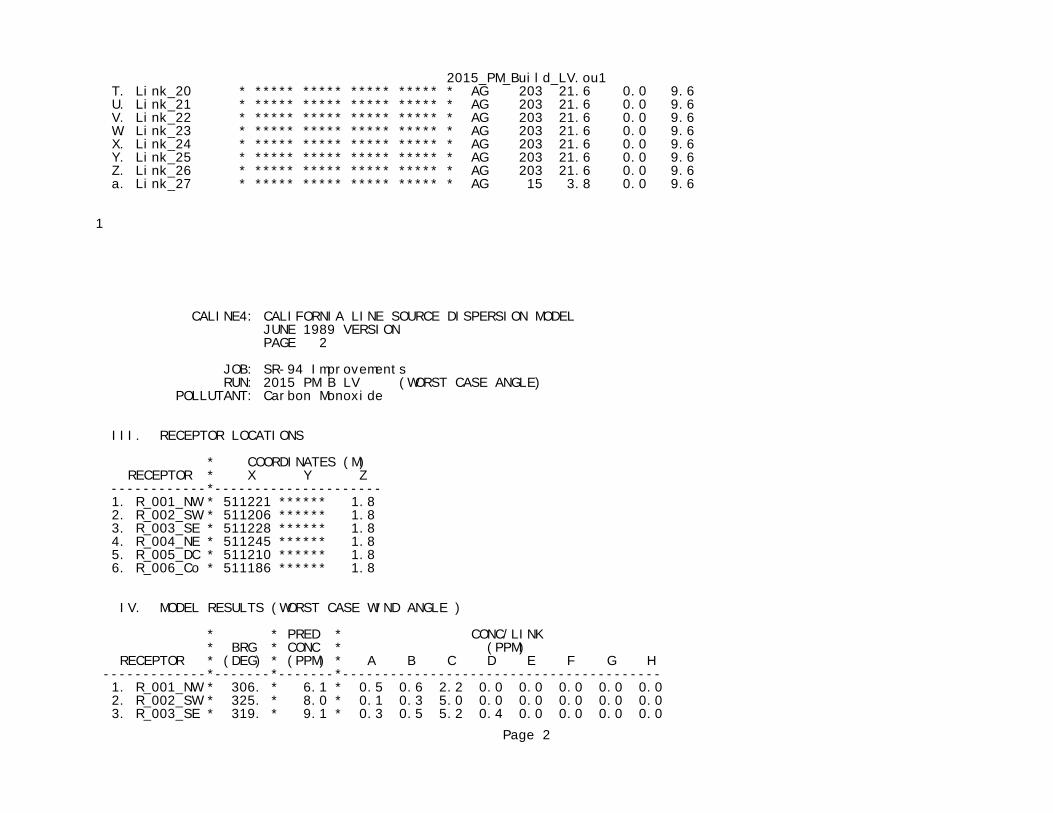
2015_PM_Build_LV.ou1 T. Link_20 * ***** ***** ***** ***** * AG 203 21.6 0.0 9.6 U. Link_21 * ***** ***** ***** ***** * AG 203 21.6 0.0 9.6 V. Link_22 * ***** ***** ***** ***** * AG 203 21.6 0.0 9.6 W. Link_23 * ***** ***** ***** ***** * AG 203 21.6 0.0 9.6 X. Link_24 * ***** ***** ***** ***** * AG 203 21.6 0.0 9.6 Y. Link_25 * ***** ***** ***** ***** * AG 203 21.6 0.0 9.6 Z. Link_26 * ***** ***** ***** ***** * AG 203 21.6 0.0 9.6 a. Link_27 * ***** ***** ***** ***** * AG 15 3.8 0.0 9.6
1
CALINE4: CALIFORNIA LINE SOURCE DISPERSION MODEL JUNE 1989 VERSION PAGE 2
JOB: SR-94 Improvements RUN: 2015 PM B LV (WORST CASE ANGLE) POLLUTANT: Carbon Monoxide
III. RECEPTOR LOCATIONS
* COORDINATES (M) RECEPTOR * X Y Z ------------*--------------------- 1. R_001_NW * 511221 ****** 1.8 2. R_002_SW * 511206 ****** 1.8 3. R_003_SE * 511228 ****** 1.8 4. R_004_NE * 511245 ****** 1.8 5. R_005_DC * 511210 ****** 1.8 6. R_006_Co * 511186 ****** 1.8
IV. MODEL RESULTS (WORST CASE WIND ANGLE )
* * PRED * CONC/LINK * BRG * CONC * (PPM) RECEPTOR * (DEG) * (PPM) * A B C D E F G H -------------*-------*-------*---------------------------------------- 1. R_001_NW * 306. * 6.1 * 0.5 0.6 2.2 0.0 0.0 0.0 0.0 0.0 2. R_002_SW * 325. * 8.0 * 0.1 0.3 5.0 0.0 0.0 0.0 0.0 0.0 3. R_003_SE * 319. * 9.1 * 0.3 0.5 5.2 0.4 0.0 0.0 0.0 0.0
Page 2

2015_PM_Build_LV.ou1 4. R_004_NE * 306. * 5.8 * 0.3 0.4 2.0 0.0 0.0 0.0 0.0 0.0 5. R_005_DC * 336. * 4.1 * 0.0 0.1 1.4 0.0 0.0 0.0 0.0 0.0 6. R_006_Co * 123. * 6.7 * 0.0 0.0 1.6 0.1 0.3 0.0 0.1 0.4
* CONC/LINK RECEPTOR * I J K L M N O P Q R S T U V W X Y Z a ------------*----------------------------------------------------------------------------------------------- 1. R_001_NW * 0.0 0.4 0.1 0.0 0.0 0.0 0.0 0.0 0.0 0.0 0.0 0.0 0.0 0.0 0.0 0.0 0.0 0.0 0.0 2. R_002_SW * 0.0 0.2 0.1 0.0 0.0 0.0 0.0 0.0 0.0 0.0 0.0 0.0 0.0 0.0 0.0 0.0 0.0 0.0 0.0 3. R_003_SE * 0.0 0.1 0.1 0.0 0.0 0.0 0.0 0.0 0.0 0.0 0.0 0.0 0.0 0.0 0.0 0.0 0.0 0.0 0.0 4. R_004_NE * 0.0 0.3 0.0 0.0 0.0 0.1 0.0 0.0 0.0 0.0 0.0 0.0 0.0 0.0 0.0 0.0 0.0 0.2 0.0 5. R_005_DC * 0.0 0.1 0.1 0.0 0.0 0.0 0.0 0.0 0.0 0.0 0.0 0.0 0.0 0.0 0.0 0.0 0.0 0.0 0.0 6. R_006_Co * 1.7 0.0 0.0 0.0 0.0 0.0 0.0 0.0 0.0 0.0 0.0 0.0 0.0 0.0 0.0 0.0 0.0 0.0 0.0
1EXIT
Page 3

2015_Build_JR_AM.ou1
CALINE4: CALIFORNIA LINE SOURCE DISPERSION MODEL JUNE 1989 VERSION PAGE 1
JOB: SR-94 Improvements RUN: 2015 AM B JR (WORST CASE ANGLE) POLLUTANT: Carbon Monoxide
I. SITE VARIABLES
U= 0.5 M/S Z0= 10. CM ALT= 0. (M) BRG= WORST CASE VD= 0.0 CM/S CLAS= 7 (G) VS= 0.0 CM/S MIXH= 1000. M AMB= 2.4 PPM SIGTH= 5. DEGREES TEMP= 1.9 DEGREE (C)
II. LINK VARIABLES
LINK * LINK COORDINATES (M) * EF H W DESCRIPTION * X1 Y1 X2 Y2 * TYPE VPH (G/MI) (M) (M) ----------------*-------------------------*------------------------------ A. Link_1 * ***** ***** ***** ***** * AG 2059 21.6 0.0 21.0 B. Link_2 * ***** ***** ***** ***** * AG 2059 21.6 0.0 21.0 C. Link_3 * ***** ***** ***** ***** * AG 2059 21.6 0.0 21.0 D. Link_4 * ***** ***** ***** ***** * AG 1341 3.8 0.0 21.0 E. Link_5 * ***** ***** ***** ***** * AG 1341 3.8 0.0 21.0 F. Link_6 * ***** ***** ***** ***** * AG 1341 3.8 0.0 21.0 G. Link_7 * ***** ***** ***** ***** * AG 1341 3.8 0.0 21.0 H. Link_8 * ***** ***** ***** ***** * AG 1372 21.6 0.0 21.0 I. Link_9 * ***** ***** ***** ***** * AG 1372 21.6 0.0 21.0 J. Link_10 * ***** ***** ***** ***** * AG 1372 21.6 0.0 21.0 K. Link_11 * ***** ***** ***** ***** * AG 1372 21.6 0.0 21.0 L. Link_12 * ***** ***** ***** ***** * AG 2689 3.8 0.0 21.0 M. Link_13 * ***** ***** ***** ***** * AG 2689 3.8 0.0 21.0 N. Link_14 * ***** ***** ***** ***** * AG 2689 3.8 0.0 21.0 O. Link_15 * ***** ***** ***** ***** * AG 72 21.6 0.0 8.5
Page 1
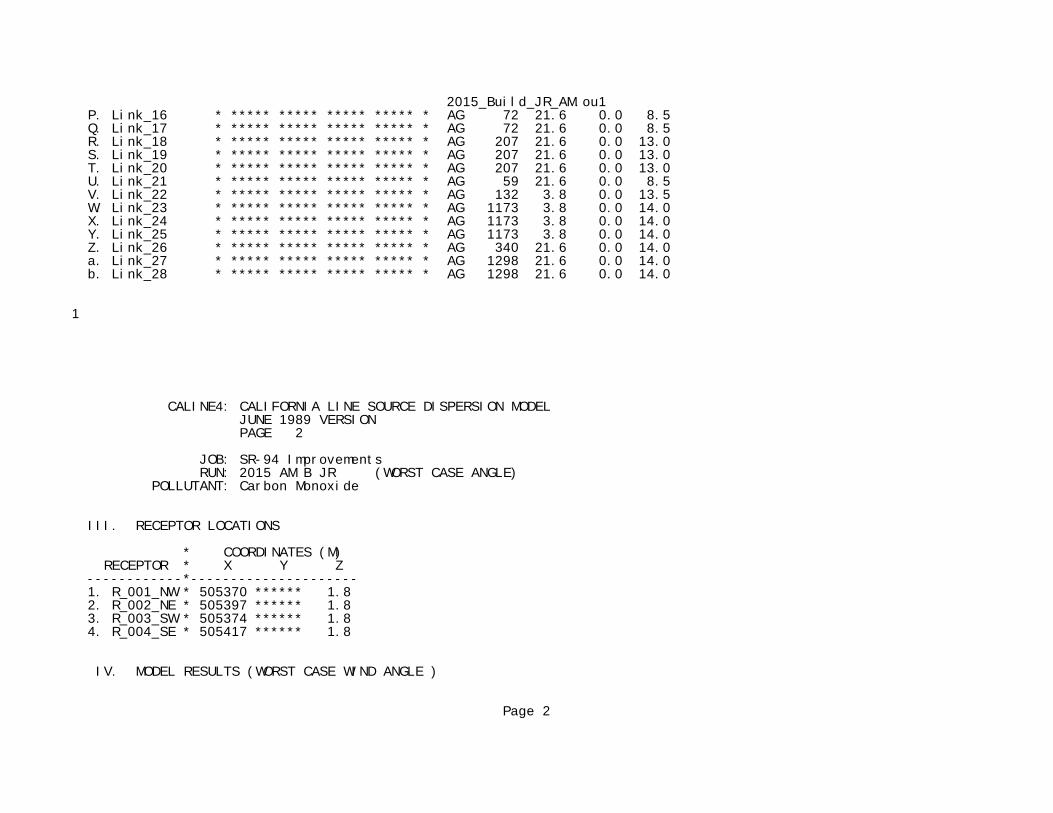
2015_Build_JR_AM.ou1 P. Link_16 * ***** ***** ***** ***** * AG 72 21.6 0.0 8.5 Q. Link_17 * ***** ***** ***** ***** * AG 72 21.6 0.0 8.5 R. Link_18 * ***** ***** ***** ***** * AG 207 21.6 0.0 13.0 S. Link_19 * ***** ***** ***** ***** * AG 207 21.6 0.0 13.0 T. Link_20 * ***** ***** ***** ***** * AG 207 21.6 0.0 13.0 U. Link_21 * ***** ***** ***** ***** * AG 59 21.6 0.0 8.5 V. Link_22 * ***** ***** ***** ***** * AG 132 3.8 0.0 13.5 W. Link_23 * ***** ***** ***** ***** * AG 1173 3.8 0.0 14.0 X. Link_24 * ***** ***** ***** ***** * AG 1173 3.8 0.0 14.0 Y. Link_25 * ***** ***** ***** ***** * AG 1173 3.8 0.0 14.0 Z. Link_26 * ***** ***** ***** ***** * AG 340 21.6 0.0 14.0 a. Link_27 * ***** ***** ***** ***** * AG 1298 21.6 0.0 14.0 b. Link_28 * ***** ***** ***** ***** * AG 1298 21.6 0.0 14.0
1
CALINE4: CALIFORNIA LINE SOURCE DISPERSION MODEL JUNE 1989 VERSION PAGE 2
JOB: SR-94 Improvements RUN: 2015 AM B JR (WORST CASE ANGLE) POLLUTANT: Carbon Monoxide
III. RECEPTOR LOCATIONS
* COORDINATES (M) RECEPTOR * X Y Z ------------*--------------------- 1. R_001_NW * 505370 ****** 1.8 2. R_002_NE * 505397 ****** 1.8 3. R_003_SW * 505374 ****** 1.8 4. R_004_SE * 505417 ****** 1.8
IV. MODEL RESULTS (WORST CASE WIND ANGLE )
Page 2

2015_Build_JR_AM.ou1 * * PRED * CONC/LINK * BRG * CONC * (PPM) RECEPTOR * (DEG) * (PPM) * A B C D E F G H -------------*-------*-------*---------------------------------------- 1. R_001_NW * 152. * 9.1 * 0.0 0.0 1.3 0.0 0.0 0.0 0.0 0.0 2. R_002_NE * 168. * 7.3 * 0.0 0.0 0.0 0.2 0.0 0.0 0.0 0.0 3. R_003_SW * 70. * 7.4 * 0.0 0.0 0.8 0.3 0.0 0.0 0.0 0.4 4. R_004_SE * 279. * 8.2 * 0.1 0.6 2.9 0.0 0.0 0.0 0.0 0.0
* CONC/LINK RECEPTOR * I J K L M N O P Q R S T U V W X Y Z a b ------------*---------------------------------------------------------------------------------------------------- 1. R_001_NW * 0.0 0.0 0.0 0.5 0.0 0.0 0.0 0.0 0.1 0.0 0.0 0.0 0.0 0.0 0.2 0.1 0.0 0.7 2.2 1.5 2. R_002_NE * 0.0 0.0 1.4 0.0 0.0 0.0 0.0 0.0 0.0 0.0 0.0 0.2 0.0 0.0 0.0 0.0 0.2 0.9 2.0 0.1 3. R_003_SW * 0.6 0.4 0.7 0.0 0.0 0.0 0.0 0.0 0.0 0.0 0.0 0.3 0.0 0.0 0.2 0.0 0.0 0.3 0.0 1.0 4. R_004_SE * 0.0 0.0 0.0 0.0 0.1 0.1 0.0 0.1 0.0 0.0 0.0 0.0 0.0 0.0 0.1 0.0 0.0 0.4 0.3 0.9
1EXIT
Page 3
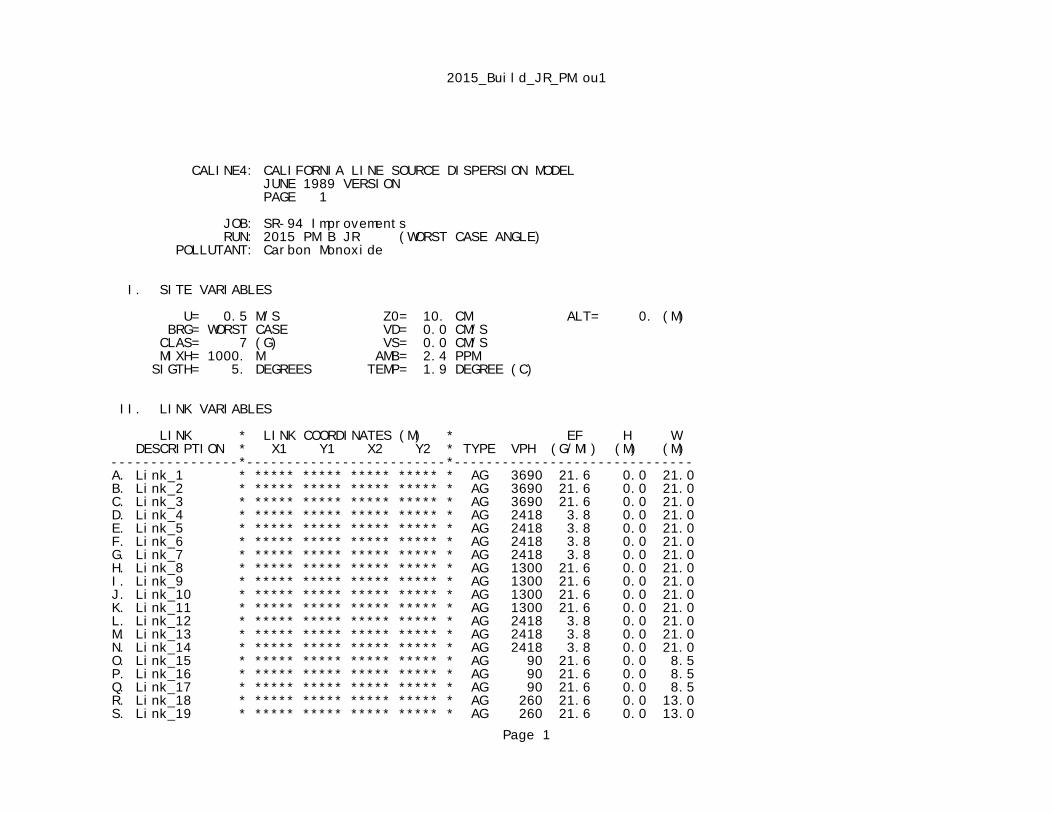
2015_Build_JR_PM.ou1
CALINE4: CALIFORNIA LINE SOURCE DISPERSION MODEL JUNE 1989 VERSION PAGE 1
JOB: SR-94 Improvements RUN: 2015 PM B JR (WORST CASE ANGLE) POLLUTANT: Carbon Monoxide
I. SITE VARIABLES
U= 0.5 M/S Z0= 10. CM ALT= 0. (M) BRG= WORST CASE VD= 0.0 CM/S CLAS= 7 (G) VS= 0.0 CM/S MIXH= 1000. M AMB= 2.4 PPM SIGTH= 5. DEGREES TEMP= 1.9 DEGREE (C)
II. LINK VARIABLES
LINK * LINK COORDINATES (M) * EF H W DESCRIPTION * X1 Y1 X2 Y2 * TYPE VPH (G/MI) (M) (M) ----------------*-------------------------*------------------------------ A. Link_1 * ***** ***** ***** ***** * AG 3690 21.6 0.0 21.0 B. Link_2 * ***** ***** ***** ***** * AG 3690 21.6 0.0 21.0 C. Link_3 * ***** ***** ***** ***** * AG 3690 21.6 0.0 21.0 D. Link_4 * ***** ***** ***** ***** * AG 2418 3.8 0.0 21.0 E. Link_5 * ***** ***** ***** ***** * AG 2418 3.8 0.0 21.0 F. Link_6 * ***** ***** ***** ***** * AG 2418 3.8 0.0 21.0 G. Link_7 * ***** ***** ***** ***** * AG 2418 3.8 0.0 21.0 H. Link_8 * ***** ***** ***** ***** * AG 1300 21.6 0.0 21.0 I. Link_9 * ***** ***** ***** ***** * AG 1300 21.6 0.0 21.0 J. Link_10 * ***** ***** ***** ***** * AG 1300 21.6 0.0 21.0 K. Link_11 * ***** ***** ***** ***** * AG 1300 21.6 0.0 21.0 L. Link_12 * ***** ***** ***** ***** * AG 2418 3.8 0.0 21.0 M. Link_13 * ***** ***** ***** ***** * AG 2418 3.8 0.0 21.0 N. Link_14 * ***** ***** ***** ***** * AG 2418 3.8 0.0 21.0 O. Link_15 * ***** ***** ***** ***** * AG 90 21.6 0.0 8.5 P. Link_16 * ***** ***** ***** ***** * AG 90 21.6 0.0 8.5 Q. Link_17 * ***** ***** ***** ***** * AG 90 21.6 0.0 8.5 R. Link_18 * ***** ***** ***** ***** * AG 260 21.6 0.0 13.0 S. Link_19 * ***** ***** ***** ***** * AG 260 21.6 0.0 13.0
Page 1
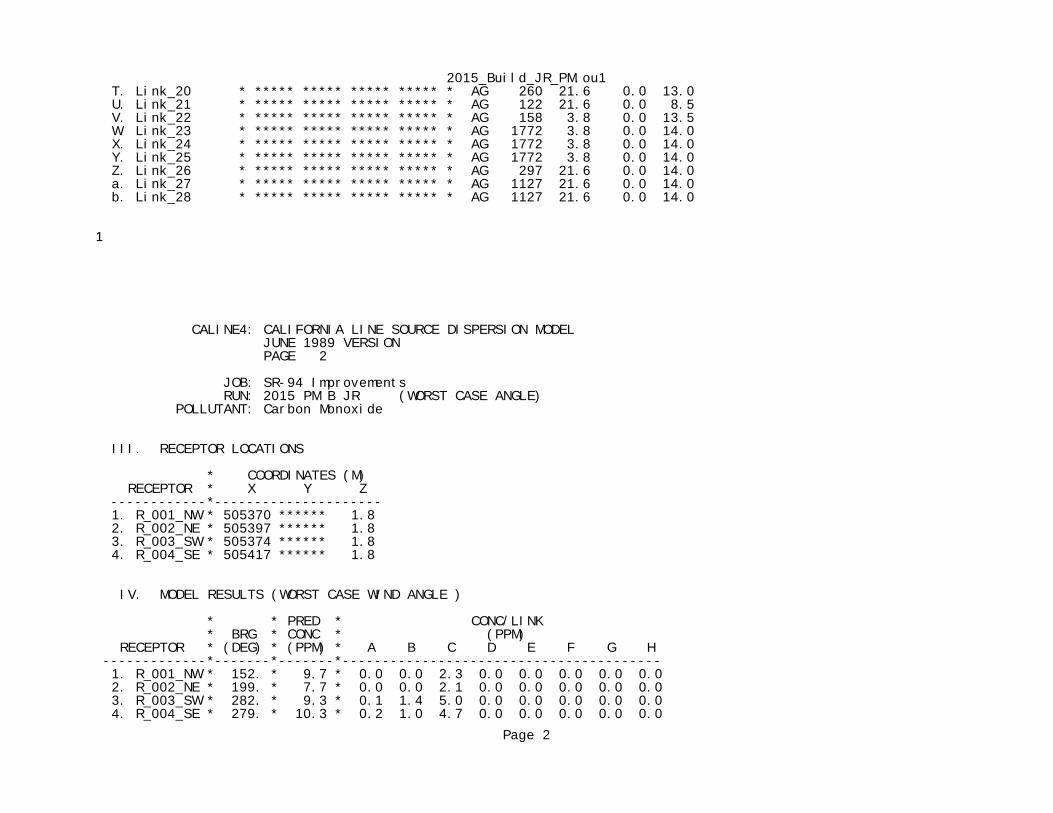
2015_Build_JR_PM.ou1 T. Link_20 * ***** ***** ***** ***** * AG 260 21.6 0.0 13.0 U. Link_21 * ***** ***** ***** ***** * AG 122 21.6 0.0 8.5 V. Link_22 * ***** ***** ***** ***** * AG 158 3.8 0.0 13.5 W. Link_23 * ***** ***** ***** ***** * AG 1772 3.8 0.0 14.0 X. Link_24 * ***** ***** ***** ***** * AG 1772 3.8 0.0 14.0 Y. Link_25 * ***** ***** ***** ***** * AG 1772 3.8 0.0 14.0 Z. Link_26 * ***** ***** ***** ***** * AG 297 21.6 0.0 14.0 a. Link_27 * ***** ***** ***** ***** * AG 1127 21.6 0.0 14.0 b. Link_28 * ***** ***** ***** ***** * AG 1127 21.6 0.0 14.0
1
CALINE4: CALIFORNIA LINE SOURCE DISPERSION MODEL JUNE 1989 VERSION PAGE 2
JOB: SR-94 Improvements RUN: 2015 PM B JR (WORST CASE ANGLE) POLLUTANT: Carbon Monoxide
III. RECEPTOR LOCATIONS
* COORDINATES (M) RECEPTOR * X Y Z ------------*--------------------- 1. R_001_NW * 505370 ****** 1.8 2. R_002_NE * 505397 ****** 1.8 3. R_003_SW * 505374 ****** 1.8 4. R_004_SE * 505417 ****** 1.8
IV. MODEL RESULTS (WORST CASE WIND ANGLE )
* * PRED * CONC/LINK * BRG * CONC * (PPM) RECEPTOR * (DEG) * (PPM) * A B C D E F G H -------------*-------*-------*---------------------------------------- 1. R_001_NW * 152. * 9.7 * 0.0 0.0 2.3 0.0 0.0 0.0 0.0 0.0 2. R_002_NE * 199. * 7.7 * 0.0 0.0 2.1 0.0 0.0 0.0 0.0 0.0 3. R_003_SW * 282. * 9.3 * 0.1 1.4 5.0 0.0 0.0 0.0 0.0 0.0 4. R_004_SE * 279. * 10.3 * 0.2 1.0 4.7 0.0 0.0 0.0 0.0 0.0
Page 2
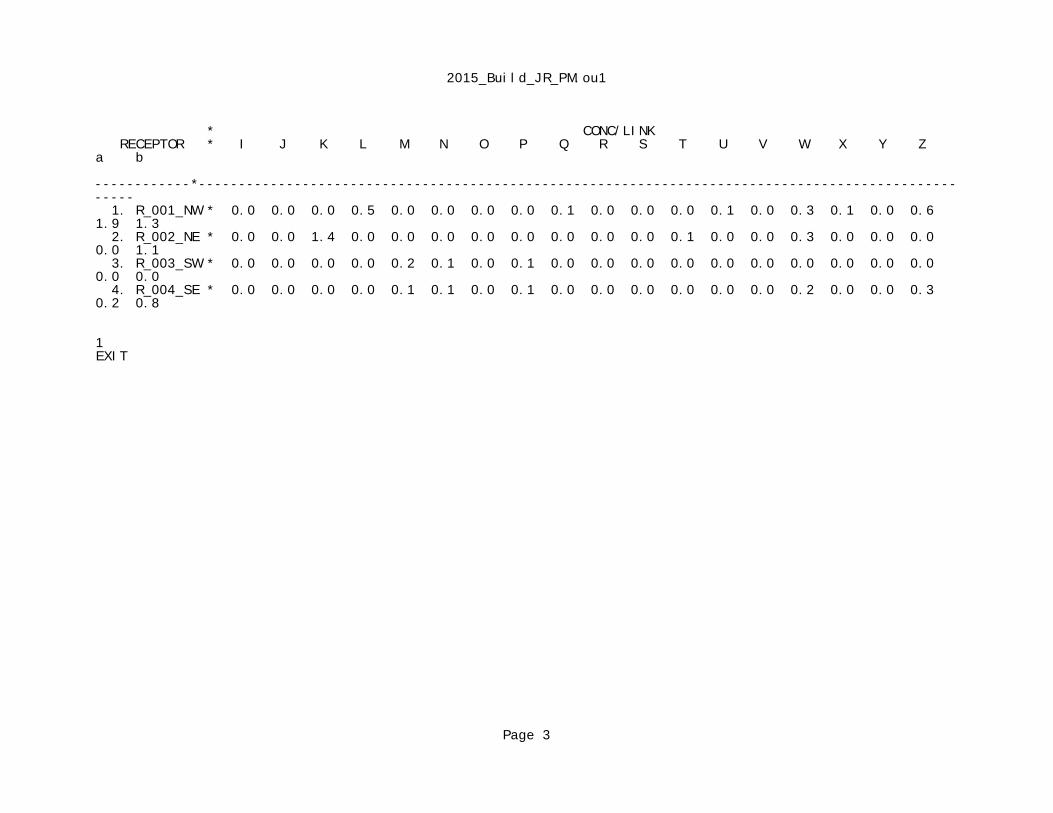
2015_Build_JR_PM.ou1
* CONC/LINK RECEPTOR * I J K L M N O P Q R S T U V W X Y Z a b ------------*---------------------------------------------------------------------------------------------------- 1. R_001_NW * 0.0 0.0 0.0 0.5 0.0 0.0 0.0 0.0 0.1 0.0 0.0 0.0 0.1 0.0 0.3 0.1 0.0 0.6 1.9 1.3 2. R_002_NE * 0.0 0.0 1.4 0.0 0.0 0.0 0.0 0.0 0.0 0.0 0.0 0.1 0.0 0.0 0.3 0.0 0.0 0.0 0.0 1.1 3. R_003_SW * 0.0 0.0 0.0 0.0 0.2 0.1 0.0 0.1 0.0 0.0 0.0 0.0 0.0 0.0 0.0 0.0 0.0 0.0 0.0 0.0 4. R_004_SE * 0.0 0.0 0.0 0.0 0.1 0.1 0.0 0.1 0.0 0.0 0.0 0.0 0.0 0.0 0.2 0.0 0.0 0.3 0.2 0.8
1EXIT
Page 3
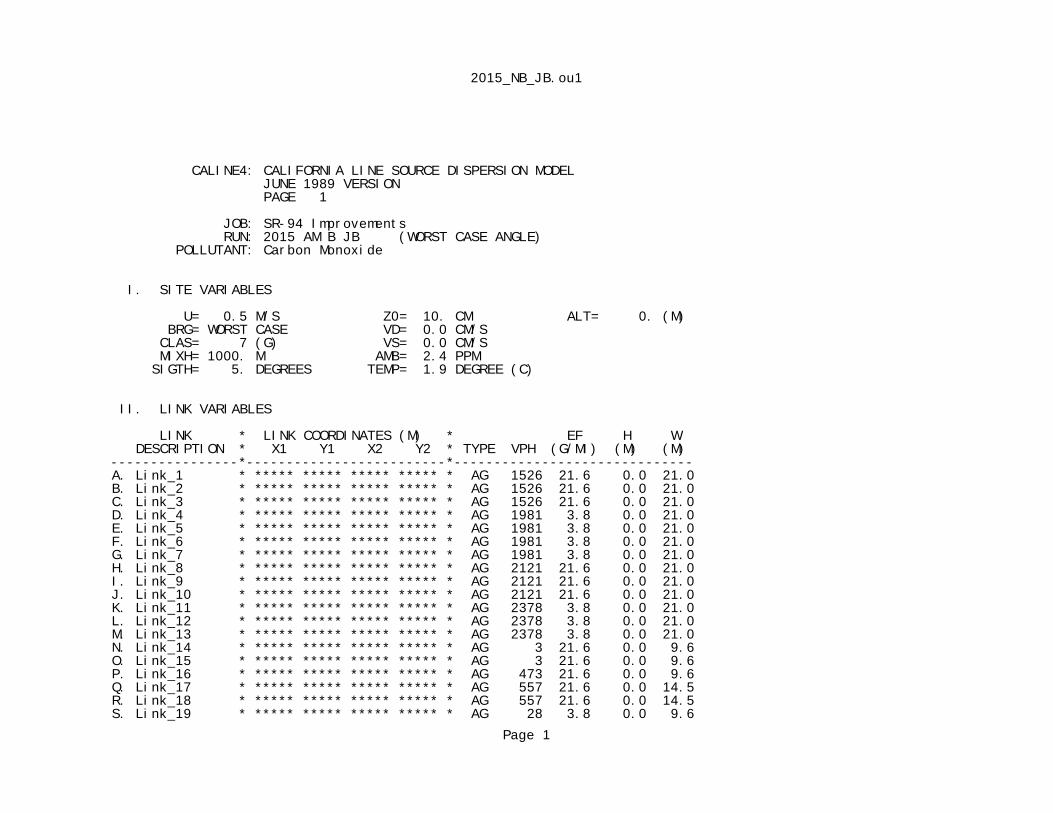
2015_NB_JB.ou1
CALINE4: CALIFORNIA LINE SOURCE DISPERSION MODEL JUNE 1989 VERSION PAGE 1
JOB: SR-94 Improvements RUN: 2015 AM B JB (WORST CASE ANGLE) POLLUTANT: Carbon Monoxide
I. SITE VARIABLES
U= 0.5 M/S Z0= 10. CM ALT= 0. (M) BRG= WORST CASE VD= 0.0 CM/S CLAS= 7 (G) VS= 0.0 CM/S MIXH= 1000. M AMB= 2.4 PPM SIGTH= 5. DEGREES TEMP= 1.9 DEGREE (C)
II. LINK VARIABLES
LINK * LINK COORDINATES (M) * EF H W DESCRIPTION * X1 Y1 X2 Y2 * TYPE VPH (G/MI) (M) (M) ----------------*-------------------------*------------------------------ A. Link_1 * ***** ***** ***** ***** * AG 1526 21.6 0.0 21.0 B. Link_2 * ***** ***** ***** ***** * AG 1526 21.6 0.0 21.0 C. Link_3 * ***** ***** ***** ***** * AG 1526 21.6 0.0 21.0 D. Link_4 * ***** ***** ***** ***** * AG 1981 3.8 0.0 21.0 E. Link_5 * ***** ***** ***** ***** * AG 1981 3.8 0.0 21.0 F. Link_6 * ***** ***** ***** ***** * AG 1981 3.8 0.0 21.0 G. Link_7 * ***** ***** ***** ***** * AG 1981 3.8 0.0 21.0 H. Link_8 * ***** ***** ***** ***** * AG 2121 21.6 0.0 21.0 I. Link_9 * ***** ***** ***** ***** * AG 2121 21.6 0.0 21.0 J. Link_10 * ***** ***** ***** ***** * AG 2121 21.6 0.0 21.0 K. Link_11 * ***** ***** ***** ***** * AG 2378 3.8 0.0 21.0 L. Link_12 * ***** ***** ***** ***** * AG 2378 3.8 0.0 21.0 M. Link_13 * ***** ***** ***** ***** * AG 2378 3.8 0.0 21.0 N. Link_14 * ***** ***** ***** ***** * AG 3 21.6 0.0 9.6 O. Link_15 * ***** ***** ***** ***** * AG 3 21.6 0.0 9.6 P. Link_16 * ***** ***** ***** ***** * AG 473 21.6 0.0 9.6 Q. Link_17 * ***** ***** ***** ***** * AG 557 21.6 0.0 14.5 R. Link_18 * ***** ***** ***** ***** * AG 557 21.6 0.0 14.5 S. Link_19 * ***** ***** ***** ***** * AG 28 3.8 0.0 9.6
Page 1
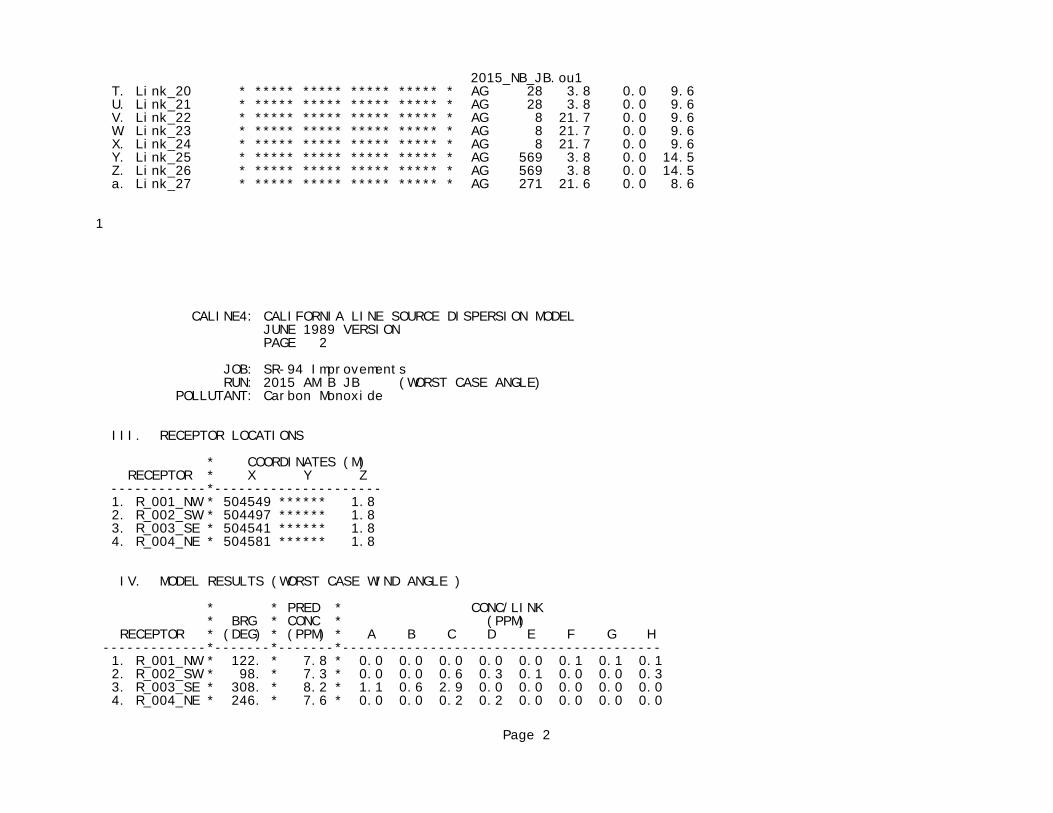
2015_NB_JB.ou1 T. Link_20 * ***** ***** ***** ***** * AG 28 3.8 0.0 9.6 U. Link_21 * ***** ***** ***** ***** * AG 28 3.8 0.0 9.6 V. Link_22 * ***** ***** ***** ***** * AG 8 21.7 0.0 9.6 W. Link_23 * ***** ***** ***** ***** * AG 8 21.7 0.0 9.6 X. Link_24 * ***** ***** ***** ***** * AG 8 21.7 0.0 9.6 Y. Link_25 * ***** ***** ***** ***** * AG 569 3.8 0.0 14.5 Z. Link_26 * ***** ***** ***** ***** * AG 569 3.8 0.0 14.5 a. Link_27 * ***** ***** ***** ***** * AG 271 21.6 0.0 8.6
1
CALINE4: CALIFORNIA LINE SOURCE DISPERSION MODEL JUNE 1989 VERSION PAGE 2
JOB: SR-94 Improvements RUN: 2015 AM B JB (WORST CASE ANGLE) POLLUTANT: Carbon Monoxide
III. RECEPTOR LOCATIONS
* COORDINATES (M) RECEPTOR * X Y Z ------------*--------------------- 1. R_001_NW * 504549 ****** 1.8 2. R_002_SW * 504497 ****** 1.8 3. R_003_SE * 504541 ****** 1.8 4. R_004_NE * 504581 ****** 1.8
IV. MODEL RESULTS (WORST CASE WIND ANGLE )
* * PRED * CONC/LINK * BRG * CONC * (PPM) RECEPTOR * (DEG) * (PPM) * A B C D E F G H -------------*-------*-------*---------------------------------------- 1. R_001_NW * 122. * 7.8 * 0.0 0.0 0.0 0.0 0.0 0.1 0.1 0.1 2. R_002_SW * 98. * 7.3 * 0.0 0.0 0.6 0.3 0.1 0.0 0.0 0.3 3. R_003_SE * 308. * 8.2 * 1.1 0.6 2.9 0.0 0.0 0.0 0.0 0.0 4. R_004_NE * 246. * 7.6 * 0.0 0.0 0.2 0.2 0.0 0.0 0.0 0.0
Page 2

2015_NB_JB.ou1
* CONC/LINK RECEPTOR * I J K L M N O P Q R S T U V W X Y Z a ------------*----------------------------------------------------------------------------------------------- 1. R_001_NW * 2.3 2.3 0.0 0.0 0.0 0.0 0.0 0.4 0.0 0.0 0.0 0.0 0.0 0.0 0.0 0.0 0.0 0.0 0.0 2. R_002_SW * 1.7 0.4 0.0 0.0 0.0 0.0 0.0 0.6 0.0 0.5 0.0 0.0 0.0 0.0 0.0 0.0 0.1 0.0 0.3 3. R_003_SE * 0.0 0.0 0.0 0.1 0.1 0.0 0.0 0.0 0.0 0.7 0.0 0.0 0.0 0.0 0.0 0.0 0.1 0.0 0.3 4. R_004_NE * 0.0 2.3 0.0 0.0 0.0 0.0 0.0 0.4 0.3 1.2 0.0 0.0 0.0 0.0 0.0 0.0 0.1 0.0 0.6
1EXIT
Page 3

2015_NB_JB.ou1
CALINE4: CALIFORNIA LINE SOURCE DISPERSION MODEL JUNE 1989 VERSION PAGE 1
JOB: SR-94 Improvements RUN: 2015 PM B JB (WORST CASE ANGLE) POLLUTANT: Carbon Monoxide
I. SITE VARIABLES
U= 0.5 M/S Z0= 10. CM ALT= 0. (M) BRG= WORST CASE VD= 0.0 CM/S CLAS= 7 (G) VS= 0.0 CM/S MIXH= 1000. M AMB= 2.4 PPM SIGTH= 5. DEGREES TEMP= 1.9 DEGREE (C)
II. LINK VARIABLES
LINK * LINK COORDINATES (M) * EF H W DESCRIPTION * X1 Y1 X2 Y2 * TYPE VPH (G/MI) (M) (M) ----------------*-------------------------*------------------------------ A. Link_1 * ***** ***** ***** ***** * AG 3023 21.6 0.0 21.0 B. Link_2 * ***** ***** ***** ***** * AG 3023 21.6 0.0 21.0 C. Link_3 * ***** ***** ***** ***** * AG 3023 21.6 0.0 21.0 D. Link_4 * ***** ***** ***** ***** * AG 3515 3.8 0.0 21.0 E. Link_5 * ***** ***** ***** ***** * AG 3515 3.8 0.0 21.0 F. Link_6 * ***** ***** ***** ***** * AG 3515 3.8 0.0 21.0 G. Link_7 * ***** ***** ***** ***** * AG 3515 3.8 0.0 21.0 H. Link_8 * ***** ***** ***** ***** * AG 2381 21.6 0.0 21.0 I. Link_9 * ***** ***** ***** ***** * AG 2381 21.6 0.0 21.0 J. Link_10 * ***** ***** ***** ***** * AG 2381 21.6 0.0 21.0 K. Link_11 * ***** ***** ***** ***** * AG 2022 3.8 0.0 21.0 L. Link_12 * ***** ***** ***** ***** * AG 2022 3.8 0.0 21.0 M. Link_13 * ***** ***** ***** ***** * AG 2022 3.8 0.0 21.0 N. Link_14 * ***** ***** ***** ***** * AG 3 21.6 0.0 9.6 O. Link_15 * ***** ***** ***** ***** * AG 3 21.6 0.0 9.6
Page 1
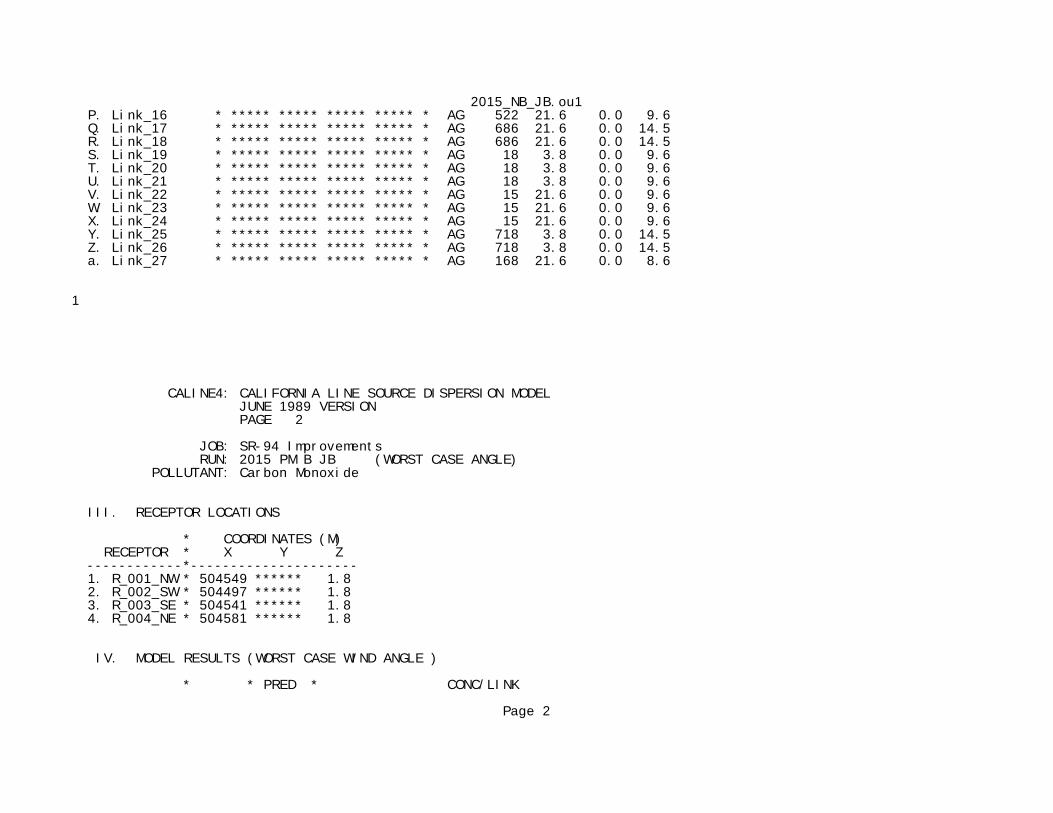
2015_NB_JB.ou1 P. Link_16 * ***** ***** ***** ***** * AG 522 21.6 0.0 9.6 Q. Link_17 * ***** ***** ***** ***** * AG 686 21.6 0.0 14.5 R. Link_18 * ***** ***** ***** ***** * AG 686 21.6 0.0 14.5 S. Link_19 * ***** ***** ***** ***** * AG 18 3.8 0.0 9.6 T. Link_20 * ***** ***** ***** ***** * AG 18 3.8 0.0 9.6 U. Link_21 * ***** ***** ***** ***** * AG 18 3.8 0.0 9.6 V. Link_22 * ***** ***** ***** ***** * AG 15 21.6 0.0 9.6 W. Link_23 * ***** ***** ***** ***** * AG 15 21.6 0.0 9.6 X. Link_24 * ***** ***** ***** ***** * AG 15 21.6 0.0 9.6 Y. Link_25 * ***** ***** ***** ***** * AG 718 3.8 0.0 14.5 Z. Link_26 * ***** ***** ***** ***** * AG 718 3.8 0.0 14.5 a. Link_27 * ***** ***** ***** ***** * AG 168 21.6 0.0 8.6
1
CALINE4: CALIFORNIA LINE SOURCE DISPERSION MODEL JUNE 1989 VERSION PAGE 2
JOB: SR-94 Improvements RUN: 2015 PM B JB (WORST CASE ANGLE) POLLUTANT: Carbon Monoxide
III. RECEPTOR LOCATIONS
* COORDINATES (M) RECEPTOR * X Y Z ------------*--------------------- 1. R_001_NW * 504549 ****** 1.8 2. R_002_SW * 504497 ****** 1.8 3. R_003_SE * 504541 ****** 1.8 4. R_004_NE * 504581 ****** 1.8
IV. MODEL RESULTS (WORST CASE WIND ANGLE )
* * PRED * CONC/LINK
Page 2

2015_NB_JB.ou1 * BRG * CONC * (PPM) RECEPTOR * (DEG) * (PPM) * A B C D E F G H -------------*-------*-------*---------------------------------------- 1. R_001_NW * 123. * 8.5 * 0.0 0.0 0.0 0.0 0.0 0.2 0.1 0.1 2. R_002_SW * 97. * 8.4 * 0.0 0.0 1.2 0.5 0.1 0.0 0.0 0.2 3. R_003_SE * 308. * 11.9 * 1.8 1.0 5.3 0.0 0.0 0.0 0.0 0.0 4. R_004_NE * 246. * 8.3 * 0.0 0.0 0.3 0.3 0.0 0.0 0.0 0.0
* CONC/LINK RECEPTOR * I J K L M N O P Q R S T U V W X Y Z a ------------*----------------------------------------------------------------------------------------------- 1. R_001_NW * 2.4 2.7 0.0 0.0 0.0 0.0 0.0 0.5 0.0 0.0 0.0 0.0 0.0 0.0 0.0 0.0 0.0 0.0 0.0 2. R_002_SW * 1.8 0.5 0.0 0.0 0.0 0.0 0.0 0.7 0.0 0.6 0.0 0.0 0.0 0.0 0.0 0.0 0.2 0.0 0.2 3. R_003_SE * 0.0 0.0 0.0 0.1 0.1 0.0 0.0 0.0 0.0 0.8 0.0 0.0 0.0 0.0 0.0 0.0 0.1 0.0 0.2 4. R_004_NE * 0.0 2.6 0.0 0.0 0.0 0.0 0.0 0.5 0.3 1.4 0.0 0.0 0.0 0.0 0.0 0.0 0.1 0.0 0.4
1EXIT
Page 3
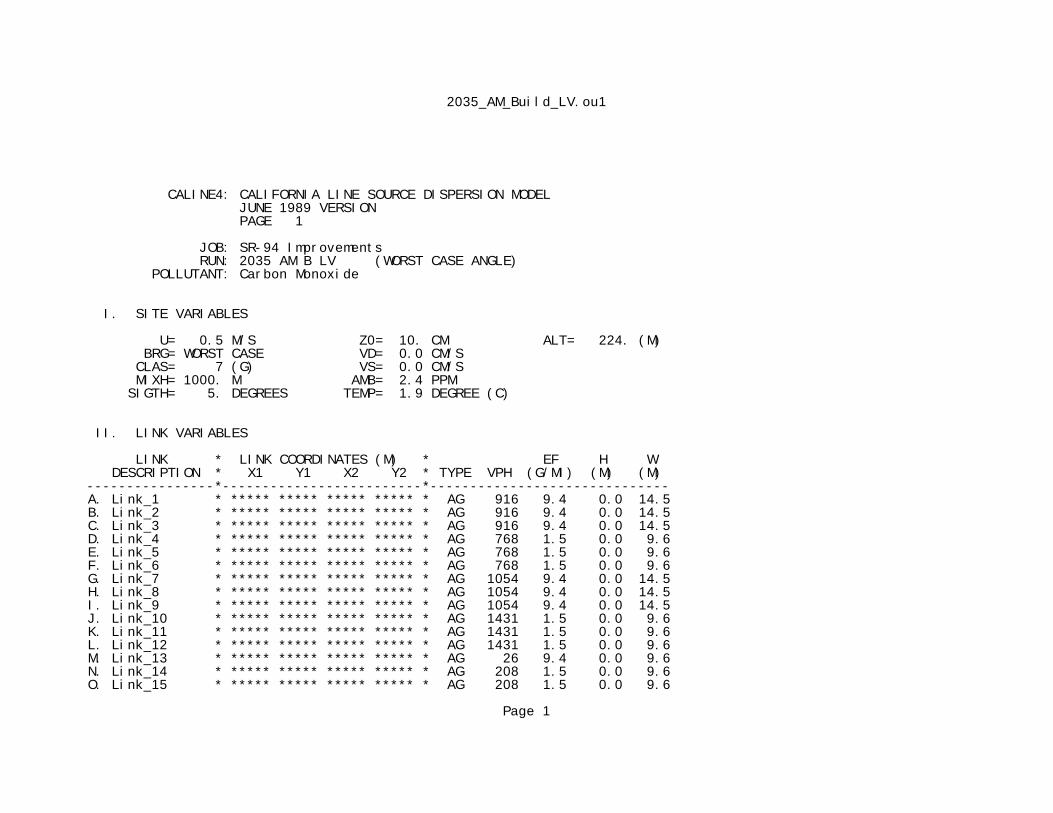
2035_AM_Build_LV.ou1
CALINE4: CALIFORNIA LINE SOURCE DISPERSION MODEL JUNE 1989 VERSION PAGE 1
JOB: SR-94 Improvements RUN: 2035 AM B LV (WORST CASE ANGLE) POLLUTANT: Carbon Monoxide
I. SITE VARIABLES
U= 0.5 M/S Z0= 10. CM ALT= 224. (M) BRG= WORST CASE VD= 0.0 CM/S CLAS= 7 (G) VS= 0.0 CM/S MIXH= 1000. M AMB= 2.4 PPM SIGTH= 5. DEGREES TEMP= 1.9 DEGREE (C)
II. LINK VARIABLES
LINK * LINK COORDINATES (M) * EF H W DESCRIPTION * X1 Y1 X2 Y2 * TYPE VPH (G/MI) (M) (M) ----------------*-------------------------*------------------------------ A. Link_1 * ***** ***** ***** ***** * AG 916 9.4 0.0 14.5 B. Link_2 * ***** ***** ***** ***** * AG 916 9.4 0.0 14.5 C. Link_3 * ***** ***** ***** ***** * AG 916 9.4 0.0 14.5 D. Link_4 * ***** ***** ***** ***** * AG 768 1.5 0.0 9.6 E. Link_5 * ***** ***** ***** ***** * AG 768 1.5 0.0 9.6 F. Link_6 * ***** ***** ***** ***** * AG 768 1.5 0.0 9.6 G. Link_7 * ***** ***** ***** ***** * AG 1054 9.4 0.0 14.5 H. Link_8 * ***** ***** ***** ***** * AG 1054 9.4 0.0 14.5 I. Link_9 * ***** ***** ***** ***** * AG 1054 9.4 0.0 14.5 J. Link_10 * ***** ***** ***** ***** * AG 1431 1.5 0.0 9.6 K. Link_11 * ***** ***** ***** ***** * AG 1431 1.5 0.0 9.6 L. Link_12 * ***** ***** ***** ***** * AG 1431 1.5 0.0 9.6 M. Link_13 * ***** ***** ***** ***** * AG 26 9.4 0.0 9.6 N. Link_14 * ***** ***** ***** ***** * AG 208 1.5 0.0 9.6 O. Link_15 * ***** ***** ***** ***** * AG 208 1.5 0.0 9.6
Page 1
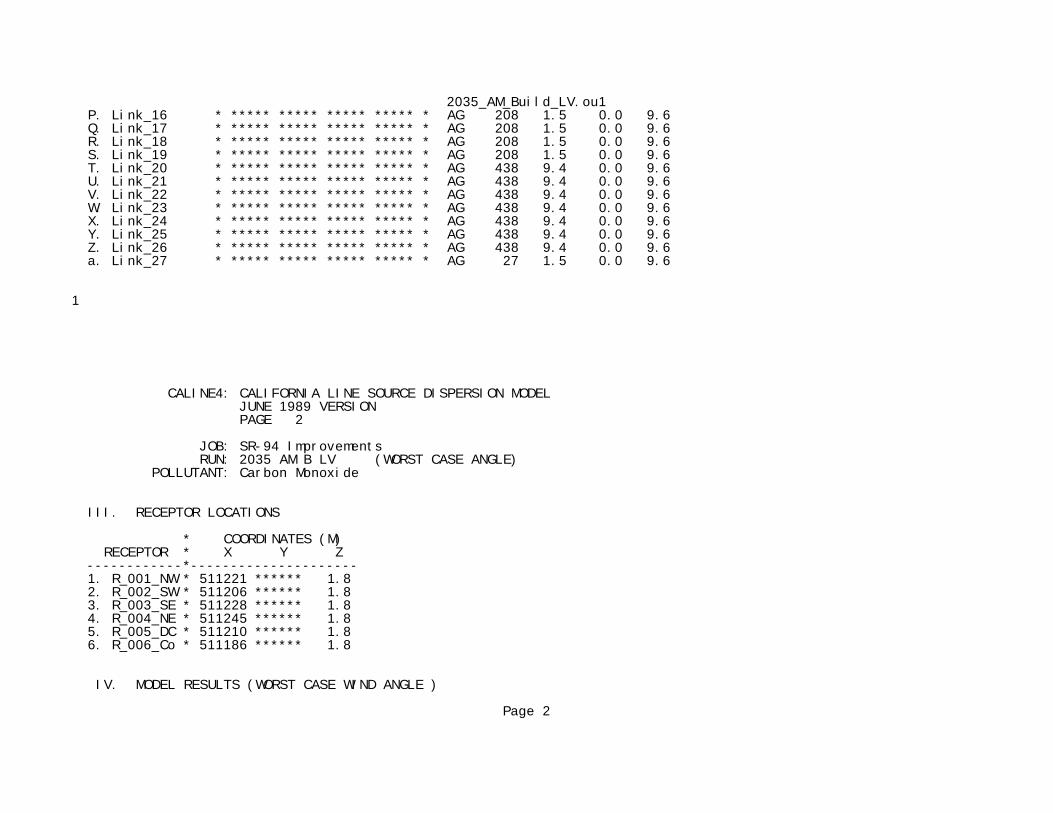
2035_AM_Build_LV.ou1 P. Link_16 * ***** ***** ***** ***** * AG 208 1.5 0.0 9.6 Q. Link_17 * ***** ***** ***** ***** * AG 208 1.5 0.0 9.6 R. Link_18 * ***** ***** ***** ***** * AG 208 1.5 0.0 9.6 S. Link_19 * ***** ***** ***** ***** * AG 208 1.5 0.0 9.6 T. Link_20 * ***** ***** ***** ***** * AG 438 9.4 0.0 9.6 U. Link_21 * ***** ***** ***** ***** * AG 438 9.4 0.0 9.6 V. Link_22 * ***** ***** ***** ***** * AG 438 9.4 0.0 9.6 W. Link_23 * ***** ***** ***** ***** * AG 438 9.4 0.0 9.6 X. Link_24 * ***** ***** ***** ***** * AG 438 9.4 0.0 9.6 Y. Link_25 * ***** ***** ***** ***** * AG 438 9.4 0.0 9.6 Z. Link_26 * ***** ***** ***** ***** * AG 438 9.4 0.0 9.6 a. Link_27 * ***** ***** ***** ***** * AG 27 1.5 0.0 9.6
1
CALINE4: CALIFORNIA LINE SOURCE DISPERSION MODEL JUNE 1989 VERSION PAGE 2
JOB: SR-94 Improvements RUN: 2035 AM B LV (WORST CASE ANGLE) POLLUTANT: Carbon Monoxide
III. RECEPTOR LOCATIONS
* COORDINATES (M) RECEPTOR * X Y Z ------------*--------------------- 1. R_001_NW * 511221 ****** 1.8 2. R_002_SW * 511206 ****** 1.8 3. R_003_SE * 511228 ****** 1.8 4. R_004_NE * 511245 ****** 1.8 5. R_005_DC * 511210 ****** 1.8 6. R_006_Co * 511186 ****** 1.8
IV. MODEL RESULTS (WORST CASE WIND ANGLE )
Page 2
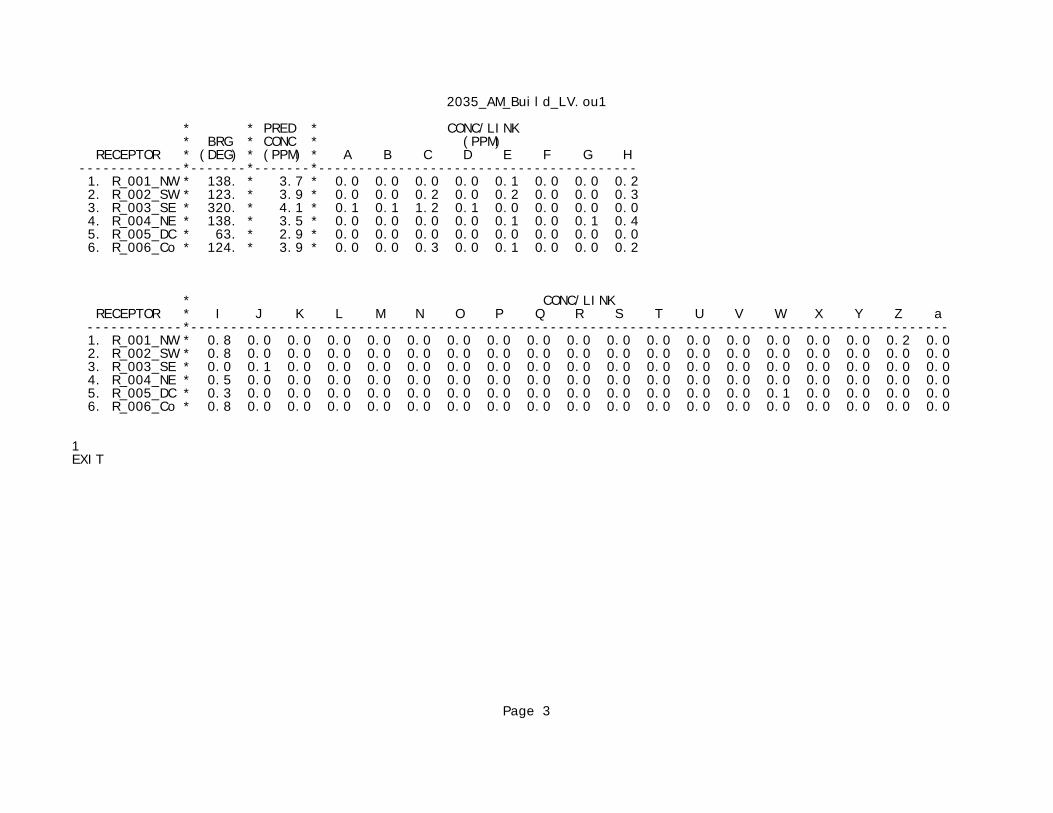
2035_AM_Build_LV.ou1
* * PRED * CONC/LINK * BRG * CONC * (PPM) RECEPTOR * (DEG) * (PPM) * A B C D E F G H -------------*-------*-------*---------------------------------------- 1. R_001_NW * 138. * 3.7 * 0.0 0.0 0.0 0.0 0.1 0.0 0.0 0.2 2. R_002_SW * 123. * 3.9 * 0.0 0.0 0.2 0.0 0.2 0.0 0.0 0.3 3. R_003_SE * 320. * 4.1 * 0.1 0.1 1.2 0.1 0.0 0.0 0.0 0.0 4. R_004_NE * 138. * 3.5 * 0.0 0.0 0.0 0.0 0.1 0.0 0.1 0.4 5. R_005_DC * 63. * 2.9 * 0.0 0.0 0.0 0.0 0.0 0.0 0.0 0.0 6. R_006_Co * 124. * 3.9 * 0.0 0.0 0.3 0.0 0.1 0.0 0.0 0.2
* CONC/LINK RECEPTOR * I J K L M N O P Q R S T U V W X Y Z a ------------*----------------------------------------------------------------------------------------------- 1. R_001_NW * 0.8 0.0 0.0 0.0 0.0 0.0 0.0 0.0 0.0 0.0 0.0 0.0 0.0 0.0 0.0 0.0 0.0 0.2 0.0 2. R_002_SW * 0.8 0.0 0.0 0.0 0.0 0.0 0.0 0.0 0.0 0.0 0.0 0.0 0.0 0.0 0.0 0.0 0.0 0.0 0.0 3. R_003_SE * 0.0 0.1 0.0 0.0 0.0 0.0 0.0 0.0 0.0 0.0 0.0 0.0 0.0 0.0 0.0 0.0 0.0 0.0 0.0 4. R_004_NE * 0.5 0.0 0.0 0.0 0.0 0.0 0.0 0.0 0.0 0.0 0.0 0.0 0.0 0.0 0.0 0.0 0.0 0.0 0.0 5. R_005_DC * 0.3 0.0 0.0 0.0 0.0 0.0 0.0 0.0 0.0 0.0 0.0 0.0 0.0 0.0 0.1 0.0 0.0 0.0 0.0 6. R_006_Co * 0.8 0.0 0.0 0.0 0.0 0.0 0.0 0.0 0.0 0.0 0.0 0.0 0.0 0.0 0.0 0.0 0.0 0.0 0.0
1EXIT
Page 3

2035_PM_Build_LV.ou1
CALINE4: CALIFORNIA LINE SOURCE DISPERSION MODEL JUNE 1989 VERSION PAGE 1
JOB: SR-94 Improvements RUN: 2035 PM B LV (WORST CASE ANGLE) POLLUTANT: Carbon Monoxide
I. SITE VARIABLES
U= 0.5 M/S Z0= 10. CM ALT= 224. (M) BRG= WORST CASE VD= 0.0 CM/S CLAS= 7 (G) VS= 0.0 CM/S MIXH= 1000. M AMB= 2.4 PPM SIGTH= 5. DEGREES TEMP= 1.9 DEGREE (C)
II. LINK VARIABLES
LINK * LINK COORDINATES (M) * EF H W DESCRIPTION * X1 Y1 X2 Y2 * TYPE VPH (G/MI) (M) (M) ----------------*-------------------------*------------------------------ A. Link_1 * ***** ***** ***** ***** * AG 1768 9.4 0.0 14.5 B. Link_2 * ***** ***** ***** ***** * AG 1768 9.4 0.0 14.5 C. Link_3 * ***** ***** ***** ***** * AG 1768 9.4 0.0 14.5 D. Link_4 * ***** ***** ***** ***** * AG 1420 1.5 0.0 9.6 E. Link_5 * ***** ***** ***** ***** * AG 1420 1.5 0.0 9.6 F. Link_6 * ***** ***** ***** ***** * AG 1420 1.5 0.0 9.6 G. Link_7 * ***** ***** ***** ***** * AG 963 9.4 0.0 14.5 H. Link_8 * ***** ***** ***** ***** * AG 963 9.4 0.0 14.5 I. Link_9 * ***** ***** ***** ***** * AG 963 9.4 0.0 14.5 J. Link_10 * ***** ***** ***** ***** * AG 1111 1.5 0.0 9.6 K. Link_11 * ***** ***** ***** ***** * AG 1111 1.5 0.0 9.6 L. Link_12 * ***** ***** ***** ***** * AG 1111 1.5 0.0 9.6 M. Link_13 * ***** ***** ***** ***** * AG 26 9.4 0.0 9.6 N. Link_14 * ***** ***** ***** ***** * AG 435 1.5 0.0 9.6 O. Link_15 * ***** ***** ***** ***** * AG 435 1.5 0.0 9.6 P. Link_16 * ***** ***** ***** ***** * AG 435 1.5 0.0 9.6 Q. Link_17 * ***** ***** ***** ***** * AG 435 1.5 0.0 9.6 R. Link_18 * ***** ***** ***** ***** * AG 435 1.5 0.0 9.6 S. Link_19 * ***** ***** ***** ***** * AG 435 1.5 0.0 9.6
Page 1

2035_PM_Build_LV.ou1 T. Link_20 * ***** ***** ***** ***** * AG 231 9.4 0.0 9.6 U. Link_21 * ***** ***** ***** ***** * AG 231 9.4 0.0 9.6 V. Link_22 * ***** ***** ***** ***** * AG 231 9.4 0.0 9.6 W. Link_23 * ***** ***** ***** ***** * AG 231 9.4 0.0 9.6 X. Link_24 * ***** ***** ***** ***** * AG 231 9.4 0.0 9.6 Y. Link_25 * ***** ***** ***** ***** * AG 231 9.4 0.0 9.6 Z. Link_26 * ***** ***** ***** ***** * AG 231 9.4 0.0 9.6 a. Link_27 * ***** ***** ***** ***** * AG 22 1.5 0.0 9.6
1
CALINE4: CALIFORNIA LINE SOURCE DISPERSION MODEL JUNE 1989 VERSION PAGE 2
JOB: SR-94 Improvements RUN: 2035 PM B LV (WORST CASE ANGLE) POLLUTANT: Carbon Monoxide
III. RECEPTOR LOCATIONS
* COORDINATES (M) RECEPTOR * X Y Z ------------*--------------------- 1. R_001_NW * 511221 ****** 1.8 2. R_002_SW * 511206 ****** 1.8 3. R_003_SE * 511228 ****** 1.8 4. R_004_NE * 511245 ****** 1.8 5. R_005_DC * 511210 ****** 1.8 6. R_006_Co * 511186 ****** 1.8
IV. MODEL RESULTS (WORST CASE WIND ANGLE )
* * PRED * CONC/LINK * BRG * CONC * (PPM) RECEPTOR * (DEG) * (PPM) * A B C D E F G H -------------*-------*-------*---------------------------------------- 1. R_001_NW * 306. * 4.0 * 0.2 0.2 1.0 0.0 0.0 0.0 0.0 0.0 2. R_002_SW * 325. * 4.8 * 0.0 0.1 2.1 0.0 0.0 0.0 0.0 0.0 3. R_003_SE * 319. * 5.2 * 0.1 0.2 2.2 0.2 0.0 0.0 0.0 0.0
Page 2
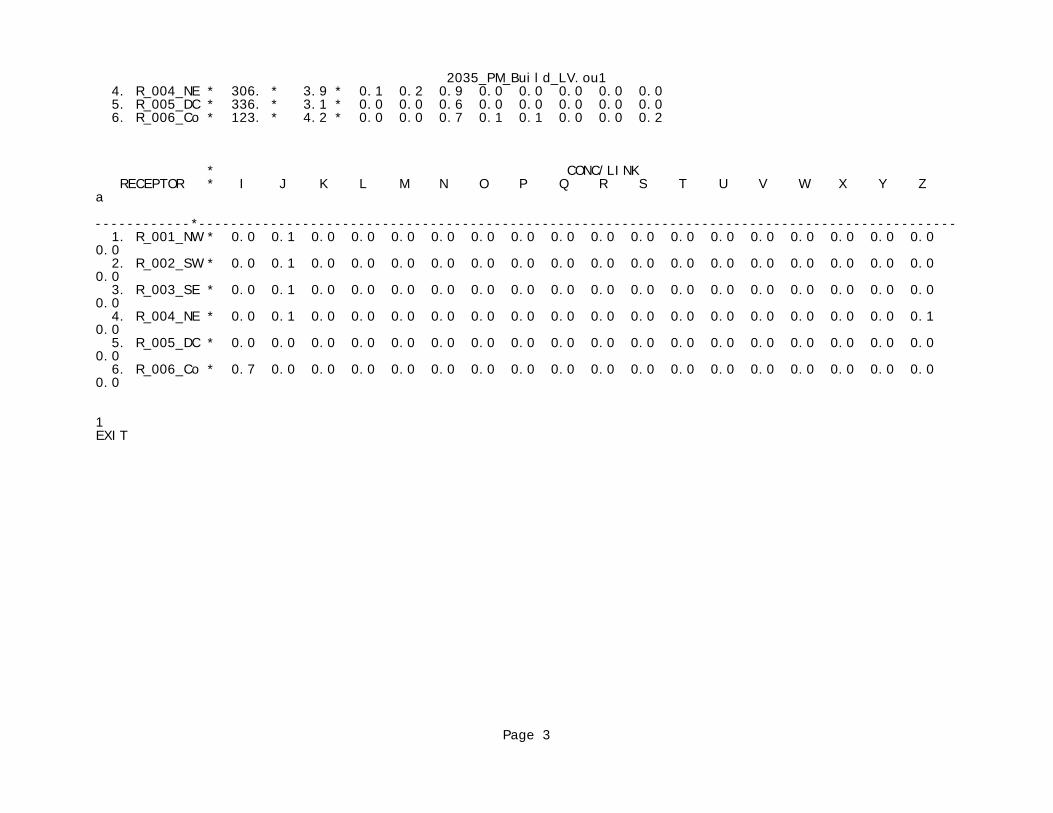
2035_PM_Build_LV.ou1 4. R_004_NE * 306. * 3.9 * 0.1 0.2 0.9 0.0 0.0 0.0 0.0 0.0 5. R_005_DC * 336. * 3.1 * 0.0 0.0 0.6 0.0 0.0 0.0 0.0 0.0 6. R_006_Co * 123. * 4.2 * 0.0 0.0 0.7 0.1 0.1 0.0 0.0 0.2
* CONC/LINK RECEPTOR * I J K L M N O P Q R S T U V W X Y Z a ------------*----------------------------------------------------------------------------------------------- 1. R_001_NW * 0.0 0.1 0.0 0.0 0.0 0.0 0.0 0.0 0.0 0.0 0.0 0.0 0.0 0.0 0.0 0.0 0.0 0.0 0.0 2. R_002_SW * 0.0 0.1 0.0 0.0 0.0 0.0 0.0 0.0 0.0 0.0 0.0 0.0 0.0 0.0 0.0 0.0 0.0 0.0 0.0 3. R_003_SE * 0.0 0.1 0.0 0.0 0.0 0.0 0.0 0.0 0.0 0.0 0.0 0.0 0.0 0.0 0.0 0.0 0.0 0.0 0.0 4. R_004_NE * 0.0 0.1 0.0 0.0 0.0 0.0 0.0 0.0 0.0 0.0 0.0 0.0 0.0 0.0 0.0 0.0 0.0 0.1 0.0 5. R_005_DC * 0.0 0.0 0.0 0.0 0.0 0.0 0.0 0.0 0.0 0.0 0.0 0.0 0.0 0.0 0.0 0.0 0.0 0.0 0.0 6. R_006_Co * 0.7 0.0 0.0 0.0 0.0 0.0 0.0 0.0 0.0 0.0 0.0 0.0 0.0 0.0 0.0 0.0 0.0 0.0 0.0
1EXIT
Page 3

2035_Build_JR_AM.ou1
CALINE4: CALIFORNIA LINE SOURCE DISPERSION MODEL JUNE 1989 VERSION PAGE 1
JOB: SR-94 Improvements RUN: 2035 AM B JR (WORST CASE ANGLE) POLLUTANT: Carbon Monoxide
I. SITE VARIABLES
U= 0.5 M/S Z0= 10. CM ALT= 0. (M) BRG= WORST CASE VD= 0.0 CM/S CLAS= 7 (G) VS= 0.0 CM/S MIXH= 1000. M AMB= 2.4 PPM SIGTH= 5. DEGREES TEMP= 1.9 DEGREE (C)
II. LINK VARIABLES
LINK * LINK COORDINATES (M) * EF H W DESCRIPTION * X1 Y1 X2 Y2 * TYPE VPH (G/MI) (M) (M) ----------------*-------------------------*------------------------------ A. Link_1 * ***** ***** ***** ***** * AG 2390 9.4 0.0 21.0 B. Link_2 * ***** ***** ***** ***** * AG 2390 9.4 0.0 21.0 C. Link_3 * ***** ***** ***** ***** * AG 2390 9.4 0.0 21.0 D. Link_4 * ***** ***** ***** ***** * AG 2092 1.5 0.0 21.0 E. Link_5 * ***** ***** ***** ***** * AG 2092 1.5 0.0 21.0 F. Link_6 * ***** ***** ***** ***** * AG 2092 1.5 0.0 21.0 G. Link_7 * ***** ***** ***** ***** * AG 2092 1.5 0.0 21.0 H. Link_8 * ***** ***** ***** ***** * AG 1987 9.4 0.0 21.0 I. Link_9 * ***** ***** ***** ***** * AG 1987 9.4 0.0 21.0 J. Link_10 * ***** ***** ***** ***** * AG 1987 9.4 0.0 21.0 K. Link_11 * ***** ***** ***** ***** * AG 1987 9.4 0.0 21.0 L. Link_12 * ***** ***** ***** ***** * AG 3295 1.5 0.0 21.0 M. Link_13 * ***** ***** ***** ***** * AG 3295 1.5 0.0 21.0 N. Link_14 * ***** ***** ***** ***** * AG 3295 1.5 0.0 21.0 O. Link_15 * ***** ***** ***** ***** * AG 75 9.4 0.0 8.5
Page 1
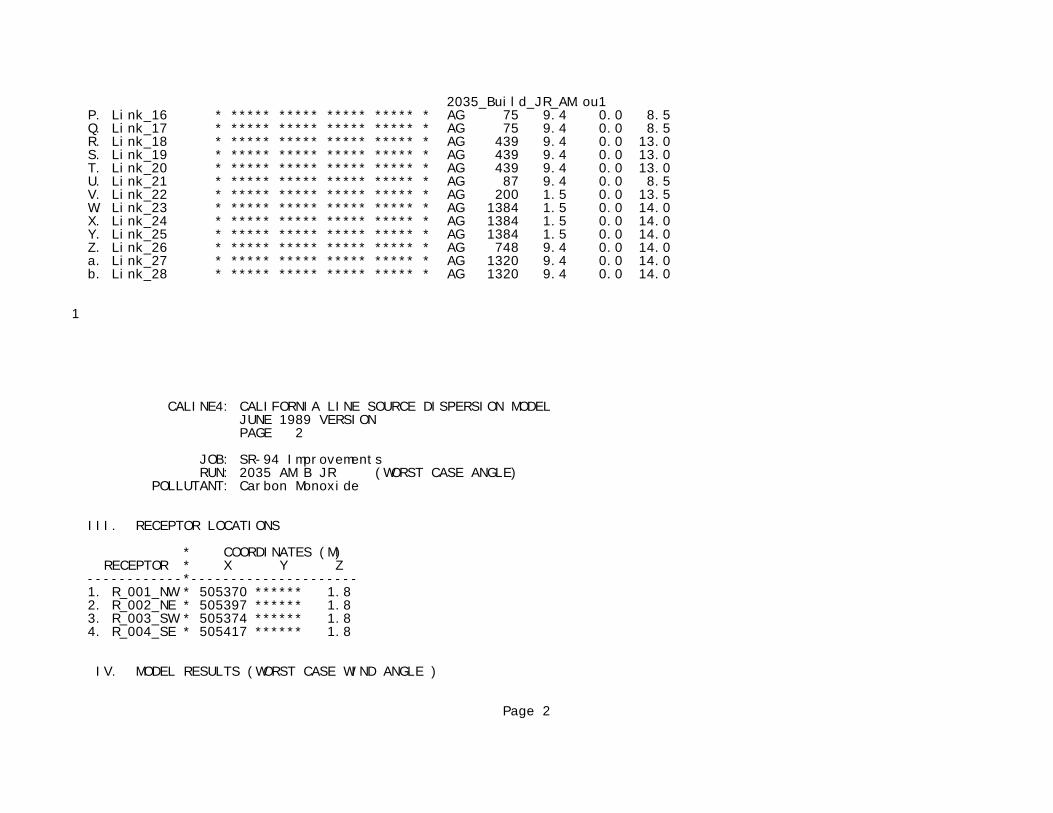
2035_Build_JR_AM.ou1 P. Link_16 * ***** ***** ***** ***** * AG 75 9.4 0.0 8.5 Q. Link_17 * ***** ***** ***** ***** * AG 75 9.4 0.0 8.5 R. Link_18 * ***** ***** ***** ***** * AG 439 9.4 0.0 13.0 S. Link_19 * ***** ***** ***** ***** * AG 439 9.4 0.0 13.0 T. Link_20 * ***** ***** ***** ***** * AG 439 9.4 0.0 13.0 U. Link_21 * ***** ***** ***** ***** * AG 87 9.4 0.0 8.5 V. Link_22 * ***** ***** ***** ***** * AG 200 1.5 0.0 13.5 W. Link_23 * ***** ***** ***** ***** * AG 1384 1.5 0.0 14.0 X. Link_24 * ***** ***** ***** ***** * AG 1384 1.5 0.0 14.0 Y. Link_25 * ***** ***** ***** ***** * AG 1384 1.5 0.0 14.0 Z. Link_26 * ***** ***** ***** ***** * AG 748 9.4 0.0 14.0 a. Link_27 * ***** ***** ***** ***** * AG 1320 9.4 0.0 14.0 b. Link_28 * ***** ***** ***** ***** * AG 1320 9.4 0.0 14.0
1
CALINE4: CALIFORNIA LINE SOURCE DISPERSION MODEL JUNE 1989 VERSION PAGE 2
JOB: SR-94 Improvements RUN: 2035 AM B JR (WORST CASE ANGLE) POLLUTANT: Carbon Monoxide
III. RECEPTOR LOCATIONS
* COORDINATES (M) RECEPTOR * X Y Z ------------*--------------------- 1. R_001_NW * 505370 ****** 1.8 2. R_002_NE * 505397 ****** 1.8 3. R_003_SW * 505374 ****** 1.8 4. R_004_SE * 505417 ****** 1.8
IV. MODEL RESULTS (WORST CASE WIND ANGLE )
Page 2
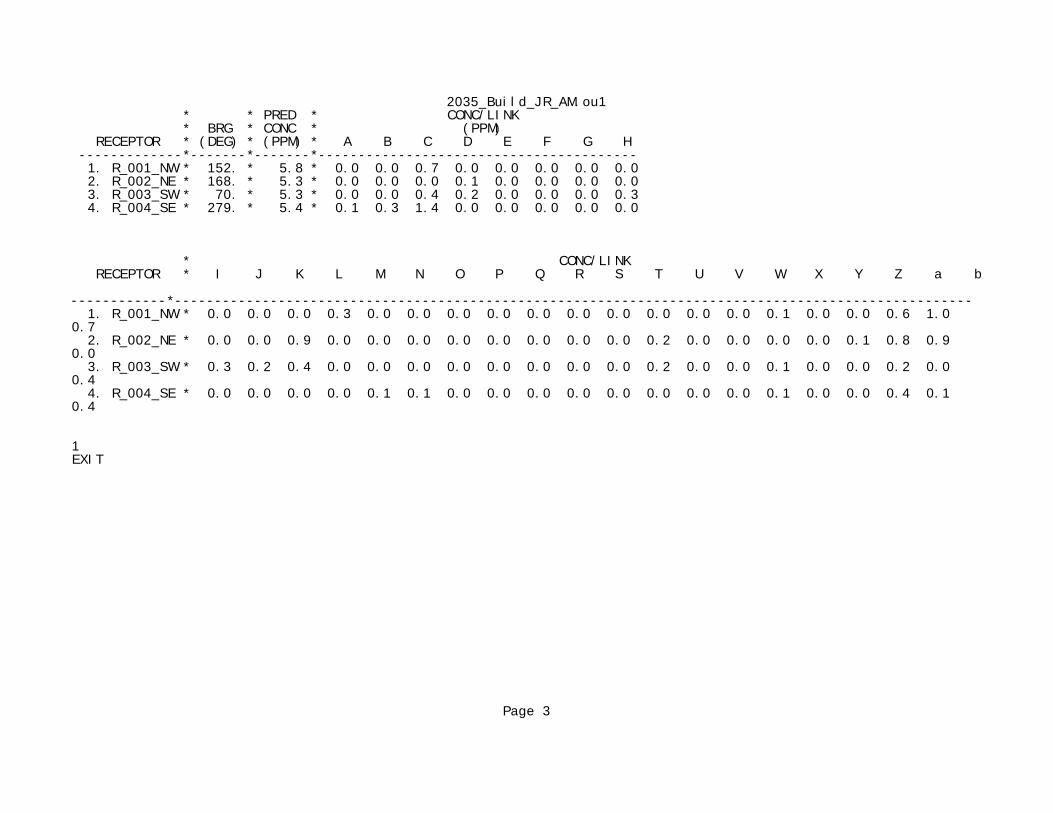
2035_Build_JR_AM.ou1 * * PRED * CONC/LINK * BRG * CONC * (PPM) RECEPTOR * (DEG) * (PPM) * A B C D E F G H -------------*-------*-------*---------------------------------------- 1. R_001_NW * 152. * 5.8 * 0.0 0.0 0.7 0.0 0.0 0.0 0.0 0.0 2. R_002_NE * 168. * 5.3 * 0.0 0.0 0.0 0.1 0.0 0.0 0.0 0.0 3. R_003_SW * 70. * 5.3 * 0.0 0.0 0.4 0.2 0.0 0.0 0.0 0.3 4. R_004_SE * 279. * 5.4 * 0.1 0.3 1.4 0.0 0.0 0.0 0.0 0.0
* CONC/LINK RECEPTOR * I J K L M N O P Q R S T U V W X Y Z a b ------------*---------------------------------------------------------------------------------------------------- 1. R_001_NW * 0.0 0.0 0.0 0.3 0.0 0.0 0.0 0.0 0.0 0.0 0.0 0.0 0.0 0.0 0.1 0.0 0.0 0.6 1.0 0.7 2. R_002_NE * 0.0 0.0 0.9 0.0 0.0 0.0 0.0 0.0 0.0 0.0 0.0 0.2 0.0 0.0 0.0 0.0 0.1 0.8 0.9 0.0 3. R_003_SW * 0.3 0.2 0.4 0.0 0.0 0.0 0.0 0.0 0.0 0.0 0.0 0.2 0.0 0.0 0.1 0.0 0.0 0.2 0.0 0.4 4. R_004_SE * 0.0 0.0 0.0 0.0 0.1 0.1 0.0 0.0 0.0 0.0 0.0 0.0 0.0 0.0 0.1 0.0 0.0 0.4 0.1 0.4
1EXIT
Page 3
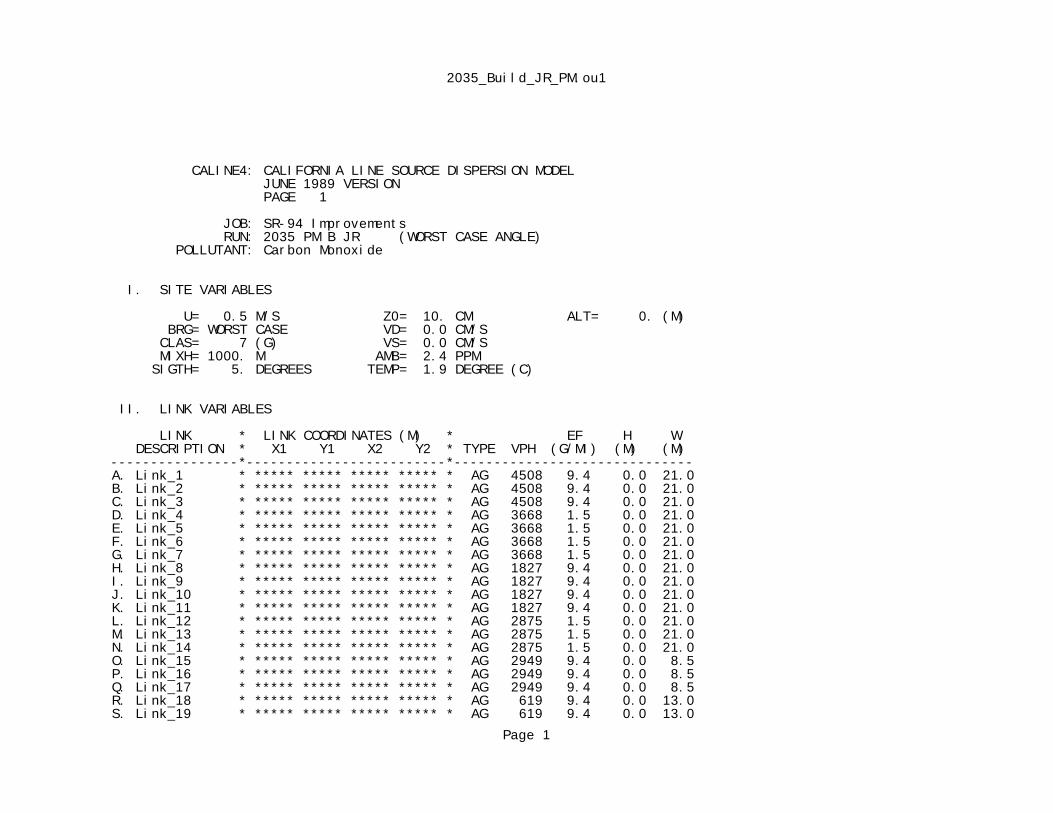
2035_Build_JR_PM.ou1
CALINE4: CALIFORNIA LINE SOURCE DISPERSION MODEL JUNE 1989 VERSION PAGE 1
JOB: SR-94 Improvements RUN: 2035 PM B JR (WORST CASE ANGLE) POLLUTANT: Carbon Monoxide
I. SITE VARIABLES
U= 0.5 M/S Z0= 10. CM ALT= 0. (M) BRG= WORST CASE VD= 0.0 CM/S CLAS= 7 (G) VS= 0.0 CM/S MIXH= 1000. M AMB= 2.4 PPM SIGTH= 5. DEGREES TEMP= 1.9 DEGREE (C)
II. LINK VARIABLES
LINK * LINK COORDINATES (M) * EF H W DESCRIPTION * X1 Y1 X2 Y2 * TYPE VPH (G/MI) (M) (M) ----------------*-------------------------*------------------------------ A. Link_1 * ***** ***** ***** ***** * AG 4508 9.4 0.0 21.0 B. Link_2 * ***** ***** ***** ***** * AG 4508 9.4 0.0 21.0 C. Link_3 * ***** ***** ***** ***** * AG 4508 9.4 0.0 21.0 D. Link_4 * ***** ***** ***** ***** * AG 3668 1.5 0.0 21.0 E. Link_5 * ***** ***** ***** ***** * AG 3668 1.5 0.0 21.0 F. Link_6 * ***** ***** ***** ***** * AG 3668 1.5 0.0 21.0 G. Link_7 * ***** ***** ***** ***** * AG 3668 1.5 0.0 21.0 H. Link_8 * ***** ***** ***** ***** * AG 1827 9.4 0.0 21.0 I. Link_9 * ***** ***** ***** ***** * AG 1827 9.4 0.0 21.0 J. Link_10 * ***** ***** ***** ***** * AG 1827 9.4 0.0 21.0 K. Link_11 * ***** ***** ***** ***** * AG 1827 9.4 0.0 21.0 L. Link_12 * ***** ***** ***** ***** * AG 2875 1.5 0.0 21.0 M. Link_13 * ***** ***** ***** ***** * AG 2875 1.5 0.0 21.0 N. Link_14 * ***** ***** ***** ***** * AG 2875 1.5 0.0 21.0 O. Link_15 * ***** ***** ***** ***** * AG 2949 9.4 0.0 8.5 P. Link_16 * ***** ***** ***** ***** * AG 2949 9.4 0.0 8.5 Q. Link_17 * ***** ***** ***** ***** * AG 2949 9.4 0.0 8.5 R. Link_18 * ***** ***** ***** ***** * AG 619 9.4 0.0 13.0 S. Link_19 * ***** ***** ***** ***** * AG 619 9.4 0.0 13.0
Page 1
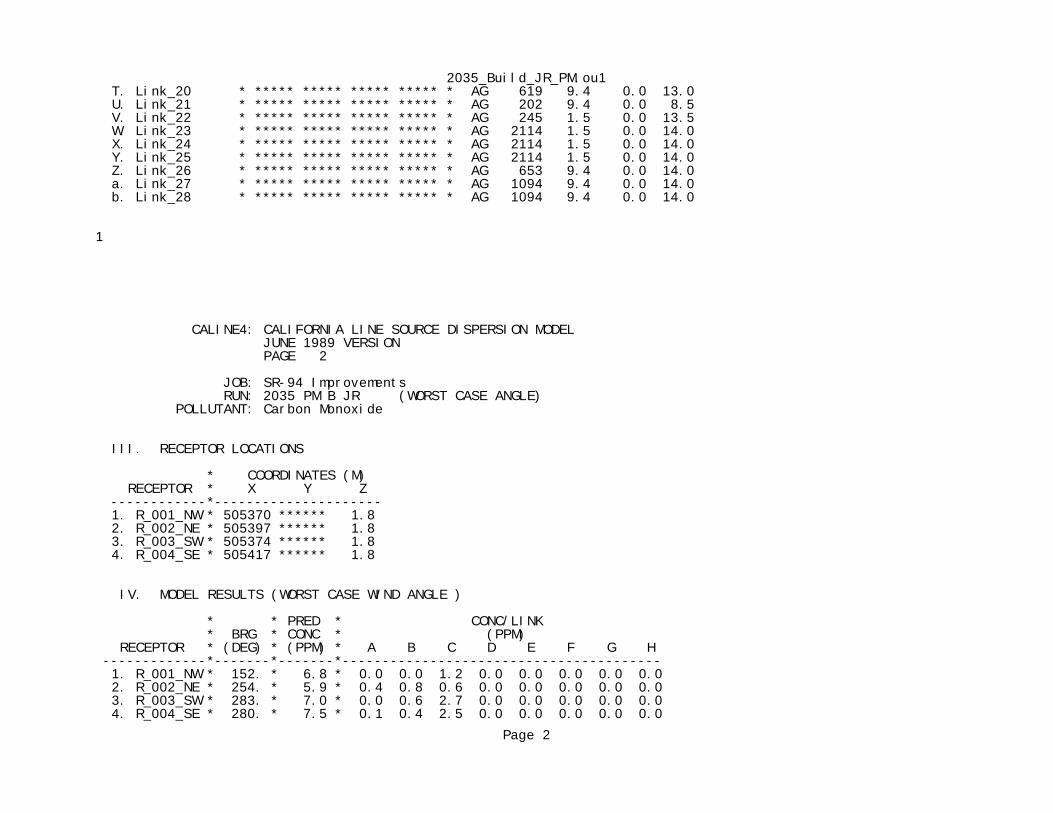
2035_Build_JR_PM.ou1 T. Link_20 * ***** ***** ***** ***** * AG 619 9.4 0.0 13.0 U. Link_21 * ***** ***** ***** ***** * AG 202 9.4 0.0 8.5 V. Link_22 * ***** ***** ***** ***** * AG 245 1.5 0.0 13.5 W. Link_23 * ***** ***** ***** ***** * AG 2114 1.5 0.0 14.0 X. Link_24 * ***** ***** ***** ***** * AG 2114 1.5 0.0 14.0 Y. Link_25 * ***** ***** ***** ***** * AG 2114 1.5 0.0 14.0 Z. Link_26 * ***** ***** ***** ***** * AG 653 9.4 0.0 14.0 a. Link_27 * ***** ***** ***** ***** * AG 1094 9.4 0.0 14.0 b. Link_28 * ***** ***** ***** ***** * AG 1094 9.4 0.0 14.0
1
CALINE4: CALIFORNIA LINE SOURCE DISPERSION MODEL JUNE 1989 VERSION PAGE 2
JOB: SR-94 Improvements RUN: 2035 PM B JR (WORST CASE ANGLE) POLLUTANT: Carbon Monoxide
III. RECEPTOR LOCATIONS
* COORDINATES (M) RECEPTOR * X Y Z ------------*--------------------- 1. R_001_NW * 505370 ****** 1.8 2. R_002_NE * 505397 ****** 1.8 3. R_003_SW * 505374 ****** 1.8 4. R_004_SE * 505417 ****** 1.8
IV. MODEL RESULTS (WORST CASE WIND ANGLE )
* * PRED * CONC/LINK * BRG * CONC * (PPM) RECEPTOR * (DEG) * (PPM) * A B C D E F G H -------------*-------*-------*---------------------------------------- 1. R_001_NW * 152. * 6.8 * 0.0 0.0 1.2 0.0 0.0 0.0 0.0 0.0 2. R_002_NE * 254. * 5.9 * 0.4 0.8 0.6 0.0 0.0 0.0 0.0 0.0 3. R_003_SW * 283. * 7.0 * 0.0 0.6 2.7 0.0 0.0 0.0 0.0 0.0 4. R_004_SE * 280. * 7.5 * 0.1 0.4 2.5 0.0 0.0 0.0 0.0 0.0
Page 2
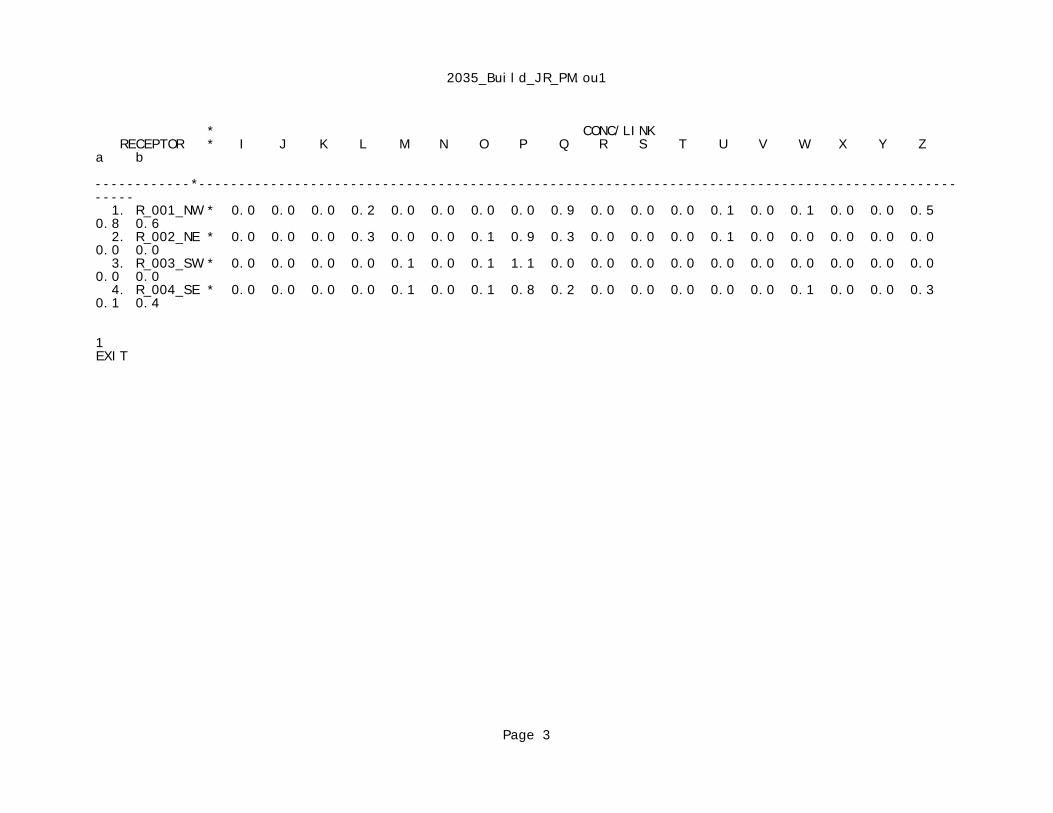
2035_Build_JR_PM.ou1
* CONC/LINK RECEPTOR * I J K L M N O P Q R S T U V W X Y Z a b ------------*---------------------------------------------------------------------------------------------------- 1. R_001_NW * 0.0 0.0 0.0 0.2 0.0 0.0 0.0 0.0 0.9 0.0 0.0 0.0 0.1 0.0 0.1 0.0 0.0 0.5 0.8 0.6 2. R_002_NE * 0.0 0.0 0.0 0.3 0.0 0.0 0.1 0.9 0.3 0.0 0.0 0.0 0.1 0.0 0.0 0.0 0.0 0.0 0.0 0.0 3. R_003_SW * 0.0 0.0 0.0 0.0 0.1 0.0 0.1 1.1 0.0 0.0 0.0 0.0 0.0 0.0 0.0 0.0 0.0 0.0 0.0 0.0 4. R_004_SE * 0.0 0.0 0.0 0.0 0.1 0.0 0.1 0.8 0.2 0.0 0.0 0.0 0.0 0.0 0.1 0.0 0.0 0.3 0.1 0.4
1EXIT
Page 3

2035_Build_JB_AM.ou1
CALINE4: CALIFORNIA LINE SOURCE DISPERSION MODEL JUNE 1989 VERSION PAGE 1
JOB: SR-94 Improvements RUN: 2035 AM B JB (WORST CASE ANGLE) POLLUTANT: Carbon Monoxide
I. SITE VARIABLES
U= 0.5 M/S Z0= 10. CM ALT= 0. (M) BRG= WORST CASE VD= 0.0 CM/S CLAS= 7 (G) VS= 0.0 CM/S MIXH= 1000. M AMB= 2.4 PPM SIGTH= 5. DEGREES TEMP= 1.9 DEGREE (C)
II. LINK VARIABLES
LINK * LINK COORDINATES (M) * EF H W DESCRIPTION * X1 Y1 X2 Y2 * TYPE VPH (G/MI) (M) (M) ----------------*-------------------------*------------------------------ A. Link_1 * ***** ***** ***** ***** * AG 3277 9.4 0.0 21.0 B. Link_2 * ***** ***** ***** ***** * AG 3277 9.4 0.0 21.0 C. Link_3 * ***** ***** ***** ***** * AG 3277 9.4 0.0 21.0 D. Link_4 * ***** ***** ***** ***** * AG 2022 1.5 0.0 21.0 E. Link_5 * ***** ***** ***** ***** * AG 2022 1.5 0.0 21.0 F. Link_6 * ***** ***** ***** ***** * AG 2022 1.5 0.0 21.0 G. Link_7 * ***** ***** ***** ***** * AG 2022 1.5 0.0 21.0 H. Link_8 * ***** ***** ***** ***** * AG 2228 9.4 0.0 21.0 I. Link_9 * ***** ***** ***** ***** * AG 2228 9.4 0.0 21.0 J. Link_10 * ***** ***** ***** ***** * AG 2228 9.4 0.0 21.0 K. Link_11 * ***** ***** ***** ***** * AG 2757 1.5 0.0 21.0 L. Link_12 * ***** ***** ***** ***** * AG 2757 1.5 0.0 21.0 M. Link_13 * ***** ***** ***** ***** * AG 2757 1.5 0.0 21.0 N. Link_14 * ***** ***** ***** ***** * AG 13 9.4 0.0 9.6 O. Link_15 * ***** ***** ***** ***** * AG 13 9.4 0.0 9.6
Page 1
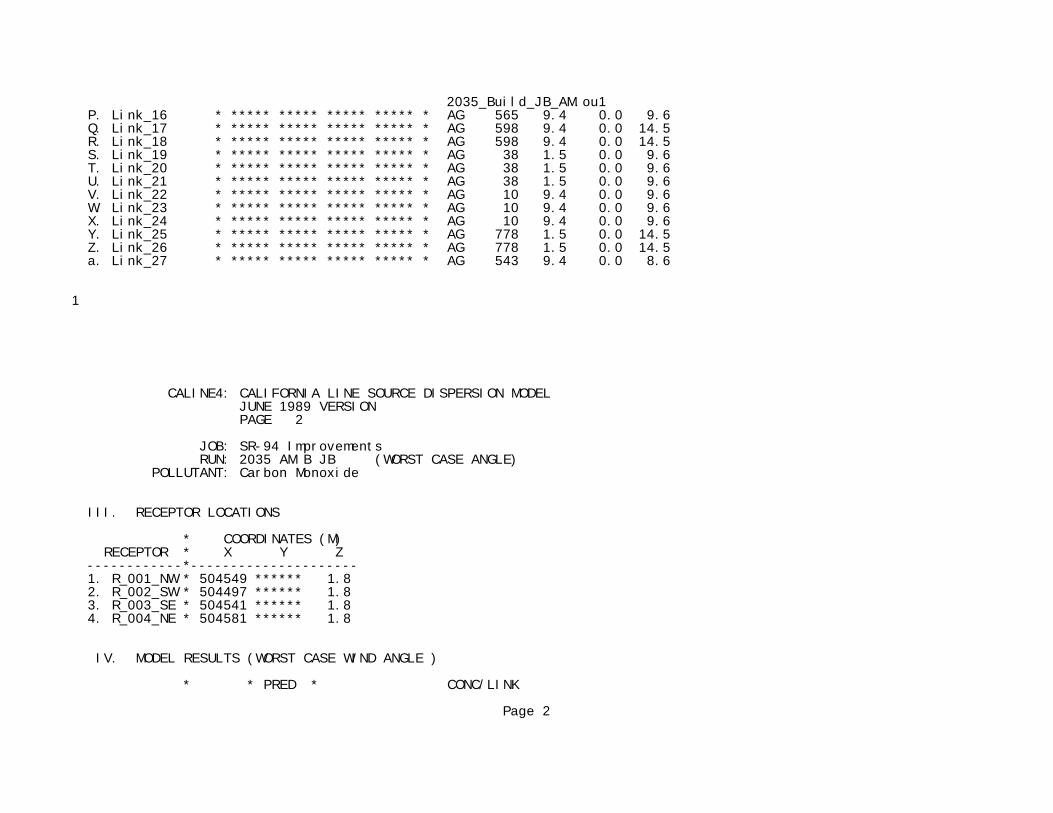
2035_Build_JB_AM.ou1 P. Link_16 * ***** ***** ***** ***** * AG 565 9.4 0.0 9.6 Q. Link_17 * ***** ***** ***** ***** * AG 598 9.4 0.0 14.5 R. Link_18 * ***** ***** ***** ***** * AG 598 9.4 0.0 14.5 S. Link_19 * ***** ***** ***** ***** * AG 38 1.5 0.0 9.6 T. Link_20 * ***** ***** ***** ***** * AG 38 1.5 0.0 9.6 U. Link_21 * ***** ***** ***** ***** * AG 38 1.5 0.0 9.6 V. Link_22 * ***** ***** ***** ***** * AG 10 9.4 0.0 9.6 W. Link_23 * ***** ***** ***** ***** * AG 10 9.4 0.0 9.6 X. Link_24 * ***** ***** ***** ***** * AG 10 9.4 0.0 9.6 Y. Link_25 * ***** ***** ***** ***** * AG 778 1.5 0.0 14.5 Z. Link_26 * ***** ***** ***** ***** * AG 778 1.5 0.0 14.5 a. Link_27 * ***** ***** ***** ***** * AG 543 9.4 0.0 8.6
1
CALINE4: CALIFORNIA LINE SOURCE DISPERSION MODEL JUNE 1989 VERSION PAGE 2
JOB: SR-94 Improvements RUN: 2035 AM B JB (WORST CASE ANGLE) POLLUTANT: Carbon Monoxide
III. RECEPTOR LOCATIONS
* COORDINATES (M) RECEPTOR * X Y Z ------------*--------------------- 1. R_001_NW * 504549 ****** 1.8 2. R_002_SW * 504497 ****** 1.8 3. R_003_SE * 504541 ****** 1.8 4. R_004_NE * 504581 ****** 1.8
IV. MODEL RESULTS (WORST CASE WIND ANGLE )
* * PRED * CONC/LINK
Page 2
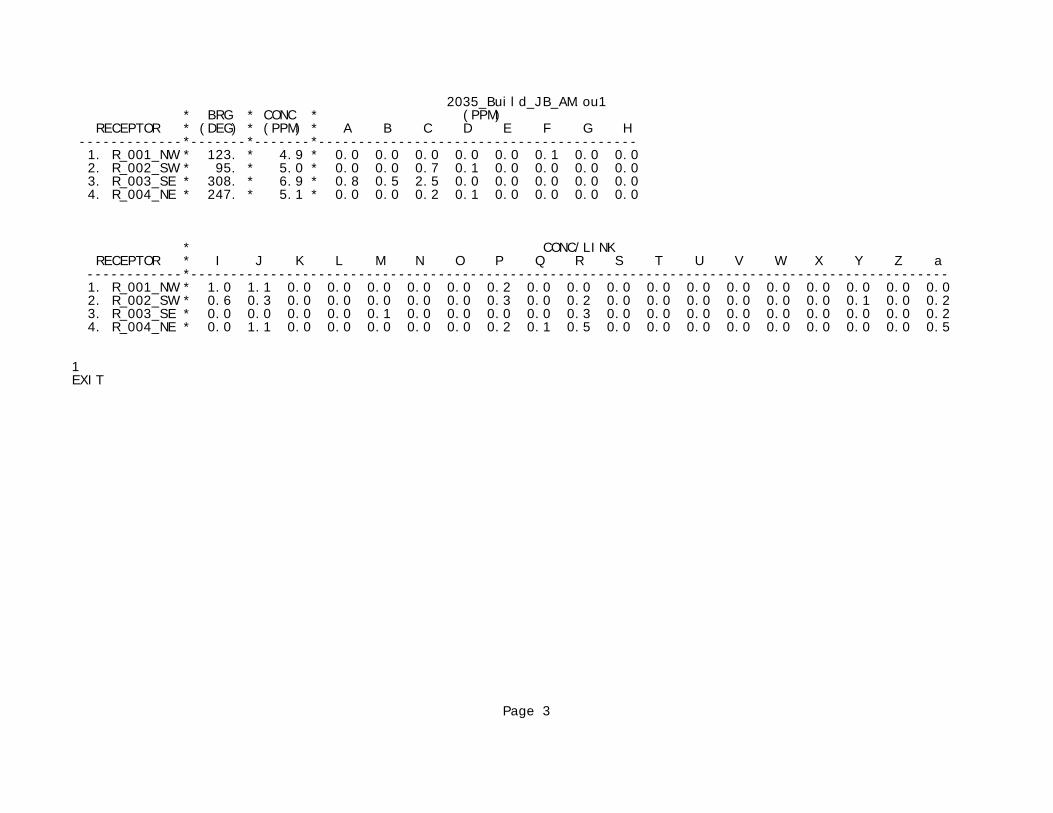
2035_Build_JB_AM.ou1 * BRG * CONC * (PPM) RECEPTOR * (DEG) * (PPM) * A B C D E F G H -------------*-------*-------*---------------------------------------- 1. R_001_NW * 123. * 4.9 * 0.0 0.0 0.0 0.0 0.0 0.1 0.0 0.0 2. R_002_SW * 95. * 5.0 * 0.0 0.0 0.7 0.1 0.0 0.0 0.0 0.0 3. R_003_SE * 308. * 6.9 * 0.8 0.5 2.5 0.0 0.0 0.0 0.0 0.0 4. R_004_NE * 247. * 5.1 * 0.0 0.0 0.2 0.1 0.0 0.0 0.0 0.0
* CONC/LINK RECEPTOR * I J K L M N O P Q R S T U V W X Y Z a ------------*----------------------------------------------------------------------------------------------- 1. R_001_NW * 1.0 1.1 0.0 0.0 0.0 0.0 0.0 0.2 0.0 0.0 0.0 0.0 0.0 0.0 0.0 0.0 0.0 0.0 0.0 2. R_002_SW * 0.6 0.3 0.0 0.0 0.0 0.0 0.0 0.3 0.0 0.2 0.0 0.0 0.0 0.0 0.0 0.0 0.1 0.0 0.2 3. R_003_SE * 0.0 0.0 0.0 0.0 0.1 0.0 0.0 0.0 0.0 0.3 0.0 0.0 0.0 0.0 0.0 0.0 0.0 0.0 0.2 4. R_004_NE * 0.0 1.1 0.0 0.0 0.0 0.0 0.0 0.2 0.1 0.5 0.0 0.0 0.0 0.0 0.0 0.0 0.0 0.0 0.5
1EXIT
Page 3
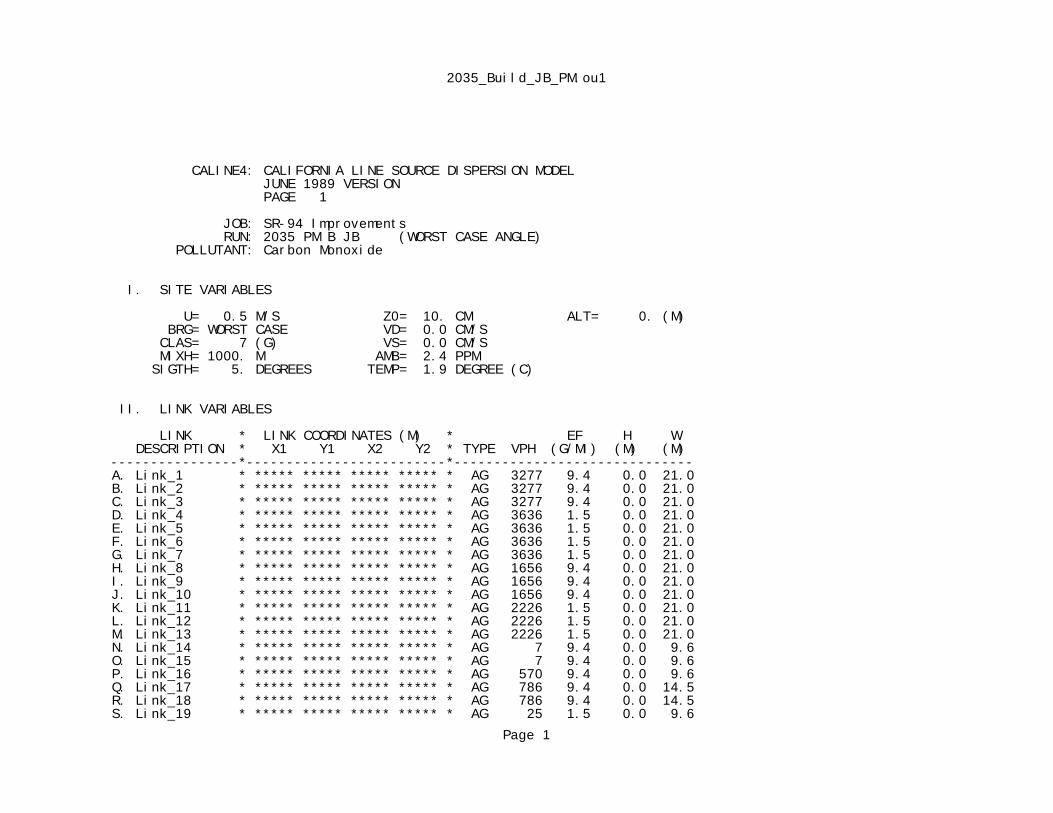
2035_Build_JB_PM.ou1
CALINE4: CALIFORNIA LINE SOURCE DISPERSION MODEL JUNE 1989 VERSION PAGE 1
JOB: SR-94 Improvements RUN: 2035 PM B JB (WORST CASE ANGLE) POLLUTANT: Carbon Monoxide
I. SITE VARIABLES
U= 0.5 M/S Z0= 10. CM ALT= 0. (M) BRG= WORST CASE VD= 0.0 CM/S CLAS= 7 (G) VS= 0.0 CM/S MIXH= 1000. M AMB= 2.4 PPM SIGTH= 5. DEGREES TEMP= 1.9 DEGREE (C)
II. LINK VARIABLES
LINK * LINK COORDINATES (M) * EF H W DESCRIPTION * X1 Y1 X2 Y2 * TYPE VPH (G/MI) (M) (M) ----------------*-------------------------*------------------------------ A. Link_1 * ***** ***** ***** ***** * AG 3277 9.4 0.0 21.0 B. Link_2 * ***** ***** ***** ***** * AG 3277 9.4 0.0 21.0 C. Link_3 * ***** ***** ***** ***** * AG 3277 9.4 0.0 21.0 D. Link_4 * ***** ***** ***** ***** * AG 3636 1.5 0.0 21.0 E. Link_5 * ***** ***** ***** ***** * AG 3636 1.5 0.0 21.0 F. Link_6 * ***** ***** ***** ***** * AG 3636 1.5 0.0 21.0 G. Link_7 * ***** ***** ***** ***** * AG 3636 1.5 0.0 21.0 H. Link_8 * ***** ***** ***** ***** * AG 1656 9.4 0.0 21.0 I. Link_9 * ***** ***** ***** ***** * AG 1656 9.4 0.0 21.0 J. Link_10 * ***** ***** ***** ***** * AG 1656 9.4 0.0 21.0 K. Link_11 * ***** ***** ***** ***** * AG 2226 1.5 0.0 21.0 L. Link_12 * ***** ***** ***** ***** * AG 2226 1.5 0.0 21.0 M. Link_13 * ***** ***** ***** ***** * AG 2226 1.5 0.0 21.0 N. Link_14 * ***** ***** ***** ***** * AG 7 9.4 0.0 9.6 O. Link_15 * ***** ***** ***** ***** * AG 7 9.4 0.0 9.6 P. Link_16 * ***** ***** ***** ***** * AG 570 9.4 0.0 9.6 Q. Link_17 * ***** ***** ***** ***** * AG 786 9.4 0.0 14.5 R. Link_18 * ***** ***** ***** ***** * AG 786 9.4 0.0 14.5 S. Link_19 * ***** ***** ***** ***** * AG 25 1.5 0.0 9.6
Page 1

2035_Build_JB_PM.ou1 T. Link_20 * ***** ***** ***** ***** * AG 25 1.5 0.0 9.6 U. Link_21 * ***** ***** ***** ***** * AG 25 1.5 0.0 9.6 V. Link_22 * ***** ***** ***** ***** * AG 19 9.4 0.0 9.6 W. Link_23 * ***** ***** ***** ***** * AG 19 9.4 0.0 9.6 X. Link_24 * ***** ***** ***** ***** * AG 19 9.4 0.0 9.6 Y. Link_25 * ***** ***** ***** ***** * AG 992 1.5 0.0 14.5 Z. Link_26 * ***** ***** ***** ***** * AG 992 1.5 0.0 14.5 a. Link_27 * ***** ***** ***** ***** * AG 372 9.4 0.0 8.6
1
CALINE4: CALIFORNIA LINE SOURCE DISPERSION MODEL JUNE 1989 VERSION PAGE 2
JOB: SR-94 Improvements RUN: 2035 PM B JB (WORST CASE ANGLE) POLLUTANT: Carbon Monoxide
III. RECEPTOR LOCATIONS
* COORDINATES (M) RECEPTOR * X Y Z ------------*--------------------- 1. R_001_NW * 504549 ****** 1.8 2. R_002_SW * 504497 ****** 1.8 3. R_003_SE * 504541 ****** 1.8 4. R_004_NE * 504581 ****** 1.8
IV. MODEL RESULTS (WORST CASE WIND ANGLE )
* * PRED * CONC/LINK * BRG * CONC * (PPM) RECEPTOR * (DEG) * (PPM) * A B C D E F G H -------------*-------*-------*---------------------------------------- 1. R_001_NW * 123. * 4.4 * 0.0 0.0 0.0 0.0 0.0 0.1 0.1 0.0 2. R_002_SW * 95. * 4.9 * 0.0 0.0 0.7 0.2 0.0 0.0 0.0 0.0 3. R_003_SE * 308. * 6.9 * 0.8 0.5 2.5 0.0 0.0 0.0 0.0 0.0 4. R_004_NE * 246. * 4.9 * 0.0 0.0 0.1 0.1 0.0 0.0 0.0 0.0
Page 2
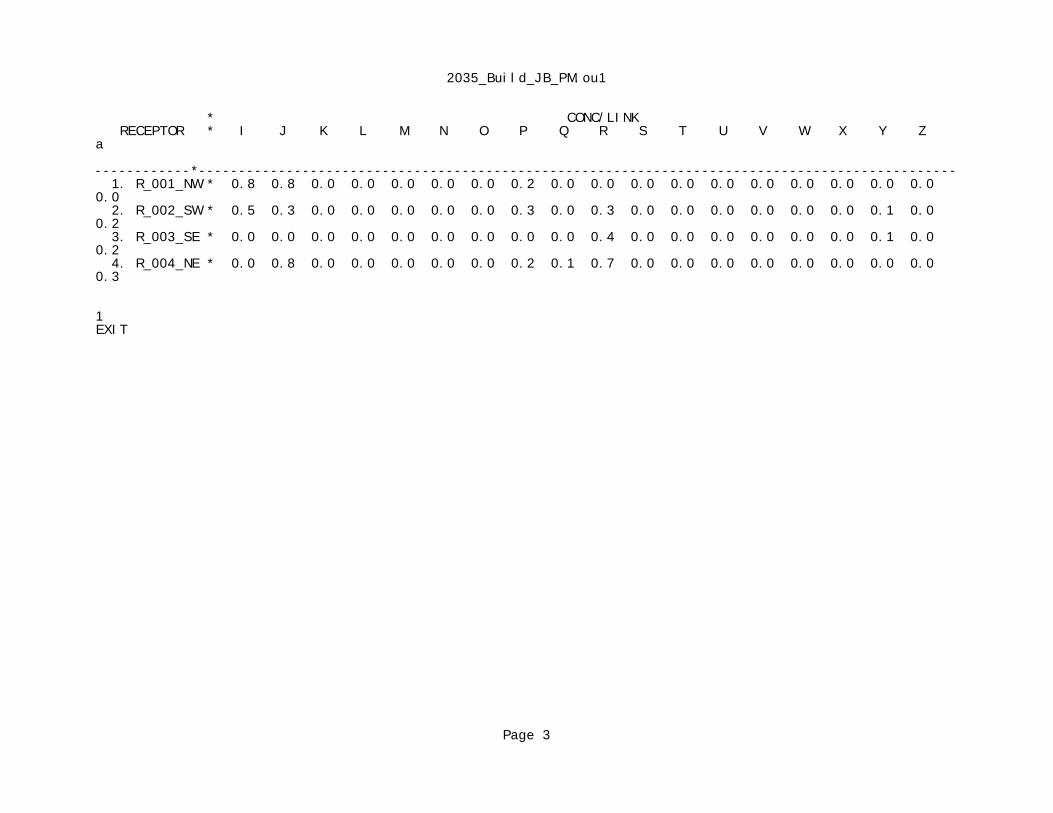
2035_Build_JB_PM.ou1
* CONC/LINK RECEPTOR * I J K L M N O P Q R S T U V W X Y Z a ------------*----------------------------------------------------------------------------------------------- 1. R_001_NW * 0.8 0.8 0.0 0.0 0.0 0.0 0.0 0.2 0.0 0.0 0.0 0.0 0.0 0.0 0.0 0.0 0.0 0.0 0.0 2. R_002_SW * 0.5 0.3 0.0 0.0 0.0 0.0 0.0 0.3 0.0 0.3 0.0 0.0 0.0 0.0 0.0 0.0 0.1 0.0 0.2 3. R_003_SE * 0.0 0.0 0.0 0.0 0.0 0.0 0.0 0.0 0.0 0.4 0.0 0.0 0.0 0.0 0.0 0.0 0.1 0.0 0.2 4. R_004_NE * 0.0 0.8 0.0 0.0 0.0 0.0 0.0 0.2 0.1 0.7 0.0 0.0 0.0 0.0 0.0 0.0 0.0 0.0 0.3
1EXIT
Page 3