air quality technical memorandum - fastracks home · 4 the official level of the annual no2...
TRANSCRIPT
Air Quality Technical Memorandum
Southeast Extension Project Lincoln Station to RidgeGate Parkway
Prepared for:
Federal Transit Administration
Prepared by:
Denver Regional Transportation District
May 2014
Southeast Extension Air Quality Technical Memorandum
TOC-1
Table of Contents Page No.
Chapter 1.0 Introduction ......................................................................................................... 1-1
1.1 Background .............................................................................................................. 1-1
1.2 Regulatory Environment ........................................................................................... 1-1
1.2.1 Statutes and Regulations Affecting Air Quality ............................................. 1-1
1.2.2 Ambient Air Quality Standards ..................................................................... 1-4
1.2.3 Attainment Status and SIP Requirements .................................................... 1-5
1.2.4 Conformity of 2035 Regional Transportation Plan and 2012-2017 TIP with SIP ........................................................................................................... 1-6
1.3 Pollutants of Concern ............................................................................................... 1-7
1.3.1 Special Issues for Ozone .............................................................................. 1-7
1.3.2 Mobile Source Air Toxics .............................................................................. 1-8
1.3.3 Climate Change and Greenhouse Gases ..................................................... 1-9
Chapter 2.0 Alternatives Evaluated ........................................................................................ 2-1
Chapter 3.0 Affected Environment ......................................................................................... 3-1
3.1 Climate ..................................................................................................................... 3-1
3.2 Project Description ................................................................................................... 3-1
3.3 Description of Existing Conditions ............................................................................ 3-1
3.4 Air Quality Monitoring Results .................................................................................. 3-1
3.5 Future Conditions Issues .......................................................................................... 3-3
Chapter 4.0 Impact Evaluation ................................................................................................ 4-1
4.1 Methodology ............................................................................................................. 4-1
4.1.1 Intersection CO Analysis .............................................................................. 4-1
4.1.2 Parking Facility Carbon Monoxide Analysis ................................................. 4-3
4.1.3 Indirect Emissions ........................................................................................ 4-6
4.1.4 Construction Emissions ................................................................................ 4-6
4.2 Direct Impacts .......................................................................................................... 4-7
4.2.1 No Action Alternative .................................................................................... 4-7
4.2.2 Preferred Alternative ..................................................................................... 4-8
4.3 Indirect Impacts ...................................................................................................... 4-10
4.3.1 No Action Alternative .................................................................................. 4-10
4.3.2 Preferred Alternative ................................................................................... 4-10

Southeast Extension Air Quality Technical Memorandum
TOC-2
4.4 Temporary Construction Impacts ........................................................................... 4-10
4.4.1 No Action Alternative .................................................................................. 4-10
4.4.2 Preferred Alternative ................................................................................... 4-10
4.5 Cumulative Impacts ................................................................................................ 4-11
4.5.1 No Action Alternative .................................................................................. 4-11
4.5.2 Preferred Alternative ................................................................................... 4-11
4.6 Mitigation ................................................................................................................ 4-12
Chapter 5.0 References ........................................................................................................... 5-1
Appendices Appendix A 2012-2017 Transportation Improvement Program – Southeast Corridor
Extension: Lincoln Avenue to RidgeGate Parkway
Appendix B Mobile 6.2 Output Emission Factors
Appendix C Carbon Monoxide Hot Spot Analysis – CAL3QHC Input and Output Files
Appendix D Parking Facility Carbon Monoxide Analysis
Appendix E Acronyms
List of Figures Figure 1-1: FasTracks Plan ....................................................................................................... 1-2
Figure 1-2: Study Area .............................................................................................................. 1-3
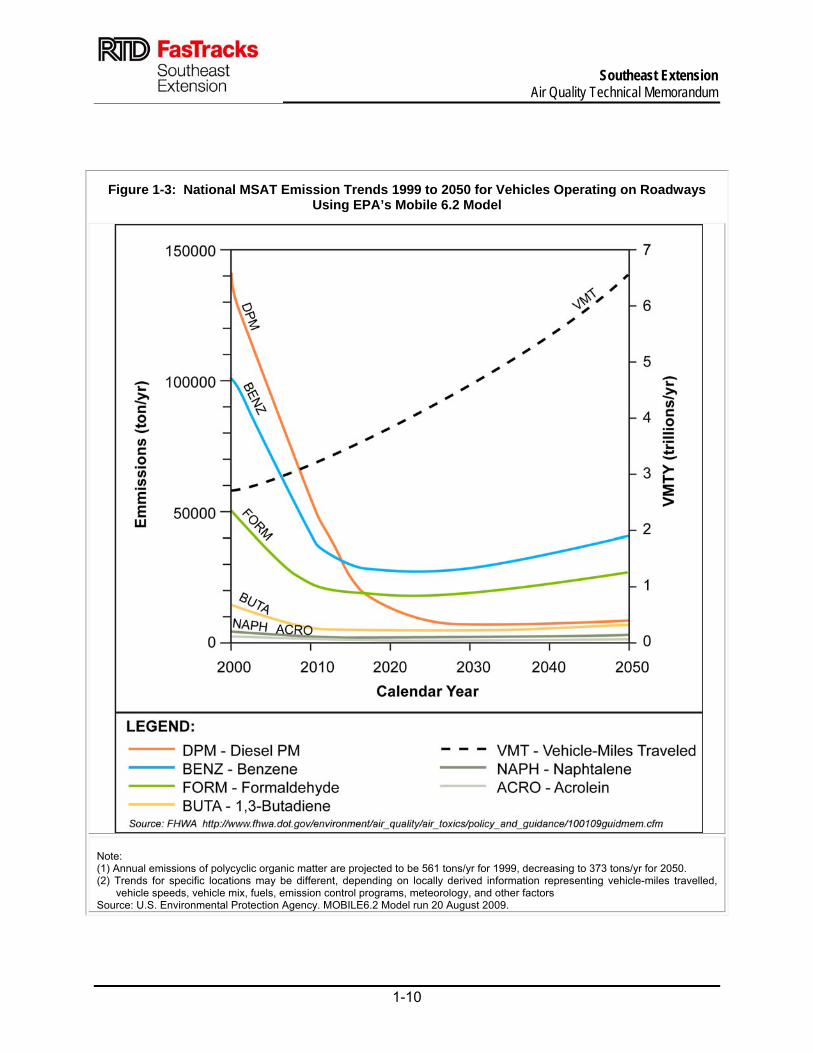
Figure 1-3: National MSAT Emission Trends 1999 to 2050 for Vehicles Operating on Roadways Using EPA’s Mobile 6.2 Model ............................................................................ 1-10
Figure 2-1: No Action Alternative .............................................................................................. 2-1
Figure 2-2: Preferred Alternative ............................................................................................... 2-3
List of Tables Table 1-1: Colorado and National Ambient Air Quality Standards ............................................ 1-4
Table 3-1: Summary of Pollutant Levels for Monitoring Stations in the Denver Region ........... 3-2
Table 4-1: Annual Regional Criteria Pollutant Emissions - No Action versus Preferred Alternative ................................................................................................................... 4-7
Table 4-2: Maximum Carbon Monoxide Concentrations at Hot Spot Intersection, 2035 .......... 4-8
Table 4-3: Maximum Carbon Monoxide Concentrations at Hot Spot Intersection, 2035 .......... 4-9
Table 4-4: Automobile and Buses Carbon Monoxide Emissions at the Largest Station ........... 4-9
Table 4-5: Maximum Predicted Carbon Monoxide Concentrations .......................................... 4-9
Table 4-6: Greenhouse Gas Emissions .................................................................................. 4-10
Table 4-7: Summary of Impacts and Mitigation ...................................................................... 4-13
Southeast Extension Air Quality Technical Memorandum
1-1
Chapter 1.0 Introduction
This Technical Memorandum was prepared in support of the Southeast Extension Environmental Assessment initiated by RTD in 2012. It focuses on the air quality analysis for the No Action Alternative and Preferred Alternative of the Southeast Extension Project. The purpose of the air quality analysis is to evaluate the potential impacts of the project on the air quality of the study area. This Technical Memorandum documents the study methodology, results, and impacts to conformity and mitigation measures for air quality impacts. The Preferred Alternative would not result in any air quality standard violations. Air quality impacts may result from the short-term construction of the project. Short-term impacts would result from equipment emissions during the site preparation, and construction activities such as clearing, grading, excavation, and demolition.
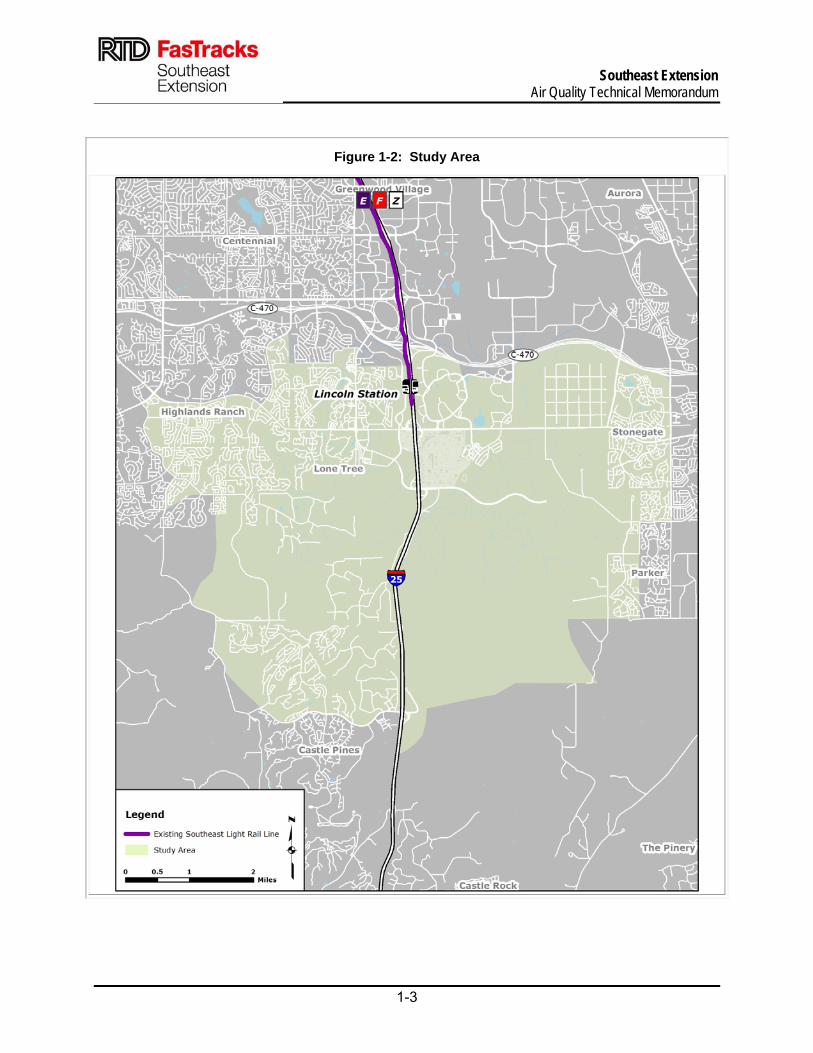
1.1 Background In November 2004, Regional Transportation District (RTD) voters approved the FasTracks initiative to expand and improve public transit service within the Denver Metropolitan Region (Metro Region). The comprehensive FasTracks Plan, which formed the basis of the FasTracks ballot initiative, includes the construction and operation of new fixed-guideway transit lines, improved bus service, and park-n-rides throughout the Metro Region. The Southeast Extension was included in the RTD FasTracks program and is in the currently adopted Regional Transportation Plan (RTP). The fixed-guideway transit elements (rail and bus rapid transit) of the FasTracks Plan are shown in Figure 1-1. The proposed action is to extend transit service south into the City of Lone Tree to serve the increased population and employment generated by planned development in the City of Lone Tree. The Southeast Extension study area is located in northern Douglas County, and includes the City of Lone Tree and portions of Highlands Ranch and the Town of Parker. It begins at the existing end-of-line Lincoln Avenue LRT station and extends south along I-25 to the I-25/RidgeGate Parkway interchange. It includes areas of planned development south of Lincoln Avenue on the east and west side of I-25 (see Figure 1-2).
1.2 Regulatory Environment
1.2.1 Statutes and Regulations Affecting Air Quality
The regulatory structure for air quality planning in Colorado includes federal, state, regional, and local agencies. These agencies either have regulatory authority or are responsible for the development and implementation of programs and plans designed to reduce air pollution levels, including emissions from transportation sources.

Southeast Extension Air Quality Technical Memorandum
1-2
Figure 1-1: FasTracks Plan
Southeast Extension Air Quality Technical Memorandum
1-3
Figure 1-2: Study Area

Southeast Extension Air Quality Technical Memorandum
1-4
Federal air quality policies are regulated through the federal Clean Air Act (CAA). The United States Environmental Protection Agency (EPA) adopted the CAA in 1970 and its Amendments in 1977 and 1990. Pursuant to the CAA, the EPA has established nationwide air quality standards to protect public health and welfare with an adequate margin of safety. These federal standards, known as the national ambient air quality standards (NAAQS), represent the maximum allowable atmospheric concentrations, and were developed for six “criteria pollutants”: ozone (O3), nitrogen dioxide (NO2), carbon monoxide (CO), particulate matter less than 10 microns in aerodynamic diameter (PM10), particulate matter less than 2.5 microns in aerodynamic diameter (PM2.5), and sulfur dioxide (SO2).
1.2.2 Ambient Air Quality Standards
The Colorado Air Pollution Control Division (APCD) oversees Colorado air quality policies and is responsible for preparing and submitting the State Implementation Plan (SIP) to the EPA. Colorado adopted the NAAQS as the state ambient air quality standards. The NAAQS ambient air quality standards are summarized in Table 1-1 and represent safe levels that allow for avoidance of specific adverse health and welfare effects associated with each pollutant. Table 1-1: Colorado and National Ambient Air Quality Standards
Pollutant Averaging Time
Colorado and National Ambient Air Quality Standards1
Primary2 Secondary2
Ozone (O3) 8-hour3 0.075 ppm 0.075 ppm
Carbon dioxide (CO) 8-hour 1-hour
9 ppm 35 ppm
-- --
Nitrogen dioxide (NO2) Annual average4
1-hour 53 ppb 100 ppb
53 ppb --
Sulfur dioxide (SO2) 1-hour5 3-hour
75 ppb --
-- 0.5 ppm
Particulate Matter (PM10) 24-hour 150 µg/m3 150 µg/m3
PM2.5 Annual arithmetic mean 24-hour
15 µg/m3 35 µg/m3
15 µg/m3 35 µg/m3
Lead (pB) Rolling 3 month average6 0.15 µg/m3 0.15 µg/m3
Source: USEPA, 2012a. Notes: 1 Colorado adopted the National Ambient Air Quality Standards (NAAQS) as the state ambient air quality standards. 2 ppm = parts per million; ppb = parts per billion; μg/m3 = micrograms per cubic meter; -- = not applicable 3 Final rule signed March 12, 2008. The 1997 ozone standard (0.08 ppm, annual fourth-highest daily maximum 8-hour concentration, averaged over three years) and related implementation rules remain in place. In 1997, EPA revoked the 1-hour ozone standard (0.12 ppm, not to be exceeded more than once per year) in all areas, although some areas have continued obligations under that standard (“anti-backsliding”). The 1-hour ozone standard is attained when the expected number of days per calendar year with maximum hourly average concentrations above 0.12 ppm is less than or equal to 1. 4 The official level of the annual NO2 standard is 0.053 ppm, equal to 53 ppb, which is shown here for the purpose of clearer
comparison to the 1-hour standard. 5 Final rule signed June 2, 2010. The 1971 annual and 24-hour SO2 standards were revoked in that same rulemaking. However,
these standards remain in effect until one year after an area is designated for the 2010 standard, except in areas designated nonattainment for the 1971 standards, where the 1971 standards remain in effect until implementation plans to attain or maintain the 2010 standard are approved. 6 Final rule signed October 15, 2008. The 1978 lead standard (1.5 µg/m3 as a quarterly average) remains in effect until one year after an area is designated for the 2008 standard, except that in areas designated nonattainment for the 1978, the 1978 standard remains in effect until implementation plans to attain or maintain the 2008 standard are approved.

Southeast Extension Air Quality Technical Memorandum
1-5
1.2.3 Attainment Status and SIP Requirements
The CAA defines non-attainment areas as geographic regions that have been designated as not meeting one or more of the NAAQS, and defines maintenance areas as former non-attainment areas that subsequently demonstrated compliance with the standards. The Denver Metropolitan and North Front Range area is designated as a “non-attainment” area for the 8-hour ozone standard. On November 20, 2007, the EPA allowed the non-attainment designation to take effect. The Denver area is also designated as a maintenance area for CO and PM10, and an attainment area for the other criteria pollutants. The CAA requires that an attainment plan be prepared for each non-attainment area, and a maintenance plan be prepared for each former non-attainment area. The SIP outlines how the state will meet the NAAQS under the deadlines established by the CAA. In addition, EPA’s Transportation Conformity Rule requires Metropolitan Planning Organizations, the Federal Highway Administration (FHWA), and the Federal Transit Administration (FTA) to make conformity determinations on projects before they are approved. Transit projects that are funded or approved by the FTA must be consistent with the policies and purpose of the conforming transportation plan. Conformity to the purpose of a SIP means that transportation activities will not cause new air quality violations, worsen existing conditions, or delay timely attainment of the NAAQS. Several sections of the CAA describe the planning obligations for each state to achieve healthy air quality. Section 110 of the CAA requires states to submit SIPs to EPA that provide for implementation, maintenance, and enforcement of the primary and secondary NAAQS established by EPA under Title I of the CAA Section 172. Other provisions in Title I, Part D, of the CAA identify additional SIP requirements for areas that do not meet the NAAQS and that have been designated as non-attainment under Section 107 of the CAA. Section 175A of the CAA describes the maintenance plan requirements for states wishing to redesignate an area from non-attainment to attainment. Additionally, SIPs contain state air regulations that, for example, allow states to permit the construction and operation of stationary sources, establish specific requirements for categories of stationary sources, and identify open burning requirements. Each SIP revision submitted by the state must undergo reasonable notice and public hearing at the state level, and SIPs submitted to EPA to attain or maintain the NAAQS must include enforceable emission limitations and other control measures, schedules, and timetables for compliance. The EPA evaluates submitted SIPs to determine if they meet the CAA’s requirements. If a SIP meets the CAA's requirements, EPA will approve the SIP. EPA's notice of approval is published in the Federal Register and the approval is then codified in the Code of Federal Regulations (CFR) at 40 CFR Part 52. Once EPA approves a SIP, it is enforceable by EPA and citizens in federal district court. The designation status for an area, i.e., whether the area is designated as attainment, non-attainment or unclassifiable, is contained in 40 CFR Part 81.
Southeast Extension Air Quality Technical Memorandum
1-6
1.2.4 Conformity of 2035 Regional Transportation Plan and 2012-2017 TIP with SIP
A Regional Transportation Plan (RTP) is the official intermodal metropolitan transportation plan that is developed through the metropolitan planning process for the metropolitan planning area. A Transportation Improvement Program (TIP) is a staged, multi-year, intermodal program of transportation projects covering a metropolitan planning area, which is consistent with the Metropolitan Transportation Plan or RTP. The RTP must specifically describe the transportation system envisioned for certain future years. The RTP must also quantify and document the demographic and employment factors influencing expected transportation demand, including land use forecasts. The additions and modifications to the transportation network also must be sufficiently specific to show that there is a reasonable relationship between expected land use and the envisioned transportation system. It is a requirement that the RTP, TIP, and their approved projects respond to anticipated growth and show the relationship of these projects to land use, population growth, and employment. Therefore, projects in the approved plans and programs respond to, but do not induce, these growth factors. If the National Environmental Policy Act (NEPA) process results in a project with design concept and scope significantly different from that in the RTP or TIP, then the project must meet the criteria for development of a conforming RTP and TIP before completion of the NEPA process. In other words, the NEPA process must be incorporated into the RTP and TIP and meet the same criteria as described above. Colorado Air Quality Control Commission Regulation No. 10,”Criteria for Analysis of Conformity” requires that RTPs and TIPs conform to the SIP. As part of the SIP development process, an emissions budget for CO is established for non-attainment and attainment maintenance areas to maintain the NAAQS. In addition, Regulation No. 10 sets the requirements for air quality analysis for regional and “hotspot” air quality analysis on a project level. This includes the requirements for modeling and screening analysis of the selected project. These requirements have been incorporated in this air quality analysis. The CAA requires that federally-funded transportation plans, programs, and projects in non-attainment areas conform to the SIP air quality. Air quality conformity analysis of the 2035 RTP and the 2012 – 2017 TIP was prepared, consistent with the most recent set of amendments to streamline the EPA’s transportation conformity rule. The FHWA and FTA signed a reconfirmation of the conformity finding for the 2035 RTP in March 2008. The Southeast Extension project is included in the Fiscally Constrained 2035 Regional Transportation Plan (DRCOG, 2011a) and the 2012-2017 Transportation Improvement Program (DRCOG, 2011b), which both meet conformity criteria. The 2035 RTP represents the financially constrained multi-modal transportation element of the Metro Vision 2035 Plan (DRCOG, 2011a). The FHWA and the FTA approved the biennial 2012 – 2017 Transportation Improvement Program. The project description from the TIP is included in Appendix A and is consistent with the project definition.

Southeast Extension Air Quality Technical Memorandum
1-7
1.3 Pollutants of Concern When assessing the impacts of transportation projects, the pollutants of concern for the Denver metropolitan area are CO, O3, and PM10. Generally, transportation projects affect regional air quality by emitting O3 precursors, such as nitrogen oxide (NOx) and volatile organic compounds (VOCs). In addition, if the region is designated as a non-attainment or maintenance area by federal standards for CO or PM10, then a project is subject to transportation conformity requirements. Areas are also subject to conformity requirements if they are designated non-attainment or maintenance for O3. However, no project-level analysis requirements apply for this pollutant and its precursors. Carbon monoxide and PM10 concentrations can also accumulate near areas of heavy traffic congestion where average vehicle speeds are low. Therefore, emissions of CO and PM10 are of primary concern when assessing local air quality impacts. Vehicle exhaust also includes emissions of PM2.5 and SO2; however, these two compounds are in attainment for NAAQS in the study area, and, therefore, are not of primary concern. In addition to the criteria air pollutants for which there are NAAQS, the EPA also regulates air toxics. Most air toxics originate from human-made sources, including on-road mobile sources, non-road mobile sources (such as trains), area sources (such as dry cleaners), and stationary sources (such as factories or refineries).
1.3.1 Special Issues for Ozone
Ozone is not directly emitted by motor vehicles. However, the reaction of two other motor vehicle emissions, NOx and VOCs, contribute to ozone formation. Ozone is created by the reaction of NOx and VOCs on hot summer days. This reaction takes place over several hours, which allows for mixing and dispersion in the atmosphere; therefore, ozone is generally a regional, rather than localized, pollutant. A transportation project can negatively affect regional air quality if vehicle emissions of ozone precursors (NOx and VOCs) increase as a result of the project. The concentration of a pollutant in the atmosphere depends on the amount of pollutant released, the nature of the source, and the ability of the atmosphere to transport and disperse the pollutant. The main determinants of transport and dispersion are wind, atmospheric stability or turbulence, topography, and the existence of inversion layers. The Denver metropolitan area is located in the South Platte River drainage area, with mountains located to the west and relatively high terrain to the south and north. Under appropriate meteorological conditions, the local topography helps to trap pollutants and elevate ambient concentrations. The pollutants can be trapped under strong inversions that inhibit dispersion and cause poor air quality. Certain photo-chemically active pollutants, such as NOx and VOCs, react in the presence of sunlight and can cause elevated levels of ground level O3. Warm temperatures accelerate the creation of ground level O3 and can exacerbate conditions of poor air quality. Effective November 20, 2007, the EPA designated the Denver metro area and the north Front Range as a non-attainment area for the 8-hour ozone (O3). The new ozone non-attainment status requires regions to submit an enforceable SIP outlining steps regions will take to maintain compliance with the ozone standard. A plan to reduce ozone concentrations was developed by the Colorado Department of Public Health and Environment (CDPHE) Air Pollution Control
Southeast Extension Air Quality Technical Memorandum
1-8
Division (APCD), along with the Regional Air Quality Council (RAQC), Denver Regional Council of Governments (DRCOG), and the North Front Range Metropolitan Planning Organization (NFRMPO), which was submitted to the EPA in July 2009. Control measures outlined in the SIP to reduce ozone concentrations include:
Revisions to Regulation No. 11 (adopted March 2008) – Tightened tailpipe emissions standards for VOCs, CO, and NOx used to pass or fail program eligible vehicles in the Denver Metro Area. Vehicles subject to the Automobile Inspection and Readjustment (AIR) program are inspected on a two-year cycle.
Reid Vapor Pressure (RVP) – A request for EPA to strengthen the RVP requirement from 9.0 pounds per square (psi) inch to 7.8 psi.
Revisions to Regulation No. 7 – Expand source-category VOC emissions control requirements to include all ozone non-attainment areas in the state, including the entire Denver/North Front Range non-attainment area.
Revisions to Regulation No. 3 – Air Pollutant Emission Notices (APEN) and permit exemptions will be removed or revised to develop an inventory of emissions from source categories where actual emissions are anticipated to exceed reporting thresholds.
In March 2008, EPA significantly strengthened the NAAQS for the 8-hour ozone standard from 0.080 ppm to 0.075 ppm. The EPA had revoked the 1-hour ozone standard for all areas except for non-attainment Early Action Compact (EAC) areas (areas that have no effective date for their 8-hour designations). Once those areas have a designation date, the 1-hour ozone standard will be revoked one year after the effective designation. The effective date for non-attainment designation was April 15, 2008. Therefore, the 1-hour ozone standard has been revoked as of April 15, 2009 for the Denver metro area and the North Front Range.
1.3.2 Mobile Source Air Toxics
Controlling air toxic emissions became a national priority with the passage of the Clean Air Act Amendments (CAAA) of 1990, whereby Congress mandated that the EPA regulate 188 air toxics, also known as hazardous air pollutants. The EPA has assessed this expansive list in their latest rule on the Control of Hazardous Air Pollutants from Mobile Sources (Federal Register, Vol. 72, No.37, page 8430, February 26, 2007) and identified a group of 93 compounds emitted from mobile sources that are listed in their Integrated Risk Information System (IRIS) (http://www.epa.gov/ncea/iris/index.html). In addition, EPA identified seven compounds with significant contributions from mobile sources that are among the national and regional-scale cancer risk drivers from their 1999 National Air Toxics Assessment (NATA) (http://www.epa.gov/ttn/atw/nata1999/). These components are acrolein, benzene, 1,3-butadiene, diesel particulate matter plus diesel exhaust organic gases (diesel PM), formaldehyde, naphthalene, and polycyclic organic matter. While FHWA considers these the priority mobile source air toxics, the list is subject to change and may be adjusted in consideration of future EPA rules.
The 2007 EPA rule mentioned above requires controls that will dramatically decrease MSAT emissions through cleaner fuels and cleaner engines. According to an FHWA analysis using EPA’s MOBILE6.2 model, even if vehicle activity (vehicle-miles traveled, VMT) increases by 145

Southeast Extension Air Quality Technical Memorandum
1-9
percent as assumed, a combined reduction of 72 percent in the total annual emission rate for the priority MSAT is projected from 1999 to 2050, as shown in Figure 1-3.
Research into the health impacts of MSATs is ongoing. For different emission types, there are a variety of studies that show that some either are statistically associated with adverse health outcomes through epidemiological studies (frequently based on emissions levels found in occupational settings) or that animals demonstrate adverse health outcomes when exposed to large doses.
Exposure to toxics has been a focus of a number of EPA efforts. Most notably, the agency conducted the National Air Toxics Assessment (NATA) in 1996 to evaluate modeled estimates of human exposure applicable to the county level. While not intended for use as a measure of or benchmark for local exposure, the modeled estimates in the NATA database best illustrate the levels of various toxics when aggregated to a national or state level. There have been other studies that address MSAT health impacts in proximity to roadways. The Health Effects Institute, a non-profit organization funded by the EPA, FHWA, and industry, has undertaken a major series of studies to research near-roadway MSAT hot spots, the health implications of the entire mix of mobile source pollutants, and other topics. The final summary of the series is not expected for several years. Some recent studies have reported that proximity to roadways is related to adverse health effects, particularly respiratory problems. Much of this research is not specific to MSATs, but instead surveys the full spectrum of both criteria pollutants and other pollutants. The validity of these studies cannot be evaluated at this time, but more importantly, they do not provide information that would be useful to alleviate the uncertainties listed above and enable completion of a more comprehensive evaluation of the health impacts specific to this project. Because of the uncertainties outlined above, a quantitative assessment of the effects of air toxic emissions impacts on human health cannot be made at the project level.
1.3.3 Climate Change and Greenhouse Gases
Gases in the atmosphere can contribute to the greenhouse effect both directly and indirectly. Direct effects occur when the gas itself absorbs radiation. Indirect effects occur when gas influences lifetime or formation of other gases that affect the radiative balance of the earth. There are both naturally occurring and manmade Greenhouse Gas (GHG) emissions. The major anthropogenic (i.e., derived from human activities) GHG pollutants include ozone, carbon dioxide (CO2), methane (CH4), and nitrous oxide (N2O). Other anthropogenic pollutants of the atmosphere (CO, NO2, VOCs, and aerosols) may also influence radiation exchanges in the atmosphere and participate in formation of the GHG.
Southeast Extension Air Quality Technical Memorandum
1-10
Figure 1-3: National MSAT Emission Trends 1999 to 2050 for Vehicles Operating on Roadways Using EPA’s Mobile 6.2 Model
Note: (1) Annual emissions of polycyclic organic matter are projected to be 561 tons/yr for 1999, decreasing to 373 tons/yr for 2050. (2) Trends for specific locations may be different, depending on locally derived information representing vehicle-miles travelled,
vehicle speeds, vehicle mix, fuels, emission control programs, meteorology, and other factors Source: U.S. Environmental Protection Agency. MOBILE6.2 Model run 20 August 2009.
Southeast Extension Air Quality Technical Memorandum
1-11
Carbon dioxide emissions constitute around 80 percent of all GHG. In 2005, CO2 emissions represented 83.9 percent of the total GHG emissions (RTD, 2008). The main source of man-made CO2 emissions is fossil fuel combustion. Fossil fuel combustion accounts for approximately 70 to 90 percent of all manmade CO2 emissions. Fossil fuel combustion is used mostly in energy production, transportation, heating, and industry. Transportation is one of the major contributors to CO2 emission production. Regional emission burdens estimated with and without a proposed project alternative are used to estimate potential effects on area-wide levels of ozone, CO, and PM10, as well as GHG emissions and regional energy consumption.
Southeast Extension Air Quality Technical Memorandum
2-1
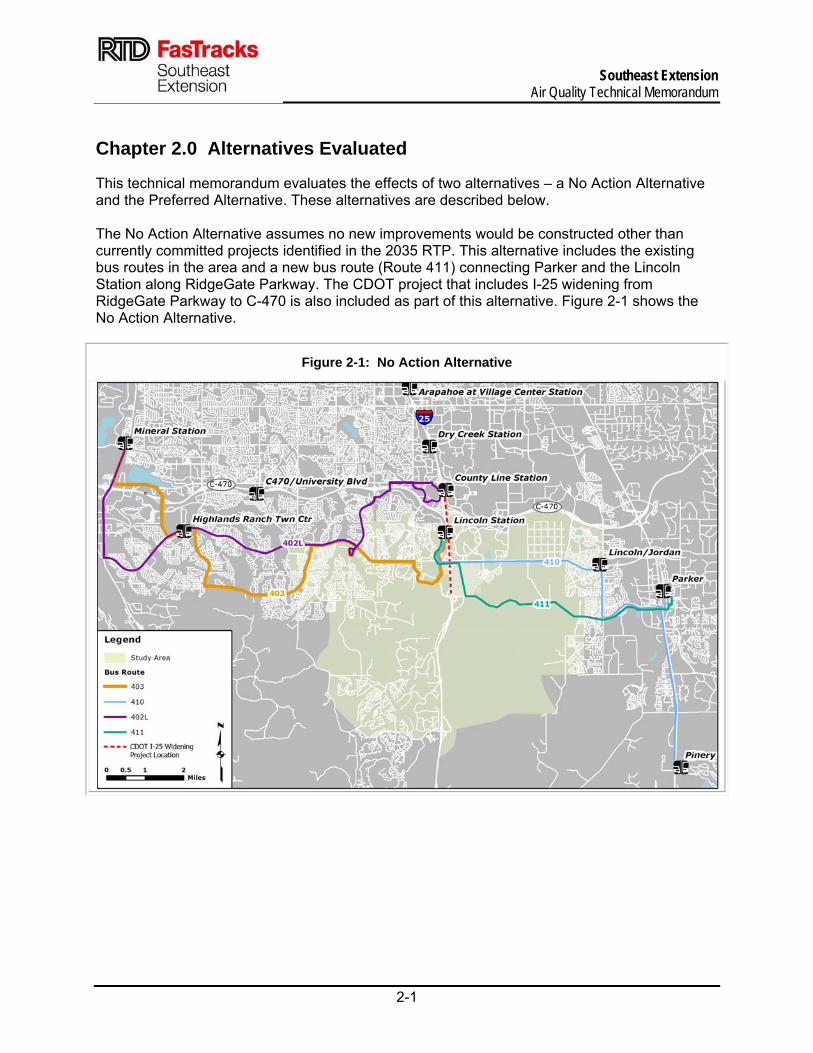
Chapter 2.0 Alternatives Evaluated
This technical memorandum evaluates the effects of two alternatives – a No Action Alternative and the Preferred Alternative. These alternatives are described below. The No Action Alternative assumes no new improvements would be constructed other than currently committed projects identified in the 2035 RTP. This alternative includes the existing bus routes in the area and a new bus route (Route 411) connecting Parker and the Lincoln Station along RidgeGate Parkway. The CDOT project that includes I-25 widening from RidgeGate Parkway to C-470 is also included as part of this alternative. Figure 2-1 shows the No Action Alternative.
Figure 2-1: No Action Alternative
Southeast Extension Air Quality Technical Memorandum
2-2
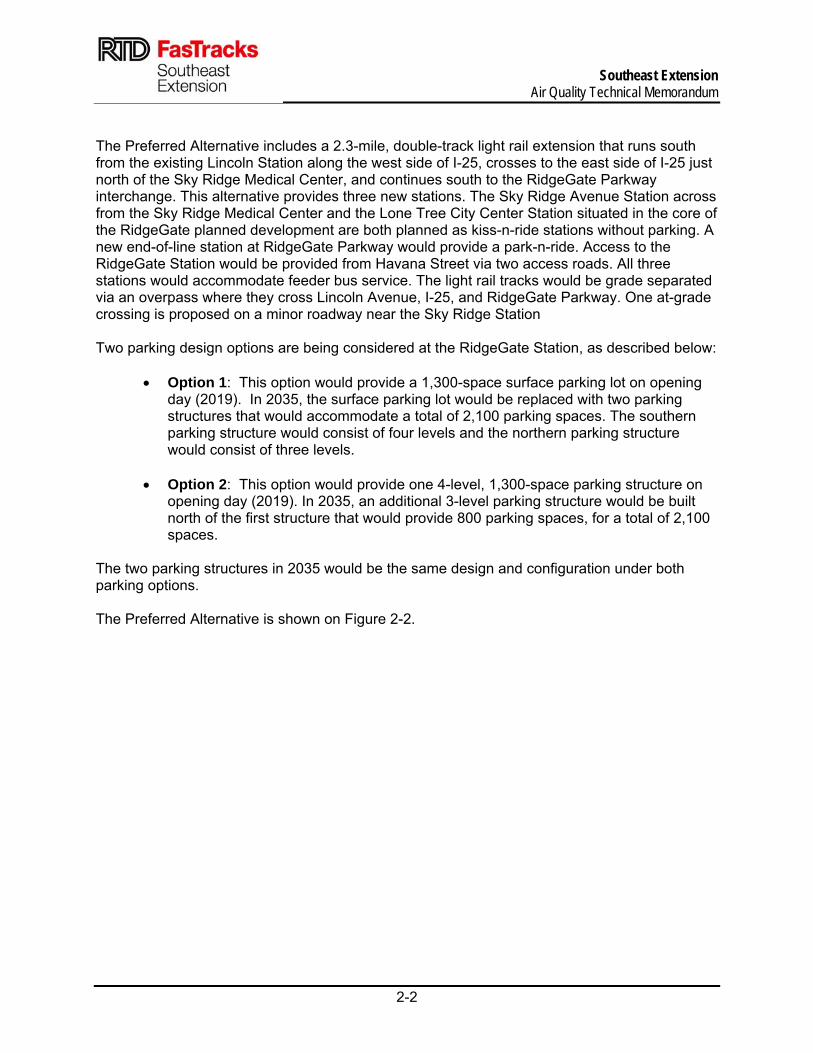
The Preferred Alternative includes a 2.3-mile, double-track light rail extension that runs south from the existing Lincoln Station along the west side of I-25, crosses to the east side of I-25 just north of the Sky Ridge Medical Center, and continues south to the RidgeGate Parkway interchange. This alternative provides three new stations. The Sky Ridge Avenue Station across from the Sky Ridge Medical Center and the Lone Tree City Center Station situated in the core of the RidgeGate planned development are both planned as kiss-n-ride stations without parking. A new end-of-line station at RidgeGate Parkway would provide a park-n-ride. Access to the RidgeGate Station would be provided from Havana Street via two access roads. All three stations would accommodate feeder bus service. The light rail tracks would be grade separated via an overpass where they cross Lincoln Avenue, I-25, and RidgeGate Parkway. One at-grade crossing is proposed on a minor roadway near the Sky Ridge Station Two parking design options are being considered at the RidgeGate Station, as described below:
Option 1: This option would provide a 1,300-space surface parking lot on opening day (2019). In 2035, the surface parking lot would be replaced with two parking structures that would accommodate a total of 2,100 parking spaces. The southern parking structure would consist of four levels and the northern parking structure would consist of three levels.
Option 2: This option would provide one 4-level, 1,300-space parking structure on
opening day (2019). In 2035, an additional 3-level parking structure would be built north of the first structure that would provide 800 parking spaces, for a total of 2,100 spaces.
The two parking structures in 2035 would be the same design and configuration under both parking options. The Preferred Alternative is shown on Figure 2-2.
Southeast Extension Air Quality Technical Memorandum
2-3
Figure 2-2: Preferred Alternative
Southeast Extension Air Quality Technical Memorandum
3-1
Chapter 3.0 Affected Environment
3.1 Climate A broad valley along the South Platte River characterizes the six-county Denver metropolitan area. The terrain to the east of the region is dominated by gently rolling plains, while the Front Range foothills of the Rocky Mountains are located to the west. The elevation of downtown Denver is 5,280 feet above mean sea level, with slightly higher elevations in the suburban areas. The Denver metropolitan area climate is similar to much of the central Rocky Mountain region, with annual temperatures ranging from below 0 degree to over 100 degrees Fahrenheit. Denver does not experience the extremely cold mornings of higher elevations or the hot afternoons of summer found in lower elevations in the region. Extremely hot or cold weather is typically of short duration, with low relative humidity, light precipitation, and abundant sunshine. Average monthly temperatures range from 28 degrees Fahrenheit in January to 72 degrees Fahrenheit in July. Annual precipitation is about 16 inches, with 0.01 inch or greater occurring over 89 days per year. Annual snowfall is about 60 inches, with 1 inch or more of snow falling an average of 18 days per year.
3.2 Project Description The study area for the Southeast Extension is located in the Denver Metropolitan Area, within Douglas County and the City of Lone Tree. The Southeast Extension would extend the existing light rail line a distance of approximately 2.3 miles from the Lincoln Station. The rail line would cross over Lincoln Avenue and I-25, and then run along the east side of I-25 terminating just south of RidgeGate Parkway. The study area consists of a wide variety of land uses along the 2.3-mile alignment. Commercial businesses are located north of Lincoln Avenue, and the Sky Ridge Medical Center is located south of Lincoln Avenue. East of I-25, the land is currently vacant, but the RidgeGate Planned Development is planned for this area. Alternatives evaluated in this report are described in Chapter 2.0
3.3 Description of Existing Conditions Currently, the Southeast Extension study area is located in primarily vacant land. The study area is bordered by residential development to the north, east, and west. Sky Ridge Medical Center is located in the central portion of the study area and Park Meadows Mall is located north of the study area. The southern and eastern portions of the study area are currently vacant, although RidgeGate Planned Development is a proposed community development to the east of I-25.
3.4 Air Quality Monitoring Results The APCD operated a network of ambient air quality monitoring stations within the Denver Metropolitan Area. Monitoring stations near the Southeast Extension within Arapahoe, Denver, and Douglas counties were selected to evaluate the existing air quality conditions of the study area. Table 3-1 details the maximum CO, O3, PM10, and PM2.5 concentrations measured from 2008 to 2011 for the monitoring stations, and displays the national and Colorado standards for comparison.
Southeast Extension Air Quality Technical Memorandum
3-2
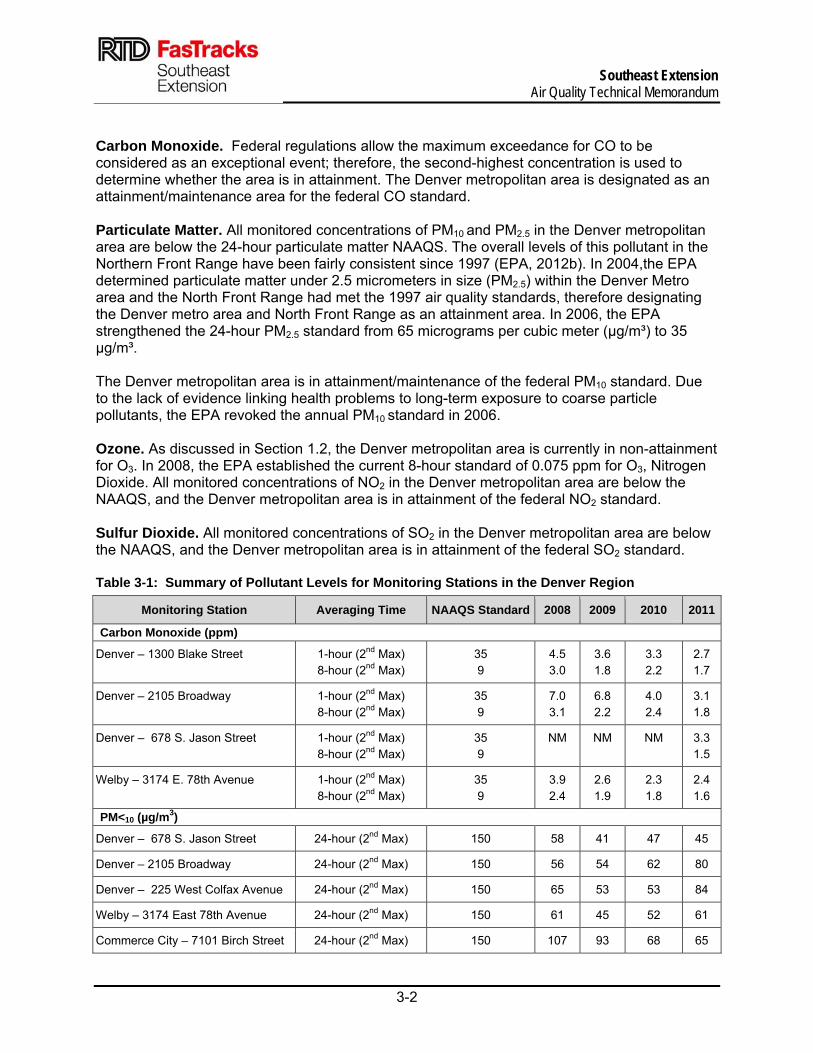
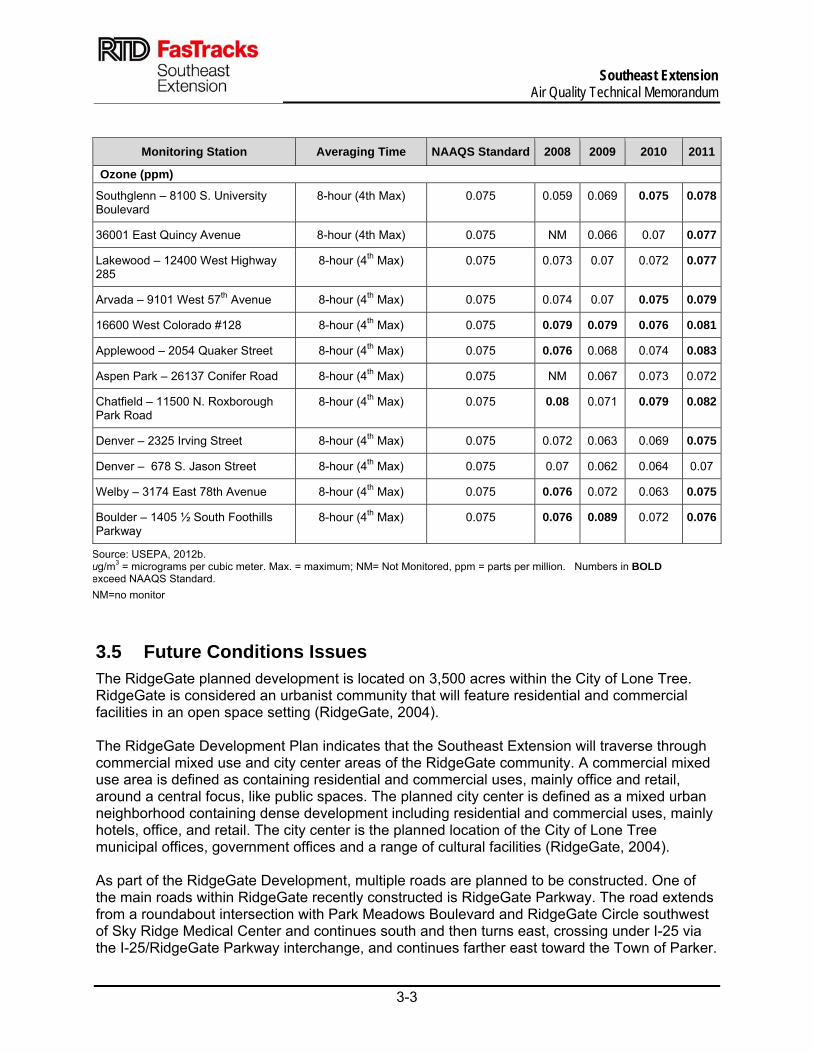
Carbon Monoxide. Federal regulations allow the maximum exceedance for CO to be considered as an exceptional event; therefore, the second-highest concentration is used to determine whether the area is in attainment. The Denver metropolitan area is designated as an attainment/maintenance area for the federal CO standard. Particulate Matter. All monitored concentrations of PM10 and PM2.5 in the Denver metropolitan area are below the 24-hour particulate matter NAAQS. The overall levels of this pollutant in the Northern Front Range have been fairly consistent since 1997 (EPA, 2012b). In 2004,the EPA determined particulate matter under 2.5 micrometers in size (PM2.5) within the Denver Metro area and the North Front Range had met the 1997 air quality standards, therefore designating the Denver metro area and North Front Range as an attainment area. In 2006, the EPA strengthened the 24-hour PM2.5 standard from 65 micrograms per cubic meter (µg/m³) to 35 µg/m³. The Denver metropolitan area is in attainment/maintenance of the federal PM10 standard. Due to the lack of evidence linking health problems to long-term exposure to coarse particle pollutants, the EPA revoked the annual PM10 standard in 2006. Ozone. As discussed in Section 1.2, the Denver metropolitan area is currently in non-attainment for O3. In 2008, the EPA established the current 8-hour standard of 0.075 ppm for O3, Nitrogen Dioxide. All monitored concentrations of NO2 in the Denver metropolitan area are below the NAAQS, and the Denver metropolitan area is in attainment of the federal NO2 standard. Sulfur Dioxide. All monitored concentrations of SO2 in the Denver metropolitan area are below the NAAQS, and the Denver metropolitan area is in attainment of the federal SO2 standard. Table 3-1: Summary of Pollutant Levels for Monitoring Stations in the Denver Region
Monitoring Station Averaging Time NAAQS Standard 2008 2009 2010 2011
Carbon Monoxide (ppm)
Denver – 1300 Blake Street 1-hour (2nd Max) 8-hour (2nd Max)
35 9
4.5 3.0
3.6 1.8
3.3 2.2
2.7 1.7
Denver – 2105 Broadway 1-hour (2nd Max) 8-hour (2nd Max)
35 9
7.0 3.1
6.8 2.2
4.0 2.4
3.1 1.8
Denver – 678 S. Jason Street 1-hour (2nd Max) 8-hour (2nd Max)
35 9
NM NM NM 3.3 1.5
Welby – 3174 E. 78th Avenue 1-hour (2nd Max) 8-hour (2nd Max)
35 9
3.9 2.4
2.6 1.9
2.3 1.8
2.4 1.6
PM<10 (µg/m3)
Denver – 678 S. Jason Street 24-hour (2nd Max) 150 58 41 47 45
Denver – 2105 Broadway 24-hour (2nd Max) 150 56 54 62 80
Denver – 225 West Colfax Avenue 24-hour (2nd Max) 150 65 53 53 84
Welby – 3174 East 78th Avenue 24-hour (2nd Max) 150 61 45 52 61
Commerce City – 7101 Birch Street 24-hour (2nd Max) 150 107 93 68 65
Southeast Extension Air Quality Technical Memorandum
3-3
Monitoring Station Averaging Time NAAQS Standard 2008 2009 2010 2011
Ozone (ppm)
Southglenn – 8100 S. University Boulevard
8-hour (4th Max) 0.075 0.059 0.069 0.075 0.078
36001 East Quincy Avenue 8-hour (4th Max) 0.075 NM 0.066 0.07 0.077
Lakewood – 12400 West Highway 285
8-hour (4th Max) 0.075 0.073 0.07 0.072 0.077
Arvada – 9101 West 57th Avenue 8-hour (4th Max) 0.075 0.074 0.07 0.075 0.079
16600 West Colorado #128 8-hour (4th Max) 0.075 0.079 0.079 0.076 0.081
Applewood – 2054 Quaker Street 8-hour (4th Max) 0.075 0.076 0.068 0.074 0.083
Aspen Park – 26137 Conifer Road 8-hour (4th Max) 0.075 NM 0.067 0.073 0.072
Chatfield – 11500 N. Roxborough Park Road
8-hour (4th Max) 0.075 0.08 0.071 0.079 0.082
Denver – 2325 Irving Street 8-hour (4th Max) 0.075 0.072 0.063 0.069 0.075
Denver – 678 S. Jason Street 8-hour (4th Max) 0.075 0.07 0.062 0.064 0.07
Welby – 3174 East 78th Avenue 8-hour (4th Max) 0.075 0.076 0.072 0.063 0.075
Boulder – 1405 ½ South Foothills Parkway
8-hour (4th Max) 0.075 0.076 0.089 0.072 0.076
Source: USEPA, 2012b. μg/m3 = micrograms per cubic meter. Max. = maximum; NM= Not Monitored, ppm = parts per million. Numbers in BOLD exceed NAAQS Standard.
NM=no monitor
3.5 Future Conditions Issues The RidgeGate planned development is located on 3,500 acres within the City of Lone Tree. RidgeGate is considered an urbanist community that will feature residential and commercial facilities in an open space setting (RidgeGate, 2004). The RidgeGate Development Plan indicates that the Southeast Extension will traverse through commercial mixed use and city center areas of the RidgeGate community. A commercial mixed use area is defined as containing residential and commercial uses, mainly office and retail, around a central focus, like public spaces. The planned city center is defined as a mixed urban neighborhood containing dense development including residential and commercial uses, mainly hotels, office, and retail. The city center is the planned location of the City of Lone Tree municipal offices, government offices and a range of cultural facilities (RidgeGate, 2004). As part of the RidgeGate Development, multiple roads are planned to be constructed. One of the main roads within RidgeGate recently constructed is RidgeGate Parkway. The road extends from a roundabout intersection with Park Meadows Boulevard and RidgeGate Circle southwest of Sky Ridge Medical Center and continues south and then turns east, crossing under I-25 via the I-25/RidgeGate Parkway interchange, and continues farther east toward the Town of Parker.
Southeast Extension Air Quality Technical Memorandum
3-4
Along with the RidgeGate Planned Community Development and proposed Southeast Extension, there would be an assumed increase in automotive transportation in the study area due to future local residential development and the increase in population throughout the Denver metropolitan area. This increase in automotive volume would have an impact on the direct and regional emissions in the study area.

Southeast Extension Air Quality Technical Memorandum
4-1
Chapter 4.0 Impact Evaluation
4.1 Methodology The project team coordinated with the Colorado Department of Public Health and Environment – Air Pollution Control Division (CDPHE-APCD) regarding information and data such as: emission factors for analysis years and CO background concentrations.
4.1.1 Intersection CO Analysis
Localized CO Impacts. The project operations could affect air quality by creating localized “hot spots.” Automobiles account for a large percentage of the CO emissions in urban and suburban areas; therefore, maximum CO concentrations tend to be localized near areas of heavy traffic congestion. Evaluating the potential for localized impacts is important because changes in the traffic conditions at intersections or parking lots near large light rail transit (LRT) stations could create CO hot spots regardless of the regional impacts of the project. CO hot spot analyses were performed using air dispersion models to predict worst-case CO levels near worst-case intersections and parking facilities of the largest LRT station. Intersections Modeled. According to RTD’s Environmental Methodology Manual (RTD, 2008), a hot spot analysis is required for intersections within the study area with a Level of Service (LOS) of D or worse. Level of Service is a rating of intersection congestion from A to F, with LOS A being the best operating condition, and LOS F being the worst. Intersection LOS is determined by the individual performance of the intersection in terms of delay time and intersection traffic volumes during congested hours, such as a.m. and p.m. peak hours. Worst-case Intersections. A screening analysis was performed to identify the worst intersections within the study area that were predicted to be affected by the project. For the purposes of this analysis, “worst” intersections are identified in terms of delay to vehicles passing through them. Only signalized intersections with LOS of D, E, and F were subject to the screen. The intersection with the worst LOS and highest traffic volumes (East Lincoln Avenue and Park Meadows Boulevard) within the Southeast Extension study area was selected because the top three “worst” intersections modeled for the Environmental Evaluation (EE) showed no exceedances of the NAAQS. (In 2010, RTD prepared an EE that evaluated the environmental impacts of the project. The EE was prepared in lieu of a NEPA document, which was not required because at that time the project was not federally funded.) Emission Factors. Projected vehicle emissions for the year 2012 and 2035 were provided by CDPHE-APCD using EPA MOBILE 6.2. The EPA MOBILE 6.2 is an EPA-created air quality program that calculates various MSAT (i.e., vehicle) emissions, including CO, and produces the emission factor of a vehicle in idle and traveling speeds of 2.5 to 65 miles per hour. The CDPHE-APCD was provided with the names and locations of all intersections within the project area with a LOS of D or worse. The average speed block of the intersection is then used to determine the emission of 14 vehicles at the selected intersection generated by the DRCOG Transportation model for 2012 and 2035 (Appendix B, Mobile6.2 Output Emission Factors). The CO emission factors were then used in the CO hot spot modeling. Carbon Monoxide Modeling. The EPA’s CAL3QHC model was used for hot spot analysis. CAL3QHC is a computer-based modeling program that predicts CO concentrations from motor
Southeast Extension Air Quality Technical Memorandum
4-2
vehicles at roadway intersections. The CAL3QHC model accounts for emissions from both moving and idling vehicles. Inputs for the model included projected traffic volumes, motor vehicle emission rates calculated using EPA MOBILE 6.2, roadway geometry, traffic signal timing, and worst-case meteorological conditions. Several EPA recommended meteorological conditions were used in the CAL3QHC model (EPA, 1992a and b). These inputs include:
Wind speed = 1 meter/second
Wind direction = all directions in 10 degree increments
Surface roughness = 175 centimeters
Receptor height = 1.8 meters
Source height = 0 meter
Mixing height = 1,000 meters
Stability class = D (defined as neutral based on the Pasquill stability class) (NOAA, 2009)
Settling velocity = 0 centimeter/second
Deposition velocity = 0 centimeter/second
The CAL3QHC model determines the worst-case wind direction by selecting the wind direction that results in the highest CO concentration at each receptor. The CAL3QHC model output is a value for 1-hour CO that is not corrected for persistence. Therefore, the model output must be corrected using site-specific adjustment factor for persistence. These calculations are described below. The methodology for the Southeast Extension air quality analysis was consistent with the two EPA guidance manuals related to intersection hot spot analysis and RTD’s methodology manual:
1. Guidelines for Modeling Carbon Monoxide from Roadway Intersections (EPA 1992a).
2. User’s Guide to CAL3QHC Version 2.0: A Modeling Methodology for Predicting Pollutant Concentrations Near Roadway Intersections (EPA 1992b).
3. FasTrack’s Environmental Resource Group: Environmental Methodology Manual (RTD 2008).
Per EPA guidance, receptors were modeled 10 feet from the edge of the outside travel lane on the queue links at the selected intersections. Receptors were located according to EPA guidance and represent worst-case locations for modeling possible violations of federal CO standards.

Southeast Extension Air Quality Technical Memorandum
4-3
The following formulas were used to convert the modeled 1-hour CO concentrations (1-hour) and overall 8-hour CO concentrations (8-hour):
1-Hour Calculations:
− Modeled 1-hour value = model output 1-hour value
− Overall 1-hour CO concentration = modeled 1-hour value plus 1-hour background CO concentration
8-Hour Calculations:
− Modeled 8-hour value = model output 1-hour value times Colorado persistence factor
− Overall 8-hour CO concentration = modeled 8-hour value plus 8-hour background CO concentration
The following values were used:
− Colorado persistence factor (provided by APCD) = 0.30
− Background 1-hour CO concentration (provided by APCD) = 4.55 ppm
− Background 8-hour CO concentration (provided by APCD) = 1.37 ppm
The hot spot analysis was completed for:
− The No Action Alternative (intersection configured as of today), in 2035
− The Preferred Alternative in 2035
Each of the scenarios was modeled with a.m. and p.m. traffic counts. Supporting information for this analysis is included in Appendix C, Carbon Monoxide Hot Spot Analysis.
4.1.2 Parking Facility Carbon Monoxide Analysis
Localized CO impacts were evaluated by assessing new station parking areas. The following text describes the approach and assumptions used for the parking facility CO analysis. Worst-case Parking Facilities. The worst-case LRT stations were selected based on the parking lot size and the vehicle volume during peak hours. Worst-case CO impacts would occur when large numbers of vehicles enter or leave the parking facility at the same time, and when the emissions were concentrated within a relatively small area. The analysis included vehicles parking at the lot, as well as buses transporting passengers to and from the LRT station. Carbon monoxide emissions from the parking facilities were analyzed for the worst-case LRT station (RidgeGate) in 2035. Vehicle volumes were selected based on the highest volume of vehicles entering and leaving the RidgeGate LRT Station during the busiest peak hour. The highest volume of vehicles entering and leaving the station would occur in the evening (p.m.) peak hour, and total 1,335 vehicles. Emission Factors. Carbon monoxide emission factors for the vehicles entering and leaving the parking facilities were provided by CDPHE-APCD using the EPA MOBILE 6.2 for the Build evaluation year 2035 (see Appendix D). It was assumed that each vehicle would travel at 5
Southeast Extension Air Quality Technical Memorandum
4-4
miles per hour for a distance of 0.2 mile in the parking facility of each LRT station. For a conservative analysis, it was assumed that the passenger vehicles would be parked in the facility parking lot for approximately 8 hours a day; therefore, an evening (p.m.) peak-hour cold-start emission factor was also incorporated into the passenger vehicle emission rate. Bus idling time at the LRT stations was assumed to be six minutes. The number of buses arriving and leaving the stations was estimated to be eight buses and was based on a peak-hour headway of 30 minutes for 2035. The EPA MOBILE 6.2 CO emissions for the average vehicle fleet was used to calculate emissions from passenger vehicles in the parking facility. The EPA MOBILE 6.2 urban buses CO emissions factors were used for calculating bus emissions. Both passenger vehicle and urban bus emission factors were provided by CDPHE-APCD for 2035. Carbon Monoxide Modeling. The CO concentrations near the parking facility were modeled using the EPA’s SCREEN3 air dispersion model. Emissions from vehicles, including automobiles and buses, in the parking lot were characterized as one single area source based on the footprint of the parking facility.SCREEN3 modeling estimated the maximum 1-hour CO concentration, and the 8-hour CO concentrations were calculated by using the persistence factor of 0.343. The maximum CO concentrations due to vehicle traffic were combined with the CO background concentrations within the area and compared to NAAQS. The SCREEN3 results are included in Appendix D. PM10 Hot Spot Analysis. Section 40 Code of Federal Regulations (CFR) 93.116 of the transportation conformity rule states that a project-level conformity determination in a PM10 non-attainment or maintenance area must document that no new local PM10 violations would be created and the severity or number of existing violations would not be increased as a result of the proposed project. As described in the EPA Guidance of December 2010, a quantitative hot spot analysis is required for projects of air quality concern (POAQC). According to the EPA Transportation Conformity Guidance (Final Rule of December 2010), the following types of projects are considered POAQC for particulates:
1. New or expanded highway projects that have a significant number of or significant increase in diesel vehicles. Significant number is defined as greater than 125,000 annual average daily traffic (AADT) and 8 percent or more if such AADT is diesel truck traffic, or in practice 10,000 truck AADT or more regardless of total AADT; significant increase is defined in practice as a 10 percent increase in heavy duty truck traffic. This project does not involve highway improvements that would significantly
increase the number of diesel vehicles.
2. Projects affecting intersections that are at a LOS D, E, and F with a significant number of diesel vehicles, or that that would change to LOS D, E, or F because of increased traffic volumes from a significant number of diesel vehicles related to the project. The intersection of Havana Street and Ridgegate Parkway is anticipated to
operate at a LOS D or worse in year 2035. However, the percentage of diesel vehicles is, and would remain, low at three percent. Therefore, there would be no significant amount of diesel vehicles or significant increase in the number of diesel vehicles.
3. New bus and rail terminals and transfer points that have a significant number of diesel vehicles congregating at a single location.

Southeast Extension Air Quality Technical Memorandum
4-5
This project includes light rail extension with a new Park-n-Ride station. The total number of buses that would service the Park-n-Ride station is four buses per hour per direction of travel. Therefore, there would not be a significant number of buses at this location.
4. Expanded bus and rail terminals and transfer points that significantly increase the number of diesel vehicles congregating at a single location. This project does not include any expanded bus or rail terminals or transfer
points that would significantly increase the number of diesel vehicles.
5. Projects in or affecting locations, areas, or categories of sites that are identified in the PM2.5 or PM10 implementation plan or implementation plan submission, as appropriate, as sites of possible violation. There are no sites in violation or possible violation of the NAAQS. In addition,
there have been no violations of the PM10 NAAQS since 1993. The majority of land use immediately surrounding the Ridgegate Park-n-Ride consists of undeveloped land, but also includes transportation (I-25, Havana Street, RidgeGate Parkway), the historic Schweiger Ranch, and some commercial west of I-25. The historic Schweiger Ranch would be considered a sensitive receptor. However, as mentioned above, there is no significant number or significant increase in diesel vehicles at the intersection or the Park-n-Ride. Therefore, emissions are not anticipated to be significant or violate the PM10 NAAQS. Based on the information provided above, this project is not considered a POAQC, and a project level PM10 analysis is not required. The Denver Metropolitan Area, including Douglas County, is currently designated as an attainment area for PM2.5. Therefore, a project level PM2.5 hot spot analysis is not required. Mobile Source Air Toxic. As discussed in Section 1.3, Regional impacts of MSATs need to be evaluated according to FHWA’s Interim Guidance on Air Toxic Analysis in NEPA documents. Currently, there are no established criteria for determining when MSAT emissions should be considered a significant issue in the NEPA context. For the purpose of the MSAT impact evaluation under NEPA, the FHWA has developed a tiered approach for analyzing MSATs. Depending on the specific project circumstances, FHWA has identified three levels of analysis:
1. No analysis for projects with the potential for meaningful MSAT effects
Projects of this level are those qualifying as a categorical exclusion under 23 CFR 777.117 (c), or exempt under the Clean Air Act conformity rule under 40 CFR 93.126, or with no meaningful impact on traffic volumes or vehicle mix.
2. Qualitative analysis for projects with low potential MSAT effects
Projects at this level include those that serve to improve operations of highway, transit or freight without adding substantial new capacity or without creating a facility that is likely to meaningfully increase emissions.
Southeast Extension Air Quality Technical Memorandum
4-6
3. Quantitative analysis to differentiate alternatives for projects with higher potential MSAT Effects
Projects at this level are those with the potential for meaningful differences among project alternatives. To fall under this category, the project must create or significantly alter a major intermodal freight facility that has the potential to concentrate high levels of diesel particulate matter in a single location, or create new or add significant capacity to urban highways such as interstates, urban arterials, or urban collector-distributor routes with traffic volumes where the annual average daily traffic Annual Average Daily Traffic (AADT) is projected to be in the range of 140,000 to 150,000 or greater, by design year.
Based on the regional VMT and the criteria pollutant emissions analysis, the Southeast Extension Preferred Alternative would not result in any meaningful changes in regional traffic volumes, vehicle mix, location of the existing facility, or any other factor that would cause an increase in emissions relative to the No Action Alternative. As such, the project would generate minimal air quality impacts for CAA criteria pollutants and has not been linked with any special MSAT concern. Consequently, this project is exempt from a quantitative analysis for MSATs. Greenhouse Gases. Carbon dioxide production is used as a surrogate for GHG emissions in the Southeast Extension analysis. Greenhouse gas emissions were calculated by multiplying the energy use by the CO2 conversion factors taken from the New Starts criteria. The conversion factors are:
Passenger vehicle = 0.0765
Heavy-duty vehicle (truck) and bus (diesel) = 0.0788
4.1.3 Indirect Emissions
Indirect emissions from the Preferred Alternative operation would be associated with the power generation. Electricity would come from a grid, and the power used for the transit line would likely come from a continually shifting network of coal plants, gas plants, or nuclear power plants. It was assumed that the LRT power needs would not require additional power generation capacity; therefore, power plant emissions have already been evaluated via their respective air quality permits. For this reason, indirect emissions associated with power plant operations were not discussed in this report.
4.1.4 Construction Emissions
Construction emissions would be generated by equipment used during site preparation and project construction activities, such as clearing, grading, excavating, and demolition. Fugitive dust emissions (PM10) from construction activities were evaluated for the Preferred Alternative. The emissions of fugitive dust (PM10) during the construction phase of the Preferred Alternative were estimated using the emissions factor from the URBEMIS2007 model developed by the Air Resources Board of the State of California (URBEMIS, 2007). The URBEMIS2007 average fugitive dust emission factor of 10 pounds per acre of disturbed area per day was used to estimate the emissions. The area of the total site disturbed for the Southeast Extension project was assumed to be approximately 58 acres, which include all new LRT stations and parking lots. It was assumed that the maximum acreage disturbed per day would be approximately 12
Southeast Extension Air Quality Technical Memorandum
4-7
acres, based on the assumption that 20 percent of the total site area would be disturbed per day.
4.2 Direct Impacts
4.2.1 No Action Alternative
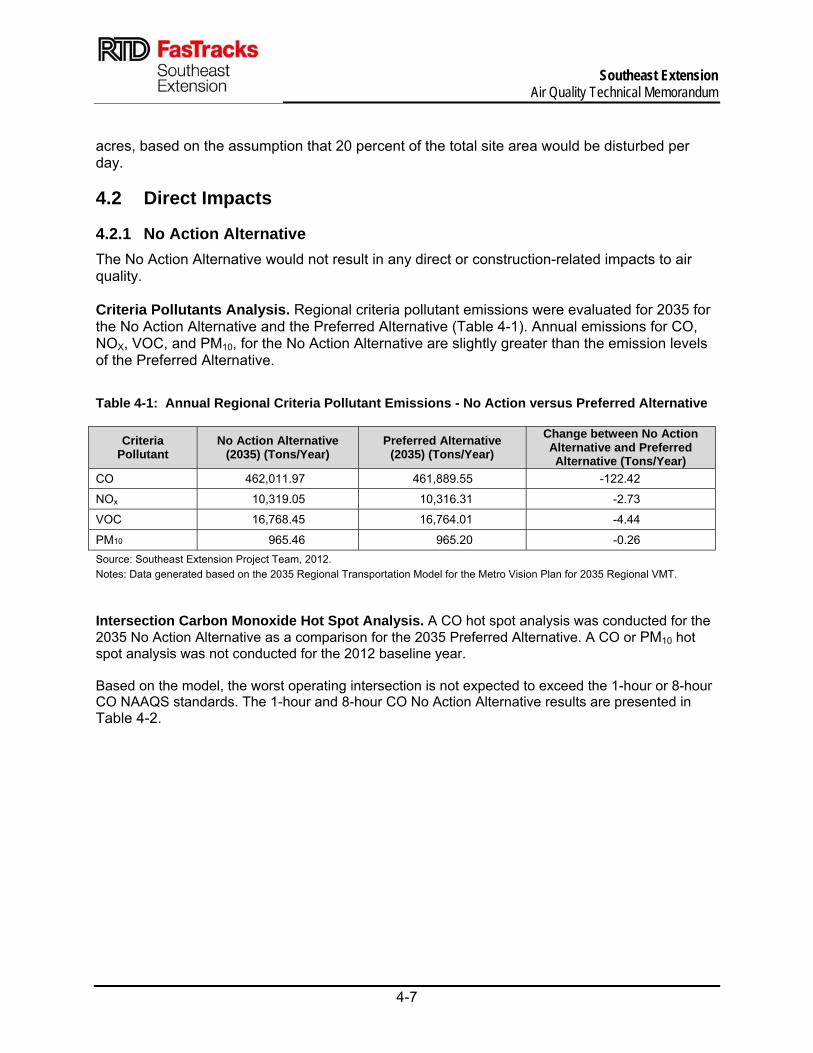
The No Action Alternative would not result in any direct or construction-related impacts to air quality. Criteria Pollutants Analysis. Regional criteria pollutant emissions were evaluated for 2035 for the No Action Alternative and the Preferred Alternative (Table 4-1). Annual emissions for CO, NOX, VOC, and PM10, for the No Action Alternative are slightly greater than the emission levels of the Preferred Alternative.
Table 4-1: Annual Regional Criteria Pollutant Emissions - No Action versus Preferred Alternative
Criteria Pollutant
No Action Alternative (2035) (Tons/Year)
Preferred Alternative (2035) (Tons/Year)
Change between No ActionAlternative and Preferred Alternative (Tons/Year)
CO 462,011.97 461,889.55 -122.42
NOx 10,319.05 10,316.31 -2.73
VOC 16,768.45 16,764.01 -4.44
PM10 965.46 965.20 -0.26
Source: Southeast Extension Project Team, 2012.
Notes: Data generated based on the 2035 Regional Transportation Model for the Metro Vision Plan for 2035 Regional VMT.
Intersection Carbon Monoxide Hot Spot Analysis. A CO hot spot analysis was conducted for the 2035 No Action Alternative as a comparison for the 2035 Preferred Alternative. A CO or PM10 hot spot analysis was not conducted for the 2012 baseline year. Based on the model, the worst operating intersection is not expected to exceed the 1-hour or 8-hour CO NAAQS standards. The 1-hour and 8-hour CO No Action Alternative results are presented in Table 4-2.

Southeast Extension Air Quality Technical Memorandum
4-8
Table 4-2: Maximum Carbon Monoxide Concentrations at Hot Spot Intersection, 2035
Concentration (ppm)
No Action Alternative 2035 NAAQS
Lincoln Avenue and Park Meadows Boulevard Intersection
A.M. P.M.
1-hour CO Scenario1 35 10.25 10.45
8-hour CO Scenario2 9 3.08 3.14
Source: Southeast Extension Team, 2012 1 Includes background concentration of 4.55 ppm (provided by APCD). 2 Includes background concentration of 1.37 ppm (provided by APCD).
APCD = Air Pollution Control Division
A.M. = Morning peak hour
CO = Carbon Monoxide
NAAQS = National Ambient Air Quality Standard
P.M. = Evening peak hour
4.2.2 Preferred Alternative
The Preferred Alternative is listed in the most recently approved 2035 RTP and is consistent with the plan. Therefore, it satisfies the regional transportation conformity requirements and is not expected to cause any violations of the NAAQS. In addition, it is anticipated that the Preferred Alternative would result in a net decrease in vehicle miles travelled (VMT) within the study area. Criteria Pollutants Analysis. The Preferred Alternative would improve air quality as a result of slightly decreasing the regional vehicle emissions in 2035 compared to the No Action Alternative (Table 4-1). The emission reductions under the Preferred Alternative are due to the reduction in vehicle miles traveled that occur when the traveling public uses transit instead of their cars. The Preferred Alternative would decrease region-wide vehicle emissions and improve air quality compared to the No Action Alternative. Intersection Carbon Monoxide Hot Spot Analysis. Based on the CAL3QHC model, the worst operating intersection is not expected to exceed the 1-hour or 8-hour CO NAAQS standards. The 1-hour and 8-hour CO Preferred Alternative results are presented in Table 4-3.

Southeast Extension Air Quality Technical Memorandum
4-9
Table 4-3: Maximum Carbon Monoxide Concentrations at Hot Spot Intersection, 2035 Concentration (ppm)
Preferred Alternative 2035 NAAQS
Lincoln Avenue and Park Meadows Boulevard Intersection
A.M. P.M.
1-hour CO Scenario1 35 10.15 9.95
8-hour CO Scenario2 9 3.05 2.99
Source: Southeast Extension Team, 2012 1 Includes background concentration of 4.55 ppm (provided by APCD). 2 Includes background concentration of 1.37 ppm (provided by APCD).
APCD = Air Pollution Control Division
A.M. = Morning peak hour
CO = Carbon Monoxide
NAAQS = National Ambient Air Quality Standard
P.M. = Evening peak hour
ppm = Parts per million
Parking Facility Carbon Monoxide Analysis. The summary of the total CO emissions at the RidgeGate Station for year 2035 is presented in Table 4-4. RidgeGate Station is the largest LRT station for the Southeast Extension project; therefore, the CO analysis results presented here represent the worst-case CO impacts. The majority of the CO emissions would be from vehicles traveling to and from the parking facility of the largest LRT station. Table 4-4: Automobile and Buses Carbon Monoxide Emissions at the Largest Station
Year Station
Pounds per HourAutomobile
Travel Bus Travel Bus Idling Total
2035 RidgeGate 11.94 0.00765 0.0015 23.75
Source: Southeast Extension Team, 2012
As shown in Table 4-5, the maximum 1 hour CO concentrations in the vicinity of the station would be well below the NAAQS of 35 ppm. The maximum 8-hour modeled concentrations are also predicted to be below the NAAQS of 9 ppm. . Table 4-5: Maximum Predicted Carbon Monoxide Concentrations
Station Averaging Time
Maximum Concentration
Increase ppm1
Maximum Background
Concentration ppm1
Total CO Concentration
ppm1 NAAQS
ppm1
RidgeGate - Year 2035
1-hr 0.723 4.03 4.75 35
8-hr 0.343 1.38 1.72 9
Source: Southeast Extension Team, 2012 1 Includes background concentrations of 4.03 ppm and 1.38 ppm, respectively (provided by APCD). ppm = Parts per million
NAAQS = National Ambient Air Quality Standard The other LRT stations included in the Preferred Alternative are smaller than the RidgeGate station and would have fewer vehicles traveling to and from the station parking facilities.
Southeast Extension Air Quality Technical Memorandum
4-10
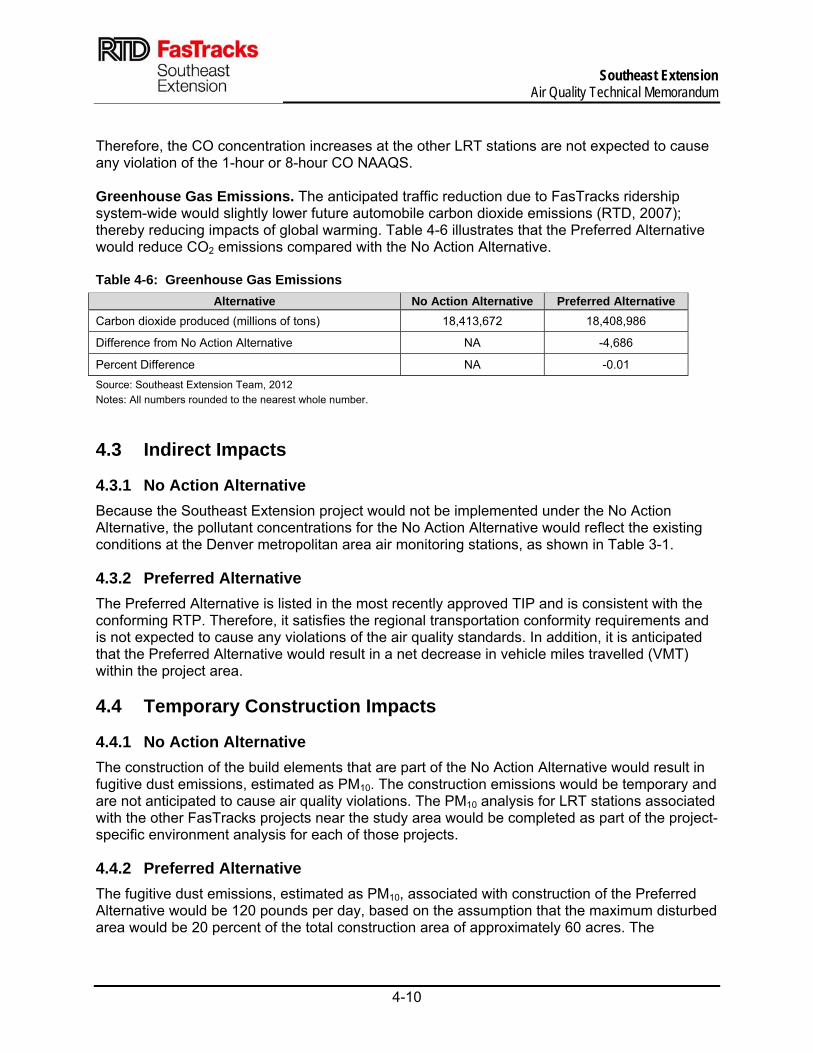
Therefore, the CO concentration increases at the other LRT stations are not expected to cause any violation of the 1-hour or 8-hour CO NAAQS. Greenhouse Gas Emissions. The anticipated traffic reduction due to FasTracks ridership system-wide would slightly lower future automobile carbon dioxide emissions (RTD, 2007); thereby reducing impacts of global warming. Table 4-6 illustrates that the Preferred Alternative would reduce CO2 emissions compared with the No Action Alternative. Table 4-6: Greenhouse Gas Emissions
Alternative No Action Alternative Preferred Alternative
Carbon dioxide produced (millions of tons) 18,413,672 18,408,986
Difference from No Action Alternative NA -4,686
Percent Difference NA -0.01
Source: Southeast Extension Team, 2012
Notes: All numbers rounded to the nearest whole number.
4.3 Indirect Impacts
4.3.1 No Action Alternative
Because the Southeast Extension project would not be implemented under the No Action Alternative, the pollutant concentrations for the No Action Alternative would reflect the existing conditions at the Denver metropolitan area air monitoring stations, as shown in Table 3-1.
4.3.2 Preferred Alternative
The Preferred Alternative is listed in the most recently approved TIP and is consistent with the conforming RTP. Therefore, it satisfies the regional transportation conformity requirements and is not expected to cause any violations of the air quality standards. In addition, it is anticipated that the Preferred Alternative would result in a net decrease in vehicle miles travelled (VMT) within the project area.
4.4 Temporary Construction Impacts
4.4.1 No Action Alternative
The construction of the build elements that are part of the No Action Alternative would result in fugitive dust emissions, estimated as PM10. The construction emissions would be temporary and are not anticipated to cause air quality violations. The PM10 analysis for LRT stations associated with the other FasTracks projects near the study area would be completed as part of the project-specific environment analysis for each of those projects.
4.4.2 Preferred Alternative
The fugitive dust emissions, estimated as PM10, associated with construction of the Preferred Alternative would be 120 pounds per day, based on the assumption that the maximum disturbed area would be 20 percent of the total construction area of approximately 60 acres. The
Southeast Extension Air Quality Technical Memorandum
4-11
construction emissions would be temporary and are not anticipated to cause any air quality violations.
4.5 Cumulative Impacts
4.5.1 No Action Alternative
Energy consumption has steadily increased over the last 50 years as a result of increased population. This has resulted in the construction of new power plants to meet the energy needs of the Denver metropolitan area. The No Action Alternative would require proportionate increases in energy to meet the 2035 population growth.
4.5.2 Preferred Alternative
Cumulative impacts to air quality are described below in terms of regional air quality trend, emissions from FasTracks vehicles, and automobile emissions. The Preferred Alternative would also contribute to these trends by providing new transit facilities that would lower the number of on-road automobiles and associated emissions. Denver Region Air Quality Trends: Air quality trends from the 1960s, when ambient air monitoring began in the Denver metro area, to today show that most pollution emissions controls and programs instituted as a result of the CAAA have been successful in reducing criteria pollutant levels. Ozone levels in the Denver area remain a concern and will require rigorous adherence to reduction programs and precursor emissions controls to prevent future air quality deterioration (RTD, 2007). Future mobile source pollutant emissions of CO, NOX, PM, SO2, Pb, and MSATs are expected to continue to decline as a result of new low sulfur fuel requirements, stricter retrofit and engine exhaust emission controls, and engine efficiency improvements (RTD, 2007). Results for FasTracks corridors air quality studies to date indicate that the incremental effect of FasTracks transit facilities and service would not result in any additional air quality impacts, and will act to reduce the growth of single occupancy vehicle use by158.38 million vehicle miles traveled (VMT) per year, lowering VMT while generating lower overall pollutant emissions levels. However, new transit vehicle emissions partially offset some of these emissions reductions. Diesel bus VMT will increase 21.73 percent, or 9.18 million vehicle miles traveled per year, and rail options (including diesel commuter, light- and heavy-duty rail) will increase 5.8 million vehicle miles per year. These changes in auto and bus are anticipated to reduce CO emissions by approximately five tons/day. Other pollutants (particulates, VOCs and NOx) would have no measurable change (RTD, 2007). FasTracks Vehicle Emissions: When the emissions from generating electricity are considered across the U.S., light rail and electric multiple units (EMUs) (self-propelled passenger railcars that require electrification) will generate emissions by drawing their electricity from the electrical grid, which may be powered by a mix of fuels including, but not limited to, coal, natural gas, hydro, or nuclear. The electricity required for the Southeast Extension project would be roughly 0.005 percent of Xcel Energy’s peak hourly generating capacity. This translates to insignificant emissions from the slight increase in electrical demand (RTD, 2007).
Southeast Extension Air Quality Technical Memorandum
4-12
Automobile Emissions: In the FasTracks corridors, auto speeds will increase up to three miles per hour because daily VMT will be reduced, compared to not having FasTracks in service. Overall, the 0.5 percent VMT reduction created by the FasTracks system is anticipated to have a modest positive contribution to the overall transit system (including RTD bus service and proposed bus rapid transit service). The result is a beneficial impact within the Denver metro area on regional air quality by reducing the total number of 2030 weekday personal vehicle trips and weekday VMT to 474,000 fewer miles compared to not constructing new transit rail lines (RTD, 2007).
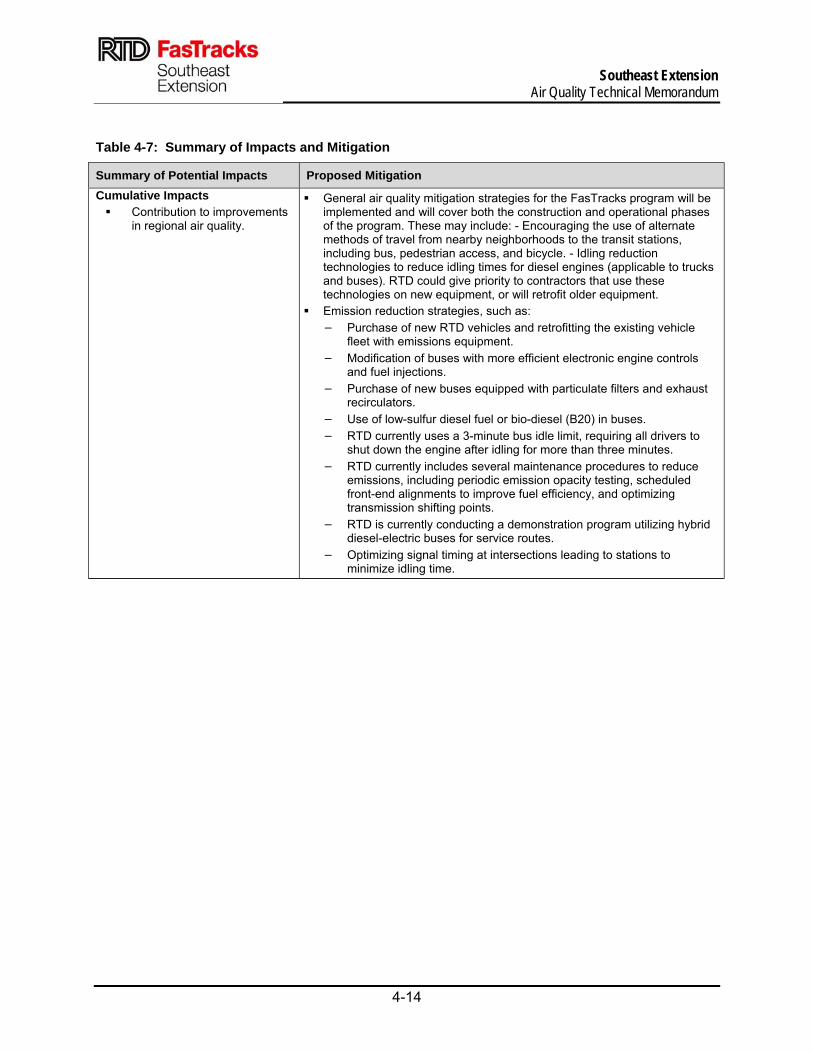
4.6 Mitigation Motor vehicle emissions in the study area would not result in any exceedance of the NAAQS; therefore, no direct project air quality mitigation is necessary. The Southeast Extension Preferred Alternative is predicted to result in a net decrease of all the criteria pollutants in 2035 compared to the No Action Alternative. Construction-phase air quality impacts (fugitive road dust and engine exhaust emissions) will be controlled by implementing the measures listed in Table 4-7.

Southeast Extension Air Quality Technical Memorandum
4-13
Table 4-7: Summary of Impacts and Mitigation
Summary of Potential Impacts Proposed Mitigation
Direct Impacts Significant decreases in MSATs
from existing conditions No CO hot spot violations
No mitigation required; however, general air quality mitigation strategies for FasTracks program will be implemented.
Indirect Impacts No impacts, benefits to area.
No mitigation needed
Construction Impacts Fugitive road dust and engine exhaust emissions.
Prepare a Dust Control Plan. Obtain Air Pollution Emission Notice (APEN) permit for construction
activities. Wet exposed soils and soil piles for dust suppression. Cover trucks hauling soil and other fine materials. Stabilize and cover
stockpile areas. Cover or wet temporary excavated materials. Re-vegetate exposed areas. Minimize off-site tracking of mud and debris by washing construction
equipment and temporary stabilization. Limit vehicle speed of construction-related equipment. Prohibit unnecessary idling of construction equipment Use low-sulfur fuel. Locate diesel engines and motors as far away as possible from residential
areas. Locate staging areas as far away as possible from residential areas. Require heavy construction equipment to use the cleanest available
engines or to be retrofitted with diesel particulate control technology. Use alternatives for diesel engines and/or diesel fuels (such as: biodiesel,
liquefied natural gas, compressed natural gas, fuel cells, or electric engines).
Install engine pre-heater devices to eliminate unnecessary idling during winter-time construction.
Prohibit tampering with equipment to increase horsepower or to defeat emission-control devices effectiveness.
Require construction vehicle engines to be properly tuned and maintained.
Use construction vehicles and equipment with the minimum practical engine size for the intended job.
Use a wheel wash station and/or large-diameter cobble apron at egress/ingress areas to minimize dirt being tracked onto public streets.
Use vacuum powered street sweepers to control dirt tracked onto streets.
Southeast Extension Air Quality Technical Memorandum
4-14
Table 4-7: Summary of Impacts and Mitigation
Summary of Potential Impacts Proposed Mitigation
Cumulative Impacts Contribution to improvements
in regional air quality.
General air quality mitigation strategies for the FasTracks program will be implemented and will cover both the construction and operational phases of the program. These may include: - Encouraging the use of alternate methods of travel from nearby neighborhoods to the transit stations, including bus, pedestrian access, and bicycle. - Idling reduction technologies to reduce idling times for diesel engines (applicable to trucks and buses). RTD could give priority to contractors that use these technologies on new equipment, or will retrofit older equipment.
Emission reduction strategies, such as:
− Purchase of new RTD vehicles and retrofitting the existing vehicle fleet with emissions equipment.
− Modification of buses with more efficient electronic engine controls and fuel injections.
− Purchase of new buses equipped with particulate filters and exhaust recirculators.
− Use of low-sulfur diesel fuel or bio-diesel (B20) in buses.
− RTD currently uses a 3-minute bus idle limit, requiring all drivers to shut down the engine after idling for more than three minutes.
− RTD currently includes several maintenance procedures to reduce emissions, including periodic emission opacity testing, scheduled front-end alignments to improve fuel efficiency, and optimizing transmission shifting points.
− RTD is currently conducting a demonstration program utilizing hybrid diesel-electric buses for service routes.
− Optimizing signal timing at intersections leading to stations to minimize idling time.
Southeast Extension Air Quality Technical Memorandum
5-1
Chapter 5.0 References
CAQCC, 2006. Early Action Compact: Ozone Action Plan Proposed Revision to the State Implementation Plan, Website: http://www.raqc.org/ozone/EAC/EAC_SIPRev121706.pdf, December 17, 2006
CDPHE, 2012. Denver Metro Area and North Front Range Ozone Action Plan, Website:
http://www.cdphe.state.co.us/ap/ozone/RegDevelop/ozoneplan.pdf, Accessed July 2012. DRCOG, 2011a. 2035 Metro Vision Regional Transportation Plan. Denver Regional Council of
Governments, Denver, Colorado. February 11, 2011. DRCOG, 2011b. 2012-2017 Transportation Improvement Program. Denver Regional Council of
Governments, Denver, Colorado. March 16, 2011. EPA. 1992a. Guidelines for Modeling Carbon Monoxide from Roadway Intersections. EPA, 1992b. User’s Guide to CAL3QHC Version 2.0: A Modeling Methodology for Predicting
Pollutant Concentrations Near Roadway Intersections. EPA, 1995. SCREEN3 Model User’s Guide. EPA-454/B-95-004. EPA, 2012a. National Ambient Air Quality Standards (NAAQS), Website:
http://www.epa.gov/air/criteria.html, Accessed July 2012. EPA, 2012b. AirData Monitor Values, Website: http://www.epa.gov/air/data, Accessed July
2012. National Oceanic and Atmospheric Administration (NOAA), 2009. United States Department of
Commerce, National Oceanic and Atmospheric Administration , Air Resources Laboratory. Modified 23 September. http://www.arl.noaa.gov/READYpgclass.php. Accessed 18 June.
RidgeGate, 2004. “RidgeGate, 2nd Amendment, Planned Development District” Prepared or
RidgeGate Investment, Inc, Coventry Development Corporation, Lone Tree, Colorado, May 7, 2004.
RTD. 2008. FasTracks Environmental Resource Group: Environmental Methodology Manual.
Revision 1. July 2008. RTD. 2007. FasTracks Programmatic Cumulative Effects Analysis (PCEA), (Version 1). October
2007. URBEMIS. 2007. Model for Windows, Version 9.2. www.urbemis.com/software/Urbemis2007v9_2.html. Released June 2007.