air transport in figuresworldwide distribution . 2007 . distribution in revenue passenger-kilometres...
TRANSCRIPT
Economic Development at a glance
AIR TRANSPORT IN FIGURES
The Air Transport Industry
The air transport industry is not only • a vital engine of global socio-economic growth • but is also of vital importance as a catalyst for
economic development, – creating direct and indirect employment, – supporting tourism and local businesses, and – stimulating foreign investment and international trade.
2
-
1,000
2,000
3,000
4,000
5,000
6,00019
45
1950
1955
1960
1965
1970
1975
1980
1985
1990
1995
2000
2005
2010
2015
Reve
nue
Pass
enge
r-Ki
lom
etre
s (b
illio
n)
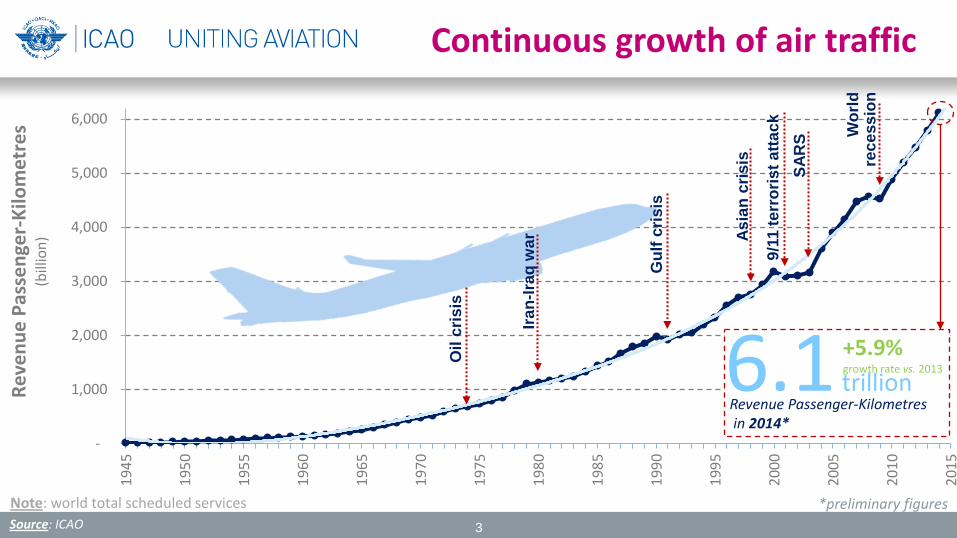
6.1 trillion +5.9% growth rate vs. 2013
Revenue Passenger-Kilometres in 2014*
Wor
ld
rece
ssio
n
Note: world total scheduled services *preliminary figures
Gul
f cris
is
Iran-
Iraq
war
Oil
cris
is
Asia
n cr
isis
9/11
terr
oris
t atta
ck
SAR
S
Continuous growth of air traffic
Source: ICAO 3
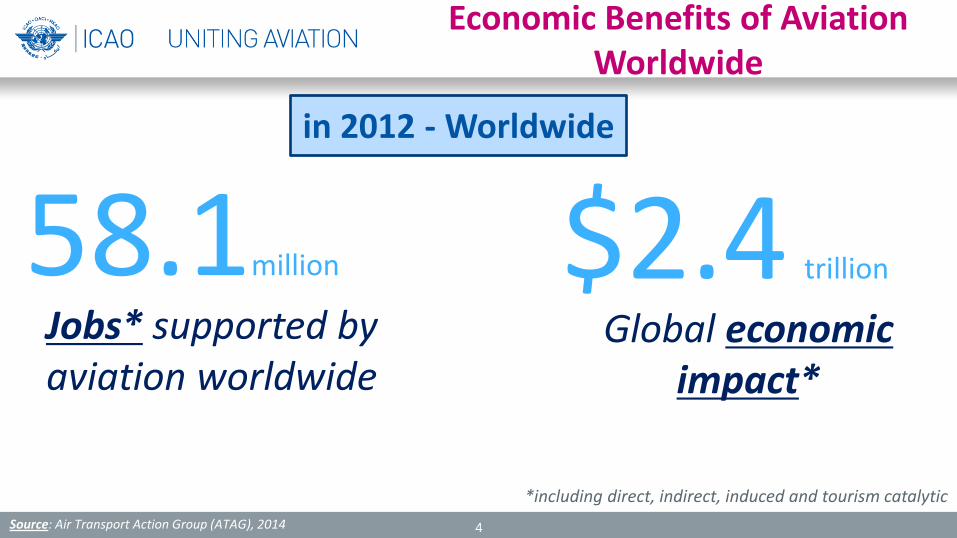
Economic Benefits of Aviation Worldwide
58.1million
Jobs* supported by aviation worldwide
Source: Air Transport Action Group (ATAG), 2014
$2.4 trillion
Global economic impact*
*including direct, indirect, induced and tourism catalytic
in 2012 - Worldwide
4

World Air Transport in 2013
3.1billion Passengers carried
32 million Commercial flights performed
5.8trillion Revenue Passenger-Kilometres
186billion Freight Tonne-Kilometres
+4.5% vs. 2012
+1.2% vs. 2012
+0.4% vs. 2012
+5.5% vs. 2012
Scheduled commercial traffic Total (international and domestic) services 5 Source: ICAO Annual Report of the Council 2013
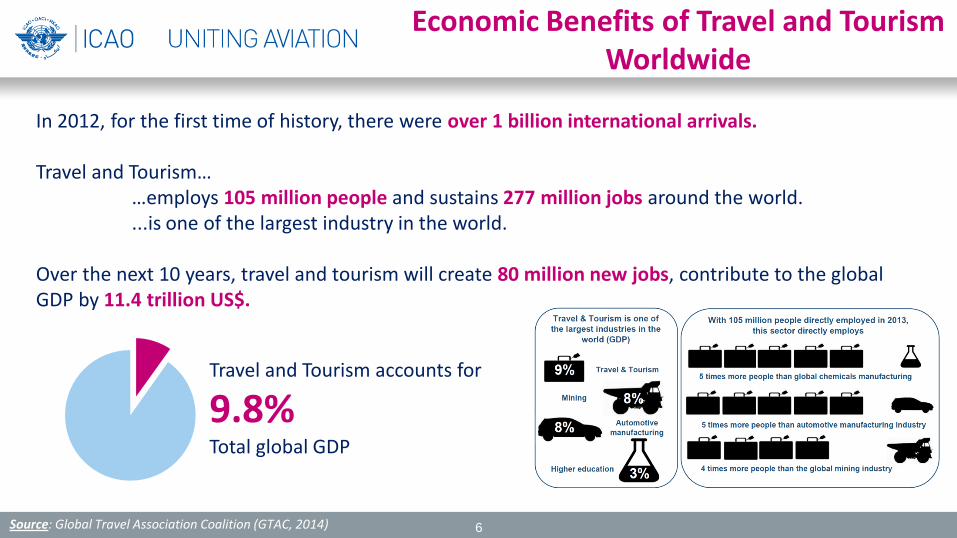
Economic Benefits of Travel and Tourism Worldwide
In 2012, for the first time of history, there were over 1 billion international arrivals. Travel and Tourism… …employs 105 million people and sustains 277 million jobs around the world. ...is one of the largest industry in the world. Over the next 10 years, travel and tourism will create 80 million new jobs, contribute to the global GDP by 11.4 trillion US$.
Source: Global Travel Association Coalition (GTAC, 2014)
Travel and Tourism accounts for
9.8% Total global GDP
6

World Air Transport in 2013 by Region
41.5 3.1
22.6 74.0
39.1 5.3
Europe
Africa
Middle East
Asia and Pacific
North America
Latin America and Caribbean
7.9
0.9 1.1
8.6 11.0
2.6
Europe
Africa
Middle East
Asia and Pacific
North America
Latin America and Caribbean
817 73
161 1,008
815 230
Europe
Africa
Middle East
Asia and Pacific
North America
Latin America and Caribbean
1,556 134
500 1,785
1,505
303
Europe
Africa
Middle East
Asia and Pacific
North America
Latin America and Caribbean
Passengers carried (million) Aircraft departures (million)
Revenue Passenger-Kilometres (billion) Freight Tonne-Kilometres (billion)
-0.4%
-0.4% +4.9%
+6.3% -1.3%
+0.4%
+3.1%
+3.5% +7.8%
+8.0% +0.9%
+5.7%
+4.6% +4.4%
+11.2%
+7.7% +2.0%
+6.7%
-0.1% +4.0%
+12.0% +0.2%
-4.9% +2.7%
Scheduled commercial traffic Total (international and domestic) services 7 Source: ICAO Annual Report of the Council 2013
Total (international and domestic) services
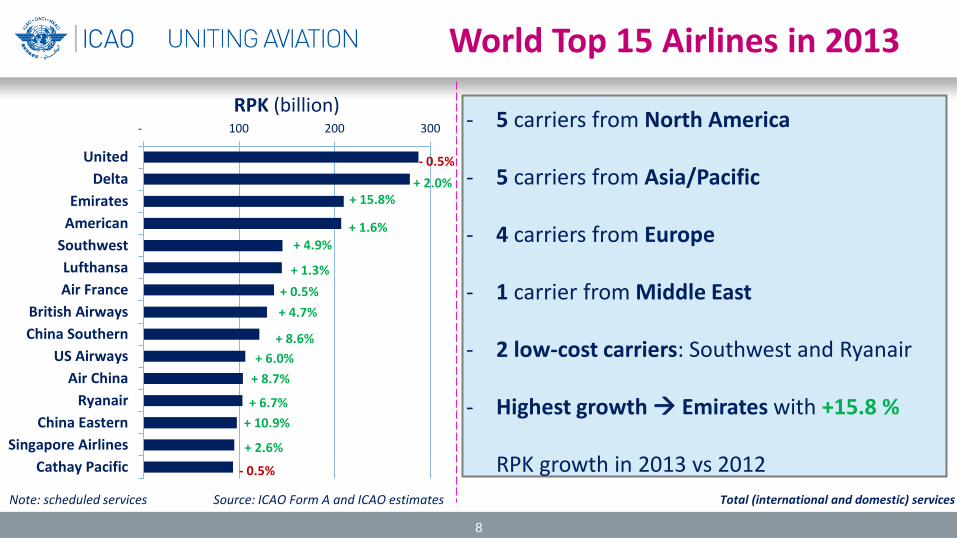
World Top 15 Airlines in 2013
- 100 200 300
UnitedDelta
EmiratesAmerican
SouthwestLufthansaAir France
British AirwaysChina Southern
US AirwaysAir China
RyanairChina Eastern
Singapore AirlinesCathay Pacific
RPK (billion)
- 0.5% + 2.0%
+ 15.8%
+ 1.6% + 4.9%
+ 1.3% + 0.5% + 4.7%
+ 8.6% + 6.0%
+ 8.7%
+ 6.7% + 10.9%
+ 2.6%
- 0.5%
Note: scheduled services Source: ICAO Form A and ICAO estimates
- 5 carriers from North America
- 5 carriers from Asia/Pacific
- 4 carriers from Europe
- 1 carrier from Middle East
- 2 low-cost carriers: Southwest and Ryanair
- Highest growth Emirates with +15.8 %
RPK growth in 2013 vs 2012
8
Total (international and domestic) services
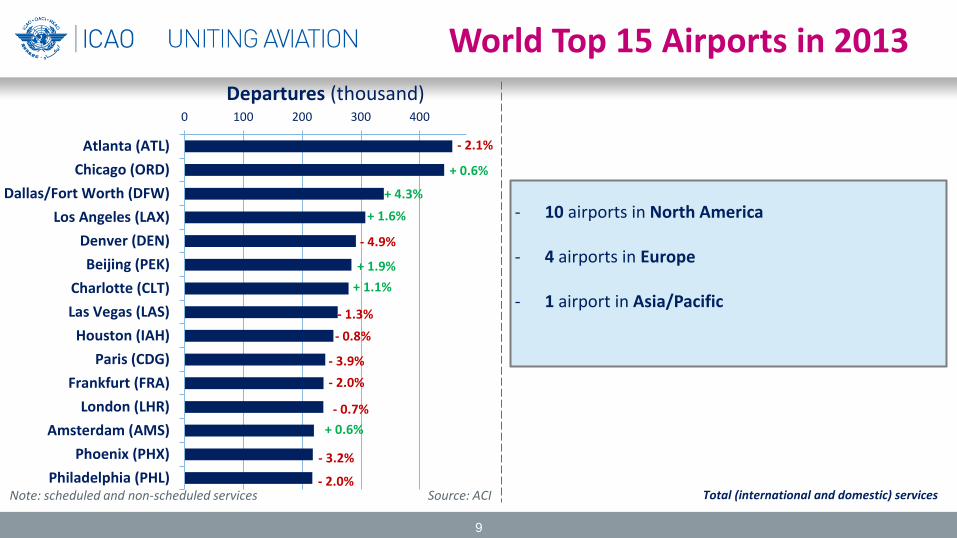
World Top 15 Airports in 2013
Note: scheduled and non-scheduled services Source: ACI
0 100 200 300 400
Atlanta (ATL)Chicago (ORD)
Dallas/Fort Worth (DFW)Los Angeles (LAX)
Denver (DEN)Beijing (PEK)
Charlotte (CLT)Las Vegas (LAS)
Houston (IAH)Paris (CDG)
Frankfurt (FRA)London (LHR)
Amsterdam (AMS)Phoenix (PHX)
Philadelphia (PHL)
Departures (thousand)
- 2.1%
+ 0.6%
+ 4.3% + 1.6%
- 4.9%
+ 1.9% + 1.1%
- 1.3% - 0.8%
- 3.9% - 2.0%
- 0.7% + 0.6%
- 3.2%
- 2.0%
- 10 airports in North America
- 4 airports in Europe
- 1 airport in Asia/Pacific
9
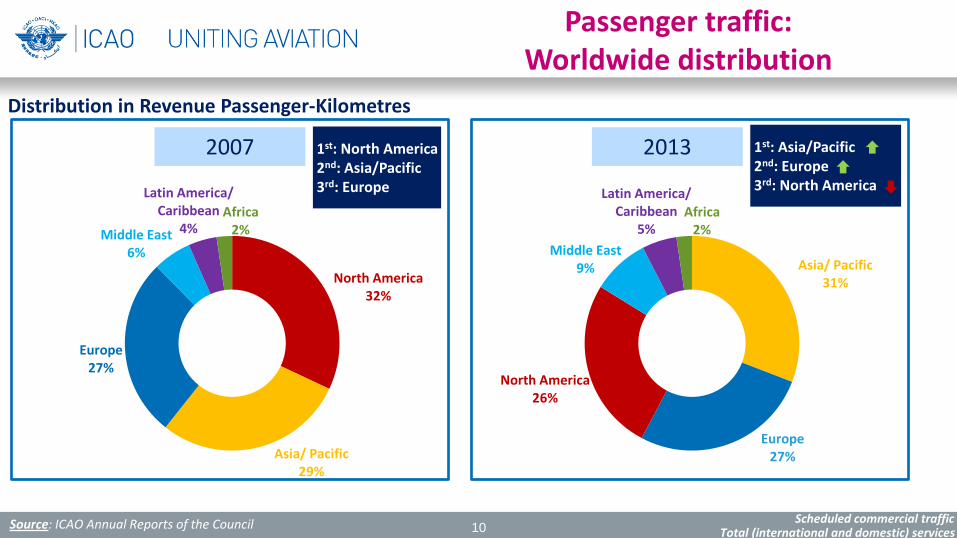
Passenger traffic: Worldwide distribution
2007
Distribution in Revenue Passenger-Kilometres
North America 32%
Asia/ Pacific 29%
Europe 27%
Middle East 6%
Latin America/ Caribbean
4% Africa
2%
Asia/ Pacific 31%
Europe 27%
North America 26%
Middle East 9%
Latin America/ Caribbean
5% Africa
2%
2013 1st: North America 2nd: Asia/Pacific 3rd: Europe
1st: Asia/Pacific 2nd: Europe 3rd: North America
Scheduled commercial traffic Total (international and domestic) services Source: ICAO Annual Reports of the Council 10
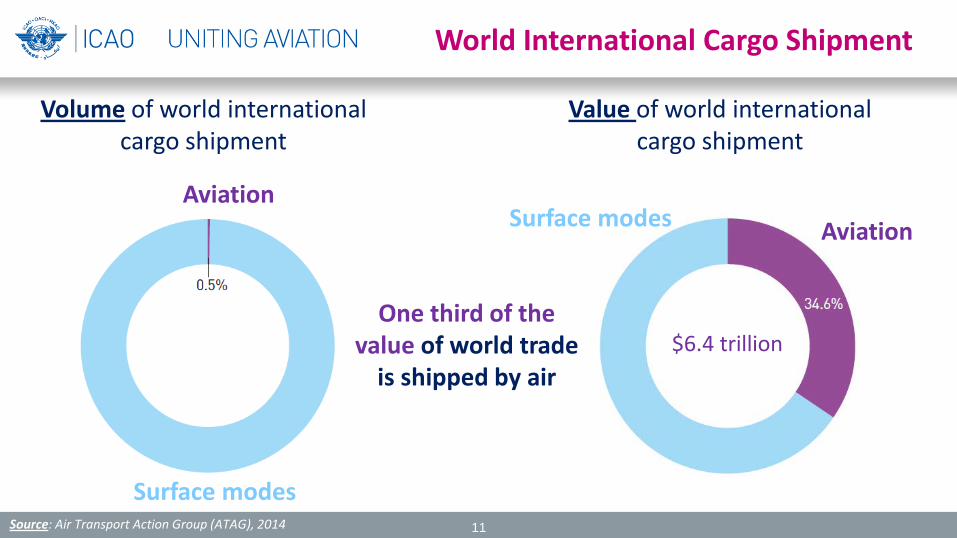
World International Cargo Shipment
Volume of world international cargo shipment
Value of world international cargo shipment
Aviation Aviation
Surface modes
Surface modes
Source: Air Transport Action Group (ATAG), 2014
$6.4 trillion One third of the
value of world trade is shipped by air
11
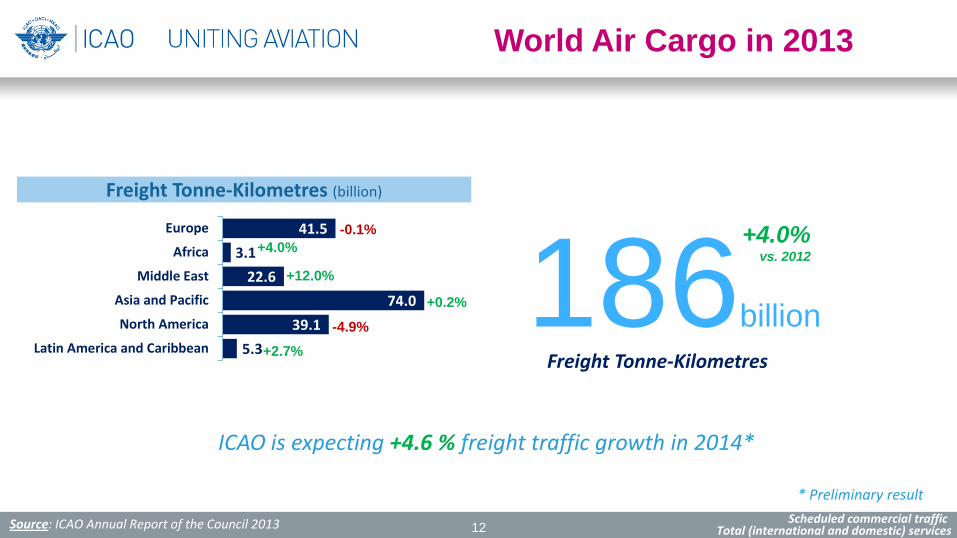
186billion Freight Tonne-Kilometres
+4.0% vs. 2012
41.5 3.1
22.6 74.0
39.1 5.3
Europe
Africa
Middle East
Asia and Pacific
North America
Latin America and Caribbean
Freight Tonne-Kilometres (billion)
-0.1% +4.0%
+12.0%
+0.2%
-4.9% +2.7%
Total (international and domestic) services Source: ICAO Annual Report of the Council 2013 Scheduled commercial traffic
World Air Cargo in 2013
ICAO is expecting +4.6 % freight traffic growth in 2014*
* Preliminary result
12

Asia/ Pacific 42%
North America 25%
Europe 23%
Middle East 6%
Latin America/ Caribbean
3% Africa
1%
2007
Distribution in Freight Tonne-Kilometres
1st: Asia/Pacific 2nd: North America 3rd: Europe
1st: Asia/Pacific 2nd: Europe 3rd: North America
2013
Asia/ Pacific 40%
Europe 22%
North America 21%
Middle East 12%
Latin America/ Caribbean
3% Africa
2%
Air Cargo Traffic: Worldwide Distribution
Scheduled commercial traffic Total (international and domestic) services Source: ICAO Annual Reports of the Council 13

Encouraging Outlook
World scheduled passenger traffic
14
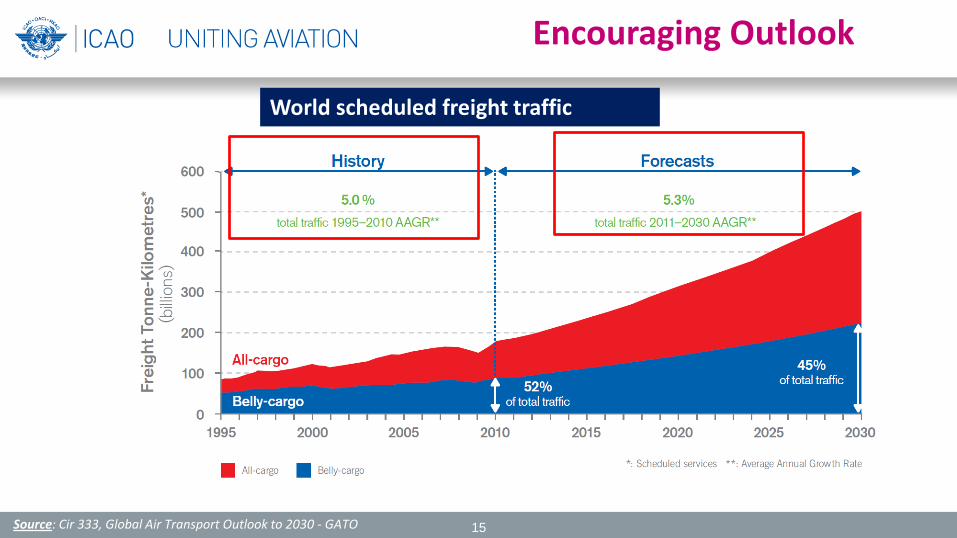
Source: Cir 333, Global Air Transport Outlook to 2030 - GATO
World scheduled freight traffic
Encouraging Outlook
15