airborne ip: examples from the mount milligan deposit ... · canada, and the amakinskaya kimberlite...
TRANSCRIPT
Airborne IP: examples from the Mount Milligan deposit,Canada, and the Amakinskaya kimberlite pipe, Russia
Andrea Viezzoli1 Vlad Kaminski1,2
1Aarhus Geophysics, ApS, Lollandsgade 52, Aarhus, DK-8000, Denmark.2Corresponding author. Email: [email protected]
Abstract. There have been multiple occurrences in the literature in the past several years of what has been referred to asthe induced polarisation (IP) effect in airborne time domain electromagnetic (TDEM) data. This phenomenon is known tobe responsible for incorrect inversion modelling of electrical resistivity, lower interpreted depth of investigation (DOI)and lost information about chargeability of the subsurface and other valuable parameters. Historically, there have beenmany suggestions to account for the IP effect using the Cole-Cole model. It has been previously demonstrated that theCole-Cole model can be effective in modelling synthetic TDEM transients. In the current paper we show the possibilityof extracting IP information from airborne TDEM data using this same concept, including inverse modelling ofchargeability from TDEM data collected by VTEM, with field examples from Canada (Mt Milligan deposit) andRussia (Amakinskaya kimberlite pipe).
Key words: airborne EM, airborne IP, inversion, kimberlite, mineral exploration, modelling, porphyry.
Received 7 February 2016, accepted 29 May 2016, published online 8 July 2016
Introduction
The induced polarisation (IP) effect in time domainelectromagnetic (TDEM) data can be observed in coincident-loop TDEM systems and is manifested as abnormally quickdecay, which sometimes causes the measured voltage valuesin the receiver coil to demonstrate negative values. Thisphenomenon can significantly alter the shape of the transients,and therefore, mislead the interpretation to recover falsestructures with incorrect conductivity-thickness parameters.IP effect has been recognised in the ground-based TDEM,including work done by Kozhevnikov and Antonov (2007),Antonov and Shein (2008), Kozhevnikov and Antonov (2009)and Kamenetsky et al. (2014). Nonetheless, for a long time ithas been standard practice within the geophysical communityto neglect this effect in airborne data and eliminate any negativevalues when inverting the TDEM data.
There has been a recent and increasing interest in the IPeffect in airborne data, as it carries potential for recovery ofthe Cole-Cole parameters (Cole and Cole, 1942), includingchargeability information, which can be extracted from theairborne EM data, along with other Cole-Cole parameters.These recent attempts include work done by Kratzer andMacnae (2012), where VTEM results acquired in Africa wereprocessed to provide a chargeability distribution model. Otherpreliminary synthetic and field results have been demonstratedin Kaminski et al. (2015), Kwan et al. (2015a), Viezzoli et al.(2013) and Viezzoli et al. (2015a). In this paper, we focus on thepractical implementation of these algorithms and show someresults from field data acquired in western Canada (Mt Milliganporphyry copper-gold deposit), as well as in northern Russia(Amakinskaya kimberlite pipe).
The extraction of Cole-Cole parameters is handled by meansof laterally constrained inversion (LCI) or spatially constrainedinversion (SCI) (Viezzoli et al., 2008; Fiandaca et al., 2012).
The difference between these two codes is in the constructionof the model objective function, with LCI inversion designedto invert with consideration of two constraints (vertical and inthe direction of the flight), while the SCI concept is effectivelya quasi three-dimensional (3D) code, capable of using 3Dconstraints along and across the flight lines. Both inversions(LCI and SCI) use similar forward mapping kernel, based onone-dimensional (1D) considerations, in which the complexresistivity (dispersive model) is generally governed byEquation 1:
zðoÞ ¼ r�1� m0
103
�1� 1
1þ ðiotÞc��
ð1Þ
where z(w) is the complex frequency dependent resistivity,r is the DC resistivity, m0 is the chargeability, t is therelaxation time and c is the frequency parameter (Cole andCole, 1942). The inversion algorithm, modified as perFiandaca et al. (2012), provides combined estimates of all fourparameters from Equation 1 in two modes described above (LCIand SCI).
The inversions are subject to heavy regularisation and user-defined constraints. There are, however, very notable correlationsbetween the extractions of chargeability from airborne datawith chargeability sections derived from ground IP surveys, asshown in the first example. Furthermore, recovery of frequencyparameter c along with relaxation time t can also carry valuablegeological information, which cannot be derived from anyother type of geophysical data.
Example 1: Mount Milligan, Canada
Mt Milligan is a large Cu-Au porphyry deposit situated incentral British Columbia (Figure 1). Geologically, the MtMilligan deposit is a mineralised zone within a porphyrite-monzanite stock (MBX), hosted within andesites and
CSIRO PUBLISHING
Exploration Geophysicshttp://dx.doi.org/10.1071/EG16015
Journal compilation � ASEG 2016 www.publish.csiro.au/journals/eg

(a)
(b)
(c)
10–10
10–11
10–12
10–13
10–14
10–15
10–16
FaultLithology
N
433 500
6 11
0 00
06
109
500
6 10
9 00
06
108
500
6 10
8 00
0
434 000 434 500 435 000
Project Geology
FaultPit ContoursMet DrillingResource DrillingCondemnation Drilling
MonzoniteTrachyte
AndesiteLatile
10–5 10–4 10–3 10–2
Vol
tage
(V
)
Time (s)
Fig. 2. (a) Bedrock geology of Mt Milligan deposit; (b) visible IP effect in VTEM data (flight line 540); (c) IP effect in individual transients.
–128°
Mt. Milligan
–126° –124° –122° –120°
–128° –126° –124° –122° –120°
56°
54°
52°
50°
56°
54°
52°
50°
Fig. 1. Location and bedrock geology of Mt Milligan deposit, Canada.
B Exploration Geophysics A. Viezzoli and V. Kaminski

1240
Incr
ease
d D
OI,
impr
oved
rec
over
y of
res
istiv
ity12
2012
0011
8011
6011
4011
2011
0010
8010
6010
4010
2010
00 980
960
940
920
900
880
860
840
820
800
1240
1220
1200
1180
1160
1140
1120
1100
1080
1060
1040
1020
1000 980
960
940
920
900
880
860
840
820
800
050
100
150
200
250
300
350
400
450
500
550
600
650
700
750
0 1010
010
0010
000
5010
015
020
025
030
035
040
045
050
055
060
065
070
075
080
085
090
095
0
Dis
tanc
e (m
)
1000
1050
1100
1150
1200
1250
1300
1350
1400
1450
1500
1550
1600
1650
1700
1250
1300
1350
1400
1450
1500
1550
1600
1650
1700
Elevation (m) Elevation (m)
10–9
10–1
0
10–1
1
10–1
2
10–1
3
10–1
4
10–1
5 10–5
10–4
10–3
10–2
10–1
10–9
10–1
0
10–1
1
10–1
2
10–1
3
10–1
4
10–1
5 10–5
10–4
10–3
10–2
10–1
Fig.3
.Top:non-IP
inversionof
VTEM
dataover
MtM
illigan
deposit;botto
m:IP
inversion(Cole-Colemodel)over
MtM
illigan
deposit.
Airborne IP: examples from Canada and Russia Exploration Geophysics C

volcanites of the Takla Group (DeLong et al., 1991). There aretwo types of alteration present in the Mt Milligandeposit: potassic and propylitic. These alterations areresponsible for different physical properties. Chargeability isa crucial property for the Mt Milligan deposit, as it maybe indicative of the gold-bearing mineralisation, which is
otherwise undetectable due to poor electrical conductivityof the mineralisation (Oldenburg et al., 1997).
In 2008, the deposit was surveyed by the VTEM systemat the request of Geoscience BC and showed significant IPeffect in the data (Figure 2). Previous attempts to invert thesedata include Schwarzbach et al. (2013), which was done
10 100 1000 10 000
Fig. 4. Series of resistivity depth slices (Wm) generated from an SCI quasi-3D inversion 3D volume interpolation.
100 120 140 160 180 200 220 240 260 280 300 320 340 360 380 400
Fig. 5. Chargeability (mV/V) depth slices produced from interpolated results of Cole-Cole SCI inversion 3D volumeinterpolation.
D Exploration Geophysics A. Viezzoli and V. Kaminski
1350 500
1150
1000
Ele
vatio
n (m
)
85012 300 12 600
Monzonite Latite Trachyte Overburden
600
400
0
12 900
Easting (m)13 200 13 500
(mV/V)
260
135
70
1300125012001150
Ele
vatio
n (m
)
110010501000
Near-surface target
Mineralised zone
950900
(m V/V)
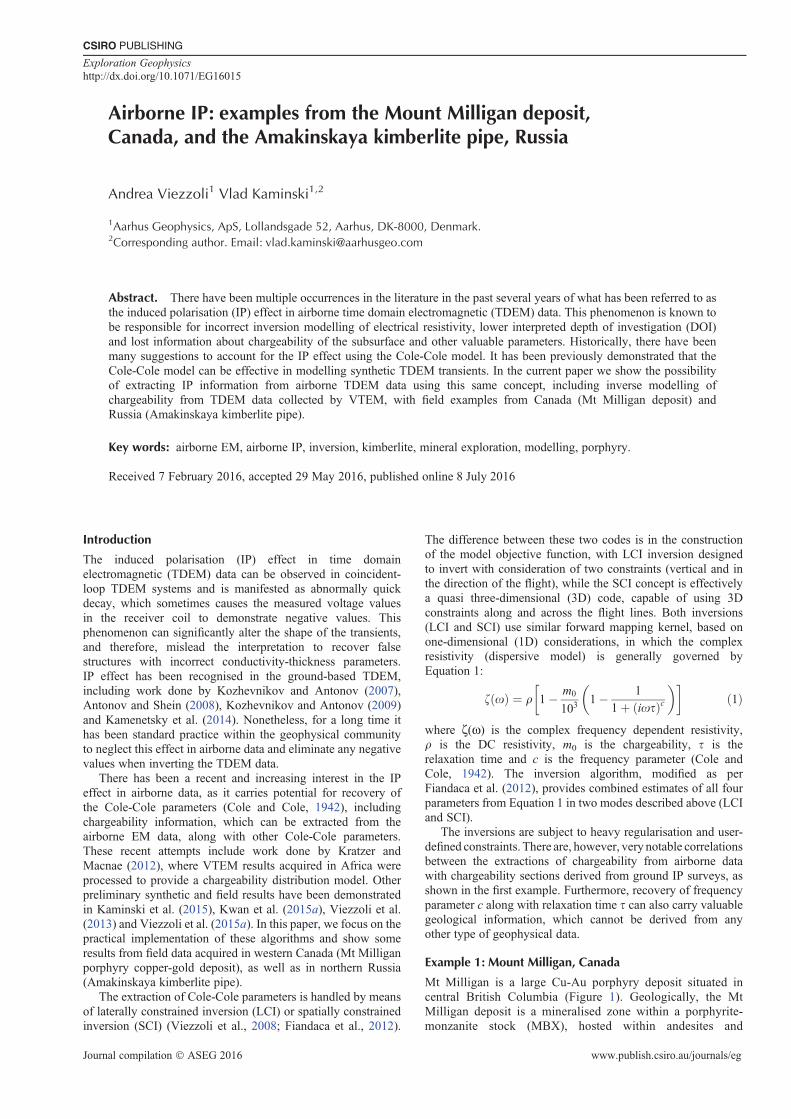
Fig. 6. Comparison between ground IP chargeability and chargeability recovered from TDEM data.
(a) (b)
1e-11
1e-12
1e-13
1e-14
Vol
tage
(V
)
1e-15
1e-16
1e-17
1e-1810–5 10–4 10–3 10–2 10–1
Time (s)
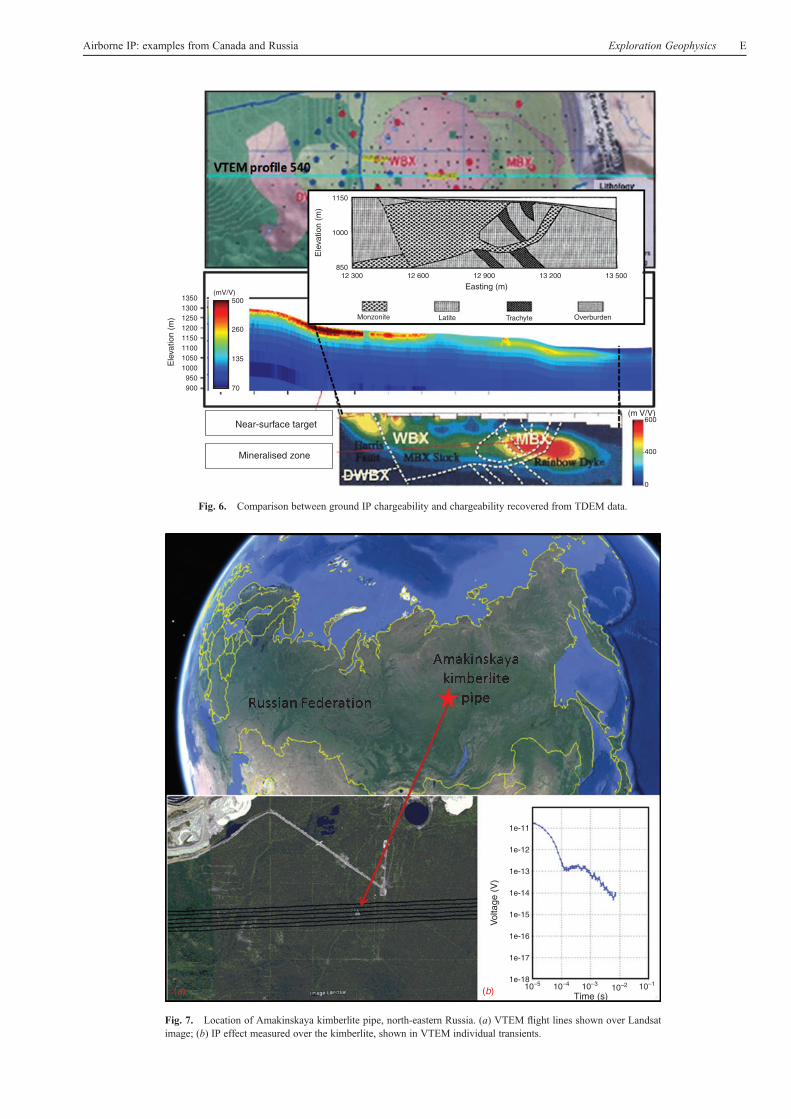
Fig. 7. Location of Amakinskaya kimberlite pipe, north-eastern Russia. (a) VTEM flight lines shown over Landsatimage; (b) IP effect measured over the kimberlite, shown in VTEM individual transients.
Airborne IP: examples from Canada and Russia Exploration Geophysics E
without consideration of the IP effect. Kwan et al. (2015b)have recently contributed to analysis of the IP effect in theseVTEM data.
For the purpose of current study, the VTEM data wereinverted using the SCI approach. A first attempt was madewithout the consideration of the IP effect, and then the datawere inverted in IP mode. Figure 3 shows the comparison ofresistivity depth sections with and without modelling of theIP effect, both clipped to interpreted depth of investigation(DOI). As can be seen in Figure 3, the ‘MBX’ marks theextent of the monzonite stock, which along with RainbowDike, are showing the highest grades of gold concentration inthe deposit (DeLong et al., 1991). In this figure there issignificant improvement in DOI due to modelling of the IPeffect. Furthermore, the improved resistivity section (lowersection) shows good correlation with the geology (e.g. theresistive response of DWBX and MBX zones, the conductivesignature of overburden, WBX, and ‘66’ zones).
The results of the SCI inversion in IP mode were interpolatedto populate a 3D volume. The 3D volume was then sliced inXY direction, generating resistivity and chargeability depthslices, plotted over the bedrock geology (Figures 4 and 5). Therecovered chargeabilitywas further investigated and compared tothe chargeability section recovered from the ground IP survey(Oldenburg et al., 1997). This comparison is shown in Figure 6.The profile adapted from Oldenburg et al. (1997) is nearlycoincident with VTEM flight line 540; however, the actualground IP data was unavailable to us, and therefore, thecomparison is based on visual inspection of the results.
Example 2: Amakinskaya kimberlite pipe, Russia
The second example shows a study carried out over theAmakinskaya kimberlite pipe situated in Yakutia (north-eastern Russia, Figure 7).
Є3
hlJ 1
or
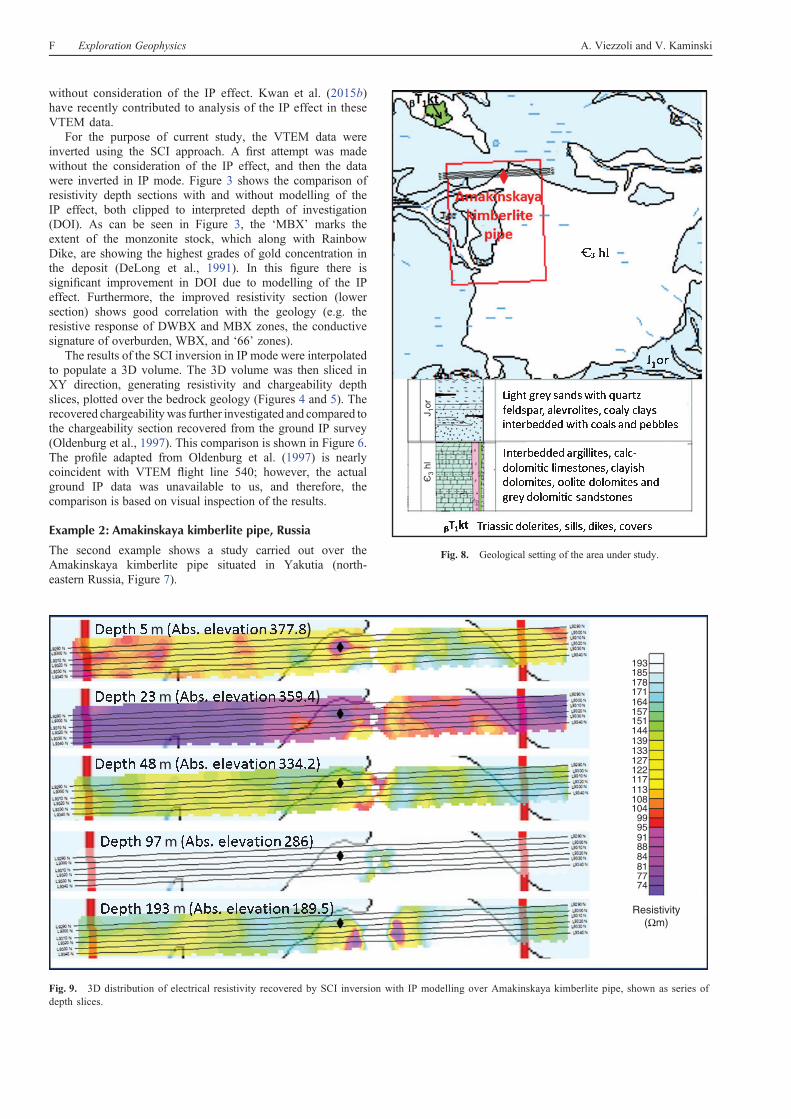
Fig. 8. Geological setting of the area under study.
193185178171164157151144139133127122117113108104
9995918884817774
Resistivity(Ωm)
Fig. 9. 3D distribution of electrical resistivity recovered by SCI inversion with IP modelling over Amakinskaya kimberlite pipe, shown as series ofdepth slices.
F Exploration Geophysics A. Viezzoli and V. Kaminski
From the geological standpoint, the area surrounding theAmakinskaya kimberlite pipe belongs to a sedimentary basinwith widespread outcrops of clays and alevrolites of Jurassic age(J1or), which unconformably overlay the Cambrian limestonecomplex (o3hl). Triassic basalts (bT1kt) are also widespread inthe area, especially to the north of the pipe (Figure 8).
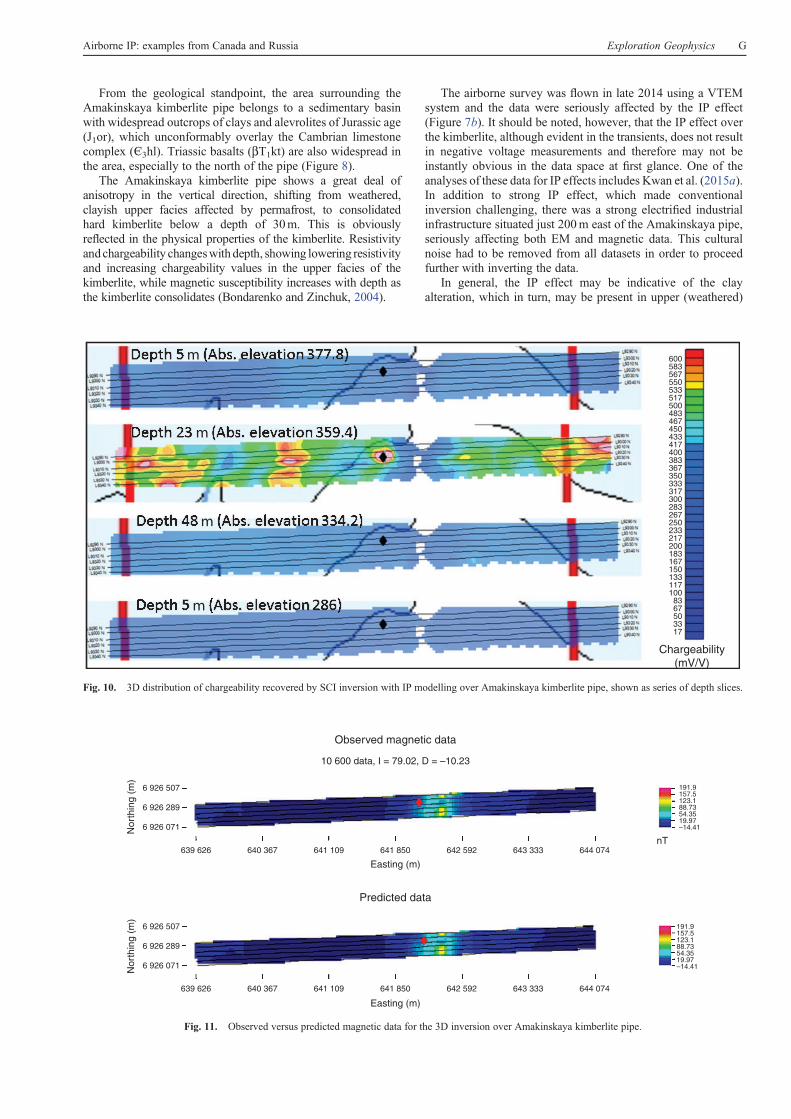
The Amakinskaya kimberlite pipe shows a great deal ofanisotropy in the vertical direction, shifting from weathered,clayish upper facies affected by permafrost, to consolidatedhard kimberlite below a depth of 30m. This is obviouslyreflected in the physical properties of the kimberlite. Resistivityandchargeability changeswithdepth, showing lowering resistivityand increasing chargeability values in the upper facies of thekimberlite, while magnetic susceptibility increases with depth asthe kimberlite consolidates (Bondarenko and Zinchuk, 2004).
The airborne survey was flown in late 2014 using a VTEMsystem and the data were seriously affected by the IP effect(Figure 7b). It should be noted, however, that the IP effect overthe kimberlite, although evident in the transients, does not resultin negative voltage measurements and therefore may not beinstantly obvious in the data space at first glance. One of theanalyses of these data for IP effects includes Kwan et al. (2015a).In addition to strong IP effect, which made conventionalinversion challenging, there was a strong electrified industrialinfrastructure situated just 200m east of the Amakinskaya pipe,seriously affecting both EM and magnetic data. This culturalnoise had to be removed from all datasets in order to proceedfurther with inverting the data.
In general, the IP effect may be indicative of the clayalteration, which in turn, may be present in upper (weathered)
600583567550533517500483467450433417400383367350333317300283267250233217200183167150133117100
8367503317
Chargeability(mV/V)
Fig. 10. 3D distribution of chargeability recovered by SCI inversion with IP modelling over Amakinskaya kimberlite pipe, shown as series of depth slices.
Observed magnetic data
10 600 data, I = 79.02, D = –10.23
6 926 507
6 926 289
Nor
thin
g (m
)N
orth
ing
(m)
6 926 071
6 926 507
6 926 289
6 926 071
639 626 640 367 641 109 641 850
Easting (m)
Easting (m)
Predicted data
642 592 643 333 644 074nT
191.9157.5123.188.7354.3519.97–14.41
191.9157.5123.188.7354.3519.97–14.41
639 626 640 367 641 109 641 850 642 592 643 333 644 074
Fig. 11. Observed versus predicted magnetic data for the 3D inversion over Amakinskaya kimberlite pipe.
Airborne IP: examples from Canada and Russia Exploration Geophysics G
facies of a kimberlite (Kaminski and Oldenburg, 2012).Interpretation of the IP effect over kimberlites for groundTDEM surveys has been previously described in the literature(Kamenetsky et al., 2014), and becomes increasingly attractivein cases with airborne TDEM datasets as it allows extractionof chargeability, along with other valuable parameters, such asrelaxation time (t) and frequency parameter (c).
In this particular case study, there is a thick layer ofpermafrost present, which greatly contributes to the IP effectin the TDEM data, along with the presence of clay material inthe weathered upper part of the kimberlite. However, theelectrical processes in the permafrost result in a higher rangeof frequency parameter c than those processes in the fine-grained clay particles, which result in lower c values. Similarobservations were made by Kamenetsky et al. (2014) over otherkimberlite pipes from Yakutia, Russia, which are situated within200 km from the Amakinskaya pipe and where permafrost isalso widely spread.
Therefore, in order to distinguish between the two types ofIP effect it will be important to implement the frequencyparameter analysis. Some preliminary results from this areawere shown in Viezzoli et al. (2015b). Although frequencyparameter analysis is omitted in this current study, we believethat such an approach carries great potential for interpretationof IP-affected airborne data in similar cases.
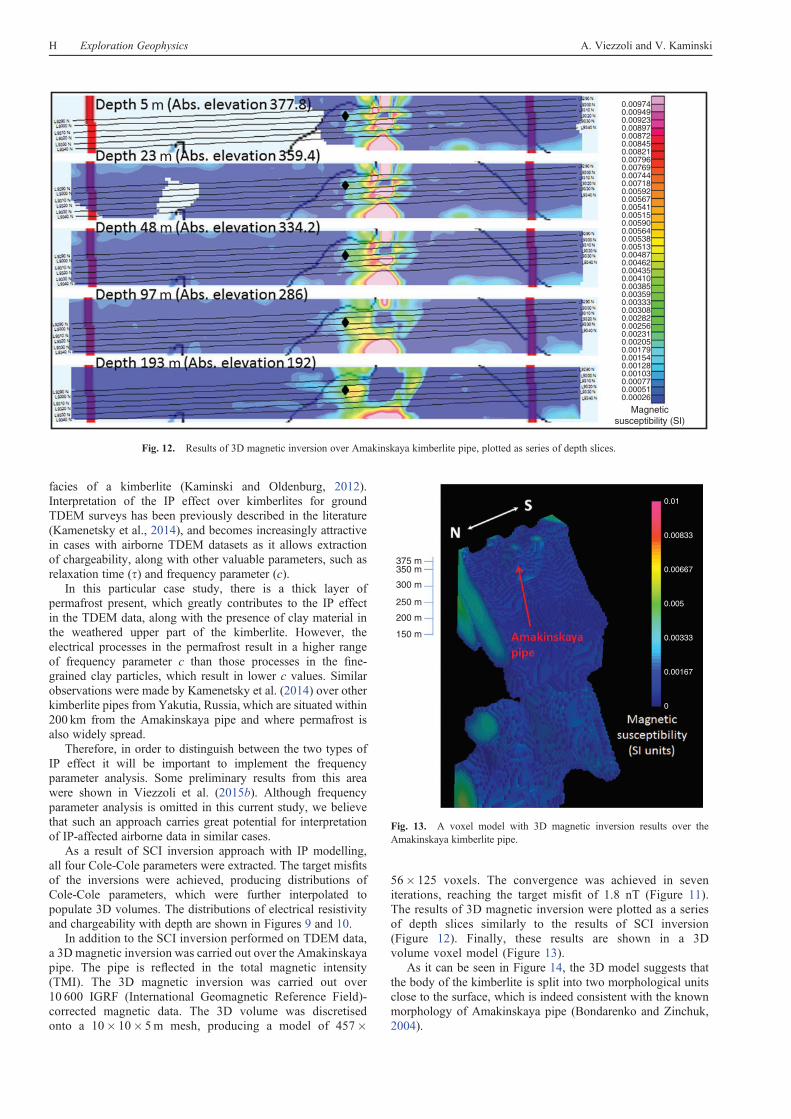
As a result of SCI inversion approach with IP modelling,all four Cole-Cole parameters were extracted. The target misfitsof the inversions were achieved, producing distributions ofCole-Cole parameters, which were further interpolated topopulate 3D volumes. The distributions of electrical resistivityand chargeability with depth are shown in Figures 9 and 10.
In addition to the SCI inversion performed on TDEM data,a 3D magnetic inversion was carried out over the Amakinskayapipe. The pipe is reflected in the total magnetic intensity(TMI). The 3D magnetic inversion was carried out over10 600 IGRF (International Geomagnetic Reference Field)-corrected magnetic data. The 3D volume was discretisedonto a 10� 10� 5m mesh, producing a model of 457�
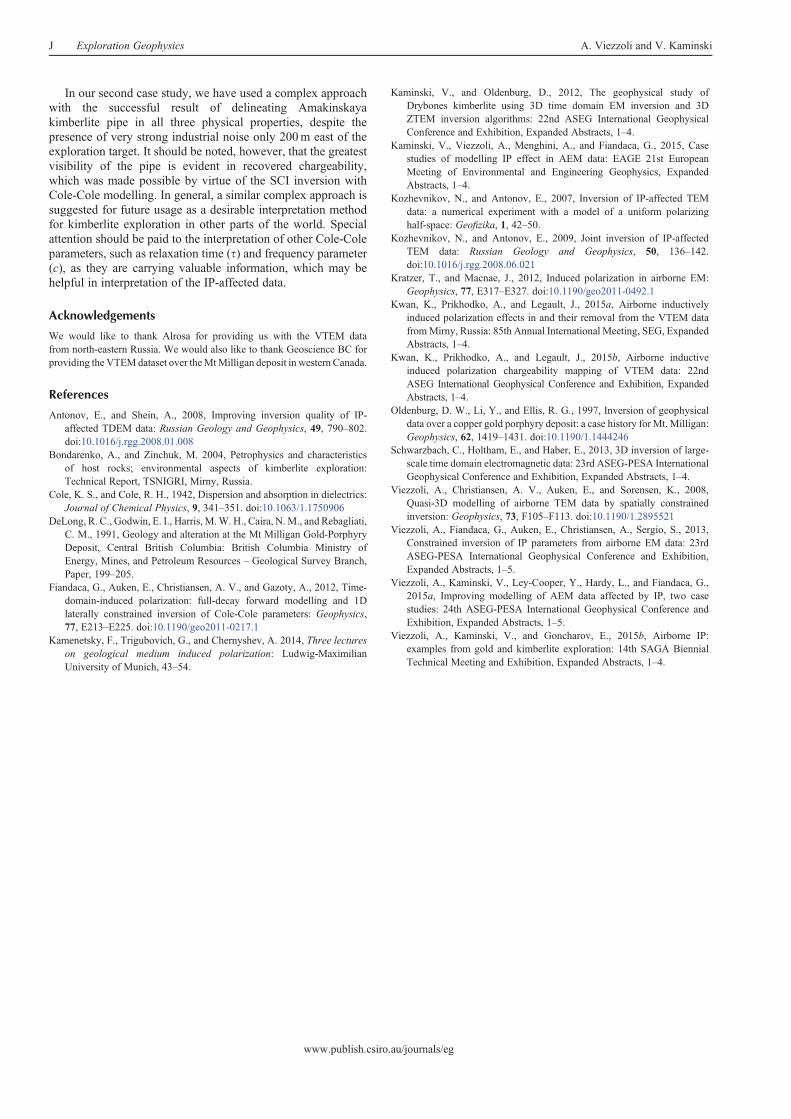
56� 125 voxels. The convergence was achieved in seveniterations, reaching the target misfit of 1.8 nT (Figure 11).The results of 3D magnetic inversion were plotted as a seriesof depth slices similarly to the results of SCI inversion(Figure 12). Finally, these results are shown in a 3Dvolume voxel model (Figure 13).
As it can be seen in Figure 14, the 3D model suggests thatthe body of the kimberlite is split into two morphological unitsclose to the surface, which is indeed consistent with the knownmorphology of Amakinskaya pipe (Bondarenko and Zinchuk,2004).
0.009740.009490.009230.008970.008720.008450.008210.00796
0.007440.00769
0.007180.005920.005670.005410.005150.005900.005640.005380.005130.004870.004620.004350.004100.003850.003590.003330.003080.002820.002560.002310.002050.001790.001540.001280.001030.000770.000510.00026
Magneticsusceptibility (SI)
Fig. 12. Results of 3D magnetic inversion over Amakinskaya kimberlite pipe, plotted as series of depth slices.
375 m
0.01
0.00833
0.00667
0.005
0.00333
0.00167
0
350 m
300 m
250 m
200 m
150 m
Fig. 13. A voxel model with 3D magnetic inversion results over theAmakinskaya kimberlite pipe.
H Exploration Geophysics A. Viezzoli and V. Kaminski

Overall, the results of the inversions allow cleardifferentiation between the kimberlite and the host rock. Theresults are shown in Figure 14 as a compilation of allinversion results, interpolated along VTEM flight line 9310and shown as a depth section of electrical resistivity,chargeability and magnetic susceptibility.
Conclusions
By applying the Cole-Cole model in the inversions of TDEMdata, we demonstrate the ability to map the 3D distribution of
physical parameters in the subsurface, which brings new valueto mineral exploration. In our first example, we show improvedresistivity imaging by virtue of accounting for the IP effect inthe TDEM data, as well as capability to map chargeability,which is, to an extent, in agreement with ground IP surveyresults. Not only does the IP inversion bring greater DOI andimproved recovery of electrical resistivity, but in the case ofthe Mt Milligan deposit, the ability to extract chargeability playsa crucial role, since the deposit is electrically resistive andchargeability becomes a primary quality in overall detectabilityof the deposit (Oldenburg et al., 1997).
Observed data
Amakinskayakimberlite pipe
Areaaffected by
cultural noise
Predicted dataMisfit
639 500
15
17 67 117 183 250 317 383 450 517 583
21 31 46 67
Electrical resistivity(Ωm)
Chargeability(mV/V)
Magnetic susceptibility(SI units) × 10–5
98 143 237
640 000 640 500 641 000 641 500 642 000 642 500 643 000
Misfit4.5
4.0
3.5
3.0
2.5
2.0
1.5
1.0
0.5
400
350
300
250
200
150
100
50
0
–50
->E
400
350
300
250
200
150
100
50
0
–50
->E
400
350
300
250
200
61 425
61 400
61 375
61 350
61 325
61 300
61 275
61 250
61 225
->E
TMI(nT)
0
643 500 644 000
639 500 640 000 640 500 641 000 641 500 642 000 642 500 643 000 643 500 644 000
639 500 640 000 640 500 641 000 641 500 642 000 642 500 643 000 643 500 644 000
18 134 287 422 556
Fig. 14. Compilation of inversion results over VTEM flight line 9310.
Airborne IP: examples from Canada and Russia Exploration Geophysics I
In our second case study, we have used a complex approachwith the successful result of delineating Amakinskayakimberlite pipe in all three physical properties, despite thepresence of very strong industrial noise only 200m east of theexploration target. It should be noted, however, that the greatestvisibility of the pipe is evident in recovered chargeability,which was made possible by virtue of the SCI inversion withCole-Cole modelling. In general, a similar complex approach issuggested for future usage as a desirable interpretation methodfor kimberlite exploration in other parts of the world. Specialattention should be paid to the interpretation of other Cole-Coleparameters, such as relaxation time (t) and frequency parameter(c), as they are carrying valuable information, which may behelpful in interpretation of the IP-affected data.
Acknowledgements
We would like to thank Alrosa for providing us with the VTEM datafrom north-eastern Russia. We would also like to thank Geoscience BC forproviding the VTEMdataset over theMtMilligan deposit in western Canada.
References
Antonov, E., and Shein, A., 2008, Improving inversion quality of IP-affected TDEM data: Russian Geology and Geophysics, 49, 790–802.doi:10.1016/j.rgg.2008.01.008
Bondarenko, A., and Zinchuk, M. 2004, Petrophysics and characteristicsof host rocks; environmental aspects of kimberlite exploration:Technical Report, TSNIGRI, Mirny, Russia.
Cole, K. S., and Cole, R. H., 1942, Dispersion and absorption in dielectrics:Journal of Chemical Physics, 9, 341–351. doi:10.1063/1.1750906
DeLong, R. C., Godwin, E. I., Harris, M.W. H., Caira, N.M., and Rebagliati,C. M., 1991, Geology and alteration at the Mt Milligan Gold-PorphyryDeposit, Central British Columbia: British Columbia Ministry ofEnergy, Mines, and Petroleum Resources – Geological Survey Branch,Paper, 199–205.
Fiandaca, G., Auken, E., Christiansen, A. V., and Gazoty, A., 2012, Time-domain-induced polarization: full-decay forward modelling and 1Dlaterally constrained inversion of Cole-Cole parameters: Geophysics,77, E213–E225. doi:10.1190/geo2011-0217.1
Kamenetsky, F., Trigubovich, G., and Chernyshev, A. 2014, Three lectureson geological medium induced polarization: Ludwig-MaximilianUniversity of Munich, 43–54.
Kaminski, V., and Oldenburg, D., 2012, The geophysical study ofDrybones kimberlite using 3D time domain EM inversion and 3DZTEM inversion algorithms: 22nd ASEG International GeophysicalConference and Exhibition, Expanded Abstracts, 1–4.
Kaminski, V., Viezzoli, A., Menghini, A., and Fiandaca, G., 2015, Casestudies of modelling IP effect in AEM data: EAGE 21st EuropeanMeeting of Environmental and Engineering Geophysics, ExpandedAbstracts, 1–4.
Kozhevnikov, N., and Antonov, E., 2007, Inversion of IP-affected TEMdata: a numerical experiment with a model of a uniform polarizinghalf-space: Geofizika, 1, 42–50.
Kozhevnikov, N., and Antonov, E., 2009, Joint inversion of IP-affectedTEM data: Russian Geology and Geophysics, 50, 136–142.doi:10.1016/j.rgg.2008.06.021
Kratzer, T., and Macnae, J., 2012, Induced polarization in airborne EM:Geophysics, 77, E317–E327. doi:10.1190/geo2011-0492.1
Kwan, K., Prikhodko, A., and Legault, J., 2015a, Airborne inductivelyinduced polarization effects in and their removal from the VTEM datafromMirny, Russia: 85th Annual International Meeting, SEG, ExpandedAbstracts, 1–4.
Kwan, K., Prikhodko, A., and Legault, J., 2015b, Airborne inductiveinduced polarization chargeability mapping of VTEM data: 22ndASEG International Geophysical Conference and Exhibition, ExpandedAbstracts, 1–4.
Oldenburg, D. W., Li, Y., and Ellis, R. G., 1997, Inversion of geophysicaldata over a copper gold porphyry deposit: a case history for Mt. Milligan:Geophysics, 62, 1419–1431. doi:10.1190/1.1444246
Schwarzbach, C., Holtham, E., and Haber, E., 2013, 3D inversion of large-scale time domain electromagnetic data: 23rd ASEG-PESA InternationalGeophysical Conference and Exhibition, Expanded Abstracts, 1–4.
Viezzoli, A., Christiansen, A. V., Auken, E., and Sorensen, K., 2008,Quasi-3D modelling of airborne TEM data by spatially constrainedinversion: Geophysics, 73, F105–F113. doi:10.1190/1.2895521
Viezzoli, A., Fiandaca, G., Auken, E., Christiansen, A., Sergio, S., 2013,Constrained inversion of IP parameters from airborne EM data: 23rdASEG-PESA International Geophysical Conference and Exhibition,Expanded Abstracts, 1–5.
Viezzoli, A., Kaminski, V., Ley-Cooper, Y., Hardy, L., and Fiandaca, G.,2015a, Improving modelling of AEM data affected by IP, two casestudies: 24th ASEG-PESA International Geophysical Conference andExhibition, Expanded Abstracts, 1–5.
Viezzoli, A., Kaminski, V., and Goncharov, E., 2015b, Airborne IP:examples from gold and kimberlite exploration: 14th SAGA BiennialTechnical Meeting and Exhibition, Expanded Abstracts, 1–4.
J Exploration Geophysics A. Viezzoli and V. Kaminski
www.publish.csiro.au/journals/eg