airbus member states shareholder meeting · 04.10.2017 · product performance risks, as well as...
TRANSCRIPT
AIRBUS Member States Shareholder Meeting
Toulouse
4 October 2017

2 SAFE HARBOUR STATEMENT
This presentation includes forward-looking statements. Words such as “anticipates”, “believes”, “estimates”, “expects”, “intends”, “plans”,
“projects”, “may” and similar expressions are used to identify these forward-looking statements. Examples of forward-looking statements include
statements made about strategy, ramp-up and delivery schedules, introduction of new products and services and market expectations, as well as
statements regarding future performance and outlook.
By their nature, forward-looking statements involve risk and uncertainty because they relate to future events and circumstances and there are many
factors that could cause actual results and developments to differ materially from those expressed or implied by these forward-looking statements.
THESE FACTORS INCLUDE BUT ARE NOT LIMITED TO:
Changes in general economic, political or market conditions, including the cyclical nature of some of Airbus’ businesses;
Significant disruptions in air travel (including as a result of terrorist attacks);
Currency exchange rate fluctuations, in particular between the Euro and the U.S. dollar;
The successful execution of internal performance plans, including cost reduction and productivity efforts;
Product performance risks, as well as programme development and management risks;
Customer, supplier and subcontractor performance or contract negotiations, including financing issues;
Competition and consolidation in the aerospace and defence industry;
Significant collective bargaining labour disputes;
The outcome of political and legal processes including the availability of government financing for certain programmes and the size of defence and space
procurement budgets;
Research and development costs in connection with new products;
Legal, financial and governmental risks related to international transactions;
Legal and investigatory proceedings and other economic, political and technological risks and uncertainties.
As a result, Airbus’ actual results may differ materially from the plans, goals and expectations set forth in such forward-looking statements.
For a discussion of factors that could cause future results to differ from such forward-looking statements, see the Airbus “Registration Document”
dated 4 April 2017, including the Risk Factors section.
Any forward-looking statement contained in this presentation speaks as of the date of this presentation. Airbus undertakes no obligation to publicly
revise or update any forward-looking statements in light of new information, future events or otherwise.
DISCLAIMER

Member States Shareholder Meeting
H1 Results
2017
Business
Update
Strategy
Update

H1 2017 HIGHLIGHTS 4
Healthy commercial aircraft environment; robust backlog of 6,771 a/c
supports ramp-up plans
H1 financials reflect delivery pattern mainly impacted by engine issues
Continued focus on ramp-up, operations and integration
2017 Guidance maintained

75%
9%
16%
5 H1 2017 COMMERCIAL POSITIONING
COMMERCIAL AIRCRAFT: 248 gross orders, 203 net of cancellations including 4 A350 Qatar. Backlog: 6,771 a/c
HELICOPTERS: 151 net orders, including 30 H225 military for Kuwait
DEFENCE AND SPACE: Order book reflects perimeter change (€ 1.9 bn). 19 Light and Medium booked in Military Aircraft
Airbus Order Book*
by Region (by value)
● Asia Pacific
● Europe
● North America
● Middle East
● Latin America
● Other countries
Airbus External
Revenue Split by Division
● Commercial Aircraft
● Helicopters
● Defence and Space
* Commercial Order Intake and Order Book based on list prices
€ 981 bn t/o defence € 38.2 bn
€ 29 bn t/o defence € 4.6 bn
33%
21%
19%
13%
5%
9%

6 H1 2017 FINANCIAL PERFORMANCE
Revenues
(1) H1 2017 Average number of shares: 773,223,614 compared to 775,116,098 in H1 2016.
Capitalised R&D: € 149 m in H1 2017 and € 112 m in H1 2016.
EPS(1) Adjusted
in €
bn
in €
in €
bn /
RoS
(%
) in
€ b
n
EBIT Adjusted
FCF before M&A and Customer Financing
TBU
28.8 28.7
H1 2016 H1 2017
1.68
1.10
5.8%
3.8%
H1 2016 H1 2017
1.40
0.83
H1 2016 H1 2017
(2.6) (2.1)
H1 2016 H1 2017

7 H1 2017 PROFITABILITY
H1 2017 EBIT reported of € 1.79 bn
H1 2017 Adjustments resulting from:
€ - 70 m A400M LMC
€ + 174 m $ PDP mismatch / BS Revaluation
€ + 28 m Other AD Portfolio
€ + 560 m Defence Electronics net capital gain
€ + 692 m Net Adjustments
H1 2017 Net Income of € 1.5 bn
H1 2017 Net Income Adjusted of € 0.6 bn
H1 2017 tax rate on core business is 28 %
EBIT Performance
EPS Performance
in €
bn
in €
Average number of shares: H1 2017= 773,223,614 , H1 2016= 775,116,098
1.68 1.85
1.10
1.79
EBIT Adjusted EBIT Reported
H1 2016 H1 2017
1.40
2.27
0.83
1.94
EPS Adjusted EPS Reported
H1 2016 H1 2017

12.1
25.2 21.3
16.1 12.1
13.0
3.8
4.6
1.6
8 CURRENCY HEDGE POLICY
Net Exposure
In H1 2017, new hedge contracts of $ 7.4 bn were added at an average rate of € 1 = $ 1.19 (1) of which $ 6.8 bn Forwards at € 1 = $ 1.18 and $ 0.6 bn Zero-cost Collars
$ 13.0 bn of hedges matured at an average rate of € 1 = $ 1.31
Hedge portfolio (1) 30 June 2017 at $ 96.8 bn (vs. $ 102.4 bn in Dec. 2016), at an average rate of $ 1.24 (2)
Average hedge rates 2017 remaining 6 months
2018 2019 2020 2021 and beyond
€ vs $ Forwards/Collars (2)
1.26
( 1.29 in Dec. 16 )
1.25
( 1.25 in Dec. 16 )
1.24
( 1.24 in Dec. 16 )
1.22
( 1.23 in Dec. 16 )
1.22
( 1.22 in Dec. 16 )
£ vs $ 1.52 1.55 1.46 1.37 1.35
IN $ BILLION
Approximately 60% of Airbus US$ revenues are naturally hedged by US$ procurement. Graph shows US$ Forward Sales and Collars, net exposure trend for illustrative purposes
(1) Total hedge amount contains $/€ and $/£ designated hedges; (2) Blended Forwards and Collars rate includes Collars at least favourable rate
● Forward Sales as of June 2017
● Collars as of June 2017
● Forward Sales and Collars as of Dec. 2016
Mark-to-market value incl. in AOCI = € - 2.6 bn
Closing rate @ 1.14 € vs. $

11.1
7.9
Net Cashposition Dec.
2016
Gross Cash Flowfrom Operations
Change inWorking Capital
Cash used forinvesting
activities beforeM&A
M&A ShareholderReturn
Pensions &Others
Net Cashposition Jun.
2017
-3.1 -0.7
+0.6
-1.0 -0.2
+1.3
H1 2017 CASH EVOLUTION 9
(1) Thereof Capex of € - 1.1 bn; (2) M&A transactions include acquisitions and disposals of subsidiaries and businesses
IN € BILLION
Free Cash Flow before M&A: € - 2.5 bn
t/o Customer Financing: € - 0.5 bn
Free Cash Flow before M&A and
Customer Financing € - 2.1 bn
(1)
(2)
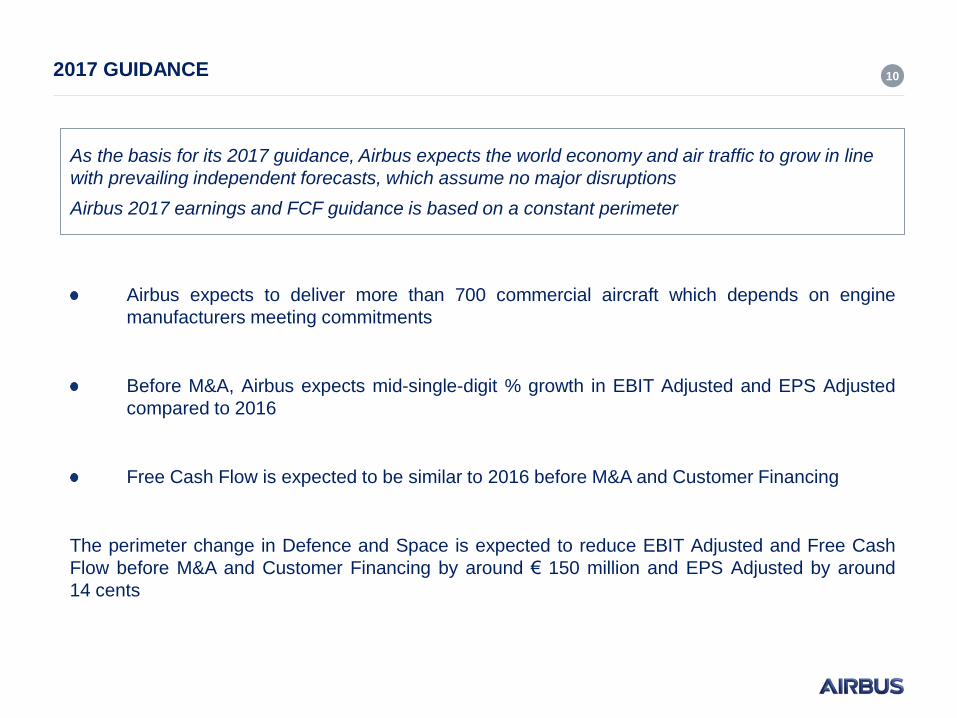
10 2017 GUIDANCE
As the basis for its 2017 guidance, Airbus expects the world economy and air traffic to grow in line
with prevailing independent forecasts, which assume no major disruptions
Airbus 2017 earnings and FCF guidance is based on a constant perimeter
Airbus expects to deliver more than 700 commercial aircraft which depends on engine
manufacturers meeting commitments
Before M&A, Airbus expects mid-single-digit % growth in EBIT Adjusted and EPS Adjusted
compared to 2016
Free Cash Flow is expected to be similar to 2016 before M&A and Customer Financing
The perimeter change in Defence and Space is expected to reduce EBIT Adjusted and Free Cash
Flow before M&A and Customer Financing by around € 150 million and EPS Adjusted by around
14 cents

2017 KEY PRIORITIES 11
Focus on key programmes
Drive innovation and digitalisation for the longer term to secure our future
Work to secure EPS / FCF as platform to deliver 2018 / 2019 growth

0.4
2.4
0.6
1.2
1.7
1.0
2012 2013 2014 2015 2016 2017
Dividend Share Buyback
INCREASING SHAREHOLDER RETURNS 12
Dividend policy since 2013, Total Shareholder Returns 2012-2017 ~ € 7 bn
FCF
€ 8.4 bn
1.2
(0.8)
2.0
2.8 3.2
2012 2013 2014 2015 2016
FCF FCF before M&A, before customer financing
Dividend per Share
In €
in
€ b
n
in €
bn
0.60 0.75
1.20 1.30
1.35**
39% 40% 40% 38%
105%
2012 2013 2014 2015 2016
Total Shareholder Returns*
~ € 7 bn
**
* Actual cash out each year
** 2016 Dividend paid: April 2017

Member States Shareholder Meeting
H1 Results
2017
Business
Update
Strategy
Update

BUSINESS UPDATE – A320, A350, A380 14
A350
Good progress on A350 industrial ramp-up (43 deliveries end August 2017)
Confident that we are on track for our FY ramp-up and the rate 10 target by end 2018
-1000 Flight Test campaign well underway – First delivery target remains end of 2017
We remained focused on Recurring Cost convergence and we made progress on the
ramp-up curve in line with our latest programme targets
A320
SA remains healthy: essentially sold out until 2022, which protects our ramp-up plans
Deliveries end August: 310 A320 family delivered, t/o 76 A320/A321neo
Neo ramp-up remains challenging. Customers are still experiencing a number of in-
service engine issues
We still target total A320neo deliveries to be ~200 but in view of these engine issues,
this target becomes more challenging
A380
A380plus development study presented during Paris Air Show
Deliveries end August: 8 aircraft
We continue our efforts on fixed cost reduction
Considering our A380 current booking situation, we will adjust our 2019 deliveries to 8

BUSINESS UPDATE – A400M, H225, ONEWEB, BREXIT 15
H225
H225 ban lift announced by UK and Norway authorities
Working with customers on return to service
A400M
10 a/c delivered end August 2017
Challenges remain; discussions with customers to de-risk the programme are ongoing
Adjustment of production levels to absorb inventory
OneWeb
JV to design and build the 900 satellites for OneWeb’s low Earth orbit (LEO) satellite
March 2017 : groundbreaking of the manufacturing facility in Florida
June 2017 : inauguration of the assembly line in Toulouse
Brexit
All current business agreements remain intact and will do so until conclusion of UK / EU
exit agreement
We will reconsider our investment plans in the UK, like any other company will do

Member States Shareholder Meeting
H1 Results
2017
Business
Update
Strategy
Update

Globalisation
AIRBUS STRATEGY UPDATE (1/2)
R&T and Demonstrators to drive and deliver on Advanced Technology
Roadmaps
A^3 and Shenzhen to challenge and disrupt
Airbus Ventures and BizLab to seize opportunities
New commercial drone start-up Airbus Aerial in Atlanta to develop new
imagery services
Quantum platform used as a digital accelerator across our businesses to:
Secure seamless digital continuity from design to manufacturing to in-service
operations
Establish the digital shop floor to increase quality and efficiency of
manufacturing operations
Use data analytics to further improve the in-service performance and accelerate
the feedback loop to our operations
Strengthen the link between our supply chain and our industrial system
17
Innovation
Strategy Pillars Progress & Achievements
Digitalisation
A^3 and Airbus Ventures headquartered in Silicon Valley
A330 Completion and Delivery Centre in Tianjin, China

AIRBUS STRATEGY UPDATE (2/2)
Nacelle Insourcing : strategic decision for competitiveness as well as to
improve aircraft performance & efficiency and bring added value to customers
Services : powered by Digital Revolution and Industry 4.0
18
Strategy Pillars Progress & Achievements
Value Chain
Portfolio reshaping
Largely completed the repositioning of our business in line with our strategy
Defence Electronics divestment to KKR closed in February 2017
In July 2017, we entered into exclusive negotiations with StandardAero regarding
the acquisition of Vector Aerospace
Motorola to buy Airbus DS communications business in the USA
Gemini
To simplify the governance and allow for faster decision making in the
future, as the company will be united under one brand
Implementation in progress
Profitability
Value Creation
Market Position
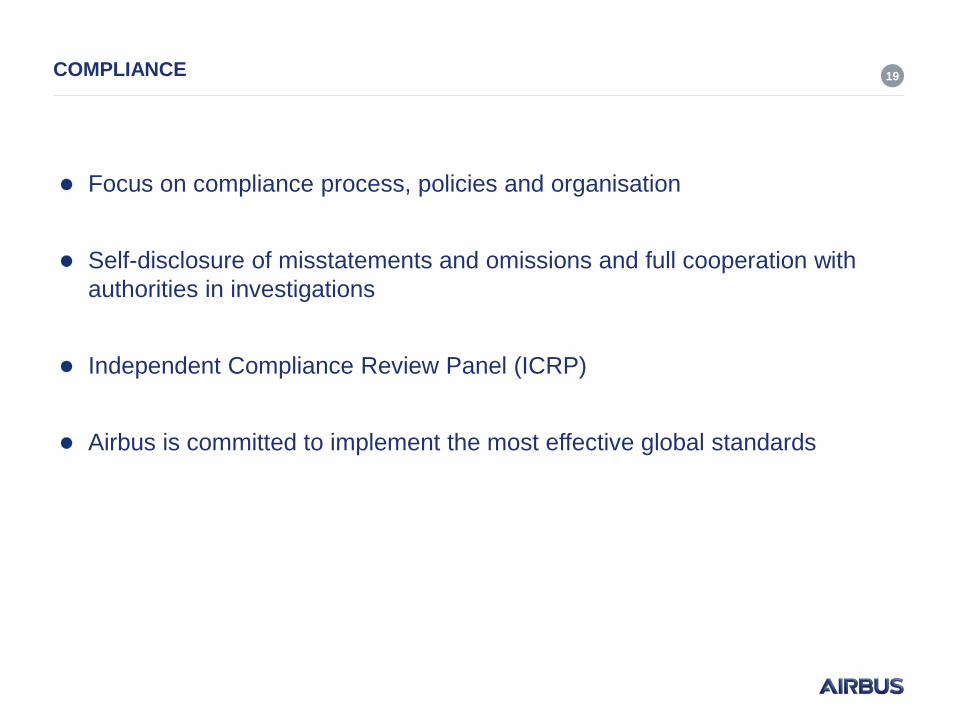
COMPLIANCE 19
Focus on compliance process, policies and organisation
Self-disclosure of misstatements and omissions and full cooperation with
authorities in investigations
Independent Compliance Review Panel (ICRP)
Airbus is committed to implement the most effective global standards

DRIVING EARNINGS AND CASH PERFORMANCE 20
Box sizes for illustration purpose only
Cash
Conversion
~1
FX
Hedging Impact
A320
Volume and Price
A350
Turning Profitable
Boost
Performance
End
2017
End of
decade
* A400M will continue to weigh significantly in 2017 & 2018 in particular
End of
decade
Working Capital
Control
Capex
Reduction
A400M*
EPS Growth
End
2017
EPS Growth FCF Growth
FCF Conversion of 1 including A400M by end of decade