aircraft interior failure pattern recognition utilizing text … publicados/2011...where people and...
TRANSCRIPT

J Intell Inf SystDOI 10.1007/s10844-011-0176-1
Aircraft interior failure pattern recognition utilizing textmining and neural networks
Rogério S. Rodrigues · Pedro Paulo Balestrassi ·Anderson P. Paiva · Alberto Garcia-Diaz ·Fabricio J. Pontes
Received: 11 November 2010 / Revised: 10 August 2011 / Accepted: 11 August 2011© Springer Science+Business Media, LLC 2011
Abstract Being more competitive is routine in the aeronautical sector. Airline com-petitiveness is affected by such factors as time, price, reliability, availability, safety,technology, quality, and information management. To remain competitive, airlinesmust promptly identify and correct failures found in their fleet. This study aims atreducing the time spent on identifying and correcting such failures logged. UtilizingText Mining techniques during the pre-processing phase, our study processes anextensive database of events from commercial regional jets. The result is a unique listof keywords that describes each reported failure. Later, an Artificial Neural Network(ANN) identifies and classifies failure patterns, yielding a respective disposition for
R. S. Rodrigues · P. P. Balestrassi (B) · A. P. PaivaFederal University of Itajuba, Itajuba, Brazile-mail: [email protected]
R. S. Rodriguese-mail: [email protected]
A. P. Paivae-mail: [email protected]
P. P. Balestrassi · A.Garcia-DiazUniversity of Tennessee at Knoxville,401 S Gallaher View Rd #223, Knoxville, TN 37919, USA
A.Garcia-Diaze-mail: [email protected]
F. J. PontesUniversidade Estadual Paulista (UNESP),Guaratinguetá, SP, Brazile-mail: [email protected]

J Intell Inf Syst
a given failure pattern. Approximately five years of historical data was used to buildand validate the present model. Results obtained were promising.
Keywords Artificial Neural Network (ANN) · Text mining · Failure pattern ·Aircraft log book · Repair
1 Introduction
The aeronautical market faced by airlines is established in a complex environmentwhere people and cargo move in considerable distances around the world. The fiercerivalry ends to settle this market in a scenario where the competitiveness rules. Somereasons can be pointed out as follows:
• Tighten and rigid schedules;• Pressure from clients that need air freight services;• Supply time (meals and potable water);• Maintenance tooling, including technical publications to support maintenance
practices;• Fuel price fluctuation due to speculation and seasonality;• Crew scheduling (pilots, flight attendants, mechanics, etc.).
In order to analyze this business environment and for better comprehension, theanalysis can be divided into different perspectives. Firstly, it can be mentionedthe aircraft manufacturers. For each new aircraft project commands considerableamount of technical and economical resources, the minimum details can contribute toa project’s success or failure. Such factors are mainly determined during the aircraftconception, but they play an important role for the airlines operation such as:
• Minimum differences during the tender phase for companies that supply aircraftparts can lead in the end to airlines to different maintenance costs (Wang et al.2008)
• Guaranteed reliability and dispatchability figures offered to the airlines thatcan later on impact directly on airlines performance (Bineid and Fielding 2003;Kurien et al. 1993);
• Availability of spare parts to support continued airworthiness, low turn-around-time to analyze and repair damaged parts, commitment, and other qualitativeor quantitative aspects that sometimes are subjective measured (Farrero et al.2002).
Also, the aircraft manufacturer has to rely on partners to divide technical andeconomic responsibilities, just to mention a few. It places the company that plays thepartner role in the aeronautical sector in a position which can evidently become evenmore hostile than of the aircraft manufacturer.
For this, it is not only necessary for partners to offer the most advantageousin order to award a supply contract, but it is also important to offer a goodaftermarket support, i.e., to provide a technical support exceeding the customer andaircraft manufacturer’s need, with a short timeframe compatible with the sector, thusachieving mutual interests either from airline or aircraft manufacturer perspective.

J Intell Inf Syst
Knotts (1999) mentions that behind the rigid necessities to comply with the tightitinerary and schedules of the aeronautical sector, an aircraft manufacturer must gobeyond the simple task of arranging the competent support. Besides the adversitieslike heavy air traffic, bad weather conditions, crew and passenger problems, andother unknown circumstances that the airlines have to face, it is also important thatthe aircraft performance in terms of equipment availability is decisive on determiningthe purchase of a new aircraft.
In order to have a flight optimized aircraft and airworthy, it is necessary toinvest a considerable amount of technical, economical, and logistic resources. Theseresources shall be allocated by aircraft operators on the best way possible, thusassuring the commitment management (Hansson et al. 2003). Finally, it is possibleto keep the aircraft safe and reliable to perform its main function, i.e. transportpassengers, crew, and cargo from one point to another, with comfort, safety, andon time.
Now when it is analyzed from the airlines perspective, the practice has shownthat the typical airline operational profile seeks a lean operation in terms of costs.To achieve this goal, there is not an absolute truth applicable to all the problems,such the proposed practices found on maintenance manuals, fault and isolationprocedures, and so on to have the desired success.
The aircraft operation involves some circumstances such as a considerable numberof people and distinct operation conditions. During the aircraft operation, a consider-able amount of information is generated. This information can range from differentdisciplines such as component removal records, log of cabin and system events, andother related flight system information. These data are compiled and then submittedback to the aircraft manufacturer, closing a circle of continuous improvement. Suchreports are subject to policies defined by local regulatory authorities of each country,but most of the times the agencies of different countries have a mutual effort tostandardize, thus minimizing the necessary time to study the data as well as assuringcompatibility and reduced cost. Thus, the aircraft manufacturer or the parts suppliercan rely on the field fault finding reported by the airlines, for instance to study andidentify trends within the available data.
Although a great effort is done to collect in-service aircraft data, an uncountablenumber of problems occur. Some problems can be mentioned such as to processand storage of the data (Fernandez et al. 2003), maintenance reports that wereincorrectly or improperly filled out due to lack of training of the responsible me-chanics, typographical errors, inadequate use of English language, parts erroneouslyclassified, and other problems that can potentially generate a wrong visibility tothe manufacturer to solve and attack the problems with less relevance as well asimpacting directly on the response time for reported problems. Moreover, this couldbe also associated to additional hidden costs that are normally unwarranted.
Besides that, the problem is crescent of unstructured manners of storing informa-tion among the organizations. Some studies indicate that from 80% to 98% of allelectronic data available in the organizations consist of unstructured data, i.e. datathat is not available to be easily recovered by means of first hand methods (Wanget al. 2008). In order for the data to be used and manipulated precisely by a computer,they have to be converted into a structured form.
The aircraft systems behavior can be studied in terms of Reliability, Availability,and Maintainability (RAM). Some modeling attempts are mentioned, such as relia-bility and availability of an aircraft training facility, study of factors direct related to

J Intell Inf Syst
repair such as machinery type, number of machines, age, arrangement of machines,operating conditions, skill level of operating personnel who is in charge of repairthe parts, working habits, inter-personnel relationships, absenteeism, environmentalconditions, and others. Due to the considerable number of variables, it would becomplex to analyze the relationship and interaction of each other in the final impacton RAM (Sekhon et al. 2006).
Sarac (2000) also relates that besides the maintenance operations segment, air-lines operations can be based on three other disciplines (Flight Schedule Planning,Fleet Assignment, and Revenue Management). But inside this fertile field, eachmanufacturer wants to offer to the final customers the best advantage packages asa way to boost aircraft sales, i.e. the airlines will decide to buy aircraft from themanufacturer that will provide the best support ever in the aftermarket. Among theendless advantages that can be offered, one that can be mentioned is that promptreaction is needed when the failure occurs, to achieve best maintainability practices.
This is closely linked to the business survival. Madu (2000) reinforces the impor-tance of survival of any business enterprise or organization depends on its abilityto compete effectively and the necessity of organizations must continuously updatethemselves in a variety of product and service components that are important tocustomers and stakeholders.
Finally, this paper presents an analysis of a small portion of this scenario, limitingto the research of failure reports generated during the regular operation of com-mercial regional aircraft whose parts (from passenger cabin) presented abnormalsymptoms and conditions.
2 Background
As per the regulatory authorities, all airlines shall keep records of the events and therelated parts for safety reasons. Once an event is reported, an event record must bestudied to prevent future failures. These records are returned to the aircraft manu-facturer and also to the authority. Each one of them has different responsibilities.The authority may have the concern analyzing the reported events in order to helpdetect in advance performance and trends. In the United States, the Federal AviationAdministration (FAA) together with other regulatory agencies in the world such asthe European Aviation Safety Agency (EASA), Brazilian National Civil AviationAgency (ANAC), and others instruct that the basic records that should be availableare modification status, discrepancies and dispositions, repair listing or identifyingthe parts used in the repair, maintenance practices used, information about life-limited parts, etc.
The aircraft manufacturer has interest of provide solutions to improve perfor-mance, safety, and product robustness. Normally after an event has been detectedand the cause (part) has been identified, if possible the operators will try first to makethe repair in-house. In the cases that the operators are not able to repair the part in-house, the operators have to identify the vendor where the part came from, eitherreferring to the information available in the maintenance manuals or contacting theaircraft manufacturer who will give the proper guidance on how to proceed withthe part subjected to analysis. Sometimes it is under discussion to decide if theoperator can claim some compensation due to warranty. Dealing with aircraft parts,
J Intell Inf Syst
they can be either evaluated using the accumulated flight hours or a predeterminedtimeframe, whichever occurs first. This two-dimensional metric, which was not usualin the past, has been used more often in the recent present, as explained by Chen andPopova (2002).
One of the main consequences that can be enumerated about the reported eventsin an aircraft is the direct impact on the regular operation, which is measured by theincrease of irregularity. Technical delays occur when malfunctioning of equipmentand related checking and required corrective action causes the aircraft’s departure tobe delayed by more than a specified time after the scheduled departure time. Delaysare deemed to have occurred if an originating flight departs later than the scheduleddeparture time, a turn round flight remains on the ground longer than the allowableground time or if the aircraft is released late from maintenance. Lastly a cancellationoccurs if a flight is canceled after being delayed for a longer than expected period oftime or due to lack of flight critical and maintainability support.
Although the progress is detected in the sector, there is still space to reducerecurrent costs due to delay. Studies from different authors and agencies show innumbers the impact of delays:
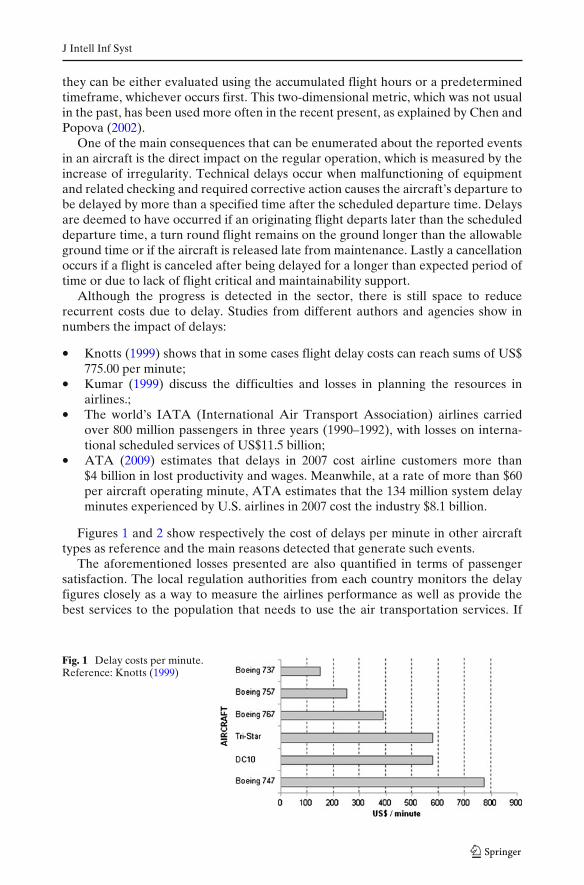
• Knotts (1999) shows that in some cases flight delay costs can reach sums of US$775.00 per minute;
• Kumar (1999) discuss the difficulties and losses in planning the resources inairlines.;
• The world’s IATA (International Air Transport Association) airlines carriedover 800 million passengers in three years (1990–1992), with losses on interna-tional scheduled services of US$11.5 billion;
• ATA (2009) estimates that delays in 2007 cost airline customers more than$4 billion in lost productivity and wages. Meanwhile, at a rate of more than $60per aircraft operating minute, ATA estimates that the 134 million system delayminutes experienced by U.S. airlines in 2007 cost the industry $8.1 billion.
Figures 1 and 2 show respectively the cost of delays per minute in other aircrafttypes as reference and the main reasons detected that generate such events.
The aforementioned losses presented are also quantified in terms of passengersatisfaction. The local regulation authorities from each country monitors the delayfigures closely as a way to measure the airlines performance as well as provide thebest services to the population that needs to use the air transportation services. If
Fig. 1 Delay costs per minute.Reference: Knotts (1999)

J Intell Inf Syst
Fig. 2 Delay causes. Reference: Knotts (1999)
the services provided by airlines starts to have a dramatic declination in the figures,consequently it affects the direct satisfaction of the users.
In the United States, where it is based the major market of regional aviation inthe world, the BTS (Bureau of Transportation) is responsible to collect and study thenumbers of flight departures and flight classified as delayed . It is considered in theU.S. as being the reference for delay situation when a flight departs or arrives morethan 15 min behind the scheduled departure/arrival time. They are also quantified byindicators of schedule reliability (SR) and completion rate (CR). These indicatorsare based on the quantity of delays and interruptions reported by the airline tothe aircraft manufacturer. Depending on how it was settled amongst the contractedparties, there are normally penalties if the aircraft performance is not to the agreedvalues in regards of dispatchability.
The reference is very aggressive when compared to other countries such as Brazil,where it is part of ANAC (National Civil Aviation Agency) to regulate the numbersand parameters for flights that can be classified in delay situations. In Brazil, the
Fig. 3 Delay figures. Reference: BTS (2009) and ANAC (2009)

J Intell Inf Syst
reference has been changed in the past years as a way to improve the services. Before2008, it was considered an approximate reference value of 60 min, then after Aprilof 2008 it decreased from 60 to 45 min, and lastly after May of 2008 and onwardsthe reference is considered as 30 min. To emphasize the importance of spreadingthe knowledge on solving problems, Knotts (1999) mentions that airlines have a fullunderstanding and great concern of these constraints. When it is not achieved, anundesirable situation of delay is in effect. Figure 3 shows the flight delay percentagesfor the U.S. and Brazil.
It is interesting to observe that even with different numbers adopted in thecountries, the shape of both curves have some similarity. Such similarities can berelated to high demand seasons such as holidays and summer, followed by off-peakseasons. To the airlines analysis, the point does not matter as they have always to bevigilant and to study the failure events and the correlation with the degradation ofthe on time operation.
3 Methodology and literature review
Luxhøj (1999) says that from the perspective of the authorities, aircraft manufac-turers, and operators, a good database system has to show—in a convenient timebasis—the trends about the failures reported in the field. The roadmap adopted asthe methodology to be used in this paper can be summarized by the following steps:
(a) Collection of raw field data;(b) Populating and pre-processing of raw data utilizing text mining;(c) Failure pattern recognition utilizing artificial neural networks;(d) Prediction of future dispositions based on historical data.
The main concepts of text mining and neural networks are described next.
3.1 Text mining
Unstructured text is very common, and in fact may represent the majority ofinformation available to a particular research or data mining project. Wang et al.(2008) discusses the available information in the corporations, where it is normallystored as unstructured text. This unstructured information can be usefully exploitedto, for example, identify common clusters of problems and complaints on certainparts, etc.
Prior to the data being introduced into the adaptive system, it was necessaryto mine the meaningful data from all the collected reports (Prado and Ferneda2008). Tan (2008) mentions that with the advent of digital content, databases andarchives have received more attention in information retrieval and natural languagein the data processing community. Various machine learning processes have beenintroduced to deal with text classification, such as Centroid Classifier, K-NearestNeighbor (KNN), Naïve Bayes, Decision Trees, Text classification in InformationRetrieval using Winnow, Perceptron, Neural Network. Leitner and Valencia (2008)proposes the combination of human expertise and automatic text-mining systemsto gather information from electronically annotated information. There are alsotechniques to process the natural language, called natural language processing (NLP)

J Intell Inf Syst
discussed by Wang et al. (2008), that have been used successfully to automaticallyextract useful information from unstructured text using the detailed content analysison a descriptive text which is what can be used in the present work.
Text mining techniques utilize a combination of one or more state-of-the-artapproaches such as mathematics, statistics, natural language processing, and machinelearning. For example, Latent Semantic Indexing (LSI) is a mathematic techniquethat is used in text mining to reduce the dimensionality of text documents (Dumais2004). Part-of-speech tagging is a natural language processing method that assignsfunctional labels such as noun, verb, proposition, etc. to words in sentence (Brants2000). Probability and word frequency are statistical approaches that are commonlyused in computing numerical values of terms and in selecting terms. Bayes decisiontrees (Andrea and Franco 2011) and support vector machines (Song and Chen2009) are inductive machine learning techniques widely used in text classification.Genetic algorithm (Shamsinejadbabki and Saraee 2011) and unsupervised techniquefor extracting non-taxonomical relations from domain texts (Punuru and Chen 2011)have also been used.
Text mining has been successfully employed in areas such as Biomedical andLife Sciences, Computer Science, Humanities, Social Sciences and Law, Physicsand Astronomy, Business and Economics, etc. There are many interesting fields ofresearch such as detection of similarities between patent documents and scientificpublications (Magerman et al. 2010); examining mobile learning trends (Hung andZhang 2011); discovering a multi-functional metal-binding glycoprotein that exhibitsmany biological functions of interest to many researchers from the fields of clinicalmedicine, dentistry, pharmacology, veterinary medicine, nutrition and milk science(Shimazaki and Kushida 2010); identifying fall-related injuries in electronic medicalrecord (Tremblay et al. 2009); mining business policy texts for discovering processmodels (Li et al. 2010); discovering knowledge by opinion mining from noisy textdata (Dey and Haque 2009); tracking what people are saying, finding influencers,and using many social network analytic tools to analyze the underlying social net-works embedded within the blogosphere (Macskassy 2011) and (Huang et al. 2011)and with emails via clustering and pattern discovery (Manco et al. 2008); identifyingthe anomaly cases for knowledge discovery from the warranty and service data in theautomotive domain (Rajpathak et al. 2011); discovering frequent musical patterns(motifs) that is a relevant problem in musicology (Jiménez et al. 2011). In Biology,text mining has new challenges as can be seen in Dai et al. (2010); a good example oftext mining on language recognition can be seen in Al-Jumaily et al. (2011), whereArabic, the most widely spoken language in the Arab World is identified on the web.Surveys applications of data mining techniques to large text collections, and howthose techniques can be used to support the management of science and technologyresearch was importantly explored on Losiewicz et al. (2000).
Related to the present research, Batyrshin and Sheremetov (2008) mention thatextracting meaningful data from databases can be useful for management anddecision purposes. The development of text mining techniques to extract informationfrom a time series database can contribute on this case. As it is emphasized by theauthor, the text mining techniques have shown good results to the data owner. Themain target is to find among the data the non-suspected relationship in the observedevents and then to summarize and categorize effectively and understandably theperformed mining. There are several traditional techniques for analysis and data

J Intell Inf Syst
mining, such as segmentation, clustering, classification, indexation, summarization,anomaly detection, notifying discovery, forecasting, and discovery of associationrules. Each one has its own particularities and it is suitable towards determiningthe kind of problem. These tasks can be also mutually related, for instance, thesegmentation task can be used for indexing, clustering, summarization, etc. Oncethe system complexity increases, the sense of making the right and concise decisiondecreases and up to the moment where the problem is perceptible. The same isapplicable to databases where the relevant data are immersed into a memo text field,where it is hard to rely only on the simple human perception to identify possibleinherent problems, unless they have reached the necessary significance.
Manning and Schütze (2002) and Bishop (1995) discuss about text mining tech-niques, where all words found in the input documents and simply count them inorder to compute a table of documents and words, i.e., a matrix of frequencies thatenumerates the number of times that each word occurs in each document. This basicprocess is, of course, further refined to exclude certain common words such as “the”and “a” (stop word lists) and to combine different grammatical forms of the samewords such as “traveling,” “traveled,” “travel,” etc. (stemming). Similar words canbe grouped into clusters, like synonyms. However, once a table of (unique) words(descriptors) by documents has been derived, all standard statistical and data miningtechniques can be applied to derive dimensions or clusters of words or documents, orto identify “important” words or terms that best predict another outcome variable ofinterest.
Once the input documents have been indexed and the initial word frequen-cies (by document) are computed, a number of additional transformations can beperformed to summarize and aggregate the information that was extracted. Manyunsupervised feature selection methods have been reported in the literature. Themost popular ones are Document Frequency (DF), Log-Frequencies (LF), andInverse Document Frequency (IDF). Some others are Term Contribution (TC),Term Variance (TV), Information Gain (IG), Mutual Information (MI), χ2, Rel-ative Document Frequency (RDF), Relative Information Gain (RIG), RelativeMutual Information (RMI) (Prabowo and Thelwall 2006; Yang et al. 2002; Yangand Pedersen 1997) and Neighboring co-occurrence (Huang et al. 2011). All thementioned methods work in three major steps: (1) Define a formula for measuringthe discriminative power of a term. (2) Sort the terms based on the value ofdefined measurement and (3) Choose a number of the terms from top of the list(Shamsinejadbabki and Saraee 2011).
In this work, after considering many simulations tests, the chosen transformationswere:
(a) Log-frequencies:First, various transformations of the frequency counts can be performed. Theraw word or term frequencies generally reflect on how salient or important aword is in each document. Specifically, words that occur with greater frequencyin a document are better descriptors of the contents of that document. However,it is not reasonable to assume that the word counts themselves are proportionalto their importance as descriptors of the documents. For example, if a wordoccurs one time in document A, but three times in document B, then it is notnecessarily reasonable to conclude that this word is three times as important

J Intell Inf Syst
a descriptor of document B as compared to document A. Thus, a commontransformation of the raw word frequency (wf ) is to compute:
f (w f ) = 1 + log (w f ) for w f > 0
This transformation has a “dampen” effect on the raw frequencies and how theyaffect the results of subsequent computations. There are other transformationslike binary frequencies, where the final matrix has 1 s when the word is foundand 0 s to indicate the absence of respective words.
(b) Inverse document frequencies:Another issue that you may want to consider more carefully and reflect in theindices used in further analyses is the relative document frequencies (df ) ofdifferent words. For example, a term such as “passenger” may occur frequentlyin all documents, while another term such as “bulkhead” may only occur ina few. The reason is that one might make “passenger” in various contexts,regardless of the specific topic, while “bulkhead” is a more semantically focusedterm that is only likely to occur in documents that deal with aircraft cabinpartitions. A common and very useful transformation that reflects both thespecificity of words (document frequencies) as well as the overall frequenciesof their occurrences (word frequencies) is the so-called inverse documentfrequency (for the i’th word and j’th document):
idf (i, j) ={
0 if w fij = 0(1 + log
(w fij
))log N
dfiif w fij = 1
Since the database is comprised of a set of quantitative and qualitative input andoutput variables, it is interesting to first extract meaningful data from descriptivefields before applying other tools. Normally a typical database has among theinput variables some descriptive fields where important information is stored in anunstructured way. Here the text mining techniques can be useful to reveal hiddenpattern points within the descriptive text that could not be possible at a glance for aregular reader.
Tan (2008) shows the concept of vector space model (VSM), where each documentis presented as a vector. In this model each document d is considered to be avector in the term-space. Then, each document D is punctuated similar as citedin Chiang et al. (2008), where the documents D can be converted to a vectorrepresentation as a function d = (( f1, w1) , ( f2, w2) , · · · , ( fn, wn)), where each fi
represents a document word and wi represents its frequency (weight). In the contextof this work, the document D can be understood by a reported event recorded withina given occurrence.
After the proper transformation is applied to a set of registers, it can be convertedto a table where each row represents an event registered and the columns representeach descriptor (keyword) that describes a given event. Figure 4 shows how thistransformation is after the text mining applied:
When text mining is implemented, it is possible to convert unstructured (textual)information, extract meaningful numeric indices from the text, and, thus, make theinformation contained in the text accessible to other learning algorithms such asArtificial Neural Networks (ANN).

J Intell Inf Syst
Fig. 4 Text mining
3.2 Artificial Neural Networks
ANNs, first used in the fields of cognitive science and engineering, are universal andhighly flexible function approximators. As cited by Tsay (2005) apud Balestrassi et al.(2009) ANNs are general and flexible tools for forecasting applications:
A popular topic in modern data analysis is ANN, which can be classified as asemiparametric method. As opposed to the model-based nonlinear methods,ANNs are data-driven approaches which can capture nonlinear data structureswithout prior assumption about the underlying relationship in a particularproblem.
An ANN, in a simple approximation to human beings, is an attempt of modelmathematically the behavior of a biological neural network. Balestrassi et al. (2009)summarizes in a brief manner how a human being brain is composed and how atypical human being neuron is, the response time, and how is the learning process.
An ANN is a computer program that can recognize patterns in a given collectionof data and produce a model for that data. It resembles the brain in respect of theknowledge is acquired by the network through a learning process (trial and error)and the interneuron connection strengths known as synaptic weights are used to storethe knowledge. The project of an ANN consists of three steps: training, validation,and test.
There are many types of ANN algorithm implemented in many research fields.In this kind of problem, it is common to use the Multilayer Perceptrons (MLP) as away to have this classification problem modeled. The MLP is the most common form

J Intell Inf Syst
Fig. 5 ANN withbackpropagation
of network. Figure 5 illustrates how an ANN using the backpropagation learningalgorithm works:
Basically, the training process comprises of presenting data to it. Then, it iscomputed an output, which is compared to desired output. Sekhon et al. (2006)comments the algorithm provides paired examples of input and output for trainingthe network. Finally, the network weights are modified to reduce error. To use thenetwork, it is necessary to present new data to it, and then the network will computean output based on its training. As much as cases are available, a better trainingwill be obtained. It is also relevant to resemble that the use of historical data doesnot mean that all the future cases can be assessed, so that relationships that heldin the past may no longer hold. Then, during the validation step, what is tested isthe generalization efficiency acquired during the training step. Lastly, the test step isused to do the performance test during the network utilization.
4 The dataset
Basically when an event is observed, it is mandatory that the flight crew registers theevent (problem) on the aircraft log book. Then the event is analyzed by the mechanicand an action is carried out, closing the loop. Sometimes the parties do not even knowthat such data is a valuable collection and an implied feedback from the field, how theproduct is performing, if the warranty time guaranteed values have been achieved,the lessons learned that would be used for further product development cycles, lastlyas varied applications.
It is mandatory that the operators keep the activities tracked, because inspectionand diagnostic activities are integral components of an effective maintenance strat-egy in an attempt to ensure aviation system safety, reliability, and availability.
Although the dataset requirements are clearly stated by the regulatory authorities,the operators may have different ways (different dataset architecture) to store thelog books. In Brazil, the National Civil Aviation Agency instructs the airlines asper RBHA (Brazilian Regulations for Aircraft Certification) number 91, subpart E(maintenance, preventive maintenance, modifications, and repairs), section 91.417;RBHA number 121, subpart T (flight operations), section 121.563, subpart V (regis-ter and reports) and section 121.705 (summary report for mechanic interruption). Inthe United States, the analog regulation is the FAR (Federal Aviation Regulation),

J Intell Inf Syst
also known as CFR (Code of Federal Regulation), with the same parameters. Theseparameters should have at minimum the following information:
1. Aircraft manufacturer, aircraft model, aircraft serial/tail number, engine orpropeller;
2. Aircraft registration;3. Airline name;4. Date when the failure or defect was identified;5. What flight phase the failure was identified;6. What failure or defect identified;7. Applicable ATA system chapter and subsystem;8. Total flight hours or flight cycles accumulated by the defective part;9. Part manufacturer, part number, part description, part serial number;
10. What actions or emergency precautions where performed;11. Other relevant information that can help to find the failure cause, malfunction
or defect, including time since last maintenance action, revision, repair orinspection;
According to ATA (2009), a unified database to track such failures can contributegreatly for reducing administrative time involved in the interchange and processingof provisioning data, procurement transactions, invoices, and consumption data. Inaddition, the benefits to be gained in utilizing standardization increased and in somecases they have been a prime consideration in the decision process of implementationof ATA iSpec 2000. The idea is to keep the data as simple as possible and at the sametime complying with the regulatory requirements. Figure 6 shows how it works:
As the uncountable control carries variables, a repair process can have asidefrom dates, an Air Transport Association (ATA) reference number (i.e. the ATA
Fig. 6 Reported failures structure

J Intell Inf Syst
assigns for aircraft parts a number reference, composed of three pair of digits. Thepairs stand for the chapter—system, section—subsystem, and subject—unit), nameof the operator who sent the part, aircraft data (register number and serial number),part accumulated flight hours or flight cycles (i.e. one cycle corresponds to theaction of take off and landing), in-and-out dates, analysis performed by an engineer(responsible to provide the dispositions that concern each discrepancy found in theanalyzed part), cost and warranty analysis (based on the aircraft serial or registernumber it is possible to track a part whether the repair can be covered underwarranty or not), etc.
Balestrassi et al. (2009) mentions that there exists difficulties on defining thefactors that control the process. Indeed, it is impractical or impossible to attemptto control more than, say, ten factors; many experiments deal with fewer than 5.The log book process studied in this paper seems to have many factors that canbe interesting when running an experiment at first time using as much factors asavailable, respecting time and cost restrictions. Again, the part factors do not gobeyond the typical data, as accumulated flight hours or flight cycles, the group thatthe part is installed in the aircraft, and the disposition adopted by the repair station.
5 The dataset analysis and results
The efforts to always improve the maintenance techniques have attracted the atten-tion of several research workers. Shankar and Sahani (2003) mentions that increaseon availability can be achieved using the maintenance techniques and preventivemaintenance programs. The implementation of new techniques can lead to increaseof availability and consequently reducing the downtime that generates delay andcancellation situations.
Following this practice, Luxhøj (1999) mentions the failure information followspatterns that are cyclic or repeated. The process behind the studied dataset here canbe modeled as a function of various input control variables, with the correspondentoutput variables. The considered noises are all the influences that contribute nega-tively to the process behavior.
Taking these premises as baseline, the text mining used in conjunction withartificial neural networks (ANN) as approximation models are promising whencompared to standard analytical techniques. This problem basically deals with manyvariables in the process when the flight crew reports an event, the necessary time toanalyze and solve the problem, and also the necessary resources to accomplish thetask and return the aircraft safely to its airworthiness condition.
5.1 Dataset pre-processing utilizing text mining
In this paper, the dataset under investigation contains data collected from airlinesfrom 2004 to 2008. The total of collected cases amounts to 15,760; which have beengrouped by aircraft operator, aircraft serial number, date, failure mode, time of delay,reported problem, and action reported. As previously mentioned, other inherentfactors to the data collected that does not appear in the table header, but must beconsidered are human errors and uncontrolled variables (noises) such as lack oftraining, forms erroneously filled out, and etc (Table 1).

J Intell Inf Syst
Table 1 Total of reportedevents per year
Year Reported events
2004 1942005 2,2582006 2,0112007 3,1562008 8,141Total 15,760
In the dataset, the variables eligible for text mining techniques are the reportedproblem and the reported action. To start the text mining, some premises were used,such as the minimum and maximum size of a relevant word, minimum size of indexedword, minimum number of vowels, maximum number of consecutive consonants,maximum number of consecutive vowels, maximum number of consecutive identicalcharacters, maximum number of consecutive punctuations, and minimum and maxi-mum percentage of cases where a word appears. Table 2 shows the parameters:
Besides these initial parameters to be used on the dataset text mining, other filterscan also be applied such as valid characters used to begin, to write, and to end a word.
For this analysis, initially, elimination of all words that do not pertain to Englishlanguage, so it can be possible to eliminate from the valid characters list all LatinCharacters, for instance the character cedilla like with it was necessary to performstemming in Portuguese language (Orengo and Huyck 2001). Proceeding in thisdirection filters all the words containing a cedilla so it will not be considered foreffects of text mining indexing purposes. Excluding, for instance, numbers to begina word will help to eliminate parameters not relevant such as a seat location (e.g.“Seat 12D”). For indexing purposes it is much more intriguing to know that there isa problem with the category seat instead of a punctual problem located in a particularseat. The stop words and synonyms list complement the filtering capabilities of textmining. Table 3 shows the parameters chosen for the valid characters:
Due to the fact that the dataset presents various particular terms from aircraft,it was constructed a specific dictionary table to translate them into complete words.Such dictionary table comprehends some acronyms, synonyms, common misspelled
Table 2 Filter parameters fortext mining
Condition Valid numberof characters
Minimum size of word 3Maximum size of word 25Minimum number of word vowels 1Minimum size of word 3Maximum number of s 5Maximum number of consecutive vowels 4Maximum number of consecutive same 2
charactersMaximum number of consecutive punctuations 1Minimum % of cases word occurrence 3%Maximum % of cases word occurrence 100%

J Intell Inf Syst
Table 3 Valid characters forwords
Position in the word Valid characters
Characters for words –abcdefghijklmnopqrstuvwxyzCharacters to begin words abcdefghijklmnopqrstuvwxyzCharacters to end words abcdefghijklmnopqrstuvwxyz
forms, and others, so that the text mining module will count even the misspelledforms as correct forms in the final count. Table 4 shows these customized forms:
The result of text mining is presented as a vector representation of problemdescription and reported action, for each given event. Even though the matrix showsa different number of descriptors, the final matrix takes all the necessary descriptorsto describe the whole dataset. Thus, for a determined event where one descriptor isnot applied, its count is equal to zero. This is to ensure that the final matrix fromtext mining has the dimension mxn, where mmeans the number of analyzed eventsand n the number of used descriptors. Table 5 shows some of the descriptors, rawfrequency, number of documents, and stemmed form just after text mining:
The original dataset has 15,760 as mentioned in Table 1. With the text miningresults, it was found the total of 88 word descriptors, which can represent approx-imately 99.24% of the dataset, i.e. 15,640 failure events (these events had at leastone descriptor different than zero). The analysis could be redone, but due to theorigin of the dataset it was considered sufficient and the discarded part is negligible.The analysis took approximately 3 min using a Pentium® Centrino Duo 1.6 GHzcomputer processor complimented with 2 GB of Random Access Memory (Table 6).
Finally, Table 7 shows the final result, where each row is a vector representationof words frequency for each case after the step of text mining. Among the trans-formations available to represent the occurrences (raw frequency, binary frequency,
Table 4 List of synonyms
Descriptor Synonyms Descriptor Synonyms
Adjust Readjusted, repositionned, repositioned Lach LatchAircraft Acft, airplane Light Lt, lamp, lights, ligh,
ligt, liteAttach Resecure, secure, remove, re-secure, Maker Makr
re-secured, secuAttendant Attd Message MsgBattery Batt, elpu Operational OpBend Bent Overhead OvhdCart Trolley Passenger PaxCategory Cat Power Pwrd, pwerChange Chqd Recline Recl, reqd, requCheck Ck, chk, ckd Seam SeanClear Clean, clear Seat SaetCoffee Coff Service Srvc, svcd, svcsEmergency Emer Serviceable SvcFixed Mel, reworked Stay TayFlush Flus Tank TanlForward Fwd, fwrd Valve ValvHinge Hing Waste Wast, wateHose Tube, tubo

J Intell Inf Syst
Table 5 Analyzed documents
Document Size Number Descriptorsof words
1 6 6 Galley drain clog clear galley drain2 13 13 Cabin hardwar btw seat shear found hardwar instal repair
armrest function normal releas3 10 10 Passeng door ceil shatter bulb clear glass cabin ceil place4 6 6 Lach place attach screw handl door5 55 4 Service spill clear spill6 95 9 Lavatori door broken lock mechan lubric lock mechan check7 68 8 Pilot copilot life preserv miss replac life preserv8 68 8 Seat belt miss replac seat belt power aircraft9 27 4 Clog water pipe repair10 112 7 Passeng plug lavatori lavatori repair lavatori equip11 78 5 Broken tray reconnect tray check12 79 7 Manual releas miss replac miss jump seat13 63 5 Galley lavatori sink drain clog14 92 9 Attach lach galley upper miss place attach lach requir15 70 3 Captain request place16 116 8 Player volum inaud servic repair check player attach17 106 7 Water system confus discuss captain discuss water18 115 9 Water replac water wast system control drain replac hennessi19 97 9 Tray broken attach tray onboard problem lavatori smoke detector... ... ... ...... ... ... ...... ... ... ...15751 54 4 Seat doesnt upright adjust15752 55 3 Seat mechan adjust15753 37 2 Seat repair15754 70 3 Seat cabl reattach15755 50 3 Seat cabl refit15756 58 4 Seat without button adjust15757 73 5 Seat fulli upright posit adjust15758 48 6 Passeng seat cover cabin servic advis15759 52 3 Seat adjust check15760 54 5 Seat upright posit seat adjust
log frequency, and inverse document frequency) the inverse document frequencyis the adequate to eliminate indexing problems for common words that do notnecessarily are representative of the dataset. Such matrix will be later on pairedwith the remaining variables, such as ATA chapter, failure codes, etc. For the otherindependent variables, it is not necessary to do text mining, since they are alreadyeither pre-classified or have been assigned numeric values.
5.2 Dataset failure pattern recognition utilizing ANN
In the previous topic, it explained how the dataset was pre-processed utilizing textmining. From the raw dataset collected, the variables reported problem and reportedaction, initially stored as non-structured text, were converted to frequencies, and

J Intell Inf Syst
Tab
le6
Des
crip
tors
,fre
quen
cy,n
umbe
rof
docu
men
ts,a
ndst
emm
edfo
rm
Des
crip
tor
Fre
quen
cyN
umbe
rSt
emm
edD
escr
ipto
rF
requ
ency
Num
ber
Stem
med
ofdo
cum
ents
form
ofdo
cum
ents
form
Act
uat
158
150
Act
uat
Han
dset
66
Han
dset
Ada
pt5
3A
dapt
Hea
t11
694
Hea
tA
djus
t32
8528
86A
djus
tH
ydro
lock
312
295
Hyd
rolo
ckA
rmre
st59
035
3A
rmre
stIn
sula
tion
54
Insu
lA
shtr
ay1
1A
shtr
ayIn
terp
hone
3023
Inte
rpho
nA
ttac
h25
1323
26A
ttac
hK
nob
4127
Kno
bA
tten
d10
3180
5A
tten
dL
ach
1382
928
Lac
hB
ackl
ight
33
Bac
klig
htL
avat
ory
4095
2601
Lav
ator
iB
alla
st68
62B
alla
stL
eak
507
383
Lea
kB
elt
488
326
Bel
tM
ask
198
133
Mas
kB
lank
et1
1B
lank
etM
ast
9879
Mas
tB
roke
n18
9218
23B
roke
nM
egap
hon
6848
Meg
apho
nB
umpe
r11
9B
umpe
rM
elte
d17
17M
elt
But
ton
596
510
But
ton
Mis
sing
937
859
Mis
sC
abl
891
812
Cab
lM
otor
77
Mot
orC
artr
idge
55
Car
trid
gM
ount
5843
Mou
ntC
ushi
on12
599
Cus
hion
Oxy
gen
124
94O
xyge
nD
imm
er2
2D
imm
erP
asse
nger
929
826
Pas
seng
Dis
char
ge3
2D
isch
arg
Pas
seng
erse
at61
56P
asse
nger
seat
......
......
......
......
Doo
r13
5094
2D
oor
Pos
it69
967
1P
osit
Dra
in74
450
0D
rain
Rel
amp
1060
1048
Rel
amp
Ele
ctr
2424
Ele
ctr
Rep
lac
2751
2644
Rep
lac
Em
erge
ncy
light
4736
Em
erge
ncy
light
Req
uir
811
804
Req
uir
Esc
utch
eon
2929
Esc
utch
eon
Res
et66
663
9R
eset
Ext
ingu
ish
6356
Ext
ingu
ish
Seat
8192
5277
Seat
Fau
cet
325
217
Fau
cet
Sens
or34
630
4Se
nsor
Fir
ex61
39F
irex
Serv
ic24
2521
32Se
rvic
Fla
shlig
ht11
765
Fla
shlig
htSi
nk70
248
9Si
nkF
light
atte
ndan
t54
445
7F
light
atte
ndan
tSy
stem
857
709
Syst
emF
lush
979
796
Flu
shT
ight
en15
615
3T
ight
enF
roze
n11
9410
49F
roze
nT
ray
3215
1962
Tra
yG
alle
y17
6814
47G
alle
yU
prig
ht66
965
3U
prig
htH
alog
en2
1H
alog
enW
ast
823
666
Was
tH
alon
96
Hal
onW
ater
2803
1645
Wat
er

J Intell Inf Syst
Table 7 Matrix with words frequency
Actuat Adapt Adjust Armrest Seat Servic System Tighten Wast Water
1 0.000 ... 0.000 0.000 0.000 ... 0.000 0.000 ... 0.000 0.000 ... 0.000 0.0002 0.000 ... 0.000 0.000 3.799 ... 1.094 0.000 ... 0.000 0.000 ... 0.000 0.0003 0.000 ... 0.000 0.000 0.000 ... 0.000 0.000 ... 0.000 0.000 ... 0.000 0.0004 0.000 ... 0.000 0.000 0.000 ... 0.000 0.000 ... 0.000 0.000 ... 0.000 0.0005 0.000 ... 0.000 0.000 0.000 ... 0.000 2.000 ... 0.000 0.000 ... 0.000 0.0006 0.000 ... 0.000 0.000 0.000 ... 0.000 0.000 ... 0.000 0.000 ... 0.000 0.0007 0.000 ... 0.000 0.000 0.000 ... 0.000 0.000 ... 0.000 0.000 ... 0.000 0.0008 0.000 ... 0.000 0.000 0.000 ... 1.853 0.000 ... 0.000 0.000 ... 0.000 0.0009 0.000 ... 0.000 0.000 0.000 ... 0.000 0.000 ... 0.000 0.000 ... 0.000 2.26010 0.000 ... 0.000 0.000 0.000 ... 0.000 0.000 ... 0.000 0.000 ... 0.000 0.000... ... ... ... ... ... ... ... ... ... ... ... ... ... ...15750 0.000 ... 0.000 1.698 0.000 ... 1.094 0.000 ... 0.000 0.000 ... 0.000 0.00015751 0.000 ... 0.000 1.698 0.000 ... 1.094 0.000 ... 0.000 0.000 ... 0.000 0.00015752 0.000 ... 0.000 0.000 0.000 ... 1.094 0.000 ... 0.000 0.000 ... 0.000 0.00015753 0.000 ... 0.000 0.000 0.000 ... 1.094 0.000 ... 0.000 0.000 ... 0.000 0.00015754 0.000 ... 0.000 0.000 0.000 ... 1.094 0.000 ... 0.000 0.000 ... 0.000 0.00015755 0.000 ... 0.000 1.698 0.000 ... 1.094 0.000 ... 0.000 0.000 ... 0.000 0.00015756 0.000 ... 0.000 1.698 0.000 ... 1.094 0.000 ... 0.000 0.000 ... 0.000 0.00015757 0.000 ... 0.000 0.000 0.000 ... 1.094 2.000 ... 0.000 0.000 ... 0.000 0.00015758 0.000 ... 0.000 1.698 0.000 ... 1.094 0.000 ... 0.000 0.000 ... 0.000 0.00015759 0.000 ... 0.000 1.698 0.000 ... 1.853 0.000 ... 0.000 0.000 ... 0.000 0.00015760 0.000 ... 0.000 0.000 0.000 ... 0.000 0.000 ... 0.000 0.000 ... 0.000 0.000
finally paired with the remaining variables. Table 8 then summarizes the new datasetstructure to be presented to the ANNs:
To start the neural failure pattern recognition, some pre and post processing,selection, and variable coding were done, like transformation of nominal variablesto numbers, and normalization. Besides these precautions, putting focus on a specifictype of ANN, choose the learning rate (for example small learning rates give slowlearning speed and low error rates, whereas big learning rates give the opposite),number of neurons in the hidden layer, training stop criteria, data subsets (to beused for training, validation, and test), and number of epochs used for training.
Table 8 Dataset structure after text mining
Description
Input variables1–2 Year and month for a given register3–90 Problem/action reported (one column per descriptor)91 ATA system chapter92 ATA sub-chapter
Output variables93 Interruption (yes/no)94 Interruption type:
• (Delay)• (Cancellation)• (Return from runway)
95 Failure concordance96 Assigned failure category

J Intell Inf Syst
The majority of variables are categorical ones, i.e. they are represented bydifferent states like yes/no, hot/cold, etc. For this dataset, some variables have morethan two states. In this case, a special coding procedure was adopted. For example,the variable interruption type has three states: delay, cancellation, and return fromrunway. So three columns were created for each state and the variables were codedas delay (1-0-0); cancellation (0-1-0); return from runway (0-0-1). This precaution,for input and output variables, makes the neural network learning more effective.Moreover, it was considered the cases where the failure was not found, which
Table 9 Input and outputvariables
Description
Input variables1–88 Descriptors originated from pre-
processingphase utilizing text mining(variables: problem reported/action reported)
89–92 Aircraft model/type (A, B, C e D)93–97 ATA system chapter98–119 ATA sub-chapter
Output variables120 Interruption? (yes/no)121 Interruption = delay122 Interruption = cancellation123 Interruption = return from
runway124 Failure concordance
Description—assigned failurecategory
125 CM01 Attachment problem126 CM02 Drain problem127 CM03 Electrical failure128 CM04 External induced failure129 CM05 Failure related to galley
equipment—e.g. galley insertsfailure
130 CM06 Heater problem131 CM07 Improper cleaning132 CM08 Improper handling133 CM09 Improper lubrication134 CM10 Improper maintenance135 CM11 Improver servicing136 CM12 Latch problems137 CM13 Lock problems138 CM14 Mechanical failure139 CM15 NFF (no fault found)140 CM16 Seat recline mechanism problem141 CM17 Routine check142 CM18 Seat belt problem143 CM19 Wearout144 CM20 Wrong troubleshooting

J Intell Inf Syst
represents a NFF (No Fault Found) situation, due to the relevance of this indicator(Söderholm 2005).
Therefore, after the coding and normalization, the dataset can be represented asshown on Table 9:
As per the Table 9, it can be shown that it was possible to condensate a consider-able dataset into a reasonable number of variables (119 input variables and 25 outputvariables).
As the modeling consists of classification of events, based on the problem andaction descriptions, it was chosen the MLP network type. This type of network isvery flexible to model this sort of problem.
Other important heuristic considerations were also considered to start the ANNmodeling (Haykin 1999), as listed below:
1. Update of backpropagation error rate in stochastic (sequential) or batch. Onemethod presents its advantages when compared to the other one. The batchupdate is better because it presents to the network the errors in the end, whenthe stochastic model presents the error in the end of each training epoch;
2. Maximize the information content: utilization of an example set to maximize thetraining error. For this modeling, it was used five years of historic data, and thenit was possible the dataset shuffle among epochs and also a great generalizationwith the neural network. It can be also mentioned that although a considerablenumber of cases is presented to the ANN, some of the used registers can besuffered misinterpretation from the person who recorded it, and consequentlyadd outliers to the model;
3. Normalization of input and outputs: each variable can be pre-processed so thatthe variables do not interfere during the modeling process of synaptic connectionweights. This rule was applied as shown on Table 9.
4. Training by means of tips: Tips can be considered as important examples that canbe used to enrich de dataset diversity;
5. Learning rate: ideally all the neurons should learn at the same learning rate. Butaccording to LeCun (1993) apud Haykin (1999) it is convenient to use low valuesfor learning rate in the last network layers, whereas the first layers should usehigh values. This happens because for a given neuron, the learning rate must beinversely proportional to the square root of synaptic connections for the referredneuron.
In relation to the frequencies found during the pre-processing phase (text mining),the normalization process was conducted as a way to facilitate the network training.A binary transformation was used, i.e. if the frequency is greater than zero therespective descriptor received “1”; otherwise it received “0”. Additionally, it wasused the classical proportion of 2:1:1 (50% of registers used for training, 25% usedfor test, and 25% used for validation).
In the beginning, the neural network has all the synaptic connection weights withrandom values (based on a normal distribution with the mean equal to zero andstandard deviation equal to one). Then, each register is presented to the neuralnetwork, where the inputs excite each neuron and the respective activation functions.
During the validation phase, the data from input variables are presented to obtaina response. The response is then obtained from the neural network is compared tothe “actual” response from the dataset. In case that the response obtained from the
J Intell Inf Syst
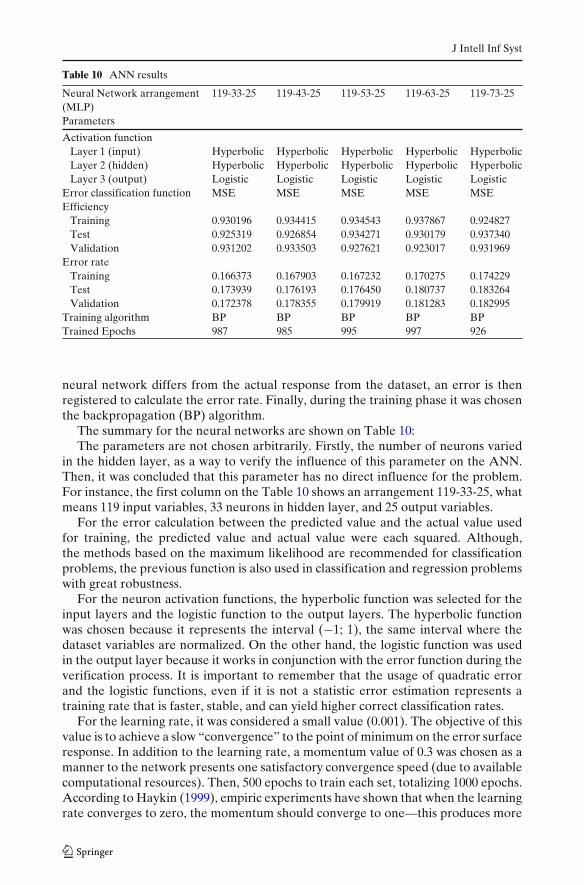
Table 10 ANN results
Neural Network arrangement 119-33-25 119-43-25 119-53-25 119-63-25 119-73-25(MLP)Parameters
Activation functionLayer 1 (input) Hyperbolic Hyperbolic Hyperbolic Hyperbolic HyperbolicLayer 2 (hidden) Hyperbolic Hyperbolic Hyperbolic Hyperbolic HyperbolicLayer 3 (output) Logistic Logistic Logistic Logistic Logistic
Error classification function MSE MSE MSE MSE MSEEfficiency
Training 0.930196 0.934415 0.934543 0.937867 0.924827Test 0.925319 0.926854 0.934271 0.930179 0.937340Validation 0.931202 0.933503 0.927621 0.923017 0.931969
Error rateTraining 0.166373 0.167903 0.167232 0.170275 0.174229Test 0.173939 0.176193 0.176450 0.180737 0.183264Validation 0.172378 0.178355 0.179919 0.181283 0.182995
Training algorithm BP BP BP BP BPTrained Epochs 987 985 995 997 926
neural network differs from the actual response from the dataset, an error is thenregistered to calculate the error rate. Finally, during the training phase it was chosenthe backpropagation (BP) algorithm.
The summary for the neural networks are shown on Table 10:The parameters are not chosen arbitrarily. Firstly, the number of neurons varied
in the hidden layer, as a way to verify the influence of this parameter on the ANN.Then, it was concluded that this parameter has no direct influence for the problem.For instance, the first column on the Table 10 shows an arrangement 119-33-25, whatmeans 119 input variables, 33 neurons in hidden layer, and 25 output variables.
For the error calculation between the predicted value and the actual value usedfor training, the predicted value and actual value were each squared. Although,the methods based on the maximum likelihood are recommended for classificationproblems, the previous function is also used in classification and regression problemswith great robustness.
For the neuron activation functions, the hyperbolic function was selected for theinput layers and the logistic function to the output layers. The hyperbolic functionwas chosen because it represents the interval (−1; 1), the same interval where thedataset variables are normalized. On the other hand, the logistic function was usedin the output layer because it works in conjunction with the error function during theverification process. It is important to remember that the usage of quadratic errorand the logistic functions, even if it is not a statistic error estimation represents atraining rate that is faster, stable, and can yield higher correct classification rates.
For the learning rate, it was considered a small value (0.001). The objective of thisvalue is to achieve a slow “convergence” to the point of minimum on the error surfaceresponse. In addition to the learning rate, a momentum value of 0.3 was chosen as amanner to the network presents one satisfactory convergence speed (due to availablecomputational resources). Then, 500 epochs to train each set, totalizing 1000 epochs.According to Haykin (1999), empiric experiments have shown that when the learningrate converges to zero, the momentum should converge to one—this produces more

J Intell Inf Syst
speed to the convergence. The opposite is done to the neural network finds thelearning stabilization. Different values can generate undesirable effects such as anoscillation on MSE during the training.
For the stop condition, it was chosen a rate of 0.05, this represents that the neuralnetwork stops the training when the error is less than this value. It is important toremember that the backpropagation algorithm for the stop criteria can be or cannotbe reached, so the error condition can also be verified through the training withindifferent epochs, i.e., when the error degradation indicates cases of over-f itting orover-learning. In the event that the desirable error rate is not achieved, the other stopcriterion is the number of epochs chosen. In practice, what is observed is a gradualdrop in the training error when it begins, followed by an error stabilization whenepochs increase.
The increase of neurons in the hidden layer neither increased nor decreased theerror rate. It remained constant. Therefore for this problem, the simplest networkarrangement can be used. Among the trained networks, the best efficiency per subsetand error rate resulted. Lastly, the validation figures show the ratio of cases correctlyclassified which is then divided by the number of total cases separated from theoriginal dataset for validation purposes. In other words, the cases that were not usedduring the training phase.
6 Conclusions
The present paper proposes a new approach to the failure pattern recognitionin a dataset (with registers of failure events reported and originated in aircraftfrom the commercial regional segment). The literature has other similar works toextract meaningful information with specialized systems, but most of them deal withquantitative data, what makes easier to model a neural network. Considering thepresent problem when text files are used, the proposed approach is very promising.
Conceptually the model has demonstrated reliable performance, yielding approx-imately 93% accuracy. This represents a step forward in this area, because in normalcircumstances such analysis is performed manually (hand calculated). This workcan be used in practical terms as a tool to help decision making process, but whenthe model is analyzed in terms of individual variables a considerable amount oferror rate is observed. This constraint should be considered in a future researchin furthering this technology solidifying its practicality and sustained benefits as arobust maintenance program for the aviation industry and the like. Currently, thetool can be used as an extra decision making tool to help airlines keep their fleets inoptimal operational conditions and airworthiness.
Acknowledgement The authors would like to thank CNPq and FAPEMIG for the support theygave this work.
References
Air Transport Association of America—ATA (2009). Spec2000: Chapter 11—Integrated DataProcessing Materials Management. Washington, DC, USA.

J Intell Inf Syst
Al-Jumaily, H., Martínez, P., Martínez-Fernández, J. L., & Van der Goot, E. (2011). A real timenamed entity recognition system for Arabic text mining. Language Resources and Evaluation,Published online first, 30 April 2011. doi:10.1007/s10579-011-9146-z.
ANAC—National Civil Aviation Agency (2009). Delay statistics in Brazil. http://www.anac.gov.br/.Accessed 01/10/2009.
Andrea, B., & Franco, T. (2011). Mining Bayesian networks out of ontologies. Journal of IntelligentInformation Systems. Published online first, 13 June 2011. doi:10.1007/s10844-011-0165-4.
Balestrassi, P. P., Popova, E., Paiva, A. P., & Marangon Lima, J. W. (2009). Design of experiments onneural network’s training for nonlinear time series forecasting. Neurocomputing, 72(4–6), 1160–1178.
Batyrshin, I. Z., & Sheremetov, L. B. (2008). Perception-based approach to time series data mining.Applied Soft Computing, 8, 1211–1221.
Bineid, M., & Fielding, J. P. (2003). Development of a civil aircraft dispatch reliability predictionmethodology. Aircraft Engineering and Aerospace Technology, 75, 588–594.
Bishop, C. M. (1995). Neural networks for pattern recognition (1a ed., Vol. 1, p. 477). New York:Oxford University Press.
Brants, T. (2000). TnT—a statistical part-of speech tagger. In: Proceedings of the Sixth AppliedNatural Language Processing conference (ANLP 2000) (pp. 224–231). Seattle, WA.
BTS—US Bureau of Transportation—Statistics about delays. http://www.bts.gov/. Accessed 1 Aug2009.
Chen, T., & Popova, E. (2002). Maintenance policies with two-dimensional warranty. ReliabilityEngineering and System Safety, 77, 61–69.
Chiang, D., Keh, H., Huang, H., & Chyr, D. (2008). The Chinese text categorization system withassociation rule and category priority. Expert Systems with Applications, 35, 102–110.
Dai, H. J., Chang, Y. C., Tsai, R. T. H., & Hsu, W. L. (2010). New challenges for biologicaltext-mining in the next decade. Journal of Computer Science and Technology, 25(1), 169–179.
Dey, L., & Haque, S. M. (2009). Opinion mining from noisy text data discovering knowledge.International Journal on Document Analysis and Recognition, 12(3), 205–226.
Dumais, S. (2004). Latent semantic analysis, ARIST. Review of Information Science and Technology,38(4).
Farrero, J. M. C., Tarrés, L. G., & Losilla, C. B. (2002). Optimization of replacement stocks usinga maintenance programme derived from reliability studies of production systems. IndustrialManagement and Data Systems, 102(4), 188–196.
Fernandez, O., Walmsley, R., & Petty, D. J. (2003). A decision support maintenance system—development and Implementation. International Journal of Quality and Reliability Management,20(8), 965–979.
Hansson, J., Backlund, F., & Lycke, L. (2003). Managing commitment: Increasing the odds for suc-cessful implementation of TQM, TPM or RCM. International Journal of Quality and ReliabilityManagement, 20(9), 993–1008.
Haykin, S. (1999). Neural networks—a comprehensive foundation (2nd ed., Vol. 1, p. 842). Ontario:Prentice Hall International.
Huang, J., Zhou, B., Wu, Q., Wang, X., & Jia, Y. (2011). Contextual correlation based threaddetection in short text message streams. Journal of Intelligent Information Systems. Publishedonline first, 24 May 2011. doi:10.1007/s10844-011-0162-7.
Hung, J. L., & Zhang, K. (2011). Examining mobile learning trends 2003–2008: A categoricalmeta-trend analysis using text mining techniques. Journal of Computing in Higher Education.Published online first, 10 March 2011. doi:10.1007/s12528-011-9044-9.
Jiménez, A., Molina-Solana, M., Berzal, F., & Fajardo, W. (2011). Mining transposed motifs in music.Journal of Intelligent Information Systems, 36(1), 99–115.
Knotts, R. M. H. (1999). Civil aircraft maintenance and support—fault diagnosis from a businessperspective. Journal of Quality in Maintenance Engineering, 5(4), 335–347.
Kumar, U. D. (1999). New trends in aircraft reliability and maintenance measures. Journal of Qualityin Maintenance Engineering, 5(4), 287–295.
Kurien, K. C., Sekhon, G. S., & Chawla, O. P. (1993). Analysis of aircraft reliability using MonteCarlo simulation. International Journal of Quality & Reliability Management, 10, 2.
LeCun, Y. (1993). Globally trained handwritten word recognizer using spatial representation, con-volutional neural networks, and hidden Markov Models. In: 6th Neural Information ProcessingSystems (NIPS) (pp. 937–944). Denver, Colorado, USA.

J Intell Inf Syst
Leitner, F., & Valencia, A. (2008). A text-mining perspective on the requirements for elec-tronically annotated abstracts. Federation of European Biochemical Societes Letters, 582,1178–1181.
Li, J., Wang, H. J., Zhang, Z., & Zhao, J. L. (2010). A policy-based process mining framework:Mining business policy texts for discovering process models. Information Systems and E-BusinessManagement, 8(2), 169–188.
Losiewicz, P., Oard, D. W., & Kostoff, R. N. (2000). Textual data mining to support science andtechnology management. Journal of Intelligent Information Systems, 15(2), 99–119.
Luxhøj, J. T. (1999). Trending of equipment inoperability for commercial aircraft. ReliabilityEngineering and System Safety, 64(3), 365–381.
Macskassy, S. A. (2011). Contextual linking behavior of bloggers: Leveraging text mining to enabletopic-based analysis. Social Network Analysis and Mining. Published online first, 25 May 2011.doi:10.1007/s13278-011-0026-8.
Madu, C. N. (2000). Competing through maintenance strategies. International Journal of Quality &Reliability Management, 17(9), 937–948.
Magerman, T., Looy, B. V., & Song, X. (2010). Exploring the feasibility and accuracy of latentsemantic analysis based text mining techniques to detect similarity between patent documentsand scientific publications. Scientometrics, 82(2), 289–306.
Manco, G., Masciari, E., & Tagarelli, A. (2008). Mining categories for emails via clustering andpattern discovery. Journal of Intelligent Information Systems, 30(2), 153–181.
Manning, C. D., & Schütze, H. (2002). Foundations of statistical natural language processing(5th printing). Cambridge: MIT.
Orengo, V., & Huyck, C. (2001). A stemming algorithm for the portuguese language. In: Eighthsymposium on string processing and information retrieval (p. 186). Spire.
Prabowo, R., & Thelwall, M. (2006). A comparison of feature selection methods for anevolving RSS feed corpus. Journal of Information processing and management, 42, 1491–1512.
Prado, H. A., & Ferneda, E. (2008). Emerging technologies of text mining—techniques andapplications (1st ed., Vol. 1, p. 358). Hershey: Information Science Reference—IGIGlobal.
Punuru, J., & Chen, J. (2011). Learning non-taxonomical semantic relations from domaintexts. Journal of Intelligent Information Systems. Published online first, 20 January 2011.doi:10.1007/s10844-011-0149-4.
Rajpathak, D., Chougule, R., & Bandyopadhyay, P. (2011). A domain-specific decision supportsystem for knowledge discovery using association and text mining. Knowledge and InformationSystems, Published online first, 18 May 2011. doi:10.1007/s10115-011-0409-1.
Sarac, A. (2000). Daily operational aircraft maintenance routing problem. PhD Dissertation,University of Buffalo at New York, NY.
Sekhon, G. S., Rajpal, P. S., & Shishodia, K. S. (2006). An artificial neural network for modelingreliability, availability, and maintainability of a repairable system. Reliability Engineering andSystem Safety, 91(7), 809–819.
Shamsinejadbabki, P., & Saraee, M. (2011). A new unsupervised feature selection method for textclustering based on genetic algorithms. Journal of Intelligent Information Systems. Publishedonline first, 27 July 2011. doi:10.1007/s10844-011-0172-5.
Shankar, G., & Sahani, V. (2003). Reliability analysis of a maintenance network with repair andpreventive maintenance. International Journal of Quality & Reliability Management, 20(2), 268–280.
Shimazaki, K., & Kushida, T. (2010). A preliminary approach to creating an overview of lactoferrinmulti-functionality utilizing a text mining method. BioMetals, 23(3), 453–463.
Söderholm, P. (2005). A system view of the No Fault Found (NFF) phenomenon. Reliability Engi-neering and System Safety, 92, 1–14.
Song, Y. L., & Chen, S. S. (2009). Text mining biomedical literature for constructing gene regulatorynetworks Interdisciplinary Sciences. Computational Life Sciences, 1(3), 179–186.
Tan, S. (2008). An improved centroid classifier for text categorization. Expert Systems with Applica-tions, 35, 279–285.
Tremblay, M. C., Berndt, D. J., Luther, S. L., Foulis, P. R., & French, D. D. (2009). Identifyingfall-related injuries: Text mining the electronic medical record. Information Technology andManagement, 10(4), 253–265.
Tsay, R. (2005). Analysis of f inancial time series (2nd ed.). Wiley-Interscience.

J Intell Inf Syst
Wang, W. M., Cheung, C. F., Lee, W. B., & Kwok, S. K. (2008). Mining knowledge from natural lan-guage texts using fuzzy associated concept mapping. Information Processing and Management,44, 1707–1719.
Yang, Y., & Pedersen, J. (1997). A comparative study on feature selection in text categorization.In: Proceedings of ICML-97, 14th international conference on machine learning (pp. 412–420).
Yang, S., Wu, X., Deng, Z., Zhang, M., & Yang, D. (2002). Relative term-frequency based featureselection for text categorization. In: Proceedings of the f irst international conference on machinelearning and cybernetics (pp. 1432–1436). Beijing: IEEE.