aircraft noise information report template - airservices
TRANSCRIPT
Canberra Airport Aircraft Noise Information Report Quarter 1 2013 (January to March)
30 April 2013 Page 1

Version Control
Version Number Detail Prepared by Date
1 - Environment 30/04/2013
© Airservices Australia. All rights reserved.
This report contains a summary of data collected over the specified period and is intended to convey the best information available from the NFPMS at the time. The system databases are to some extent dependent upon external sources and errors may occur. All care is taken in preparation of the report but its complete accuracy can not be guaranteed. Airservices Australia does not accept any legal liability for any losses arising from reliance upon data in this report which may be found to be inaccurate.
30 April 2013 Page 2

Canberra - Aircraft Noise Information Report
Contents
1 PURPOSE 4
1.1 Canberra Airport 4
1.2 Aircraft noise monitoring at Canberra 4
2 FLIGHT PATTERNS 6
2.1 Jet aircraft 6
2.2 Non jet aircraft 8
2.3 Track density plots 9
3 AIRCRAFT MOVEMENTS 11
3.1 Airport movements 11
4 NOISE MONITORING 15
5 COMPLAINTS DATA 17
5.1 NCIS Clients by suburb 17
5.2 Issues raised by NCIS clients 19
6 CONTACT US 20
30 April 2013 Page 3

1 Purpose This report summarises data for Quarter 1 of 2013 (January to March) from Airservices’ Noise and Flight Path Monitoring System (NFPMS) and Noise Complaints and Information Service (NCIS) for the Canberra area (Canberra Airport).
1.1 Canberra Airport Canberra Airport is located 8km to the east of the city. There are no residential areas directly aligned with runways, though the suburb of Jerrabomberra is located around 10km to the south east of the airport. Operations at the airport are a mixture of jet aircraft and general aviation traffic. Australia's VIP fleet is based at Canberra, as well as several fixed-wing and helicopter flying schools. During Quarter 1 of 2013 there were approximately 13,000 aircraft movements at Canberra Airport. More information about Canberra Airport is available from the Airservices website at www.airservicesaustralia.com/aircraftnoise/airport-information/. Other operations in the Canberra area may originate from hospital helipads or the Southcare Helicopter base and adjacent ACT Emergency Services Agency helipads (around 7km south of the airport).
1.2 Aircraft noise monitoring at Canberra Airservices NFPMS captures and stores radar, flight plan and noise data. The NFPMS covers eight city regions around Australia. For the Canberra region, noise data is captured by one noise monitor - also known as an Environmental Monitoring Unit (EMU) located at Jerrabomberra, 9km south of the airport.
30 April 2013 Page 4

Figure 1: Location of Canberra Airport. Runway orientation for airport is shown in the
insert. The noise monitoring site is shown as a red dot. Figure 1 shows runway configuration at Canberra Airport, which has two runways. The main runway 17/35 length 3283m is used for the majority of aircraft traffic. The shorter runway is 12/30 length 1679m and is used mainly by propeller aircraft. Information about runway selection is available on the Airservices website at www.airservicesaustralia.com/aircraftnoise/factsheets/.
30 April 2013 Page 5

2 Flight patterns A noise abatement area applies to most areas of Canberra and Queanbeyan. Aircraft will normally be routed to avoid the noise abatement area, which covers most of Gungahlin, North Canberra, Belconnen, South Canberra, Woden, Tuggeranong and Queanbeyan. Where it is not practical for aircraft to remain clear of those areas, overflight of the noise abatement area effectively restricts jet aircraft from flying below 5,000 feet (above ground level - AGL), and large propeller aircraft below 3,000 feet (AGL). A number of exceptions apply to the noise abatement areas such as aircraft emergencies, medical priorities and the avoidance of hazardous weather.
2.1 Jet aircraft Figure 2 and Figure 3 show jet aircraft track plots for arrivals and departures at Canberra Airport for one month of Quarter 1 of 2013 (February), coloured according to height (in feet) above the airport reference point. The noise monitor is shown as a grey circle.
Figure 2: Jet arrivals for the Canberra region, February 2013 (one month)
Note the altitude of Canberra Airport is 1,870 feet above mean sea level (AMSL). The key points shown by Figure 2 are:
Jet aircraft generally avoid overflying residential areas of Canberra below 5,000 feet (AGL).
30 April 2013 Page 6

The western part of Jerrabomberra (10 km south of the airport) is regularly overflown by arriving jet aircraft between 1,000 feet and 3,000 feet (AGL).
Figure 3 Jet departures for the Canberra region, February 2013 (one month)
Note the altitude of Canberra Airport is 1,870 feet above mean sea level (AMSL). The key points shown by Figure 3 are:
Departing jet aircraft departing off Runway 35 (to the north) and turning to the south overfly Canberra suburbs above 5,000 feet (AGL).
Jets departing to the south off Runway 17 turn to the west shortly after take-off.
30 April 2013 Page 7

2.2 Non jet aircraft Figure 4 shows non jet tracks (arrivals and departures) at Canberra Airport in one month of Quarter 1 of 2013 (February). The noise monitor is shown as a grey circle.
Figure 4 Non jet arrivals and departures for the Canberra region, February 2013 (one
month) Note the altitude of Canberra Airport is 1,870 feet above mean sea level (AMSL).
The key points shown by Figure 4 are:
Although jet aircraft tend to operate along defined paths, as shown in Figures 2 and 3, when smaller propeller movements are included on the map, there are no areas of Canberra that are not overflown by aircraft at some stage.
In Figure 4, aircraft overflying the suburbs of Canberra below 3,000 feet (AGL) are smaller general aviation aircraft. Larger propeller aircraft do not overfly Canberra suburbs below 3,000 feet (AGL).
30 April 2013 Page 8

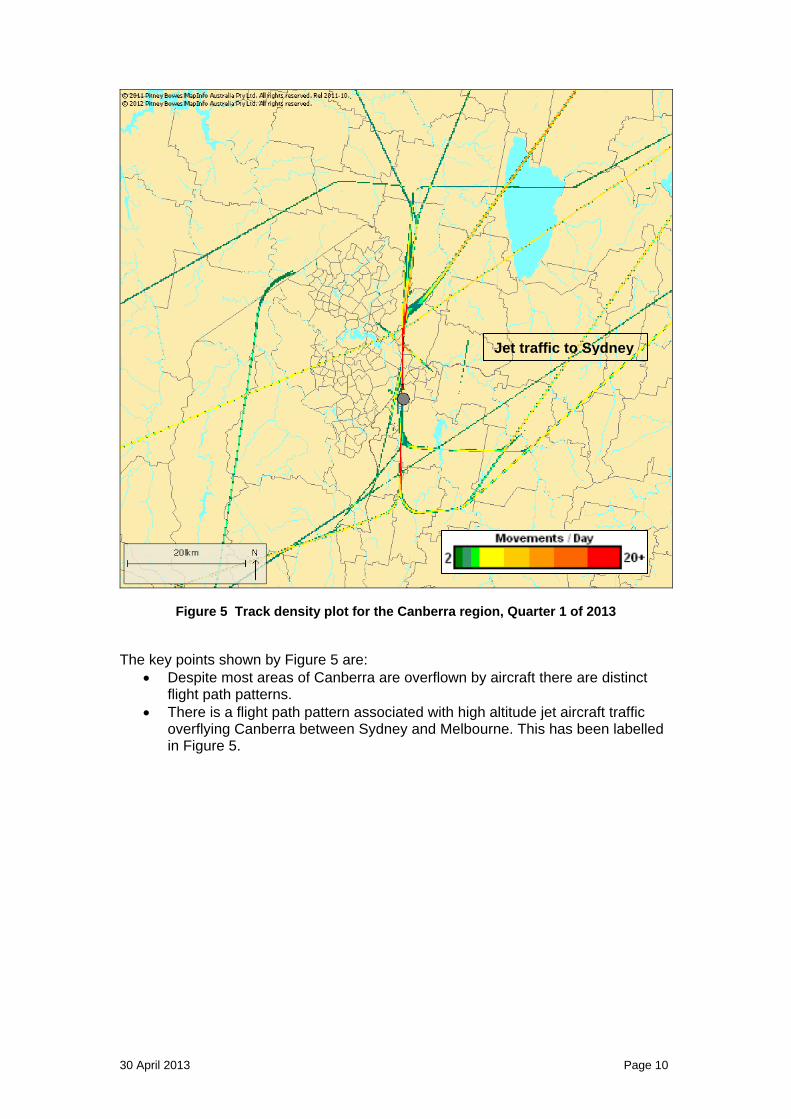
2.3 Track density plots The track plots in the preceding section show that areas up to 20km to the north and 20km to the south of Canberra Airport and in line with the airport’s runways are regularly overflown by jet aircraft below 3,000ft (AGL). However, beyond this the regularity of flight path use is not discernible from the track plot display. A track density plot can be useful in showing the underlying track patterns. A track density plot is a map which displays the pattern of aircraft flight tracks passing over the region around the airport. The region is divided into a set of small grid elements and the number of flights passing over each grid element is summed. Each grid element is coloured according to the number of overflights. Figure 5 shows a track density plot for all movements over the Canberra Airport for Quarter 1 of 2013. The grid size adopted is 200m x 200m. The colour coding from green to red represents the range 2 flight tracks per day to 20 (184 to 1840 flight track for the quarter). If any grid element is not colour coded, the number of aircraft flight tracks passing over that element during the quarter was less than 2 per day on average. The absence of a colour for a grid element does not mean the grid element is free of aircraft overflights. The grey circles show the location of each noise monitor (EMU).
30 April 2013 Page 9
Jet traffic to Sydney
Figure 5 Track density plot for the Canberra region, Quarter 1 of 2013
The key points shown by Figure 5 are:
Despite most areas of Canberra are overflown by aircraft there are distinct flight path patterns.
There is a flight path pattern associated with high altitude jet aircraft traffic overflying Canberra between Sydney and Melbourne. This has been labelled in Figure 5.
30 April 2013 Page 10
3 Aircraft movements
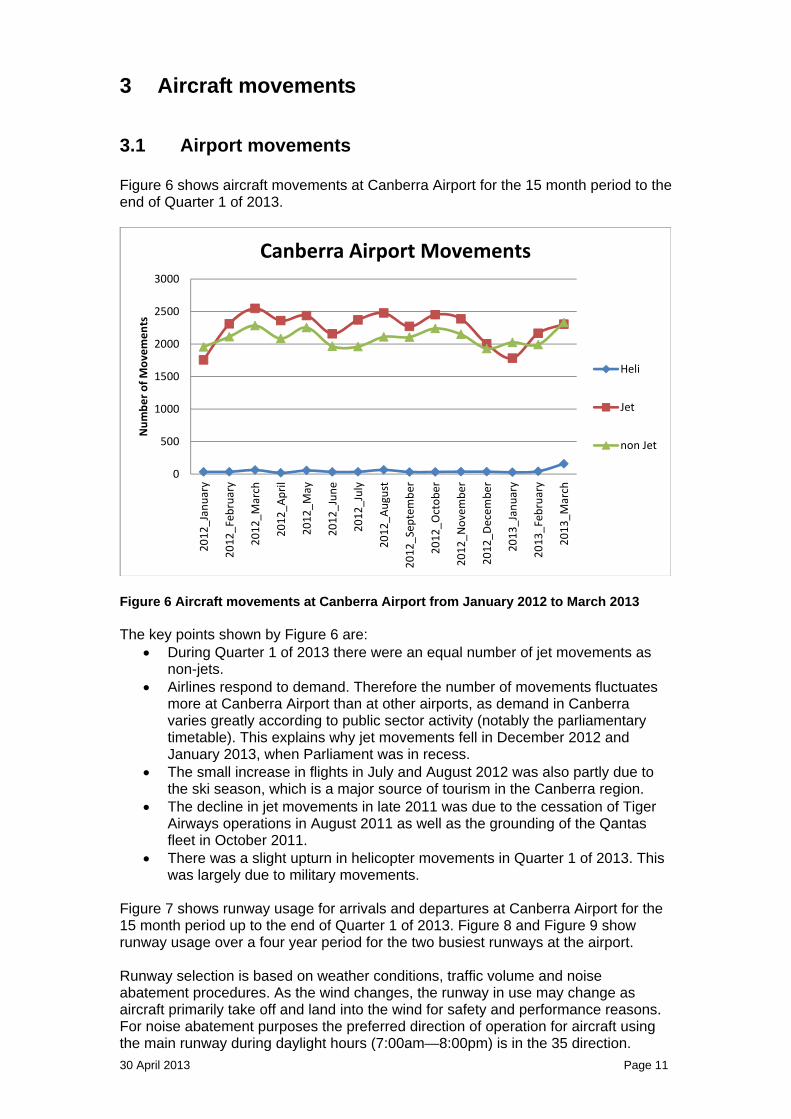
3.1 Airport movements Figure 6 shows aircraft movements at Canberra Airport for the 15 month period to the end of Quarter 1 of 2013.
0
500
1000
1500
2000
2500
3000
2012_Jan
uary
2012_February
2012_March
2012_April
2012_M
ay
2012_June
2012_July
2012_August
2012_September
2012_October
2012_November
2012_D
ecem
ber
2013_Jan
uary
2013_February
2013_March
Number of Movements
Canberra Airport Movements
Heli
Jet
non Jet
Figure 6 Aircraft movements at Canberra Airport from January 2012 to March 2013 The key points shown by Figure 6 are:
During Quarter 1 of 2013 there were an equal number of jet movements as non-jets.
Airlines respond to demand. Therefore the number of movements fluctuates more at Canberra Airport than at other airports, as demand in Canberra varies greatly according to public sector activity (notably the parliamentary timetable). This explains why jet movements fell in December 2012 and January 2013, when Parliament was in recess.
The small increase in flights in July and August 2012 was also partly due to the ski season, which is a major source of tourism in the Canberra region.
The decline in jet movements in late 2011 was due to the cessation of Tiger Airways operations in August 2011 as well as the grounding of the Qantas fleet in October 2011.
There was a slight upturn in helicopter movements in Quarter 1 of 2013. This was largely due to military movements.
Figure 7 shows runway usage for arrivals and departures at Canberra Airport for the 15 month period up to the end of Quarter 1 of 2013. Figure 8 and Figure 9 show runway usage over a four year period for the two busiest runways at the airport. Runway selection is based on weather conditions, traffic volume and noise abatement procedures. As the wind changes, the runway in use may change as aircraft primarily take off and land into the wind for safety and performance reasons. For noise abatement purposes the preferred direction of operation for aircraft using the main runway during daylight hours (7:00am—8:00pm) is in the 35 direction.
30 April 2013 Page 11

0
500
1000
1500
2000
2500
3000
3500
4000
4500
2012_January
2012_Feb
ruary
2012_March
2012_April
2012_M
ay
2012_June
2012_July
2012_August
2012_September
2012_October
2012_November
2012_December
2013_January
2013_Feb
ruary
2013_March
Number of Movements
Canberra Airport Runway Usage
35
17
30
12
H
Figure 7 Runway usage at Canberra Airport to Quarter 1 of 2013
0
200
400
600
800
1000
1200
1400
1600
January
February
March
April
May
June
July
August
September
October
November
December
Number of Movements
Runway 17 Use 2010 ‐ Current
2010
2011
2012
2013
Figure 8 Runway 17 usage at Canberra Airport 2010 to 2013
30 April 2013 Page 12
0
500
1000
1500
2000
2500
3000
3500
4000
4500
January
February
March
April
May
June
July
August
September
October
November
December
Number of Movements
Runway 35 Use 2010 ‐ Current
2010
2011
2012
2013
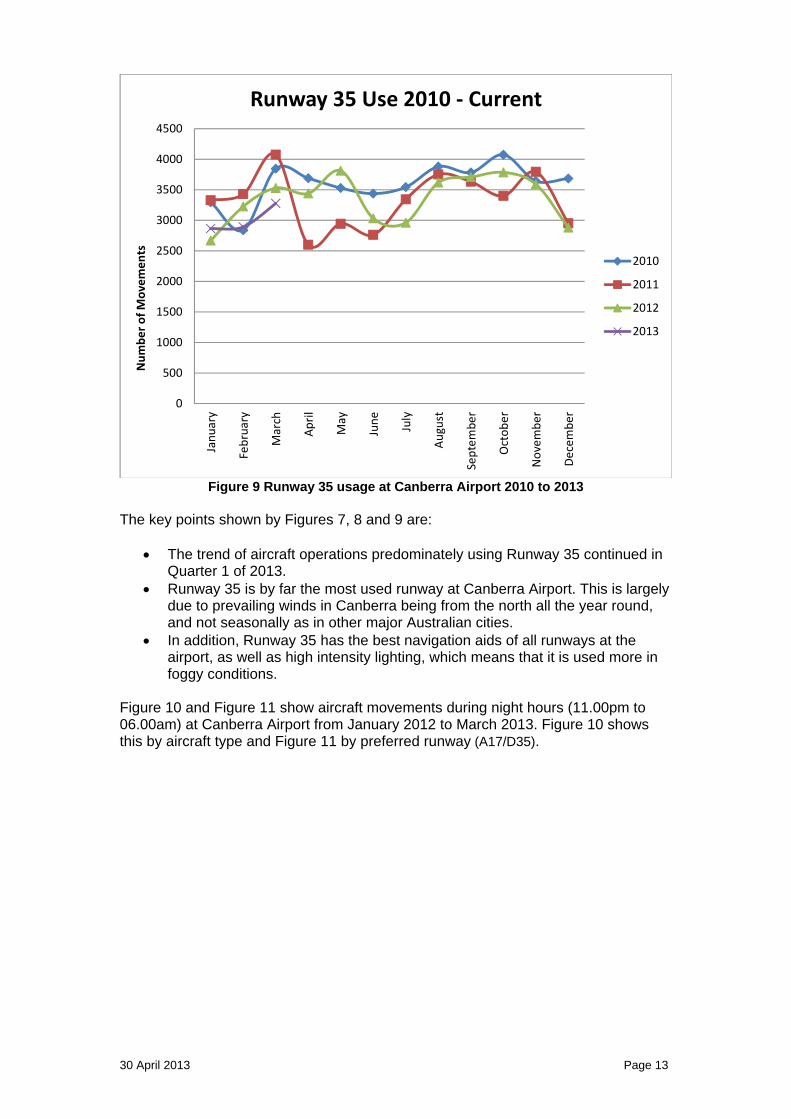
Figure 9 Runway 35 usage at Canberra Airport 2010 to 2013
The key points shown by Figures 7, 8 and 9 are:
The trend of aircraft operations predominately using Runway 35 continued in Quarter 1 of 2013.
Runway 35 is by far the most used runway at Canberra Airport. This is largely due to prevailing winds in Canberra being from the north all the year round, and not seasonally as in other major Australian cities.
In addition, Runway 35 has the best navigation aids of all runways at the airport, as well as high intensity lighting, which means that it is used more in foggy conditions.
Figure 10 and Figure 11 show aircraft movements during night hours (11.00pm to 06.00am) at Canberra Airport from January 2012 to March 2013. Figure 10 shows this by aircraft type and Figure 11 by preferred runway (A17/D35).
30 April 2013 Page 13

0
10
20
30
40
50
60
70
80
2012_January
2012_February
2012_M
arch
2012_A
pril
2012_May
2012_June
2012_July
2012_August
2012_September
2012_October
2012_November
2012_December
2013_January
2013_February
2013_M
arch
Number of Movements
Canberra Night Movements
Jet
non‐Jet
Heli
Figure 10 Night movements (11.00pm to 6.00am) at Canberra Airport January 2012 to
March 2013 by aircraft category
0
10
20
30
40
50
60
70
2012_January
2012_February
2012_March
2012_April
2012_May
2012_June
2012_July
2012_August
2012_September
2012_October
2012_November
2012_December
2013_January
2013_February
2013_March
Number of Movemen
ts
Canberra Airport Night Movements
Other
A17 / D35
Figure 11 Night movements (11.00pm to 6.00am) at Canberra Airport January 2012 to
March 2013 by preferred runway (A17/D35) The key points shown by Figure 10 and Figure 11 are:
Although the total number of night movements has not increased during Quarter 4 of 2012 and Quarter 1 of 2013 there has been a steady increase in the number of jets (and a corresponding decrease in the number of non-jets) operating. This is partly due to a change in the freight industry, which is seeing more freight moved by road.
Night jet movements are seasonal, with more movements in summer months. This is partly due to the fact that in summer, ACT has daylight saving
30 April 2013 Page 14

whereas Queensland does not. Therefore, in summer more late evening departures from Queensland will arrive at Canberra after 11.00pm.
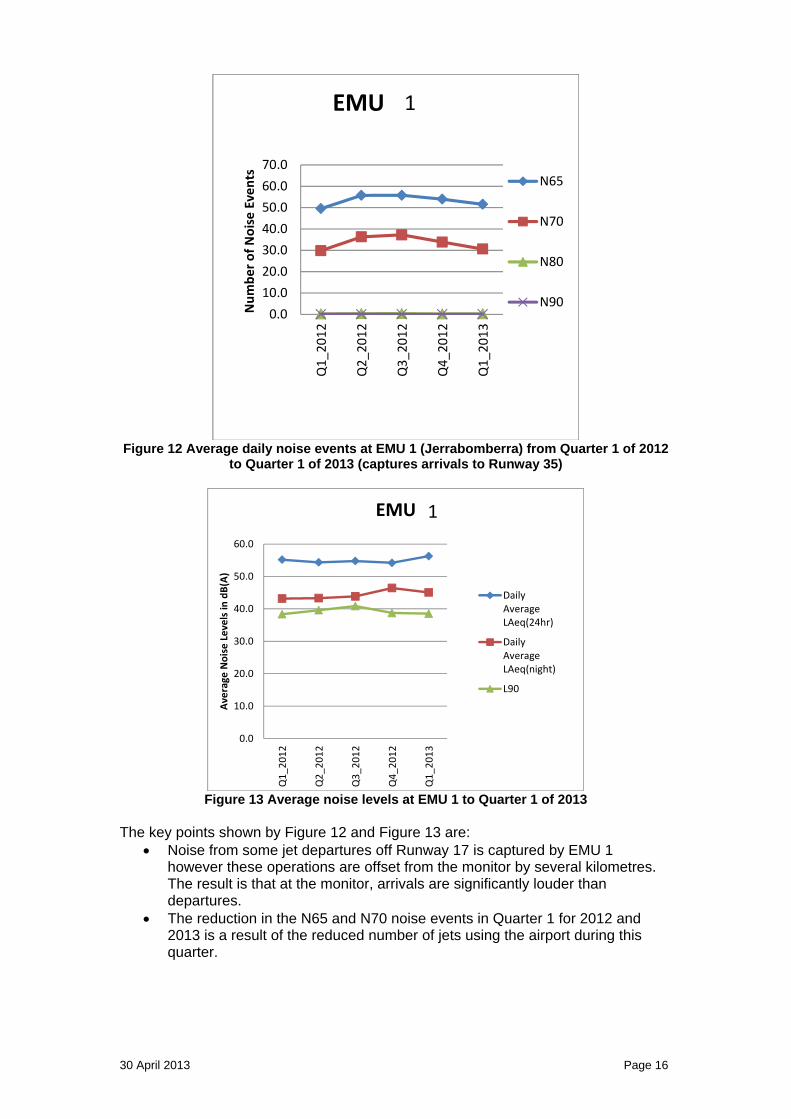
4 Noise monitoring Airservices collects noise and operational data from noise monitors (EMUs) around Canberra Airport. This data can be expressed in a number of ways, to show average noise during a period, background noise levels and number of noise ‘events’ over a certain threshold. Sound is measured on a logarithmic scale with the decibel (dB(A)) as the unit of measure. The sound level of typical daytime urban-based activities can vary between 40dB(A) and 80dB(A). The sound levels in a nightclub often exceed 90dB(A). Figure 12 and Figure 13 show data from the Canberra EMU for the last fifteen months (see Figure 1 for the location of EMU). The terms used within each of these figures are: LAeq 24hr: The continuous equivalent noise level over a 24 hour period, including noise from aircraft and the wider environment. LAeq night: The continuous equivalent noise level over the night time period (hours of 11:00pm to 6:00am) Background L90dB(A) (L90): The sound level that is exceeded 90% of the time over a 24 hour period – effectively removing noise from instantaneous events such as passing aircraft to provide a background level. N65: The average number of daily noise events caused by aircraft that are over 65dB(A). Figures for N70, N80 and N90 are also provided.
30 April 2013 Page 15
0.0
10.0
20.0
30.0
40.0
50.0
60.0
70.0
Q1_2012
Q2_2012
Q3_2012
Q4_2012
Q1_2013
Number of Noise Events
EMU
N65
N70
N80
N90
1
Figure 12 Average daily noise events at EMU 1 (Jerrabomberra) from Quarter 1 of 2012
to Quarter 1 of 2013 (captures arrivals to Runway 35)
0.0
10.0
20.0
30.0
40.0
50.0
60.0
Q1_2012
Q2_2012
Q3_2012
Q4_2012
Q1_2013
Average Noise Levels in
dB(A)
EMU
DailyAverageLAeq(24hr)
DailyAverageLAeq(night)
L90
1
Figure 13 Average noise levels at EMU 1 to Quarter 1 of 2013
The key points shown by Figure 12 and Figure 13 are:
Noise from some jet departures off Runway 17 is captured by EMU 1 however these operations are offset from the monitor by several kilometres. The result is that at the monitor, arrivals are significantly louder than departures.
The reduction in the N65 and N70 noise events in Quarter 1 for 2012 and 2013 is a result of the reduced number of jets using the airport during this quarter.
30 April 2013 Page 16

5 Complaints data Airservices manages complaints and enquiries about aircraft noise and operations through its Noise Complaints and Information Service (NCIS). Complaints, enquiries and requests for information about aircraft operations received by the NCIS are collected and stored in a database for the purpose of complaint management, analysis of issues and identification of causal factors. Each complaint, enquiry or request for information is referred to as a contact and each person who makes contact with the NCIS is referred to as a client.
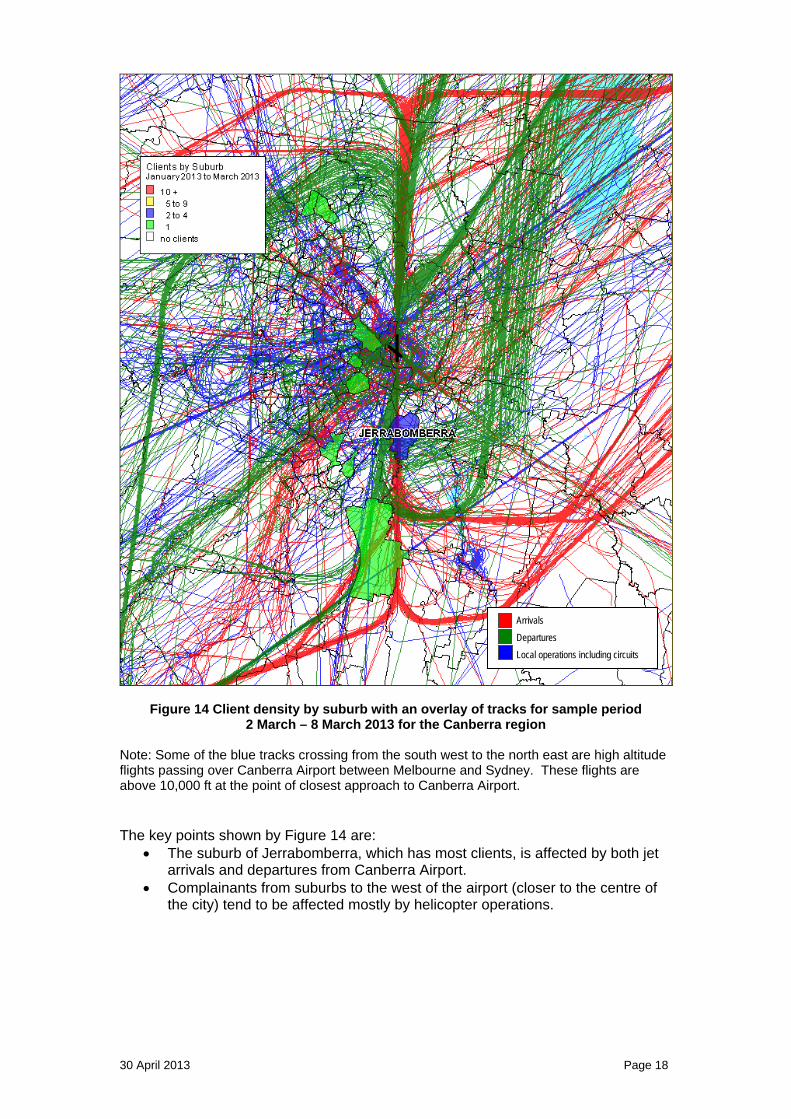
5.1 NCIS Clients by suburb The NCIS received contacts from 11 clients for Canberra Airport during Quarter 1 of 2013. Client density maps are used to show the number of clients from each suburb, with suburbs coloured according to how many clients had contacted the NCIS. The data does not include clients who contacted other organisations (eg. airports). Table 1 provides a breakdown of clients from January to March 2013. Figure 14 shows client density with sample flight tracks overlaid for Canberra Airport for Quarter 1 of 2013.
Table 1 Recorded Clients January to March 2013
Suburb Clients Not Specified 1
Campbell 1
Casey 1
Fadden 1
Gilmore 1
Kingston 1
Narrabundah 1
Ngunnawal 1
Royalla 1
Jerrabomberra 2
TOTAL 11 Table 1 shows that the only suburb with more than one client in Quarter 1 of 2013 was Jerrabomberra.
30 April 2013 Page 17
Arrivals
Departures
Local operations including circuits
Figure 14 Client density by suburb with an overlay of tracks for sample period
2 March – 8 March 2013 for the Canberra region
Note: Some of the blue tracks crossing from the south west to the north east are high altitude flights passing over Canberra Airport between Melbourne and Sydney. These flights are above 10,000 ft at the point of closest approach to Canberra Airport.
The key points shown by Figure 14 are: The suburb of Jerrabomberra, which has most clients, is affected by both jet
arrivals and departures from Canberra Airport. Complainants from suburbs to the west of the airport (closer to the centre of
the city) tend to be affected mostly by helicopter operations.
30 April 2013 Page 18

5.2 Issues raised by NCIS clients Figure 15 shows the top five issues raised by clients for Canberra Airport for the 15 month period to the end of Quarter 1 of 2013. A single contact can involve multiple issues (ie. a complainant may have raised more than one issue when they contacted the NCIS). During the 15 month period the issues raised by the greatest number of clients were: Aircraft Height, Flight Paths / Diversions, Helicopter, Jet Aircraft, Runway 35 Arrivals.
0
2
4
6
8
10
12
14
Jan‐12
Feb‐12
Mar‐12
Apr‐12
May‐12
Jun‐12
Jul‐12
Aug‐12
Sep‐12
Oct‐12
Nov‐12
Dec‐12
Jan‐13
Feb‐13
Mar‐13
15 Month Trend ‐ Top 5 Issues
AIRCRAFT HEIGHT FLIGHT PATHS / DIVERSIONS HELICOPTER JET AIRCRAFT RUNWAY 35 ARR
FLIGHT PATHS / DIVERSIONS
AIRCRAFT HEIGHT HELICOPTER
Figure 15 Top five issues for Canberra Airport for the 15 month period, January 2012 to
March 2013 The key points shown by Figure 15 are:
Since July 2012 the number of complainants raising the top 5 issues of concerns has tended to tack at around 2-4 clients per month.
The increase in client numbers in February and March 2012 could be due to people noticing aircraft noise more after the slump in aircraft movements in December 2011 and January 2012.
In addition, Canberra is prone to thunderstorms in late summer, which means that at this time aircraft are often required to fly over areas where residents are unaccustomed to aircraft noise. The issues capturing these activities would most likely be Aircraft Height and Flight Path Diversions.
There was a significant increase in clients raising the issue of helicopter movements in May and June 2012. Most of the movements that were the subject of complaints were emergency service flights or flights made by the military.
30 April 2013 Page 19

30 April 2013 Page 20
6 Contact us
To lodge a complaint or make an enquiry about aircraft operations, you can:
go to WebTrak (www.airservicesaustralia.com/aircraftnoise/webtrak/) use our online form (www.airservicesaustralia.com/aircraftnoise/about-
making-a-complaint/) telephone 1800 802 584 (freecall) or 1300 302 240 (local call –Sydney) fax (02) 9556 6641 or write to, Noise Complaints and Information Service, PO Box 211, Mascot
NSW 1460. Airservices welcomes comments about this report. Please contact us via e-mail at [email protected] if you would like to provide feedback.