airline insurance market update - raaks.ru · note: excludes general aviation losses which can also...
TRANSCRIPT
AIRLINE INSURANCE MARKET UPDATE 2017

2
GLOBAL AIRLINE HULL & LIABILITY PREMIUM AND CLAIMS
Source: JLT Aerospace Market Intelligence Database as at 12/01/2017
Notes: Based on London Prices. Claims on a calendar year basis. Claims figures based on reported losses and reserves plus a pro-rata attritional estimate. Excludes War risks.

3
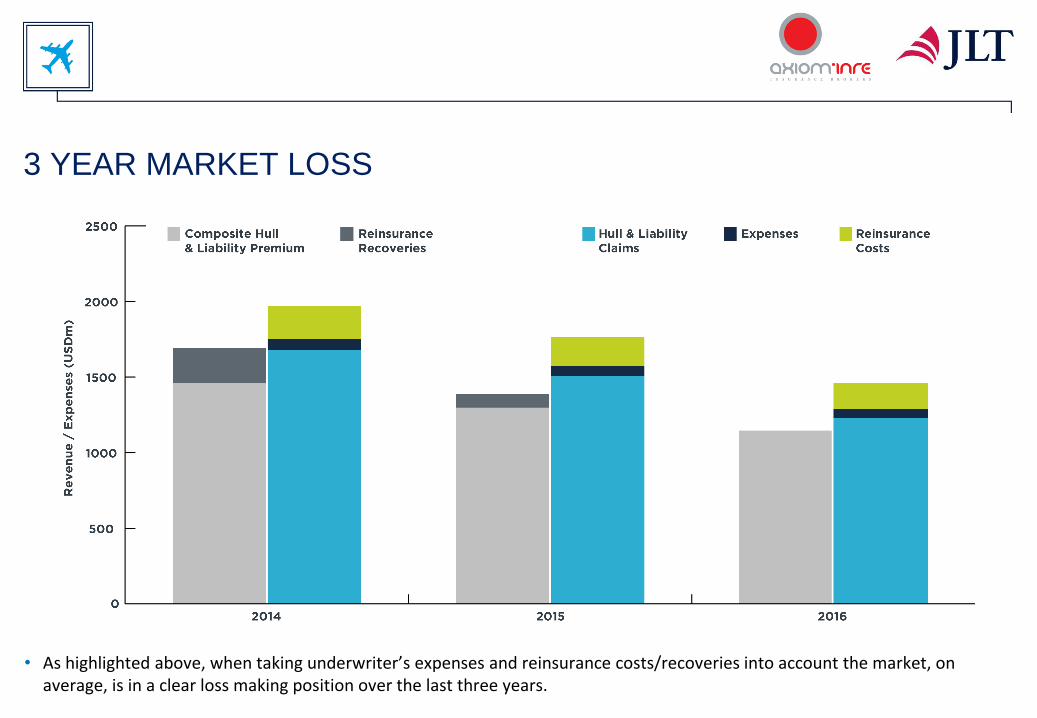
3 YEAR MARKET LOSS
• As highlighted above, when taking underwriter’s expenses and reinsurance costs/recoveries into account the market, on average, is in a clear loss making position over the last three years.

5

6
2016 MAJOR AIRLINE LOSSES HULL & LIABILITY (>US$10M) & ALL KNOWN AIRLINE HULL WAR LOSSES
Note: Excludes General Aviation losses which can also be significant.
Source: JLT Aerospace Market Intelligence Database as at 01/01/2017.
Loss Date Operator Aircraft Type Hull All Risks Passenger & Third
Party Excess AV52 Total Hull & Liabs Hull War Market Total
02-Feb-16 Daallo Airlines A321-111 - - - - $5,000,000 $5,000,000
24-Feb-16 Tara Air DHC6-400 $6,400,000 $5,000,000 - $11,400,000 - $11,400,000
04-Mar-16 Ethiopian Airlines B787-800 $11,000,000 - - $11,000,000 - $11,000,000
19-Mar-16 FlyDubai B737-8KN $40,825,000 $37,875,000 - $78,700,000 - $78,700,000
04-Apr-16 Batik Air B737-8GP $10,000,000 - - $10,000,000 - $10,000,000
04-Apr-16 TransNusa Aviation ATR42-600 $18,000,000 - - $18,000,000 - $18,000,000
28-Apr-16 TAME ERJ-190 $19,000,000 - - $19,000,000 - $19,000,000
19-May-16 Egyptair A320-232 $9,000,000 $85,000,000 - $94,000,000 $9,000,000 $103,000,000
06-Jun-16 UPS MD-11F $61,359,611 - - $61,359,611 - $61,359,611
07-Jun-16 Bangladesh Biman B777-300ER $22,000,000 - - $22,000,000 - $22,000,000
27-Jun-16 Singapore Airlines B777-300ER $21,000,000 - - $21,000,000 - $21,000,000
03-Aug-16 Emirates B777-300ER $96,354,432 - - $96,354,432 - $96,354,432
05-Aug-16 ASL Aviation Hungary B737-400 $10,500,000 - - $10,500,000 - $10,500,000
28-Aug-16 Asiana Airlines A330-323 $30,000,000 - - $30,000,000 - $30,000,000
24-Oct-16 Ethiopian Airlines DHC8 -Q400 $17,000,000 - - $17,000,000 - $17,000,000
28-Oct-16 American Airlines B767-300ER $41,000,000 - - $41,000,000 - $41,000,000
28-Oct-16 Federal Express MD-10-10F $22,000,000 - - $22,000,000 - $22,000,000
28-Nov-16 LaMia Bolivia Avro RJ-85 - $25,000,000 - $25,000,000 - $25,000,000
07-Dec-16 Pakistan Airlines (PIA) ATR42-500 $12,000,000 $10,500,000 - $22,500,000 - $22,500,000
25-Dec-16 Egyptair B737-800 $15,000,000 - - $15,000,000 - $15,000,000
27-Dec-16 Jet Airways B737-800 $21,000,000 - - $21,000,000 - $21,000,000
Total: $483,439,043 $163,375,000 $0 $644,064,043 $14,000,000 $658,064,043
TOTAL HULL/LIABILITY (Inc. Attritional Estimate): $1,244,064,043
TOTAL AIRLINE HULL WAR: $14,000,000
ESTIMATED OVERALL AIRLINE MARKET TOTAL: $1,258,064,043

7

8
MARKET TREND - A THREE-TIER MARKET
Tier Airline Type or Situation Market Sentiment Typical Rate Change /
Direction
A
• Airlines with low limits.
• Typically showing high fleet/traffic growth.
• Typically lower valued / smaller aircraft.
• Recovering from loss penalty
• Rate reductions available based on high exposure
growth.
• Surplus of capacity due to lower limits.
• Lower Probable Maximum Loss (PML).
B
• Airlines with higher limits.
• Typically showing low fleet/traffic growth.
• Typically mixed fleets with high value / large
aircraft.
• Recovering from loss penalty
• Generally flat renewals.
• Restricted capacity due to high-limits.
• Differentials between lead and following prices being
squeezed.
• Higher Probable Maximum Loss (PML)
C
• Airlines with major losses.
• Airlines with poor attritional loss records.
• Airlines with adverse loss ratios.
• Airlines with negative exposure changes.
• Facing rate increases / loss penalties.
• Capacity highly limited due to the loss factor.
• Typically losing insurers money over a two or three
year period.

2016 THREE-TIER MARKET RESULTS
9
Tier Year AFV Passenger
Numbers (m) Hull Rate
Passenger
Rate
Hull Premium
($m)
Liability
Premium ($m)
Total
Premium
Loss Ratio
at Renewal
As If Rate
Change
Tier A
2015 486,368 1,991 0.060% 0.21 290 411 701
2016 534,895 2,185 0.045% 0.16 243 352 595 30%
+10% +10% -24% -22% -16% -14% -15% -23%
Tier B
2015 385,782 1,306 0.039% 0.23 150 295 445
2016 401,086 1,338 0.034% 0.20 138 266 404 31%
+4% +2% -12% -12% -8% -10% -9% -12%
Tier C
2015 100,331 187 0.044% 0.25 44 48 92
2016 108,880 211 0.073% 0.27 80 57 136 182%
+9% +13% +67% +6% +81% +19% +49% +34%
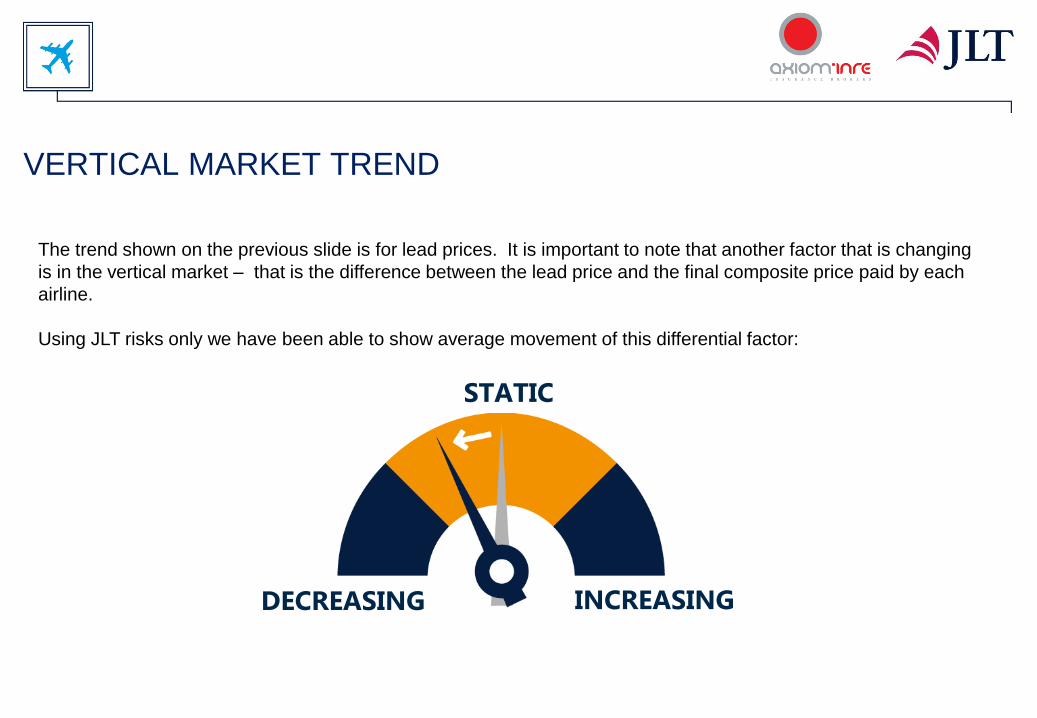
VERTICAL MARKET TREND
The trend shown on the previous slide is for lead prices. It is important to note that another factor that is changing
is in the vertical market – that is the difference between the lead price and the final composite price paid by each
airline.
Using JLT risks only we have been able to show average movement of this differential factor:
INCREASING DECREASING
STATIC

11
INTERNATIONAL MARKET CAPACITY - NON US AIRLINES
• Note, the line sizes illustrated are theoretical only and any capacity deployed by an underwriter is subject to their individual criteria. A number of factors including, price, loss record, geographical restrictions, sanctions, etc. will effect an underwriters line size and whether or not they choose to write an account.
Market Typical S&P Rating
ADNIC 1.00% A-
Africa Re 1.00% A-
AIG Europe 7.50% A+
Allianz (AGCS) 10.00% AA
Allied World Europe 1.50% A-
Altitude Risk Partners 5.00% A (Pool)
Antares 1.50% A+
Apollo Aviation 2.00% A+
Argo Syndicate 2.00% A-
ARK Syndicate 2.00% A+
Asia Capital Re 5.00% A-
Aspen 3.33% A
Atrium 2.00% A+
Aviabel 1.00% A-
AXA Corporate Solutions 2.50% A+
Axis Bermuda 1.00% A+
Beazley 6.67% A+
BRIT 5.00% A+
Cathedral 2.00% A+
Chaucer 3.00% A+
Chubb Insurance 10.00% AA-
Endurance Insurance 2.50% A+
Faraday 3.00% AA+
Fidelis Insurance 1.50% A-
Generali 0.75% A (AM Best)
GICI 2.00% A- (AM Best)
Market Typical S&P Rating
Global Aerospace (GAUM) 7.50% AA- (Pool)
HDI Gerling 1.50% A+
Hiscox 3.00% A+
Houston Casualty Co. (HCC) 3.33% AA-
Inter Hannover 3.00% A
KRIC 2.00% A-
La Reunion Aerienne 7.50% AA
Liberty Mutual 4.00% A+
Mapfre Global Risks 5.00% A
MS Amlin 5.00% A+
Munich Re 10.00% AA-
MSF Pritchard 3.00% A+
New India 2.00% A- (AM Best)
Oman Insurance Company 2.00% A
Partner Re 5.00% A
SCOR 2.00% AA-
Sirius 2.00% A-
Star Stone 3.00% A- (AM Best)
Starr Insurance 2.50% A+
Swiss Re 10.00% AA-
Talbot 7.50% A+
Tokio Marine Kiln 2.00% A+
Travelers Syndicate 2.50% A+
Trust Re 1.00% A-
W.R. Berkley 3.33% A+
XL Catlin 10.00% A
Market Typical S&P Rating
ADNIC 1.00% A-
Africa Re 1.00% A-
AIG Europe 7.50% A+
Allianz (AGCS) 10.00% AA
Allied World Europe 1.50% A-
Altitude Risk Partners 5.00% A (Pool)
Antares 1.50% A+
Apollo Aviation 2.00% A+
Argo Syndicate 2.00% A-
ARK Syndicate 2.00% A+
Asia Capital Re 5.00% A-
Aspen 3.33% A
Atrium 2.00% A+
Aviabel 1.00% A-
AXA Corporate Solutions 2.50% A+
Axis Bermuda 1.00% A+
Beazley 6.67% A+
BRIT 5.00% A+
Cathedral 2.00% A+
Chaucer 3.00% A+
Chubb Insurance 10.00% AA-
Endurance Insurance 2.50% A+
Faraday 3.00% AA+
Fidelis Insurance 1.50% A-
Generali 0.75% A (AM Best)
GICI 2.00% A- (AM Best)
Market Typical S&P Rating
Global Aerospace (GAUM) 7.50% AA- (Pool)
HDI Gerling 1.50% A+
Hiscox 3.00% A+
Houston Casualty Co. (HCC) 3.33% AA-
Inter Hannover 3.00% A
KRIC 2.00% A-
La Reunion Aerienne 7.50% AA
Liberty Mutual 4.00% A+
Mapfre Global Risks 5.00% A
MS Amlin 5.00% A+
Munich Re 10.00% AA-
MSF Pritchard 3.00% A+
New India 2.00% A- (AM Best)
Oman Insurance Company 2.00% A
Partner Re 5.00% A
SCOR 2.00% AA-
Sirius 2.00% A-
Star Stone 3.00% A- (AM Best)
Starr Insurance 2.50% A+
Swiss Re 10.00% AA-
Talbot 7.50% A+
Tokio Marine Kiln 2.00% A+
Travelers Syndicate 2.50% A+
Trust Re 1.00% A-
W.R. Berkley 3.33% A+
XL Catlin 10.00% A
Market Typical S&P Rating
Global Aerospace (GAUM) 7.50% AA- (Pool)
HDI Gerling 1.50% A+
Hiscox 3.00% A+
Houston Casualty Co. (HCC) 3.33% AA-
Inter Hannover 3.00% A
KRIC 2.00% A-
La Reunion Aerienne 7.50% AA
Liberty Mutual 4.00% A+
Mapfre Global Risks 5.00% A
MS Amlin 5.00% A+
Munich Re 10.00% AA-
MSF Pritchard 3.00% A+
New India 2.00% A- (AM Best)
Oman Insurance Company 2.00% A
Partner Re 5.00% A
SCOR 2.00% AA-
Sirius 2.00% A-
Star Stone 3.00% A- (AM Best)
Starr Insurance 2.50% A+
Swiss Re 10.00% AA-
Talbot 7.50% A+
Tokio Marine Kiln 2.00% A+
Travelers Syndicate 2.50% A+
Trust Re 1.00% A-
W.R. Berkley 3.33% A+
XL Catlin 10.00% A
• Future: Starr Insurance increasing line to 10% and Elseco entering the market
• Based upon a liability limit of USD1.25bn we estimate the total ‘A’ rated capacity theoretically available for a non-US airline with healthy exposure growth and a good loss record to be in the region of 186%
• Capacity is reducing, previously in 2016 this was showing 212%. The markets highlighted in BLUE have reduced their typical line size and those in RED have withdrawn or are generally not utilising their airline capacity.
12
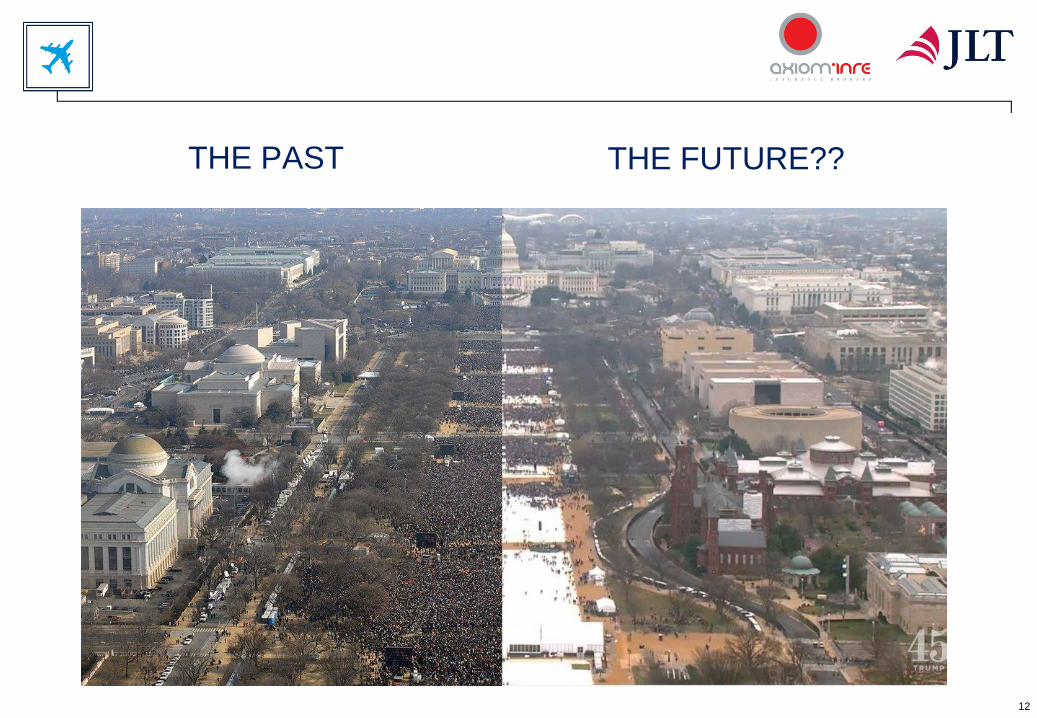
THE PAST THE FUTURE??

• Market conditions are showing early signs of hardening and a shift in favour of the underwriter
• Premium and rates have been on a downwards trend for many years and largely this was facilitated by a number of profitable years for airline underwriters. The last three years however have seen the reverse with the class overall losing money on a pure revenue versus expense basis across the portfolio in its entirety
• With this in mind underwriters are now seemingly more determined than ever to bring about a change in conditions and as such they are expected to increase their efforts in 2017
• The market has moved away from a one-size-fits-all approach to reductions to a far more diversified and less predicable market with a strong emphasis on risk differentiation
• Whilst market conditions still favour many buyers, it is evident that the level of rate reductions has slowed
• Underwriters are pushing hard to increase premiums especially on loss making or inadequately priced accounts
• The opportunity of an upward movement in rates now outweighs the likelihood for significant reductions
13
HULL & LIABILITY - MARKET CONDITIONS

14
GLOBAL AIRLINE HULL WAR PREMIUM & CLAIMS
Source: JLT. Excludes General Aviation losses which can also be significant.
3 Year Average Premium = $106 million 3 Year Average Claims = $239 million

• We have observed a significant reduction in capacity during the past 12 months with a number of markets (Aegis, Arch, Ark, Argo, Ascot, Channel and Hardy) having all withdrawn from writing Hull War risks as they deem the business unprofitable
• In addition, other markets are also reportedly reviewing their future participation and are seriously considering their exit from the class
• Whilst theoretically capacity levels still remain relatively high with around 26 markets presently able to write the business, the Hull War class has become extremely segmented with underwriters now increasingly selective in their participation
• A handful of the active markets have cut their line sizes dramatically in recent months and some now refuse the vast majority of risks presented to them and so the actual capacity available is now often very limited
• Underwriters are actively limiting their exposure on those accounts which are subject to large aggregate limits, high hull values and or operating in higher geographical risk areas
• Capacity levels are extremely fragile and a continuation of losses could have a significant negative impact
15
AIRLINE HULL WAR INSURANCE - CAPACITY

• We have reached a point where reductions on certain risks are no longer considered viable and largely underwriters are now looking for ‘as before’ renewals
• In general leading Hull War insurers will only consider a technical rate reduction if the airline is showing a reasonable growth in its exposures and thus can still maintain the level of premium despite the rate reduction
• The market still remains somewhat flexible on pricing and negotiations for accounts with low-limits, exposure growth and/or good loss records
• However on the other hand it has now adopted a harder stance to those placements with existing low premium levels, who have adverse loss records or have a materially higher than average war risk profile
• An increased loss frequency appears to have put aviation back on the ‘higher risk’ platform and with this in mind and a modest premium base that leaves little to cover even one major catastrophic loss, Hull War underwriters will likely be reluctant to change their current view
• We therefore expect that the current conditions and pricing discipline will be maintained for some time 16
AIRLINE HULL WAR INSURANCE - MARKET CONDITIONS

• This sector of the market remains claims free since it's formation in 2001 following 9/11
• Consequently capacity has steadily buoyed year on year and more risk is being absorbed into the All Risks programmes (sub limits of up to USD500 million are now not uncommon)
• This has led to aggressive competition and consequent significant premium reduction in the sector over the past few years
• Premium was around USD750m in 2001 compared to approximately USD80m in 2016
• It would not appear that there is any reason to support an increase in rates or premiums and as such we anticipate a period of stability for this sector
17
EXCESS AVN52E INSURANCE MARKET

• Always on 100% basis - no quota share
• Capacity levels are significantly high and create considerable competition
• 11 markets now quoting Hull Deductible business - Faraday and ANV are the latest new entrants
• Number of markets regularly offering competitive package deals with main placement participation
• Pricing is claims sensitive and usually five year average claims will determine premium level
• Despite being loss driven, Insurers readily compete against each other for the profitable business
• Underwriters regularly seek to cement longer term contracts or incorporating profit related returns in exchange for continuity
• We do not envisage this market changing from its current position in the near future
18
HULL DEDUCTIBLE INSURANCE MARKET

Based on early indications and current market sentiment, we believe that 2017 will generally witness:
– A resistance for any further significant rating reductions
– A push to increase premiums
– Selection against airlines with a negative premium/claims balance and/or frequency of loss
– Lead underwriters pricing becoming a less important benchmark for followers who may be more inclined to try to command their own pricing for their capacity
– Less hunger for market share and a reduction in competitive capacity
– A lack of appetite for competitively priced long-term or early renewal deals
Notwithstanding the above, underwriters will be mindful that new or dormant capacity may emerge if fortunes look to turn and therefore we believe that this factor should keep a check on any overzealous opportunism and lead underwriters to adopt a sensible and measured approach.
More than ever, very carefully managed strategies, and the strength and experience of the broker will be critical to achieving a positive renewal.
19
WHAT CAN WE EXPECT IN 2017

20
Note: Excludes General Aviation losses which can also be significant.
Source: JLT Aerospace Market Intelligence Database as at 20/02/2017.
Loss Date Operator Aircraft Type Hull All Risks Passenger & Third
Party Excess AV52 Total Hull & Liabs Hull War Market Total
01-Jan-17 Thai Airways Engine $25,000,000 - - $25,000,000 - $25,000,000
03-Jan-17 Aeroflot Airlines A321-211 $30,180,000 - - $30,180,000 - $30,180,000
16-Jan-17 ACT Airlines B747-412F $38,000,000 $7,500,000 - $45,500,000 - $45,500,000
Total: $93,180,000 $7,500,000 $0 $100,680,000 $0 $100,680,000
TOTAL HULL/LIABILITY (Inc. Attritional Estimate): $200,680,000
TOTAL AIRLINE HULL WAR: $0
ESTIMATED OVERALL AIRLINE MARKET TOTAL: $200,680,000
2017 YTD MAJOR AIRLINE LOSSES HULL & LIABILITY (>US$10M) & ALL KNOWN AIRLINE HULL WAR LOSSES

• The market finds itself at a potentially pivotal moment in its cycle, where due to a collective number of factors, conditions are showing early signs of hardening and a shift in favour of the underwriter
• Whilst many will recall previous predictions of change that never materialised, there is a growing sense that this time it could be the real thing. A key market driver behind this is capacity, which during the past 12 months has contracted significantly for many airline risks, be it through withdrawals, reduced lines or increased selectivity. Revenue growth appears to have taken second place to profitability and underwriters now appear to be placing increased emphasis on margin as opposed to premium volume, taking the disciplined view of reducing their exposure to loss making or inadequately priced accounts
• In terms of airline safety 2016 was another exceptional year, however whilst this is important for the industry as a whole, when looking at the year-end claims position versus an annual premium that has reduced to its lowest figure since 1999, it actually doesn’t correlate to a good loss experience for underwriters and as such many will have suffered a third consecutive loss making year
• With recent renewal evidence supporting a change in conditions, underwriters will not want to start 2017 by losing their resolve and as such the early renewals in Q1 could prove challenging as underwriters test the water with what is possible. As such, the stage is set for a challenging market in 2017
21
MARKET SUMMARY

22
HAS THE MARKET REACHED THE BOTTOM?